

 The property market weekly report for the week ending Sunday, 18th February 2024 (Week 7 ‘24), presents a continued robust picture of the UK housing market with house prices and transactions levels looking good, despite the doom mongers predictions last year.
In the show, host Chris Watkin and this week’s special guest Kristian Stott talk about the British property market.
Headlines
+ UK House Prices on Sale Agreed homes in MTD February £339/sq.ft (Jan ’24 £331sq.ft)
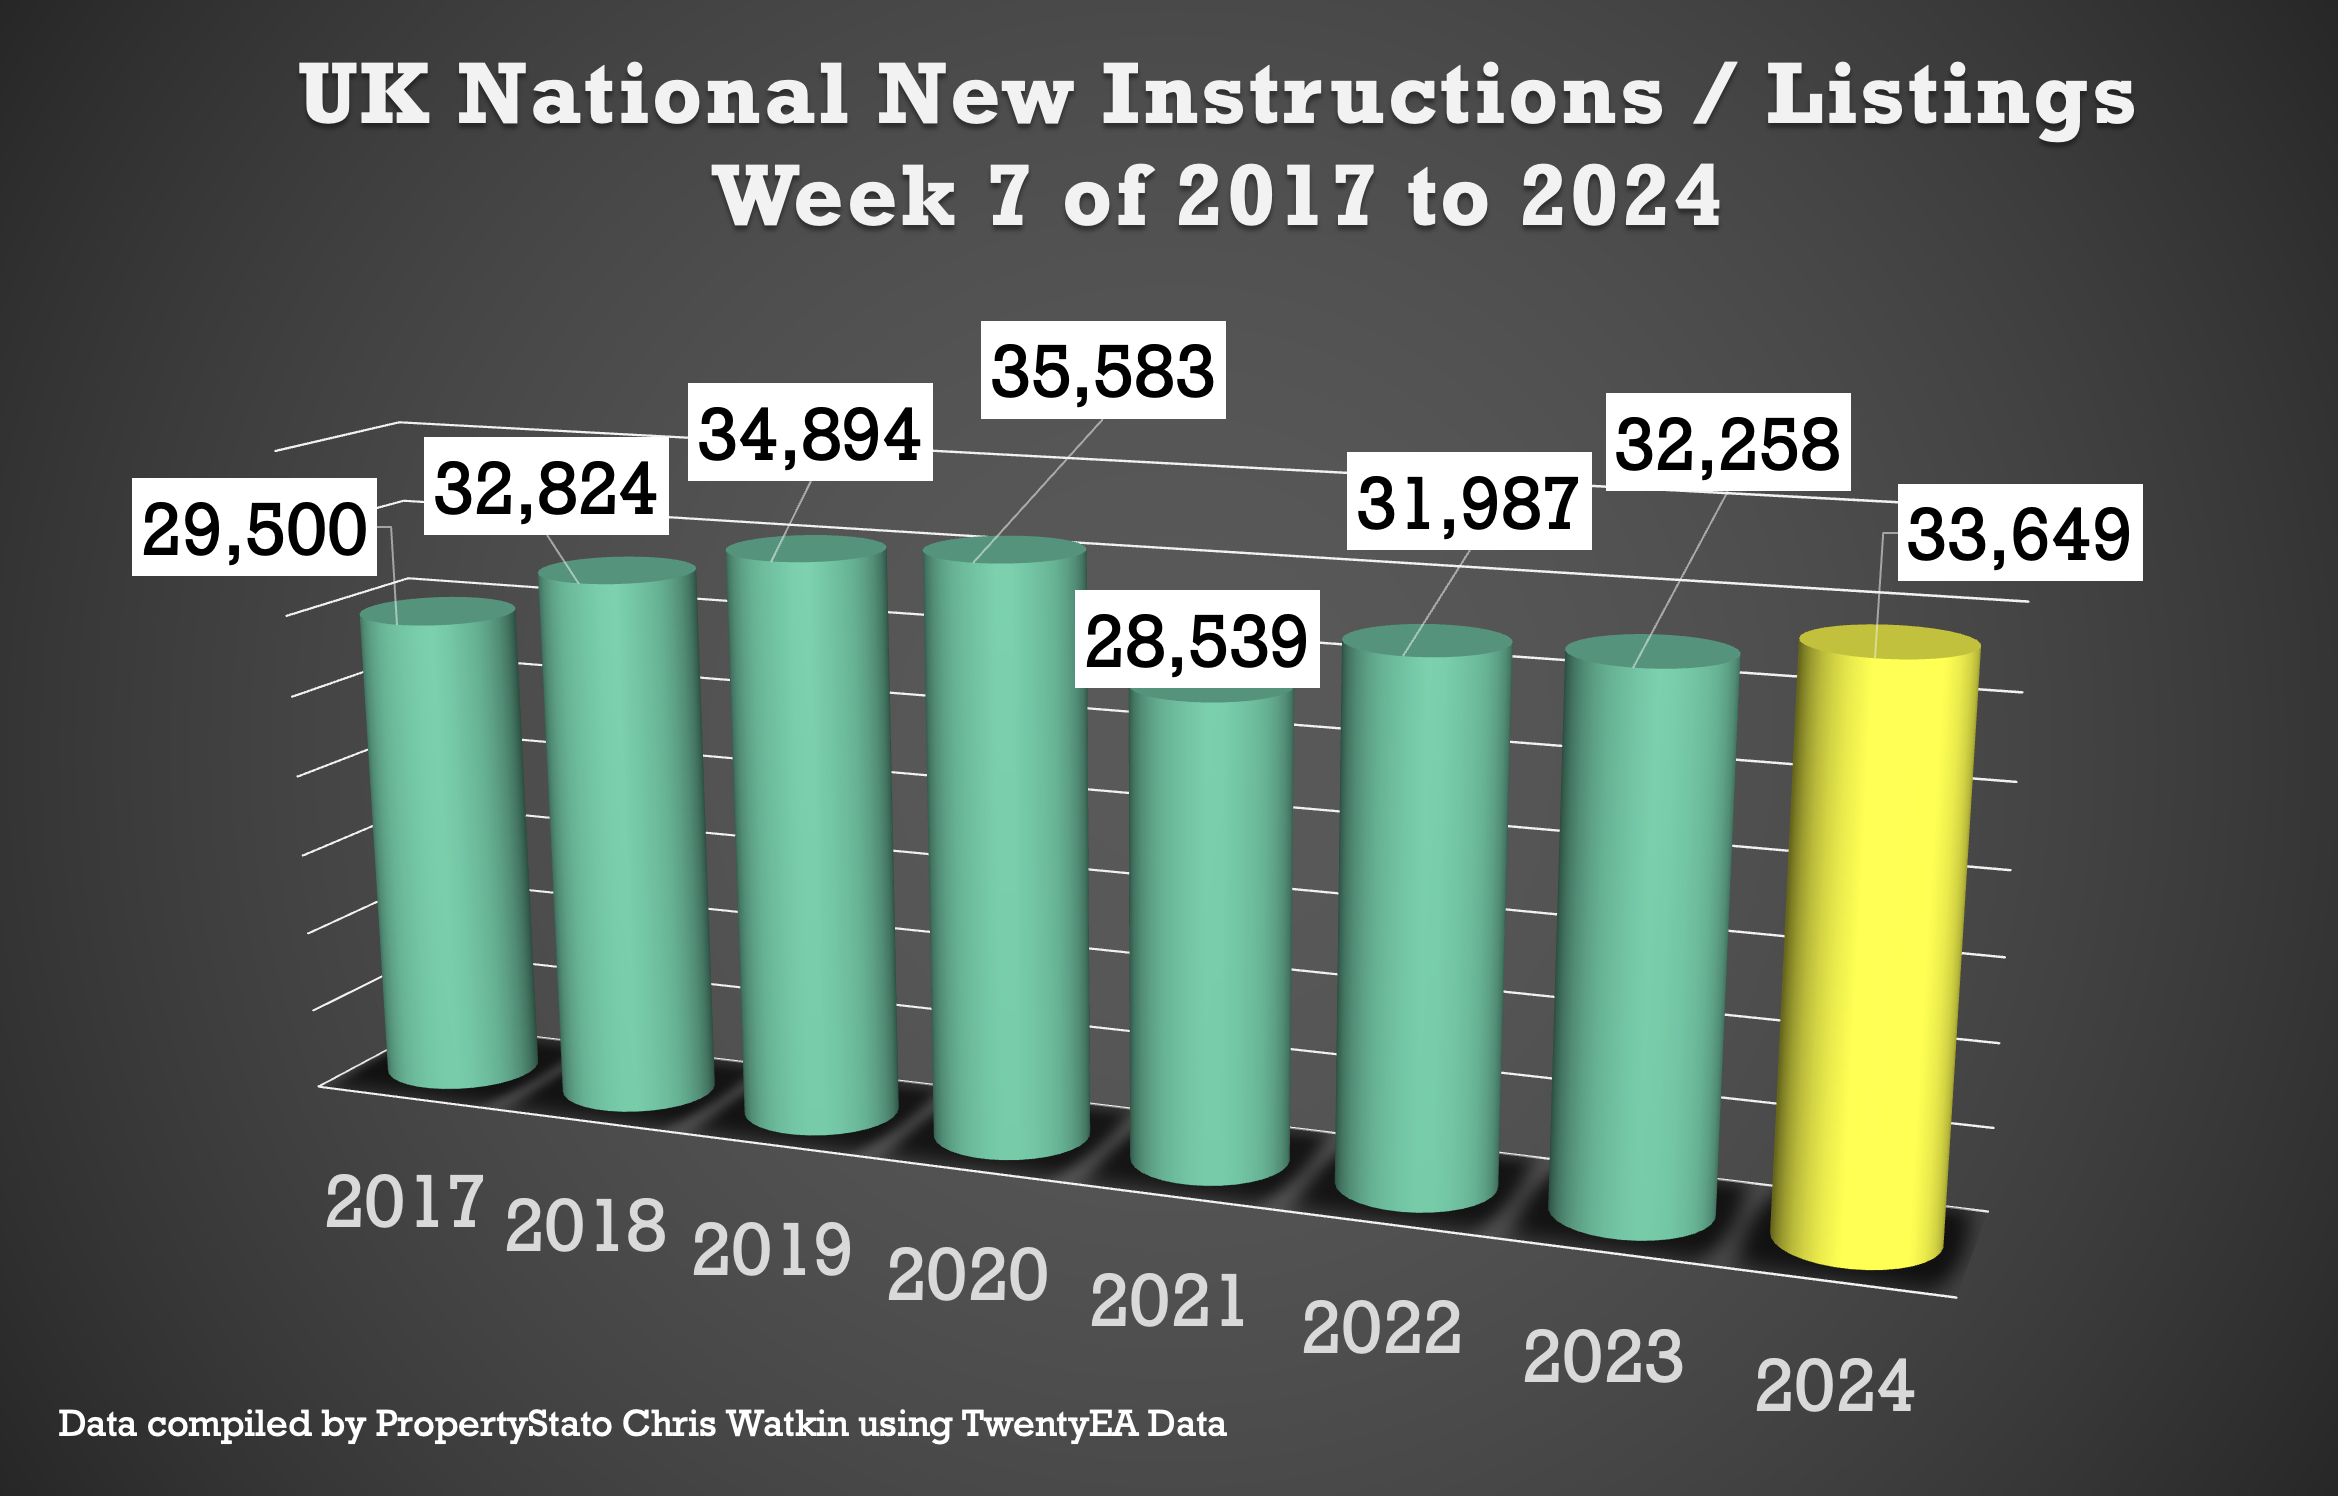
+ Listings for last week (Week 7) are 4% higher than wk 7 average (2017 to 2024).
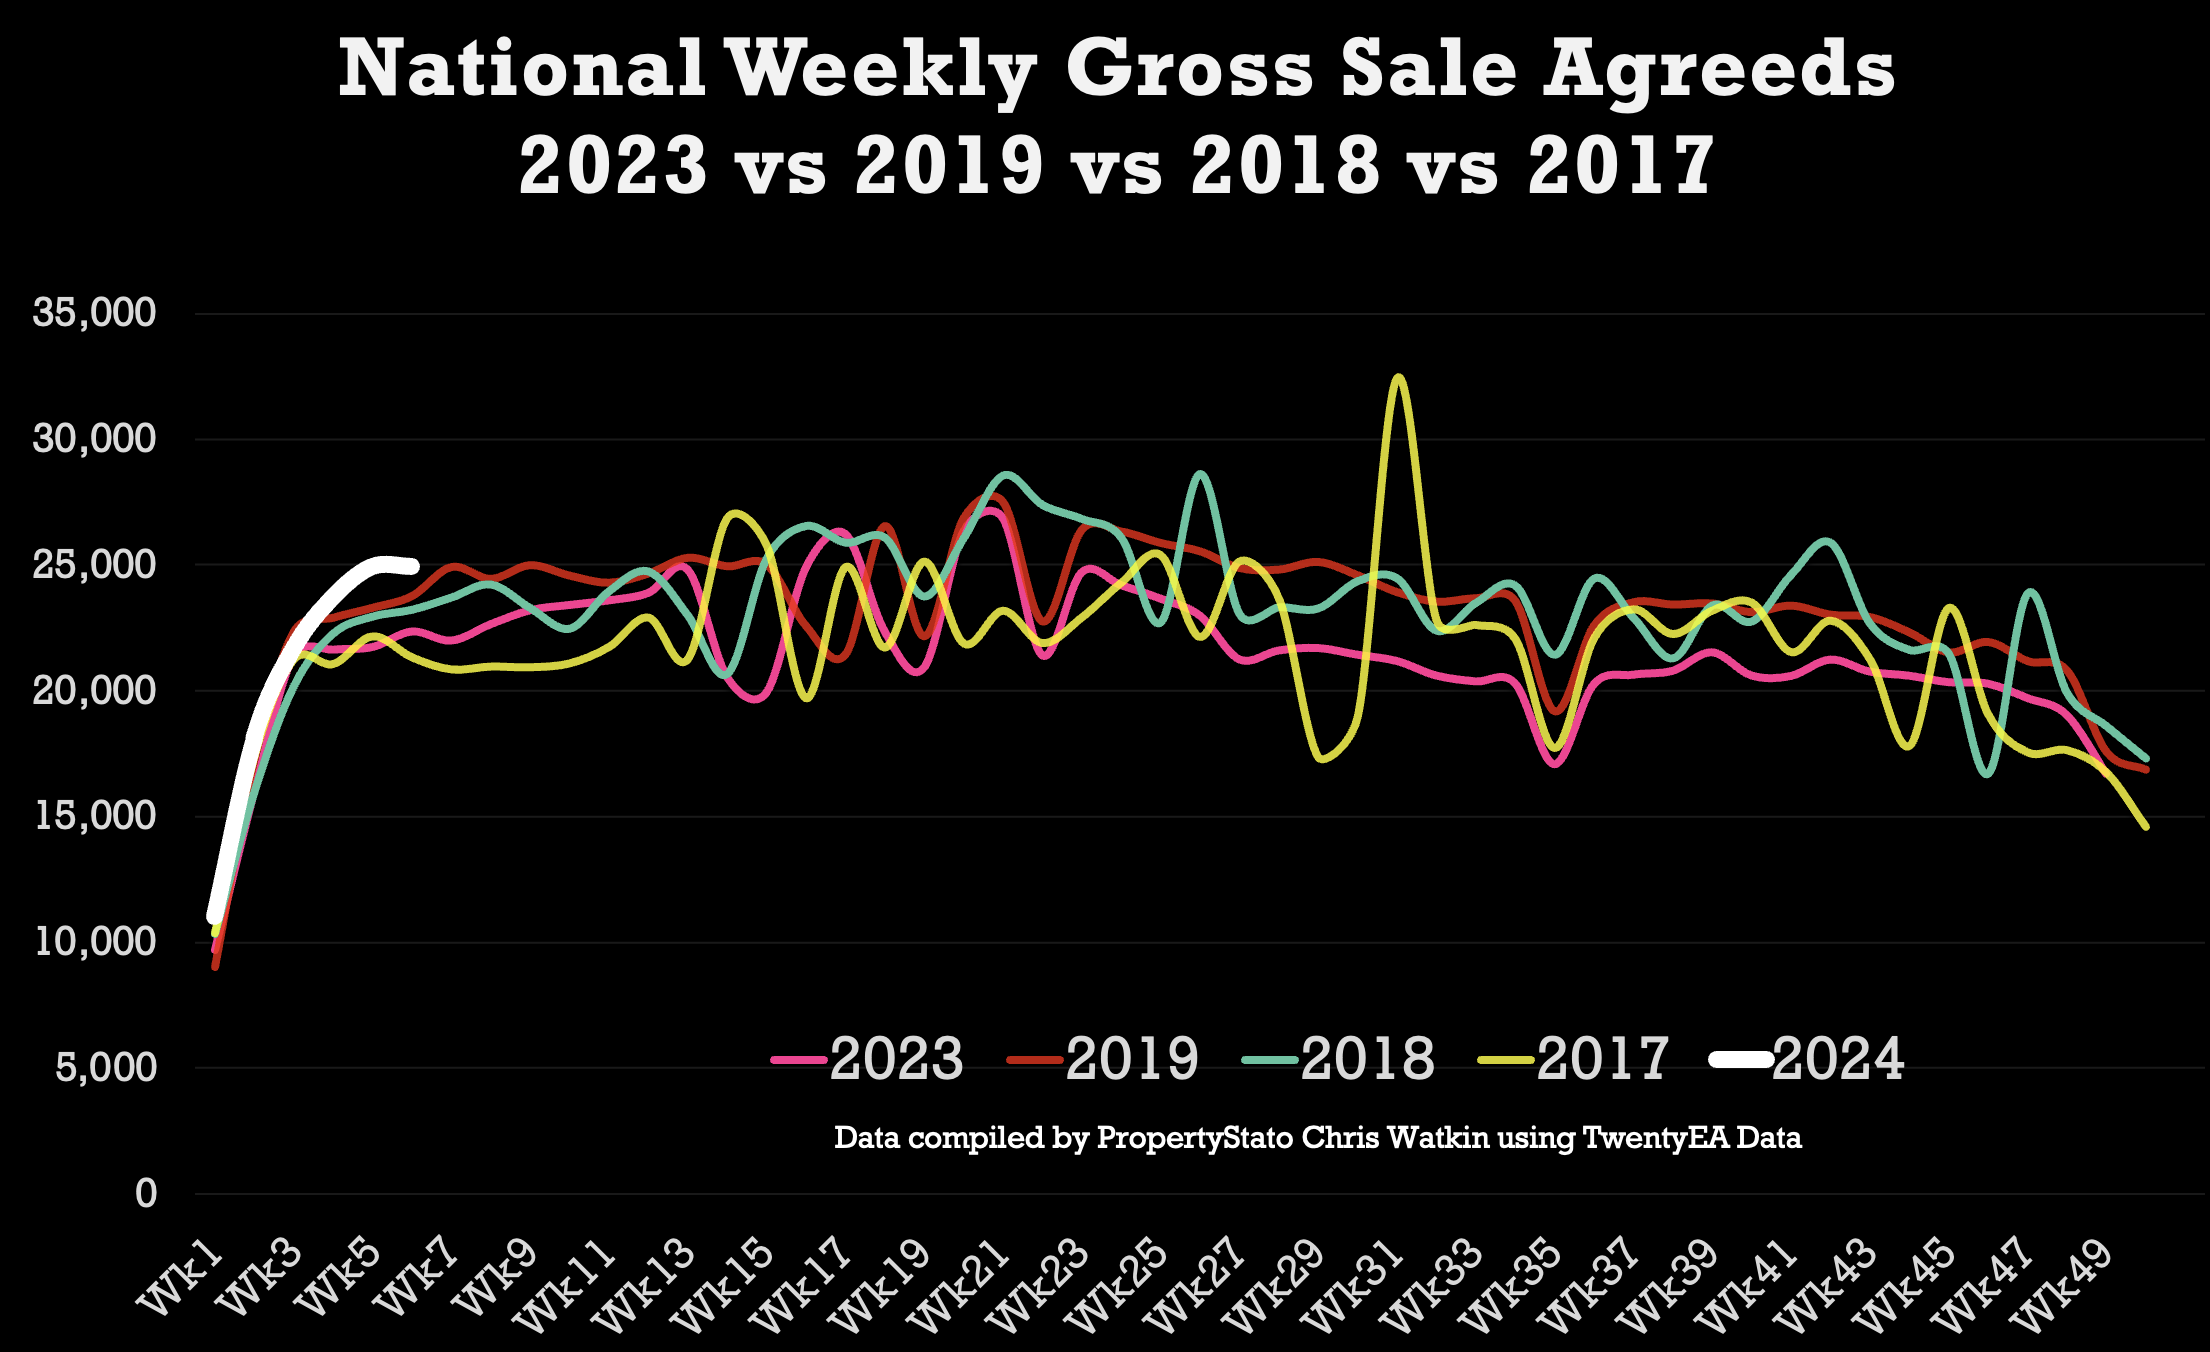
+ Gross sales last week 15% higher the weekly YTD 2024 average (and 18% higher than the 2023 weekly average)
+ Net sales last week – 31% higher than the 2023 weekly average
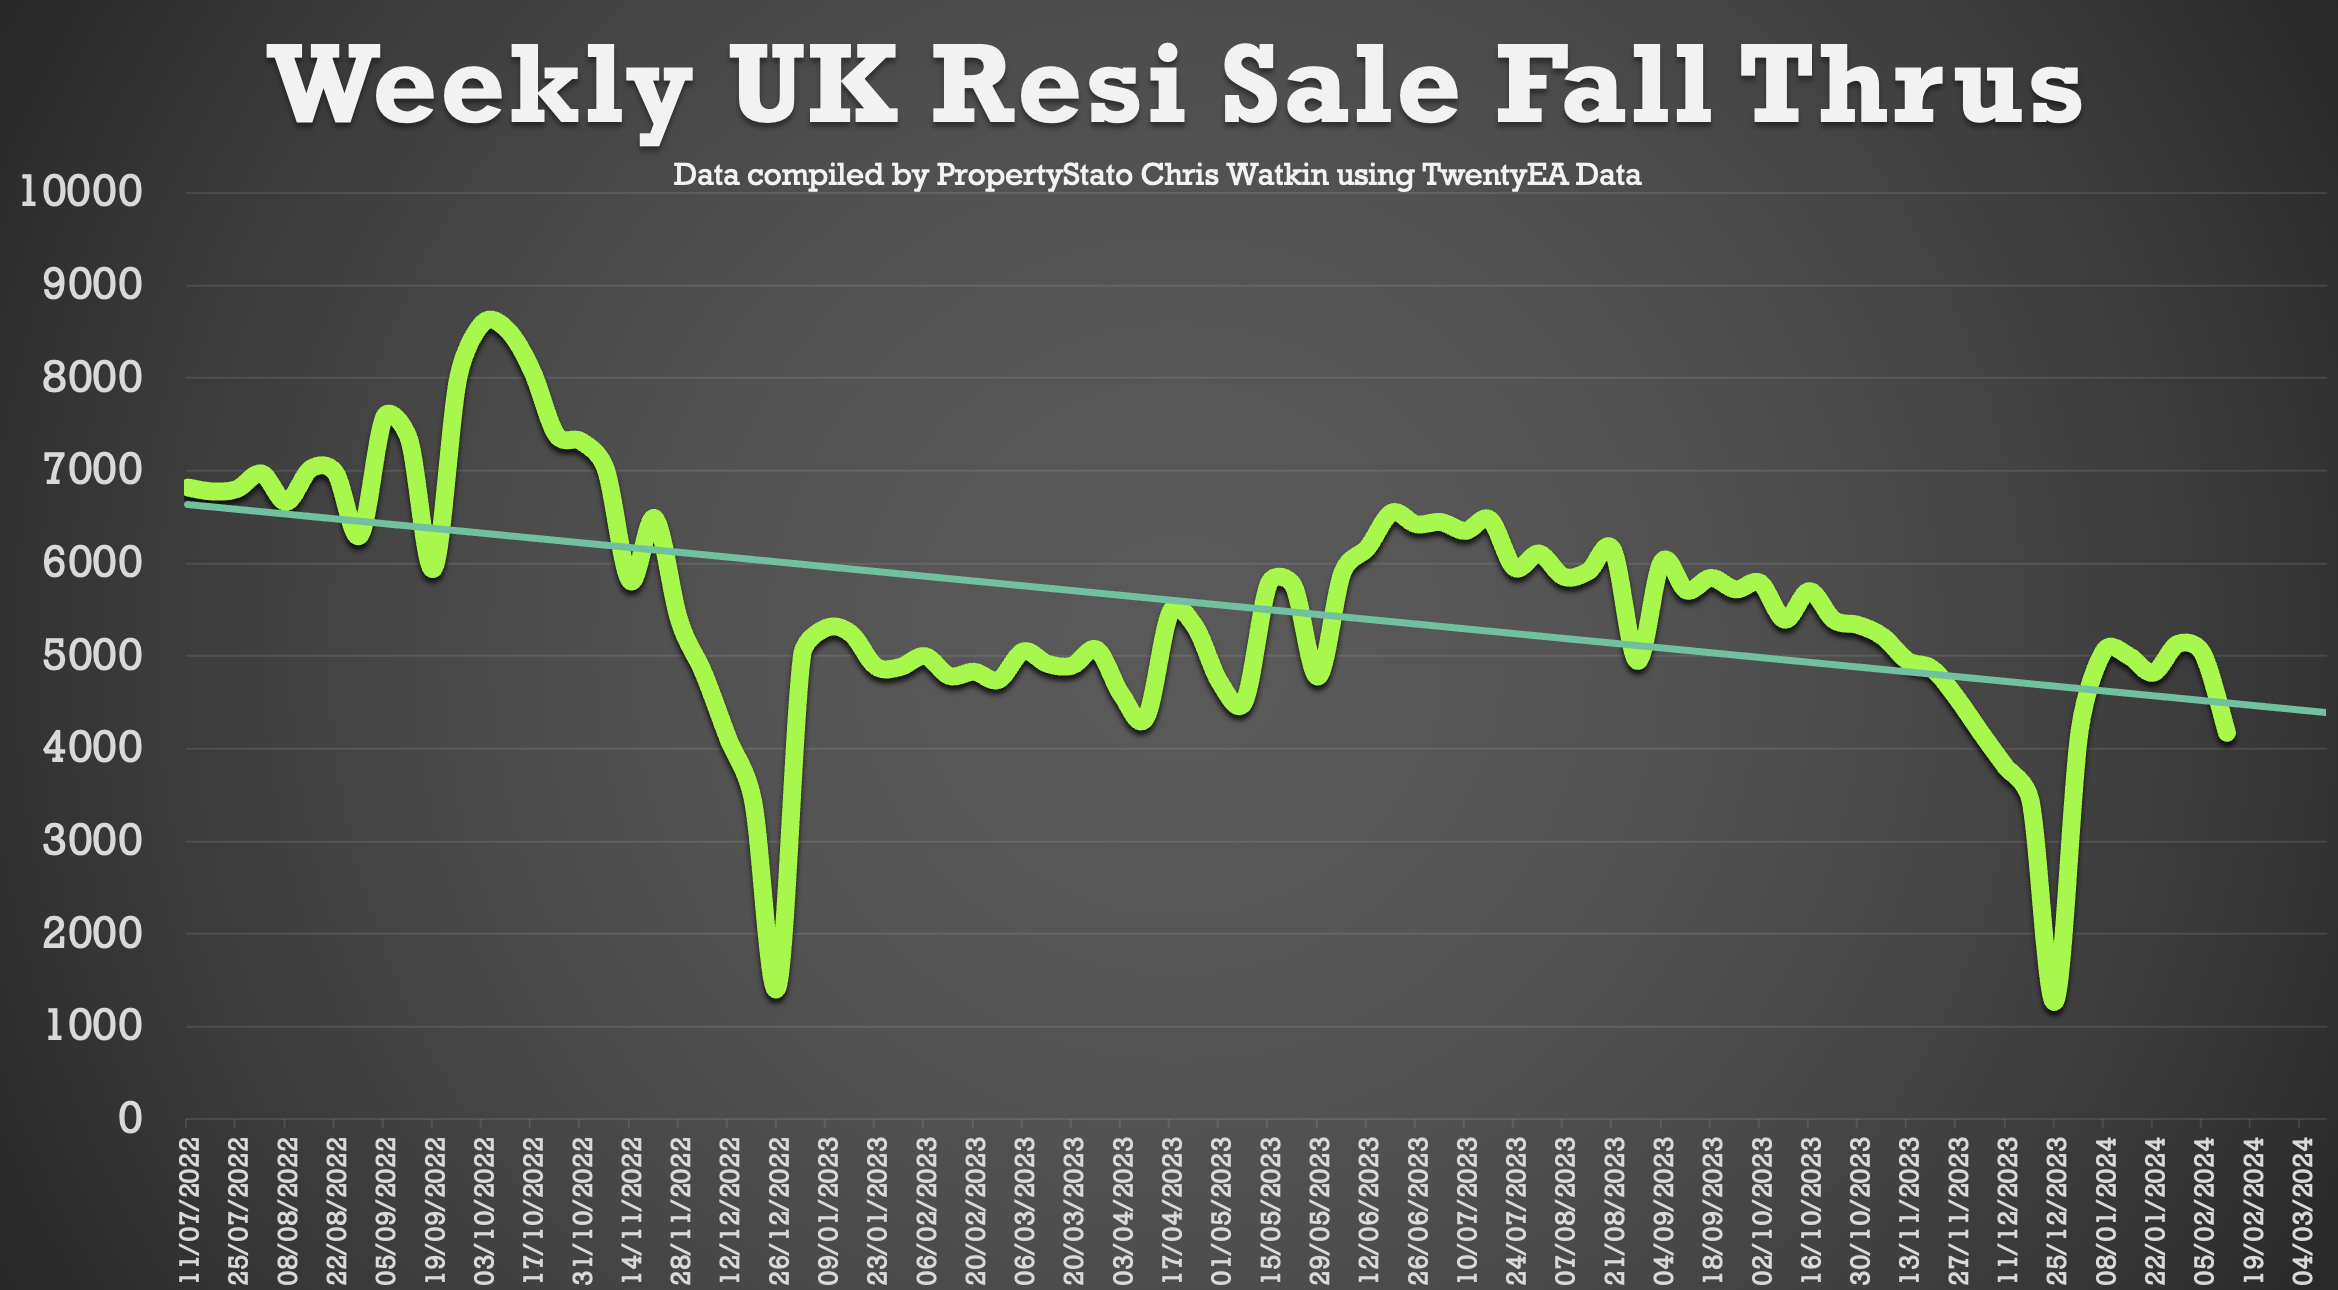
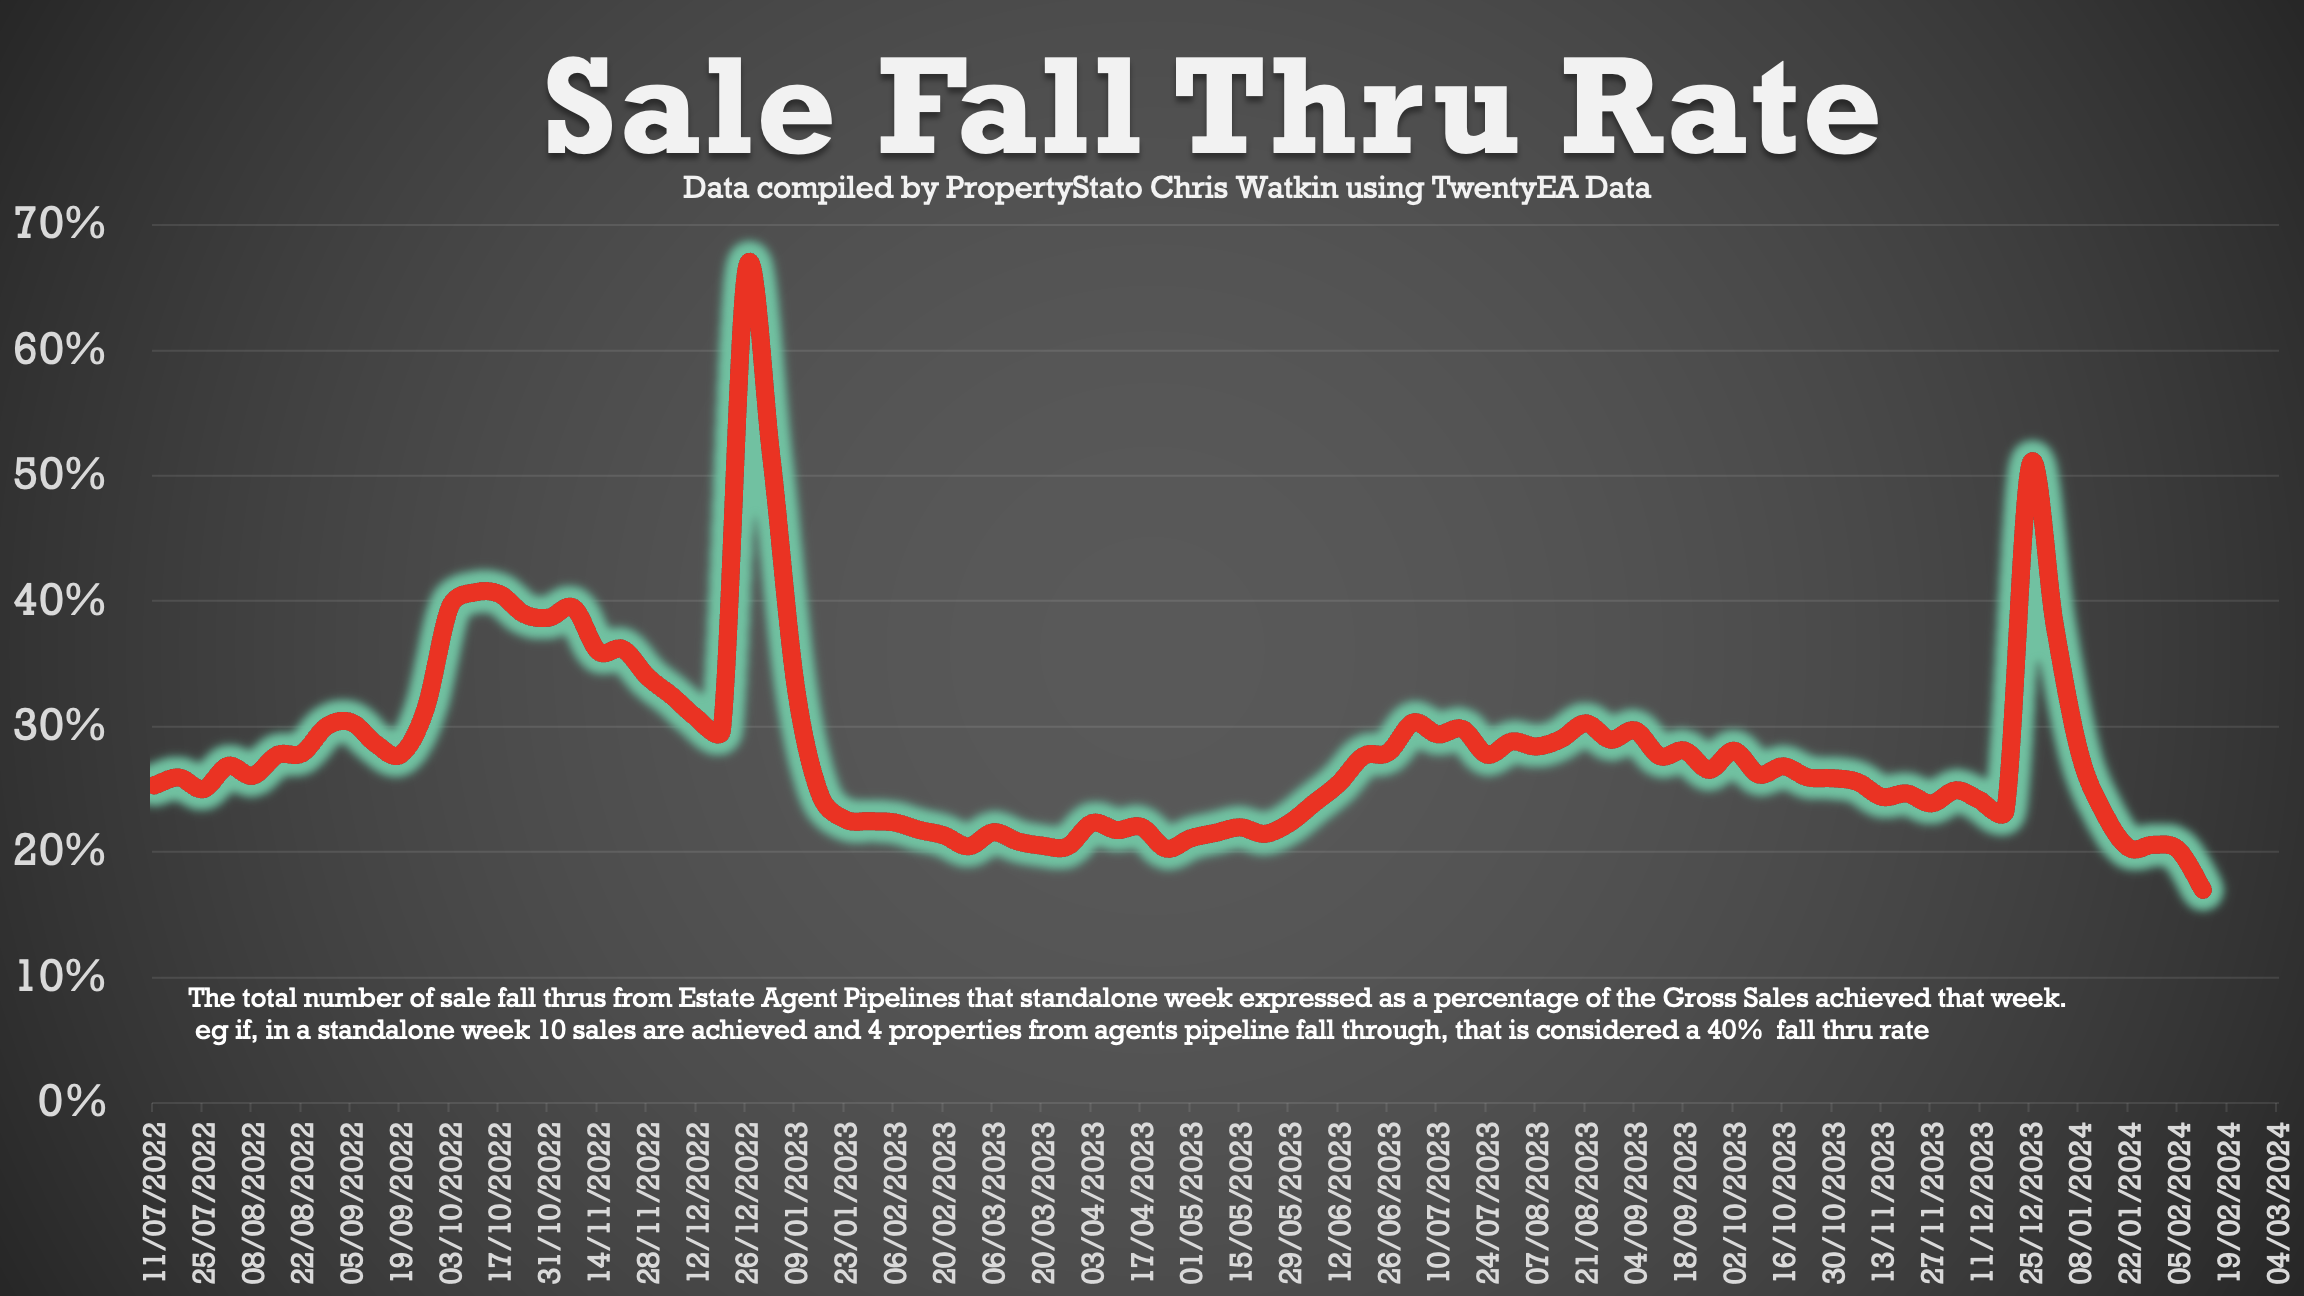
+ Sale fall-throughs drop to record lows at 1 in 6 sales.
Chris’s In-Depth Analysis (Week 7) :
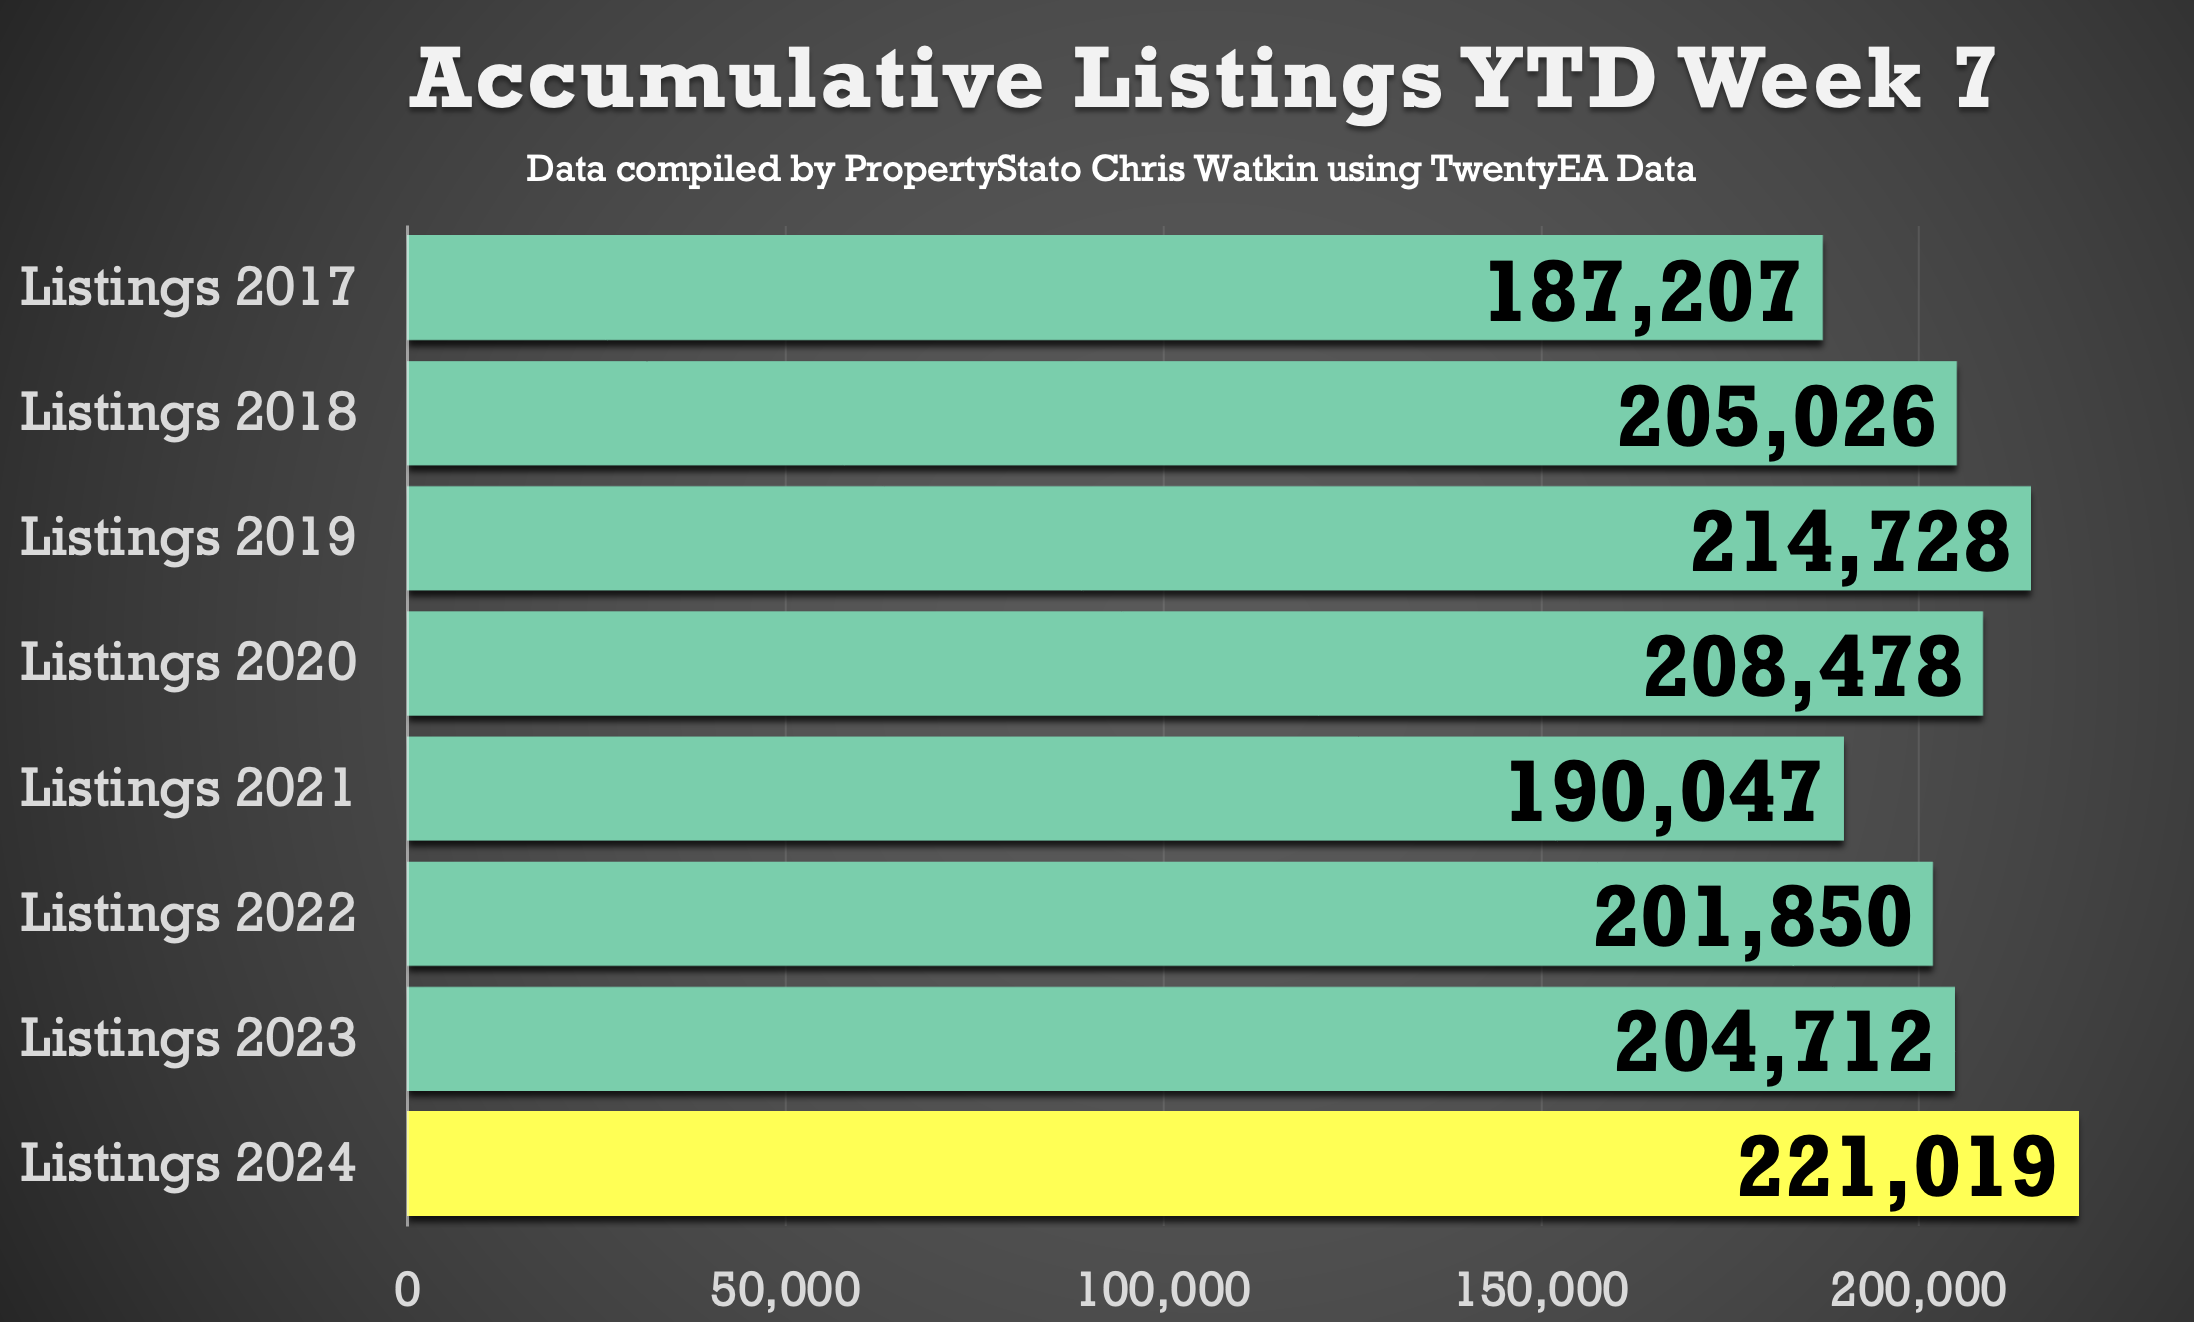
New Properties to Market: The UK saw 33,649 new listings (the 8-year average for Week 7 is 32,104). This year’s YTD listings stand at 221,019, surpassing the historical 8 year YTD average of 204,133.
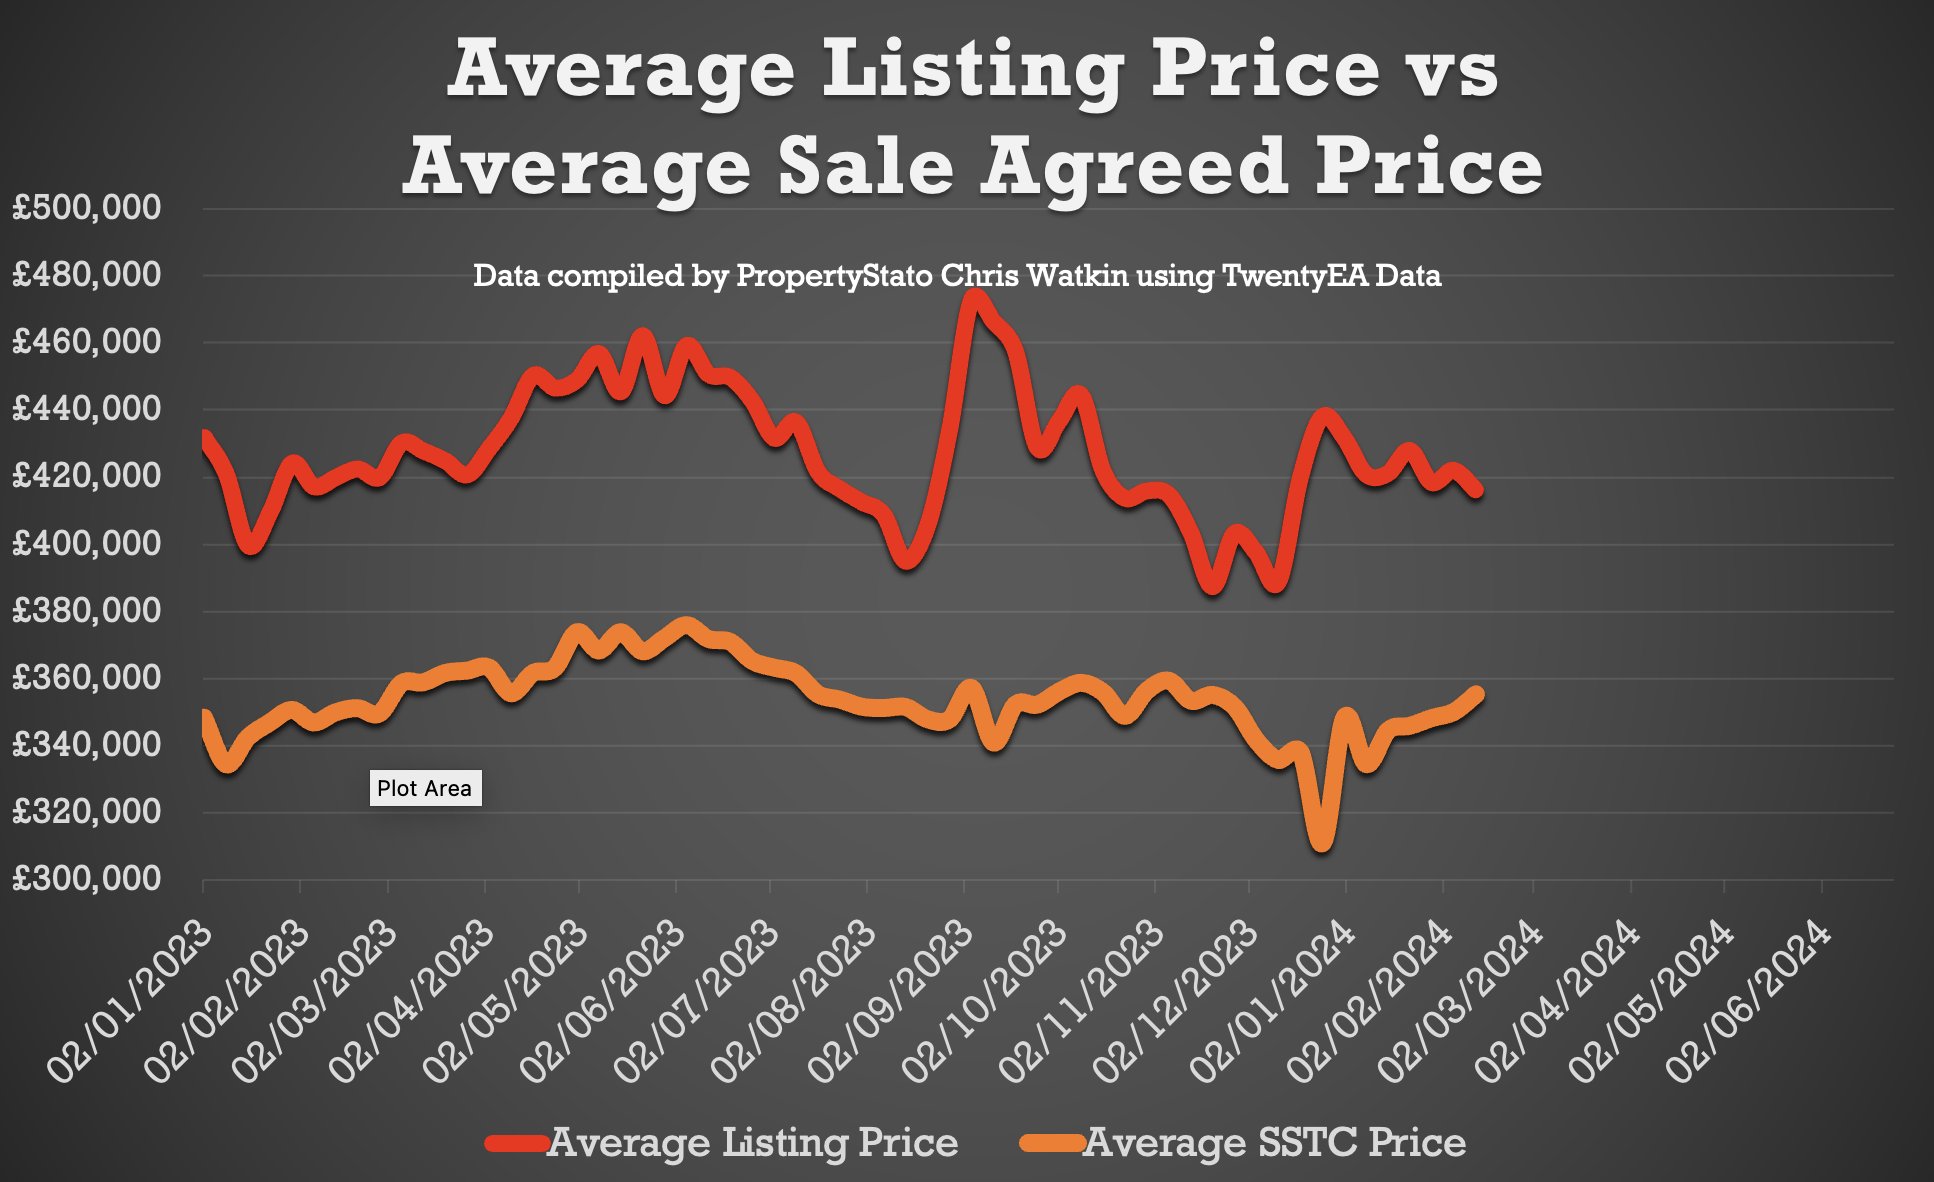
Average Listing Price: A key figure of £416,214 .
Listing vs Sale Agreed Prices: The difference stands at 17.1%.
Price Reductions: Last week, 17,942 properties saw price reductions, a significant number compared to the 8-year average of 13,537. This means 1 in 8 properties each month. Is that enough? I don’t believe so.
Average Asking Price for Reduced Properties: At £388,392 , this shows me the lower to mid price properties are being reduced.
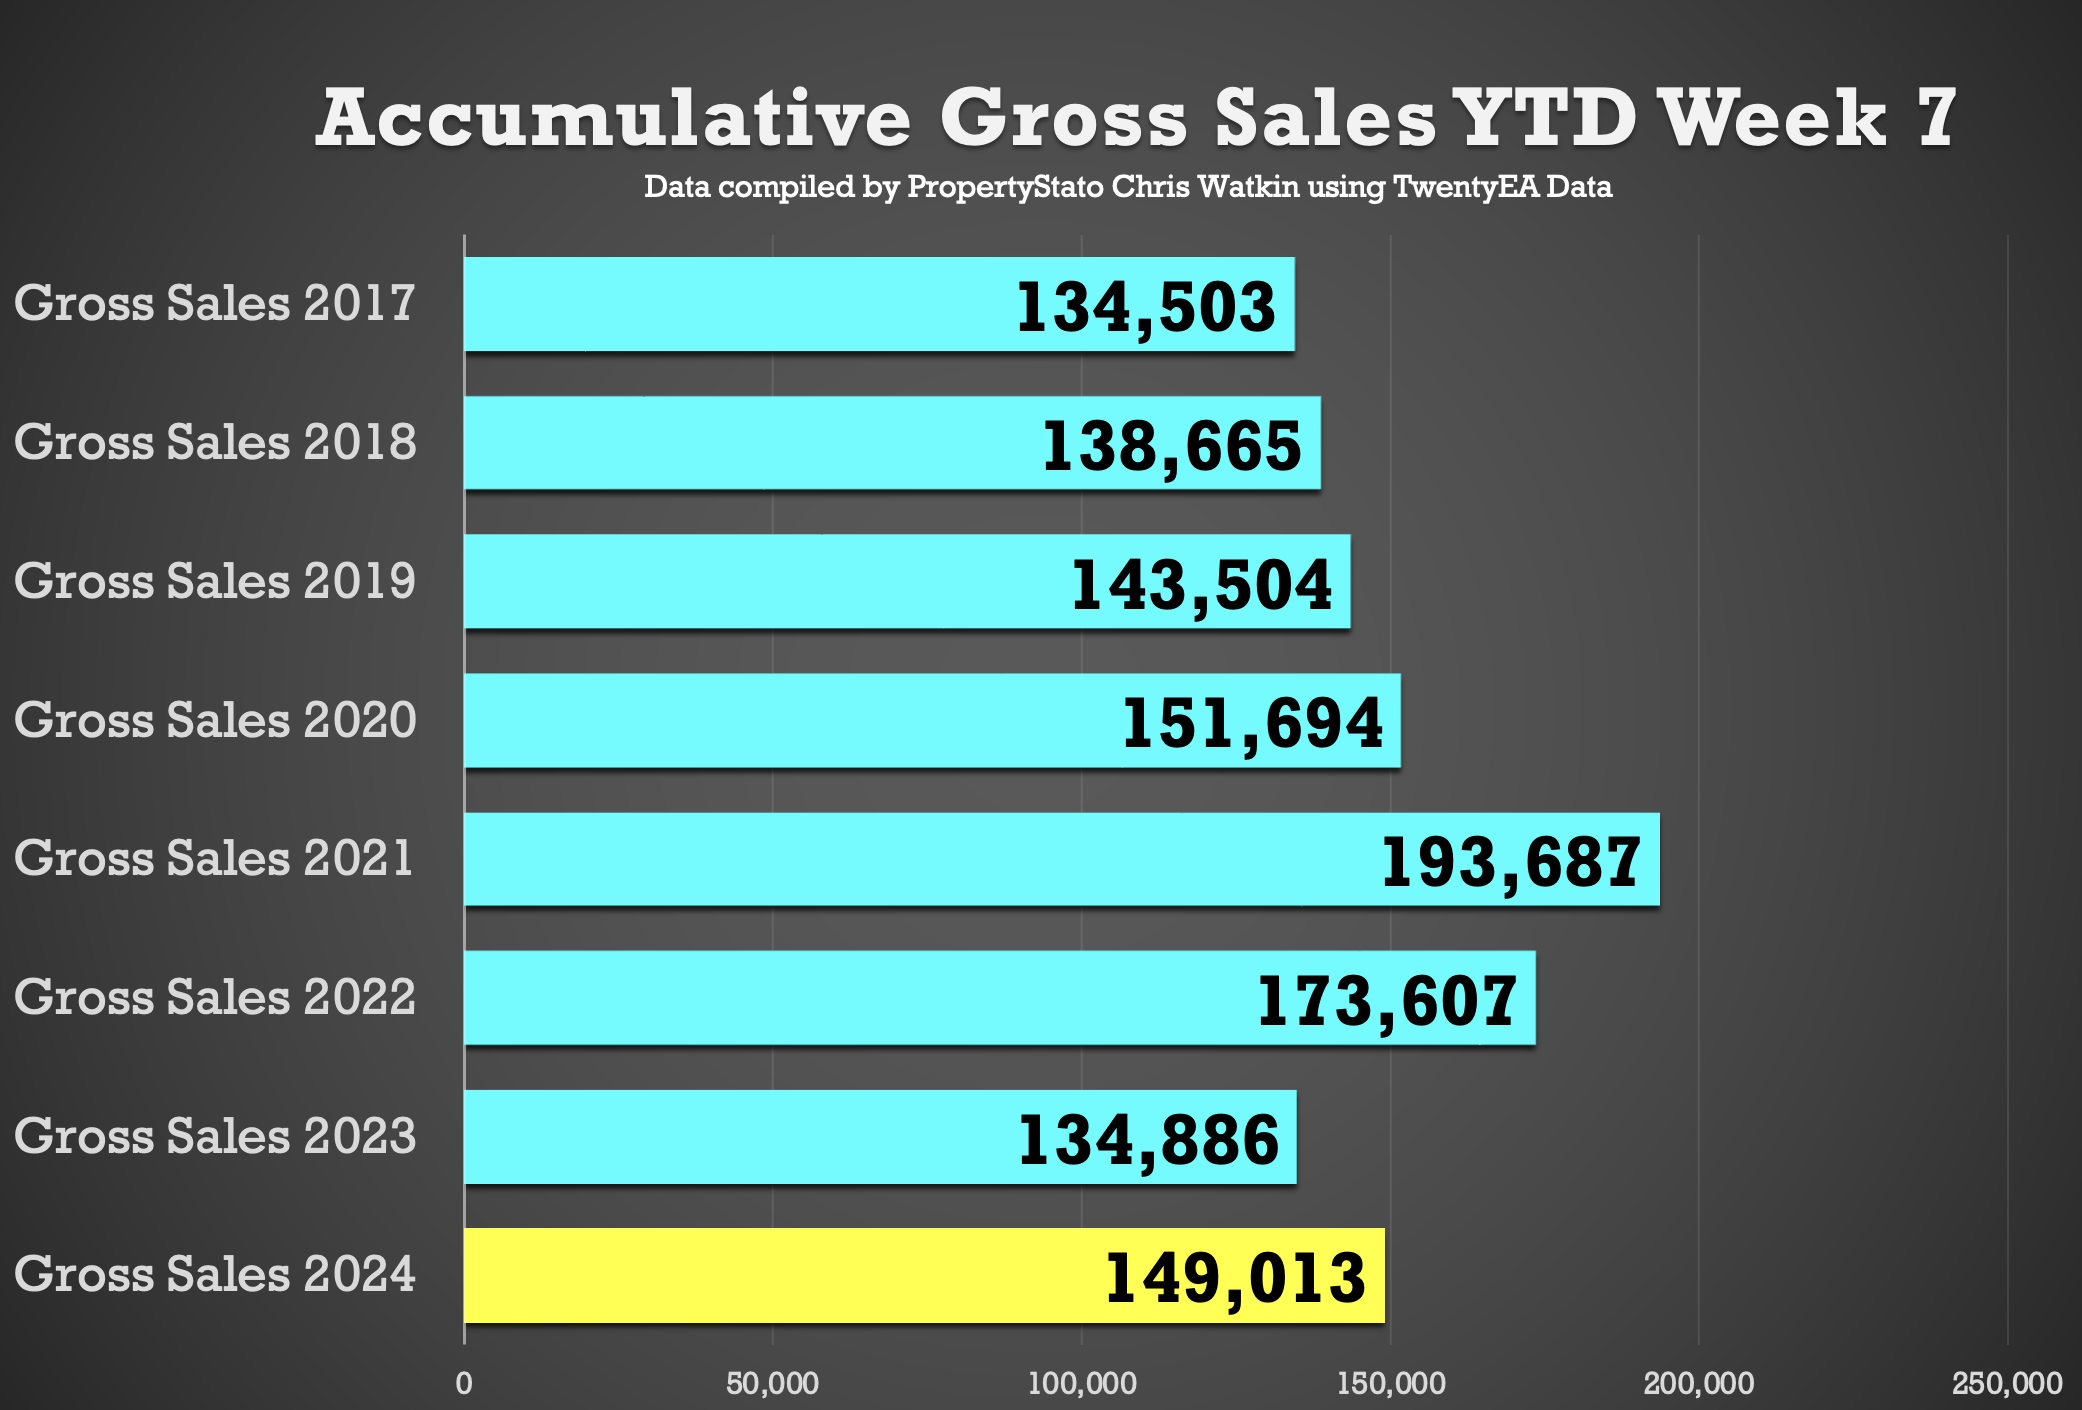
Accumulative Gross Sales YTD: The total stands at 149,013, exceeding the average of 138,891 from 17/18/19.
Gross Sales: Impressively, 24,587 properties were sold stc last week. Average for 17/18/19 is 23,167 for Week 7
Average Asking Price of Sold STC Properties: Holding steady at £355,427, mirroring the latter half of 2023.
Sale Fall Throughs: Really low this week at 4,171, this is encouragingly lower than the 2023 average of 5,382 weekly fall-throughs.
Sale Fall Through Rate: Slumped to 16.96%, levels not seen since for years. As you can see from the graph, this is a downward trend that started Spring 2023
Net Sales at 20,416 for the week, above the 17/18/19 average of 19,054 for Week 7.
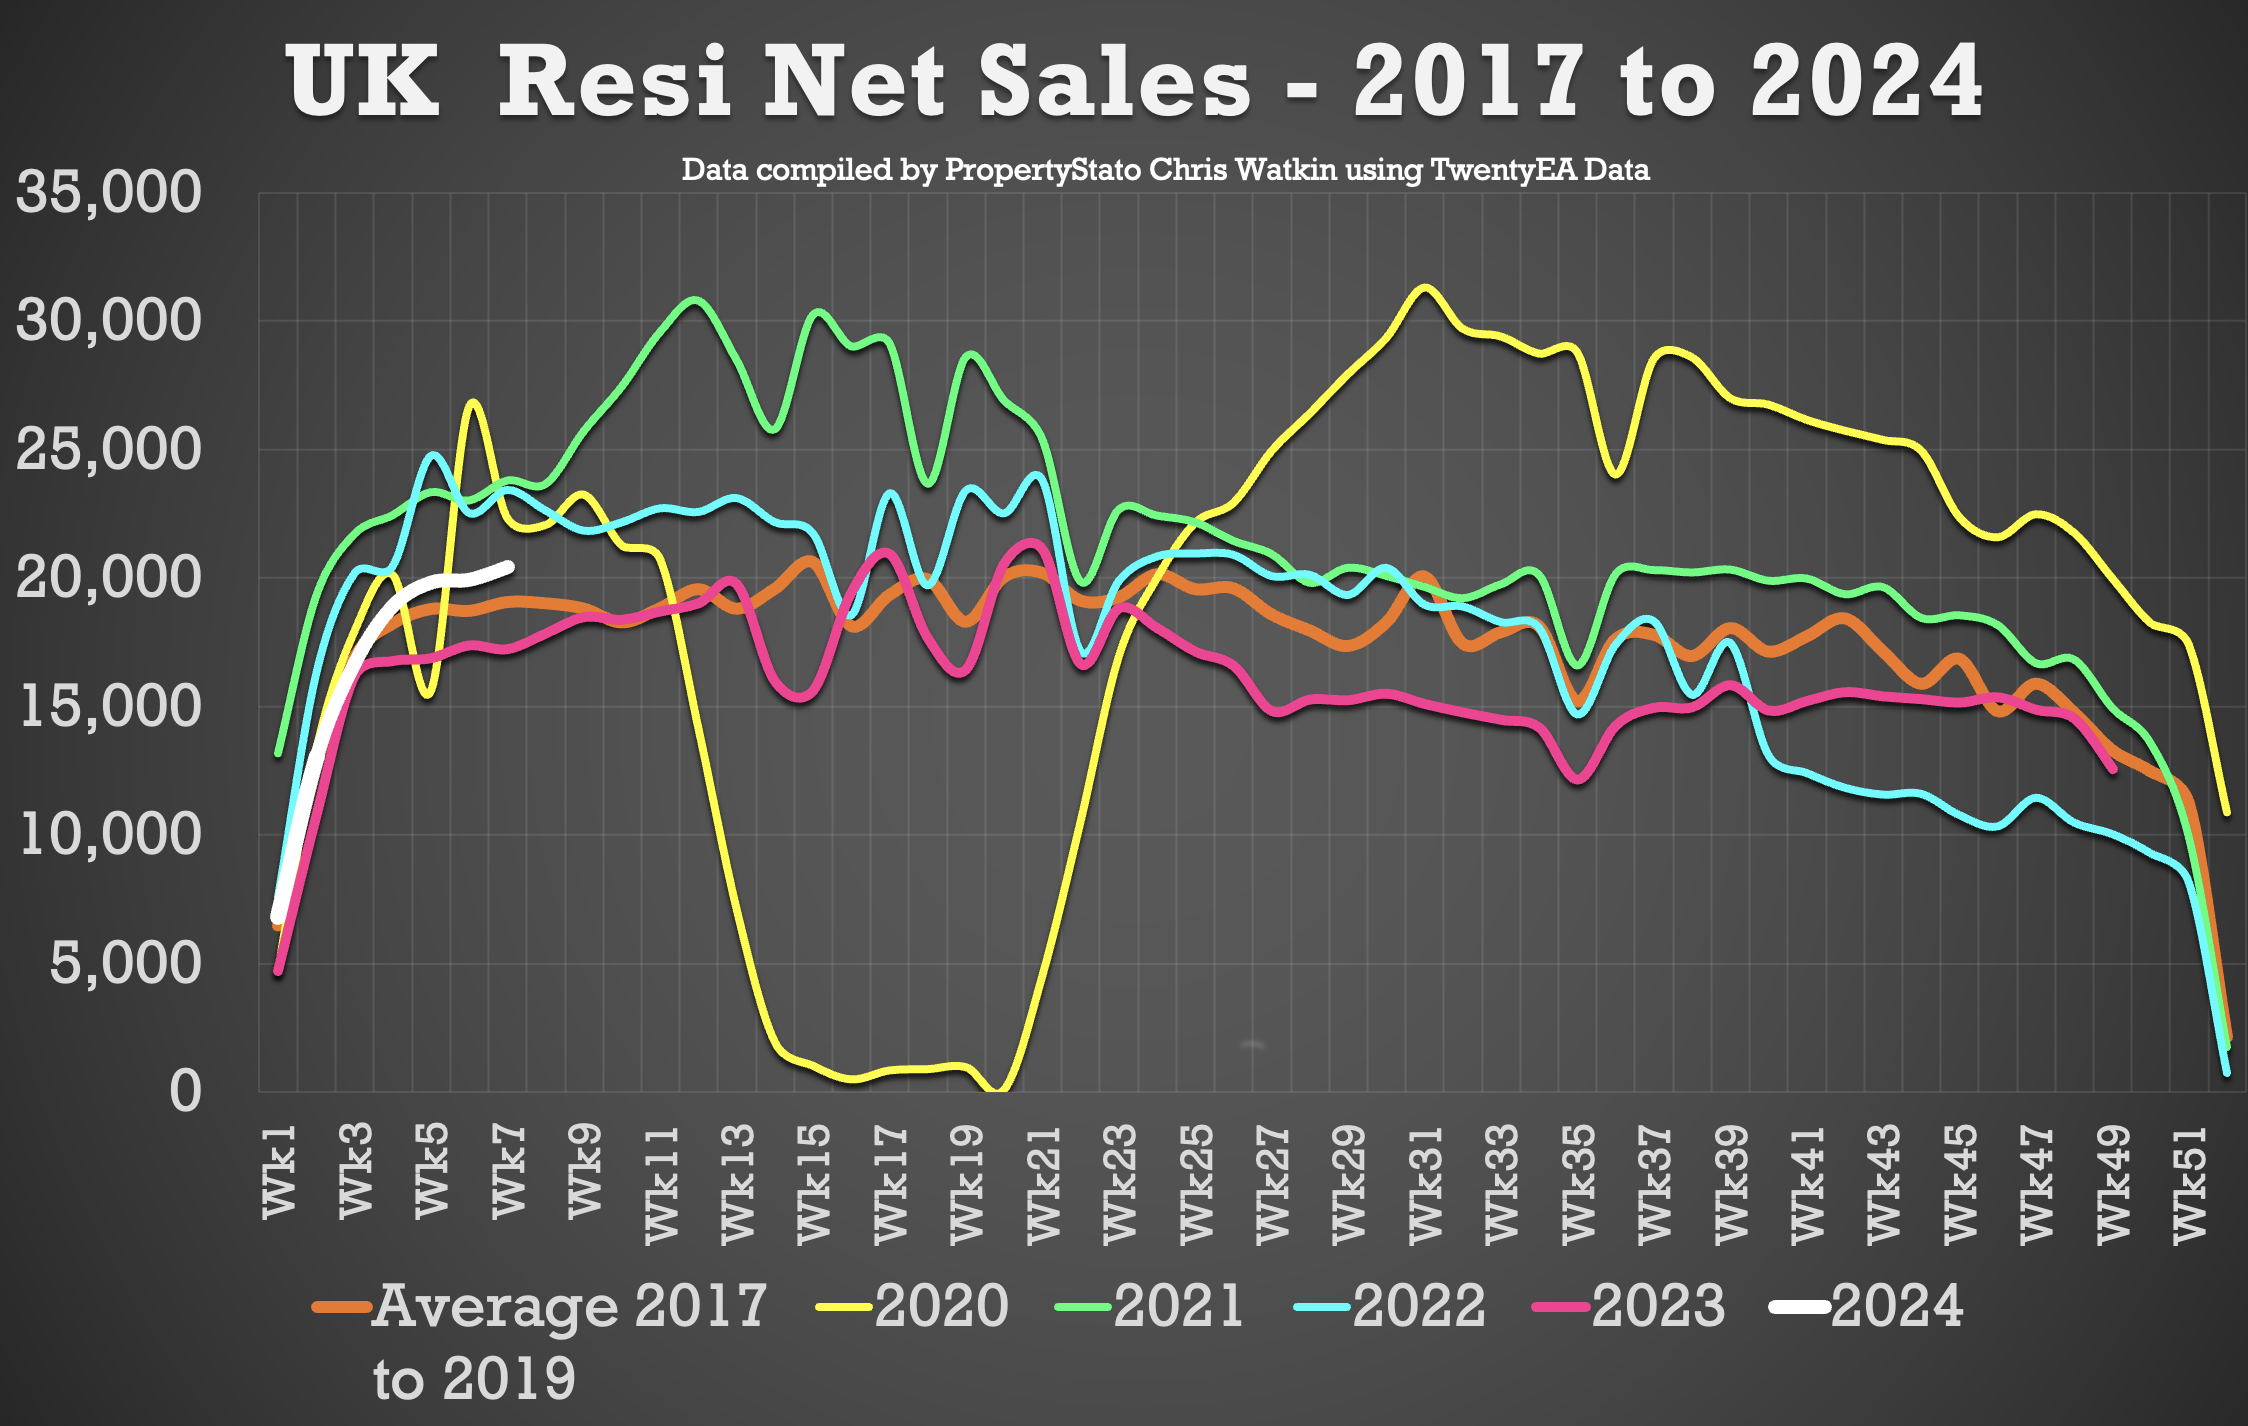
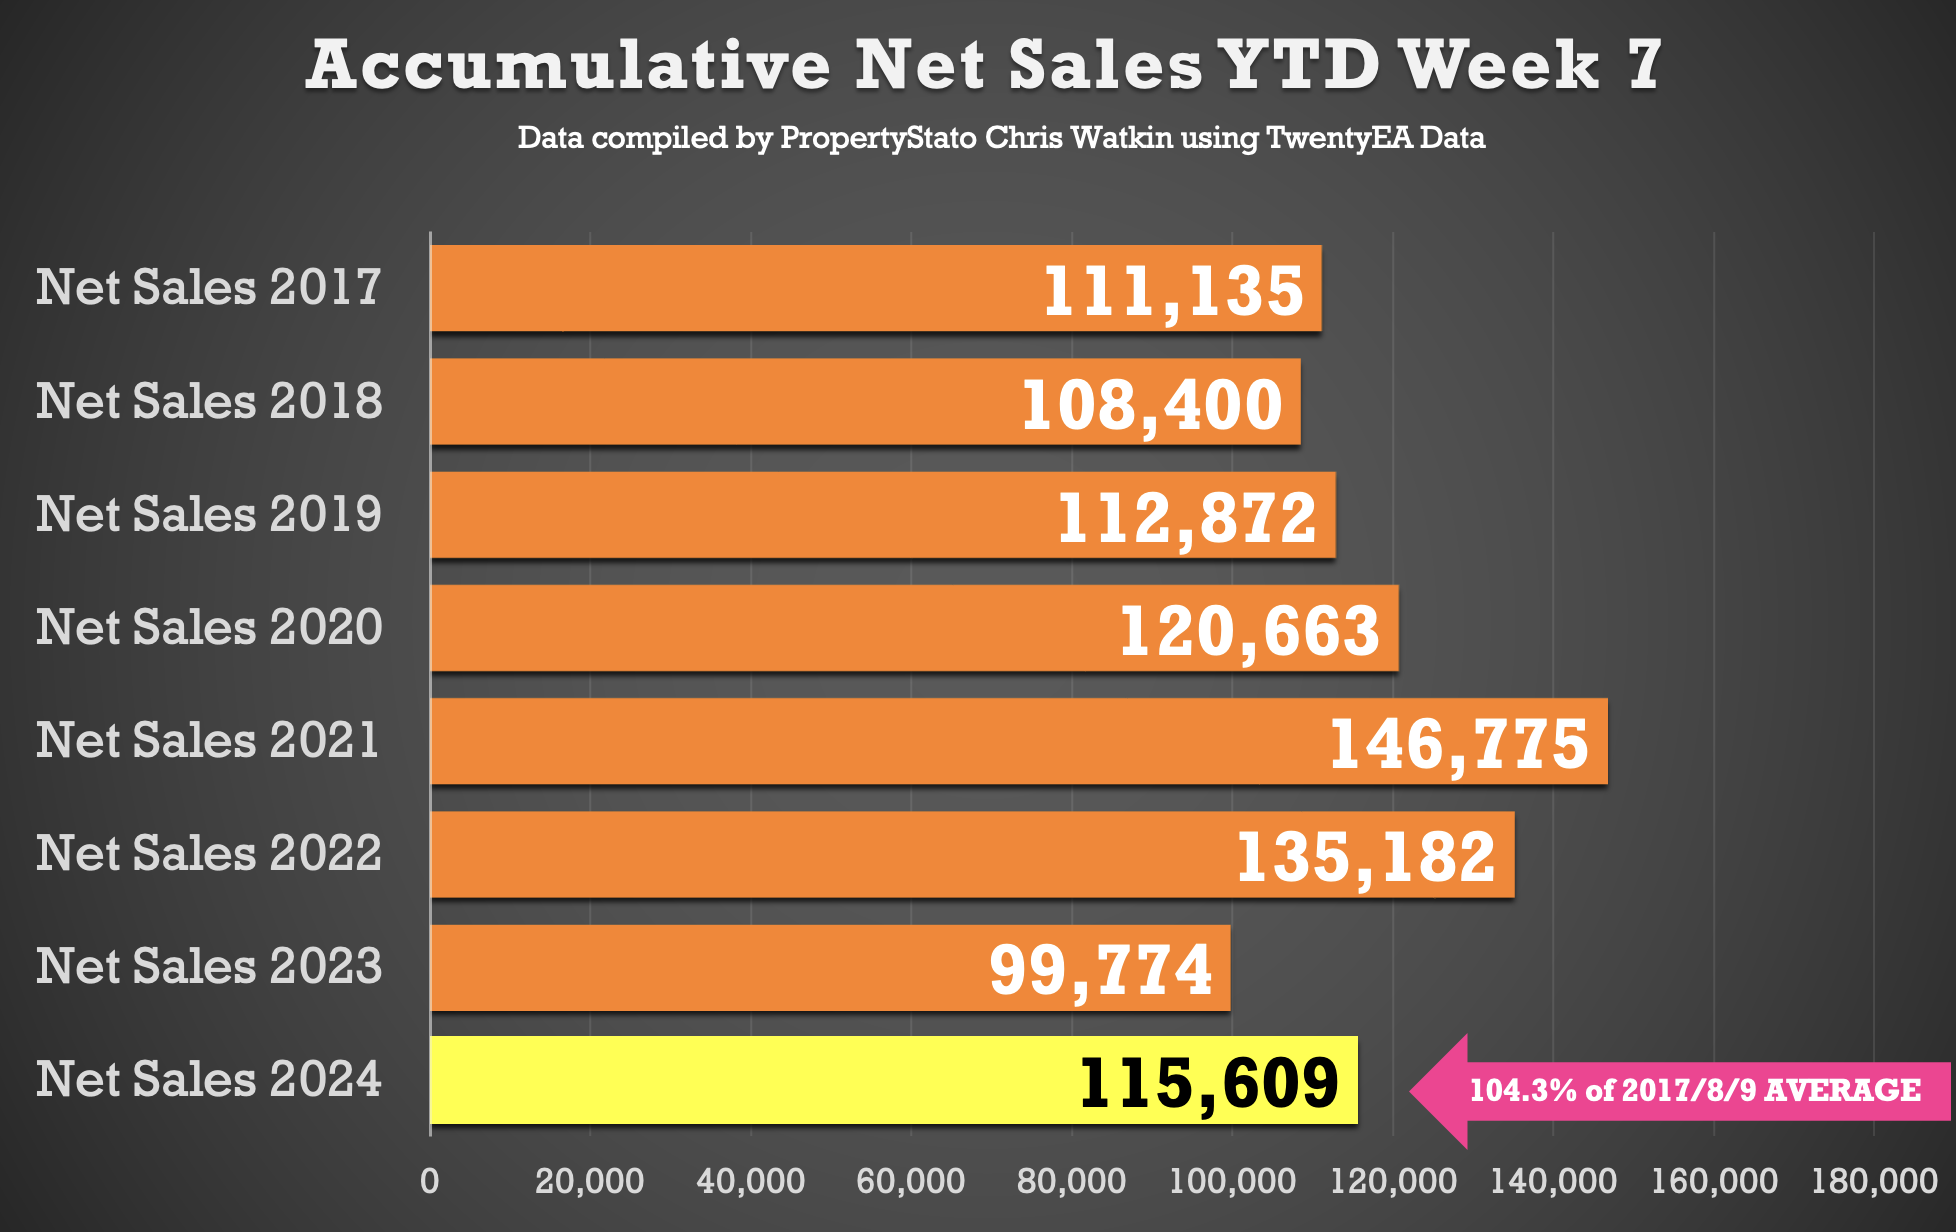
Accumulative Net Sales YTD: The total stands at 115,609, 104.3% of the 17/18/19 average
House Prices on Sale Agreed homes in February stand at £339/sq.ft (based on 65,539 UK properties sold stc / sale agreed). For comparison, it was £327/sq.ft in Q4 2023 and £329/sq.ft in whole of 2023.
Watkin’s Thoughts ..
The British property market has experienced a surprisingly strong start in the initial two months of the year, buoyed by mortgage rates dipping to around 4%, enticing those who had paused their moving plans in 2023 to plan their home moves. This trend suggests a potential increase in transactions, potentially 1.05 to 1.1 million in 2024, which will be 8% to 13% rise from 2023.
However, I must stress to Estate Agents that they need to exercise caution, as inflation persists and mortgage rates are still not set in concrete. We have a General Election this year and buyers are still mindful of pricing, with sellers adjusting their expectations to stimulate interest.
Transaction volumes are crucial, with new sales agreed (SSTC) up by 10.4% compared to year to date last year.
The markets that have seen the best growth are Outer London at 23.1%, the South East 23.3% and Inner London at 30.2%. This surge in activity is encouraging more sellers to enter the market, with YTD listing rates at their highest in eight years (8.27% higher than 8 year average), offering more options to buyers and helping to moderate price increases.

Comments are closed.