The UK property market for the week ending Sunday, 5th May 2024 (Week 18) saw a similar week to the week before (Week 17), which was the best week for gross residential property sales since July 2022 and best for net resi sales since May 2022
In this week’s UK Property Market Stats Show with Verona Frankish, boss of Yopa, the headlines are as follows:
+ House Prices on the 139k Sale Agreed homes in April stands at £344/sq.ft (Feb ’24 & March ’24 both at £339/sq.ft & Jan ’24 to £331/sq.ft).
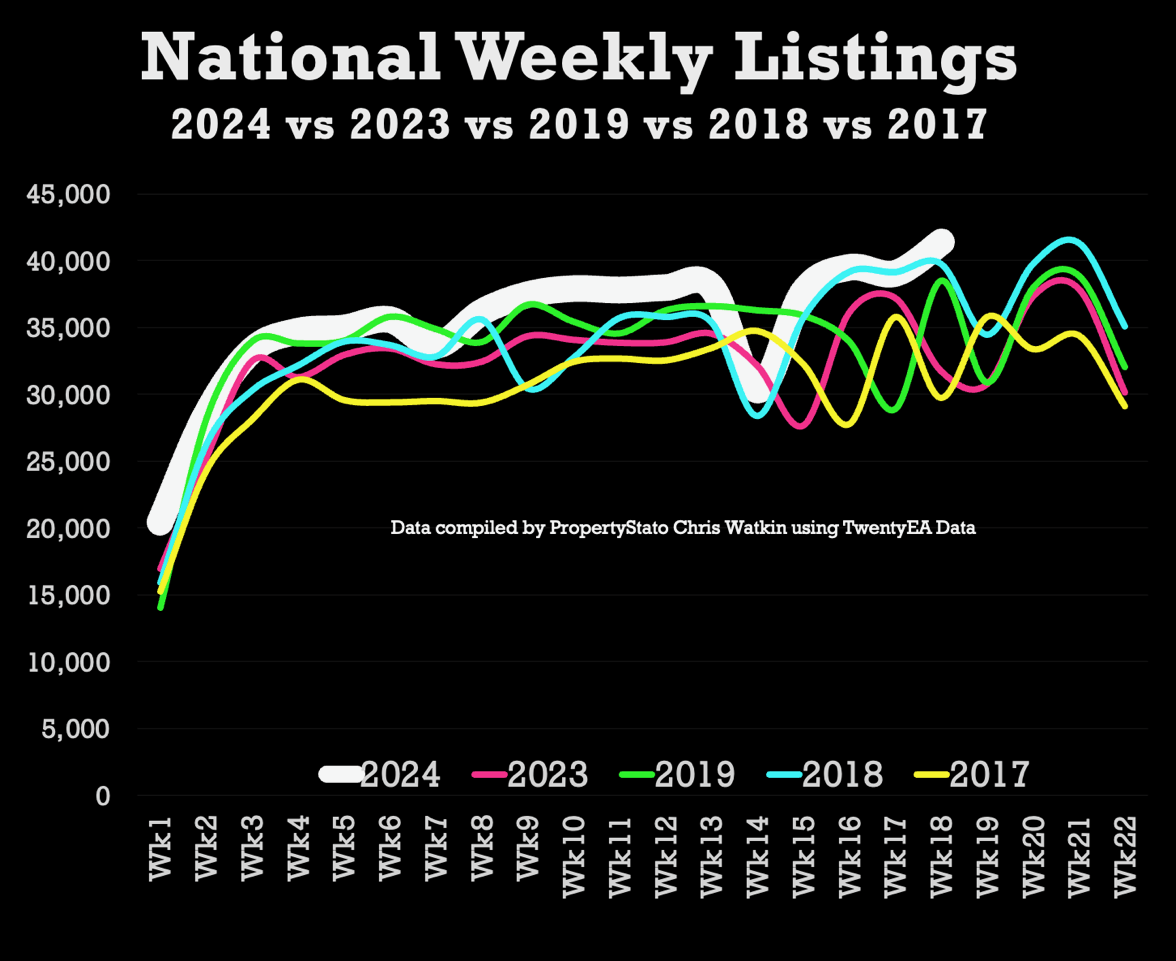
+ Listings for last week (Week 18) were just below the week before, which was the highest week for listings since Sept 2020.
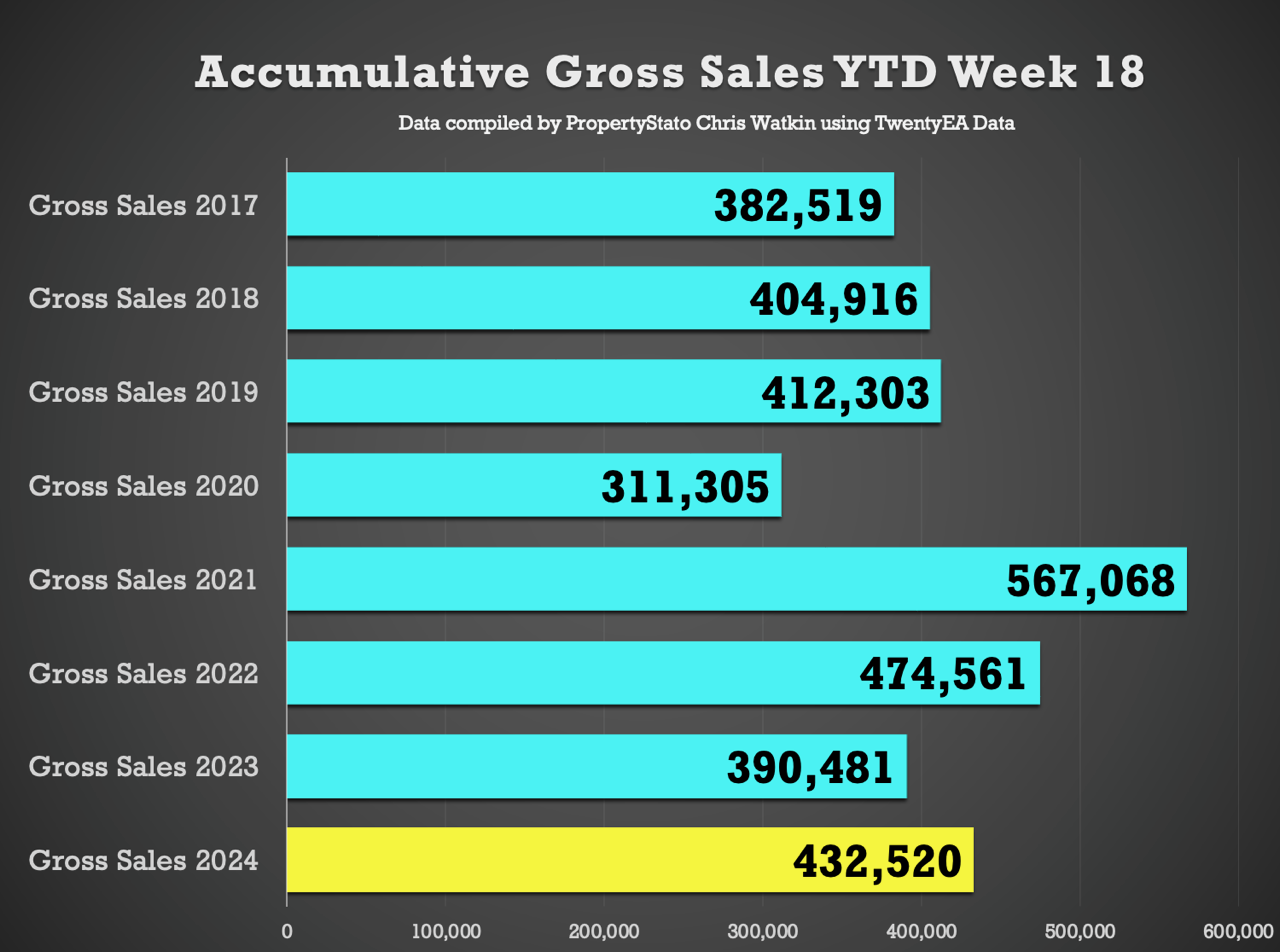
+ Total Gross Sales YTD are 10.8% higher than 2023 YTD levels and 8,2% higher than 2017/18/19 levels.
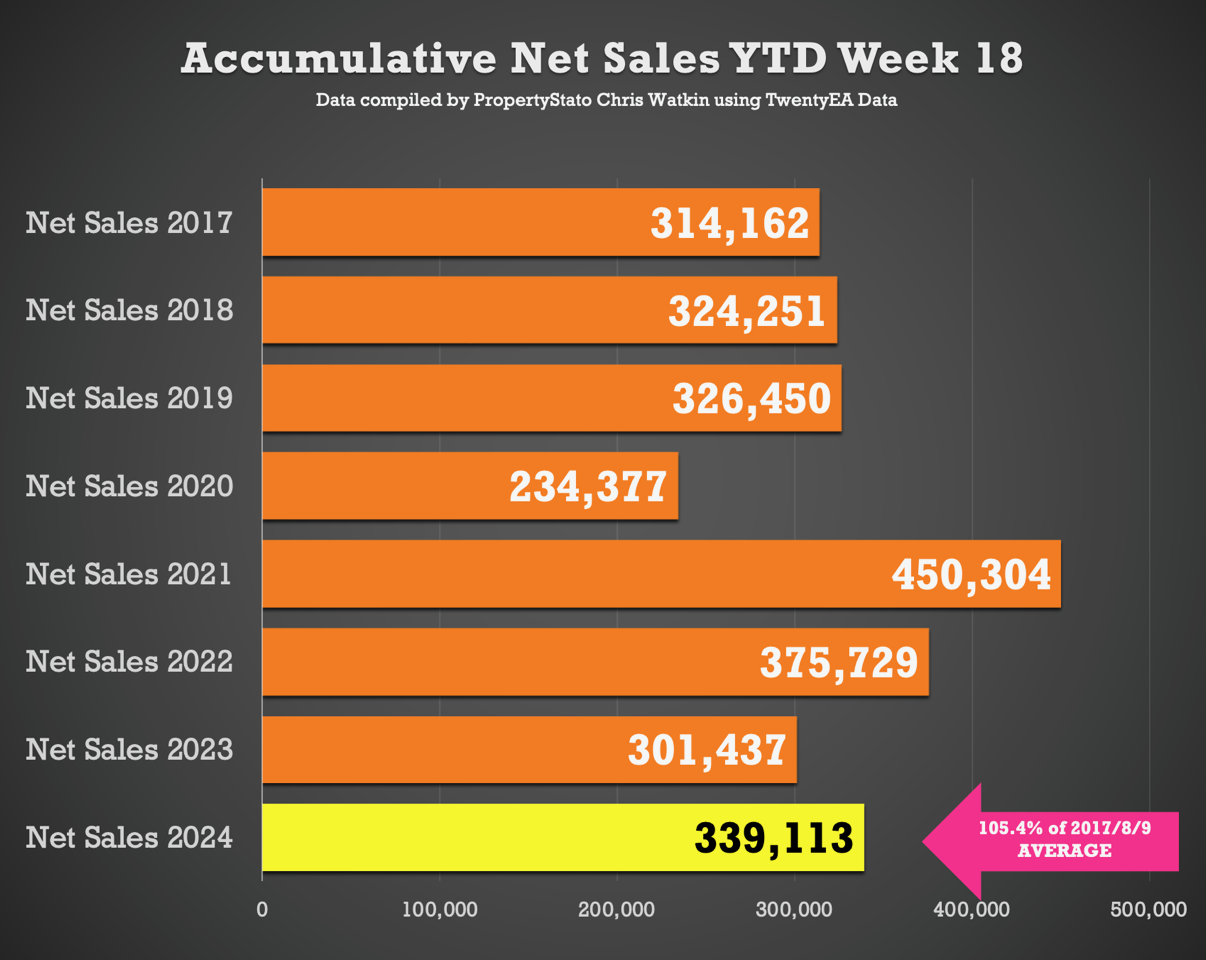
+ Net Sales last week were 21.4% higher than Week 18 2023, and 13.7% higher the 2024 weekly average. Last fortnight has been the best for net UK home sales since May 2022.
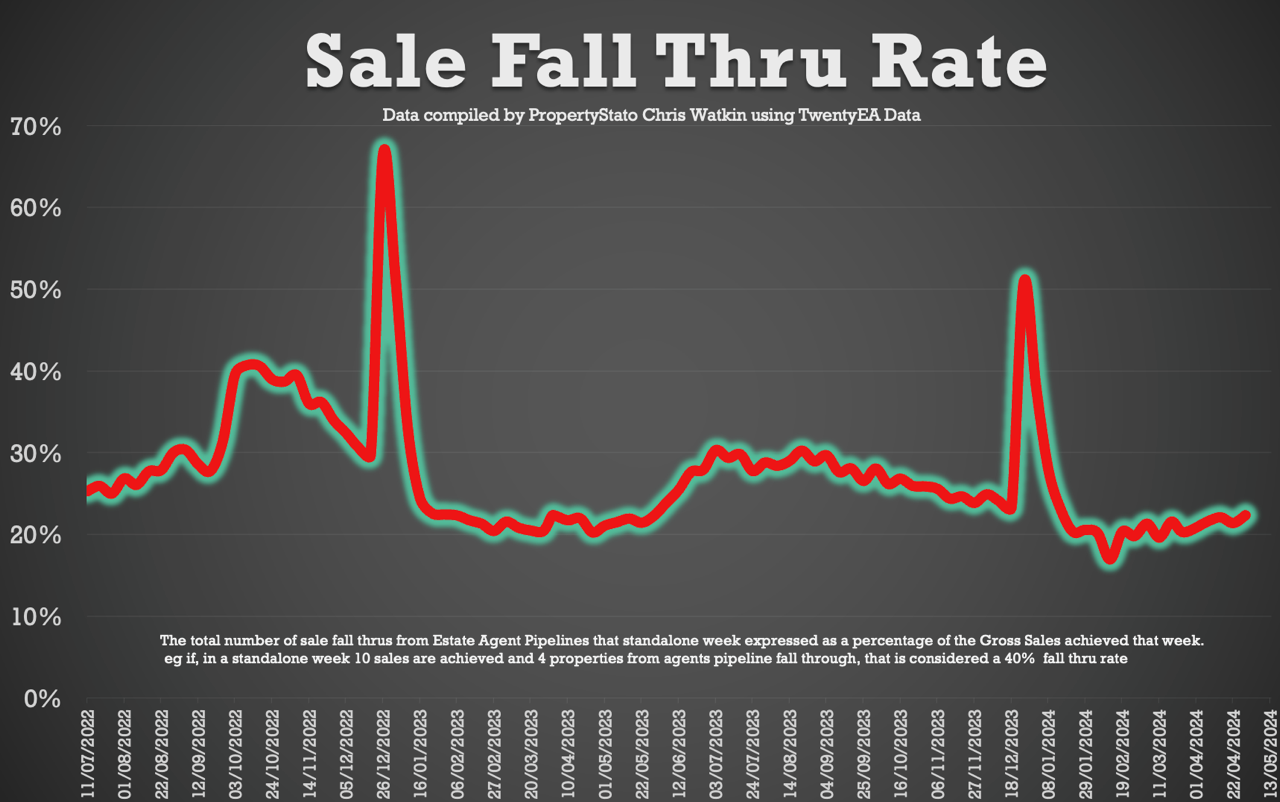
+ Sale fall-throughs still at just over one in five sales.
Chris’s In-Depth Analysis – all discussed in the show (Week 18) :
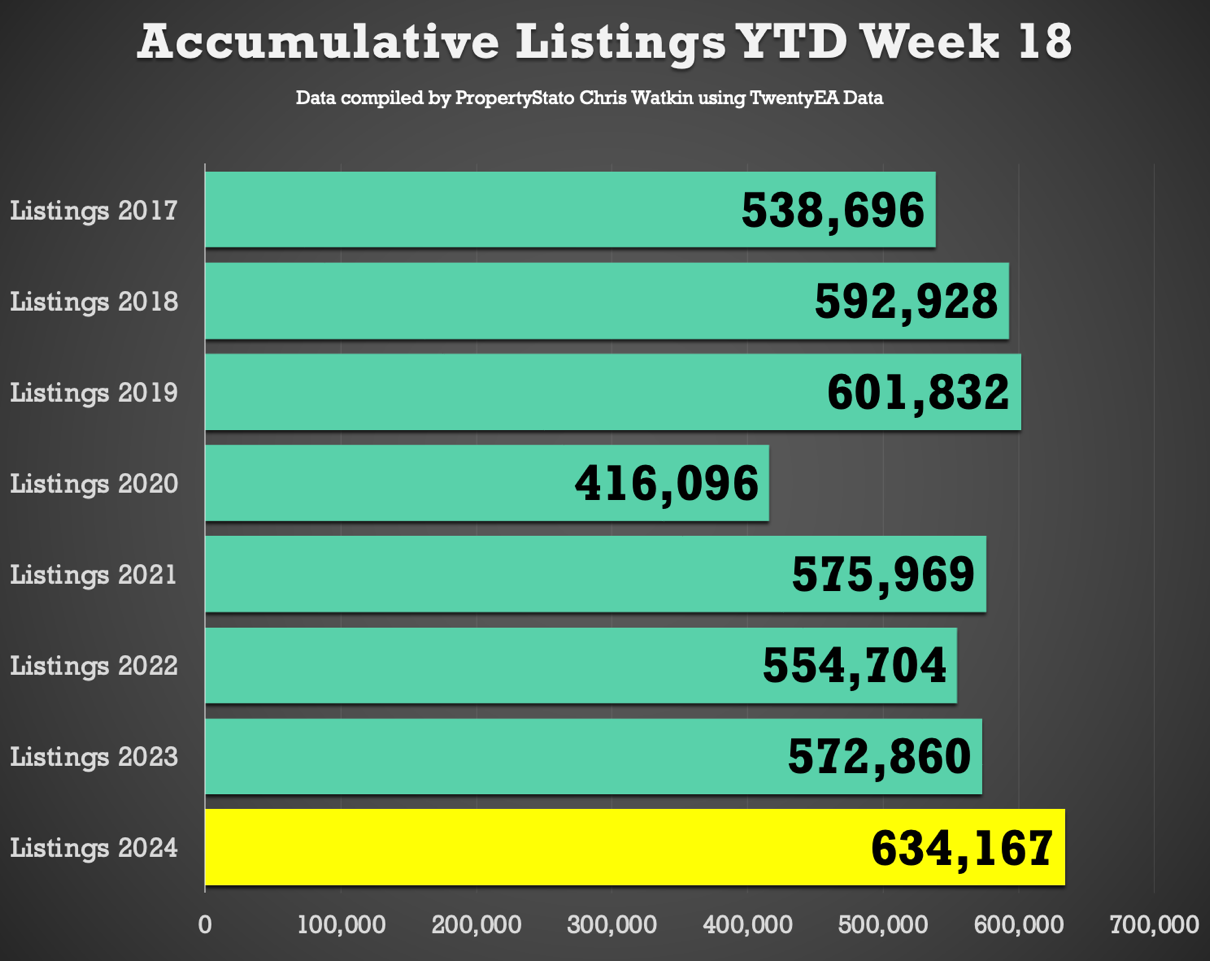
New Properties to Market: The UK saw 41,392 new listings. This year’s YTD listings stand at 634,167, 13.1% higher than the historical 8 year YTD average of 560,907 and 10.7% higher YTD 2023.
Average Listing Price: £463,936 .
Average Asking Price of this week’s Listings vs Average Asking Price of the Properties that Sale Agreed this week: 24.9%. The long-term average is between 16% and 17%. Over valuing in the whole of the UK, higher valuing properties for sale (downsizing) and a lower propensity of London & SE properties to sell causing this.

Price Reductions: Last week, 23,738 properties saw price reductions, a significant number compared to the 8-year Week 18 average of 15,069. This means 1 in 6.24 properties each month are being reduced (Long term average 1 in 9.9 per month)
Average Asking Price for Reduced Properties: £415,627
Gross Sales: 27,591 properties were sold stc last week
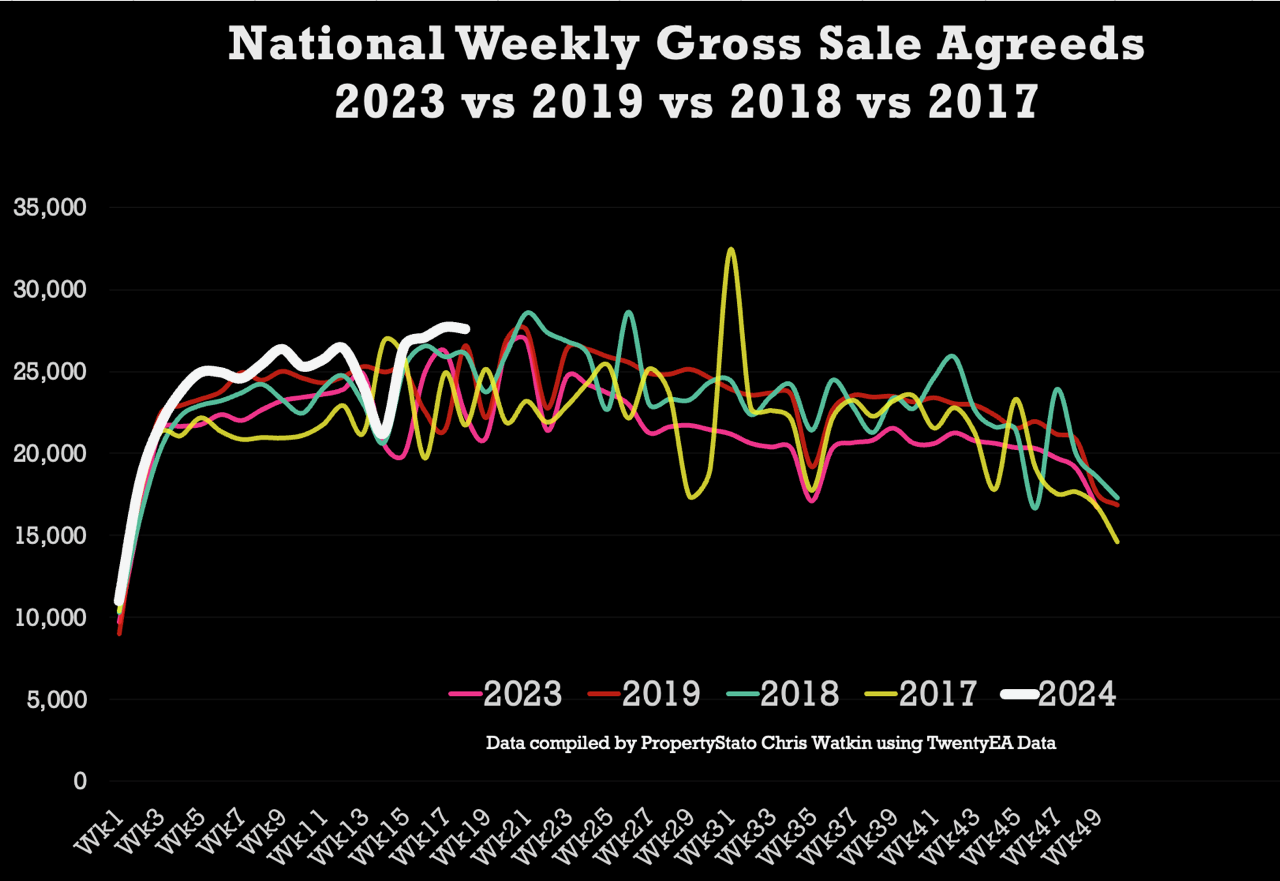
Accumulative Gross Sales YTD: The total stands at 432,520, exceeding the average of 399,913 from 17/18/19 and 390,481 in the same week 18 in 2023.
Average Asking Price of Sold STC Properties: Still staying in the mid £300k’s range at £371,560.
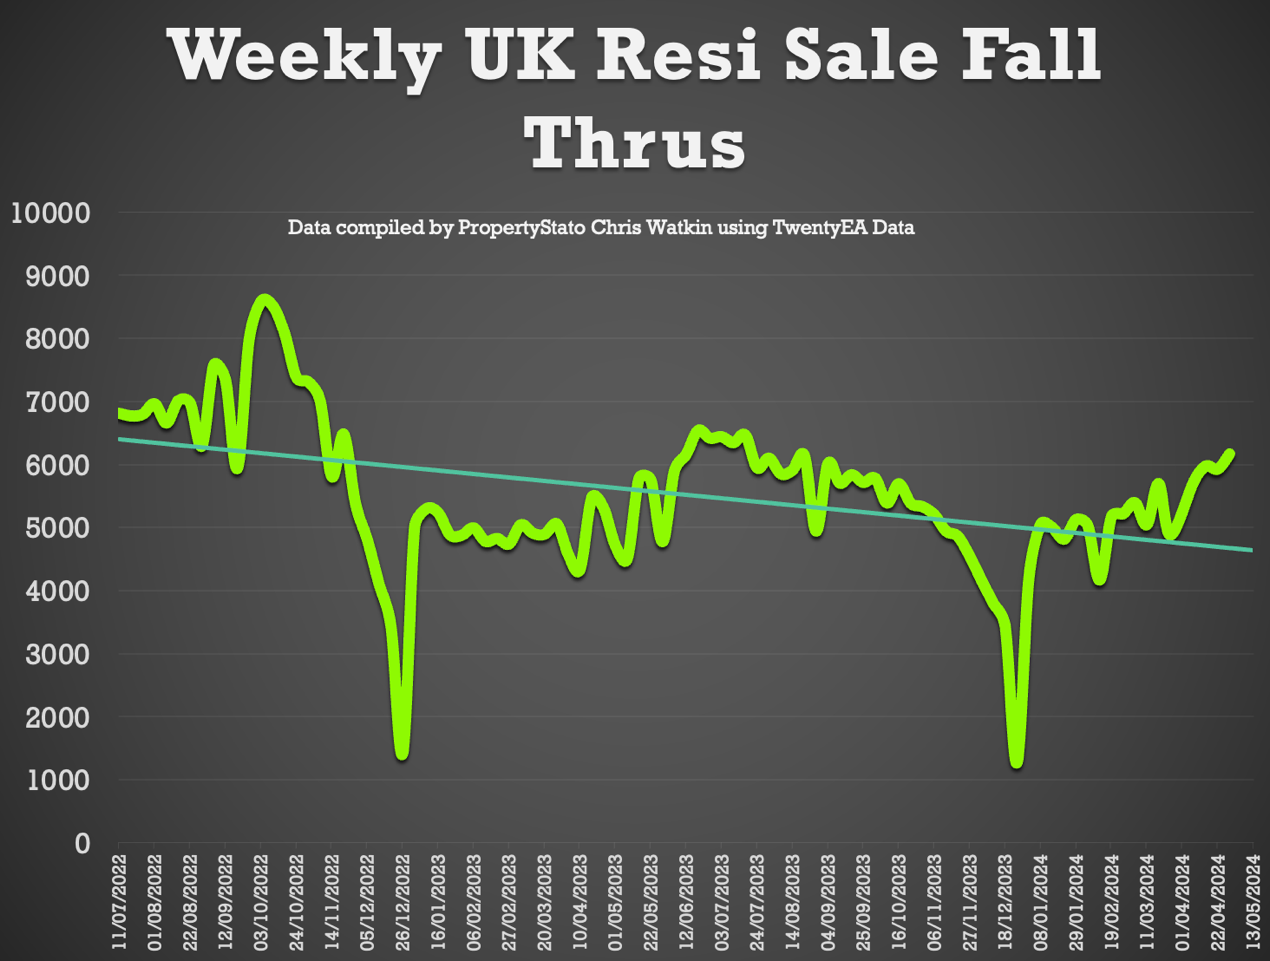
Sale Fall Throughs: Slightly higher to last week at 6,172 (yet sales pipelines are fuller). For comparison, 5,189 YTD ’24 average weekly figure (& 7,590 weekly sale fall thrus in two months after Truss Budget in Q4 2022).
Sale Fall Through Rate: Slight increase from last week, to 22.4% for the week (8 years average is 24.8%) (Remember it was 40%+ in Q4 2022).
Net Sales similar to last week’s figure at 21,419. YTD ’24 average 18,840.
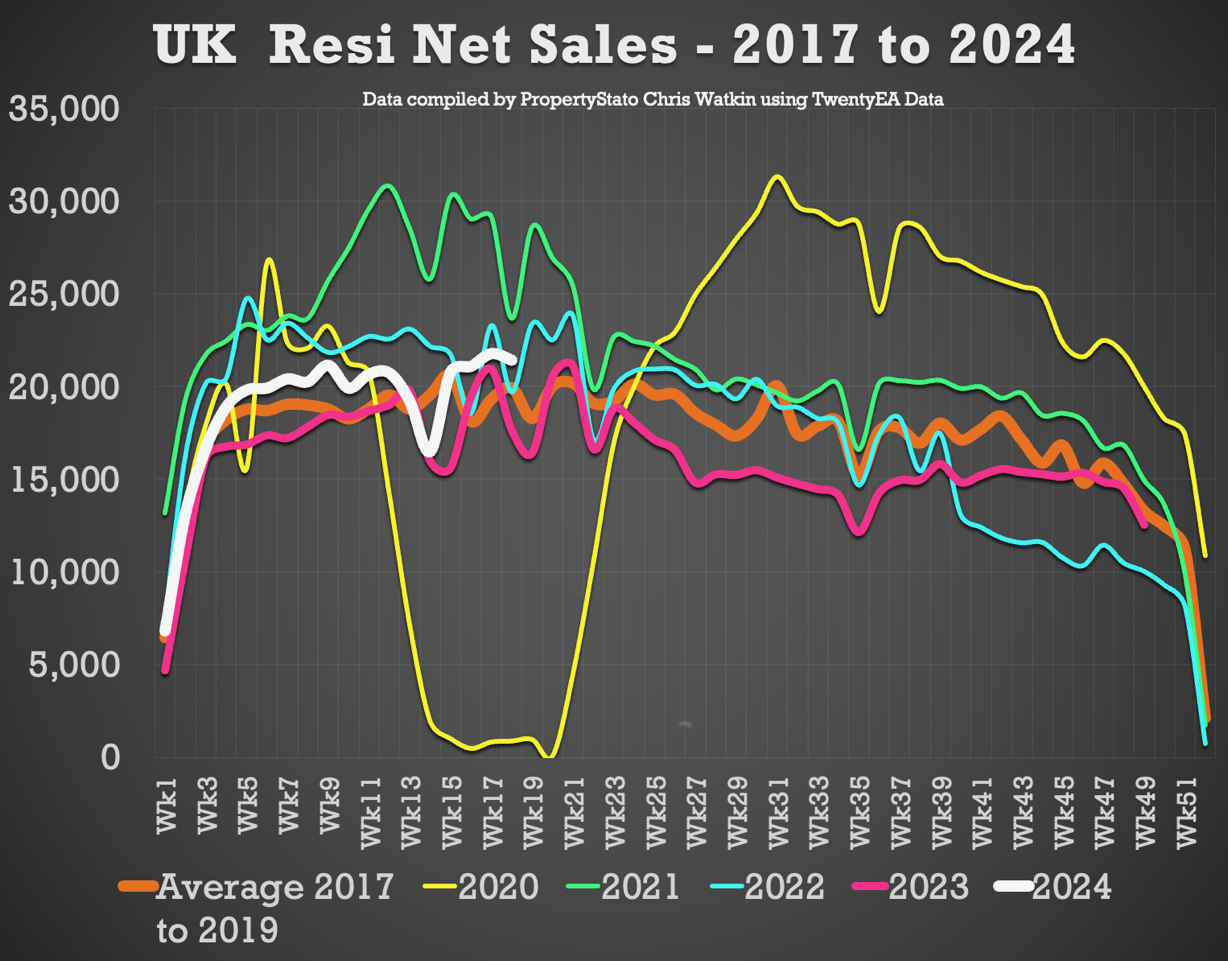
Accumulative Net Sales YTD: The total stands at 339,113, 5.4% higher the 17/18/19 YTD Net sales average (321,621) and 12.5% higher than the YTD figure for 2023 for Net Sales (2023 YTD : 301,437).