
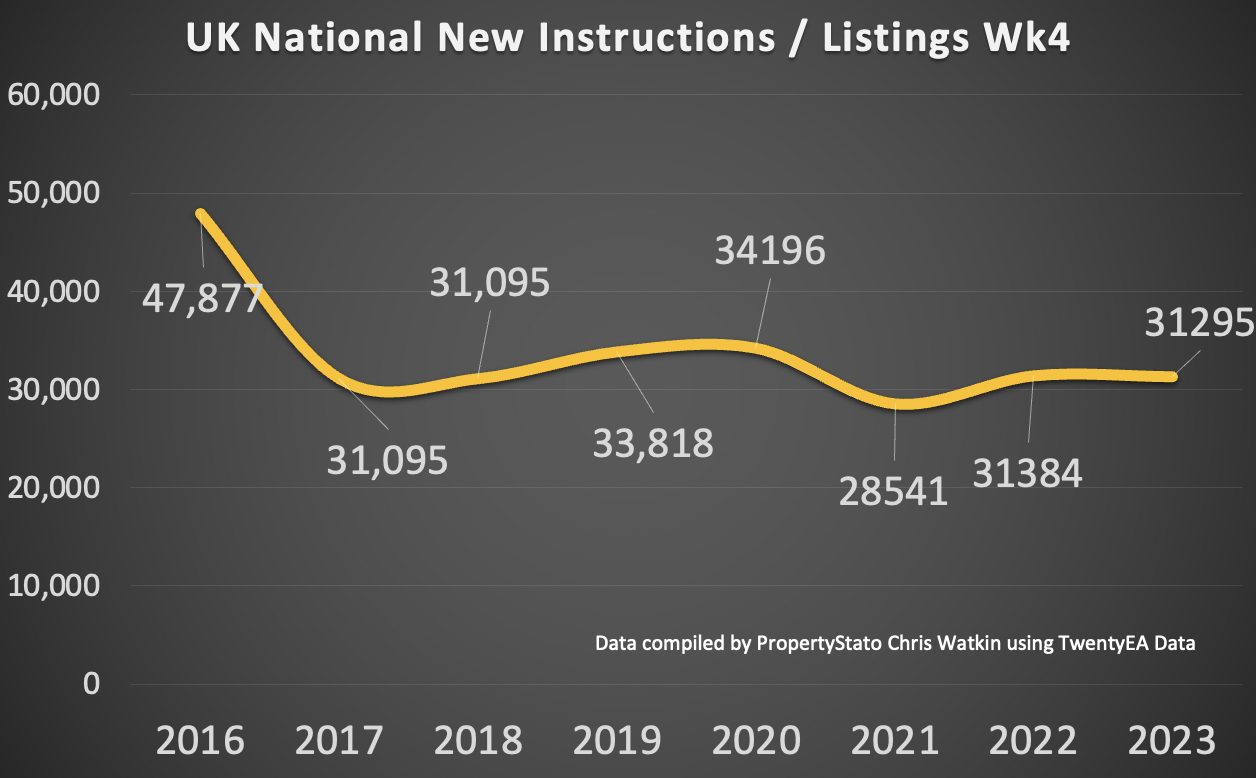
 So what really happened in the UK property market during the fourth week of January? These stats reflect on the number of properties listed, sold, sale fall throughs, price reductions, along with a wide range of other very interesting facts, as well as the thoughts of two industry veterans.
The week’s special guest is Ben Madden from London as he joins Chris Watkin, who simply loves stats, to look at and comment on some fascinating graphs, reflecting on the latest trends in the UK and regional housing market.
Watch now:











Comments (11)
Oh those lies, damn lies and exceedingly boring statistics!
Sorry Scott – so much stats and info – it’s bloody hard work to pack it into 50mins. What town are you as an agent, because each week we do a focus on the particular town at the end of the show and we could probably look at yours how well your agency is performing?
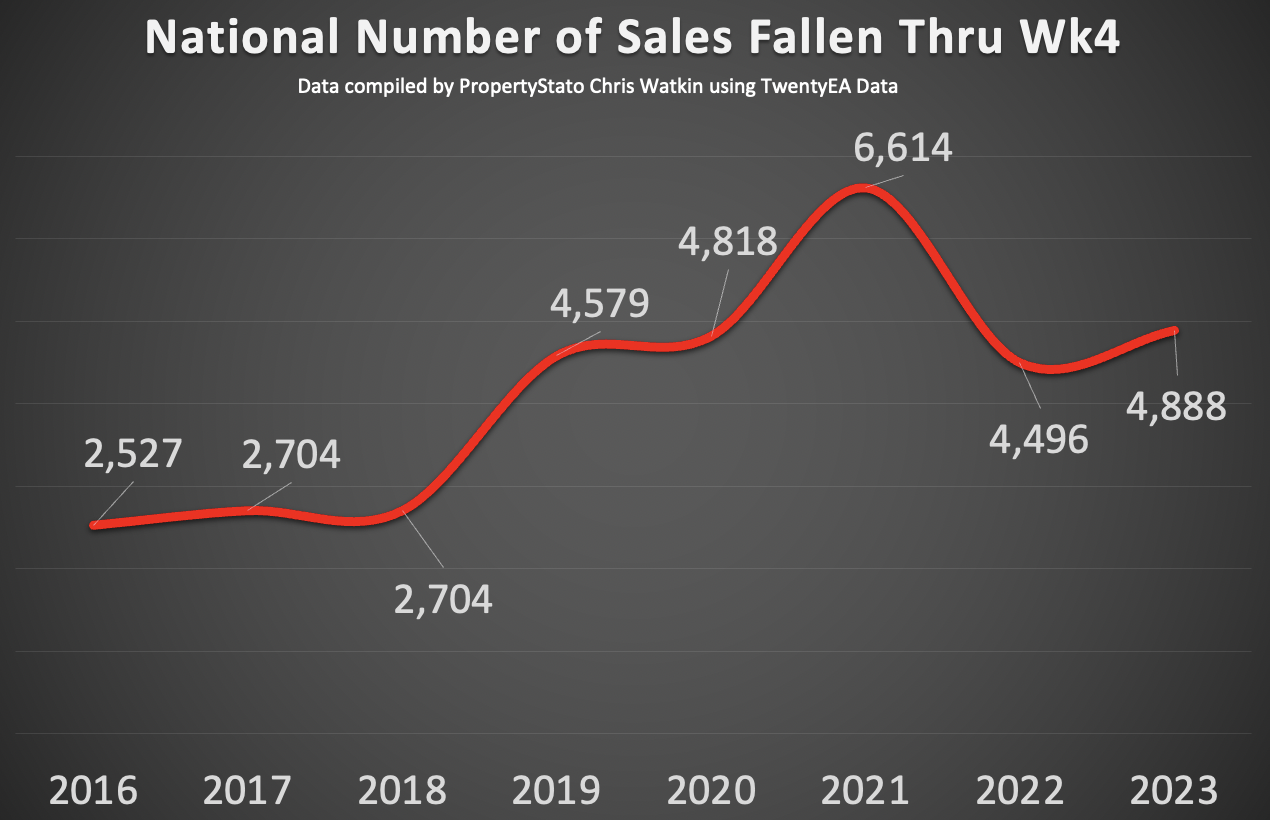
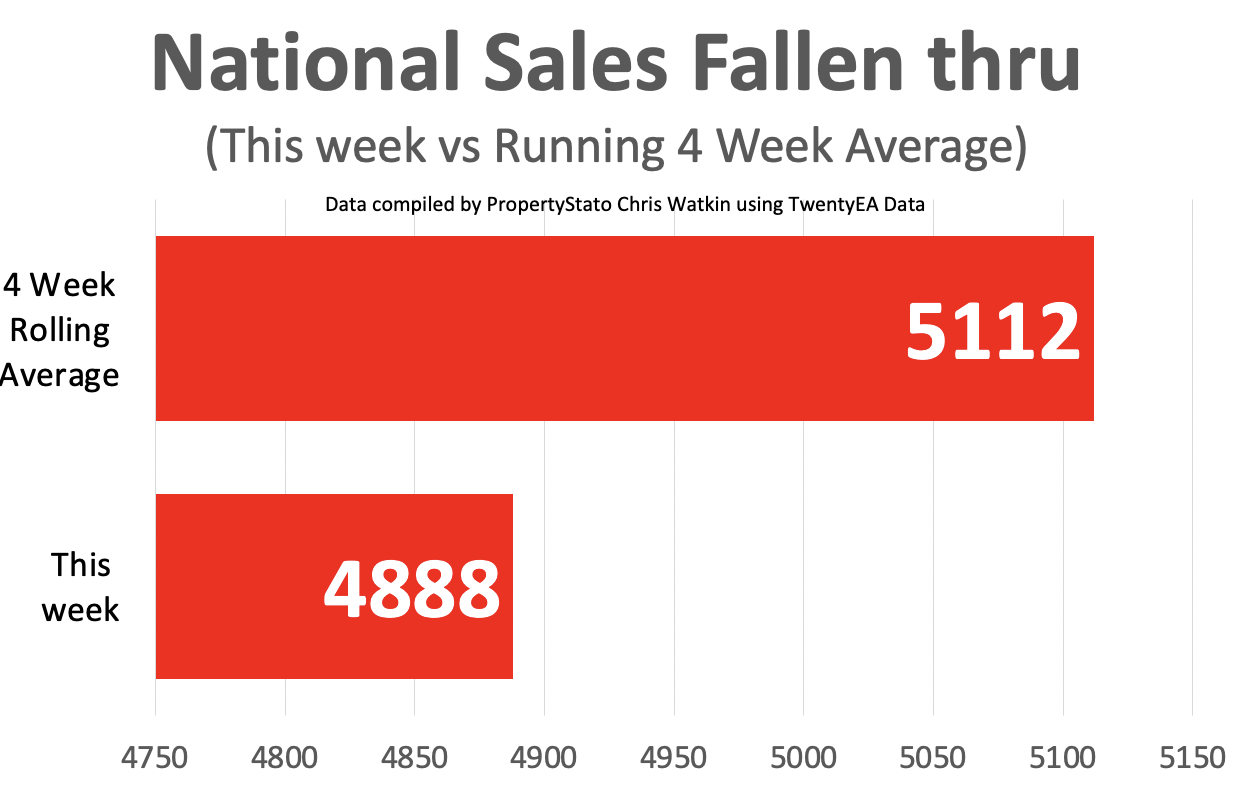
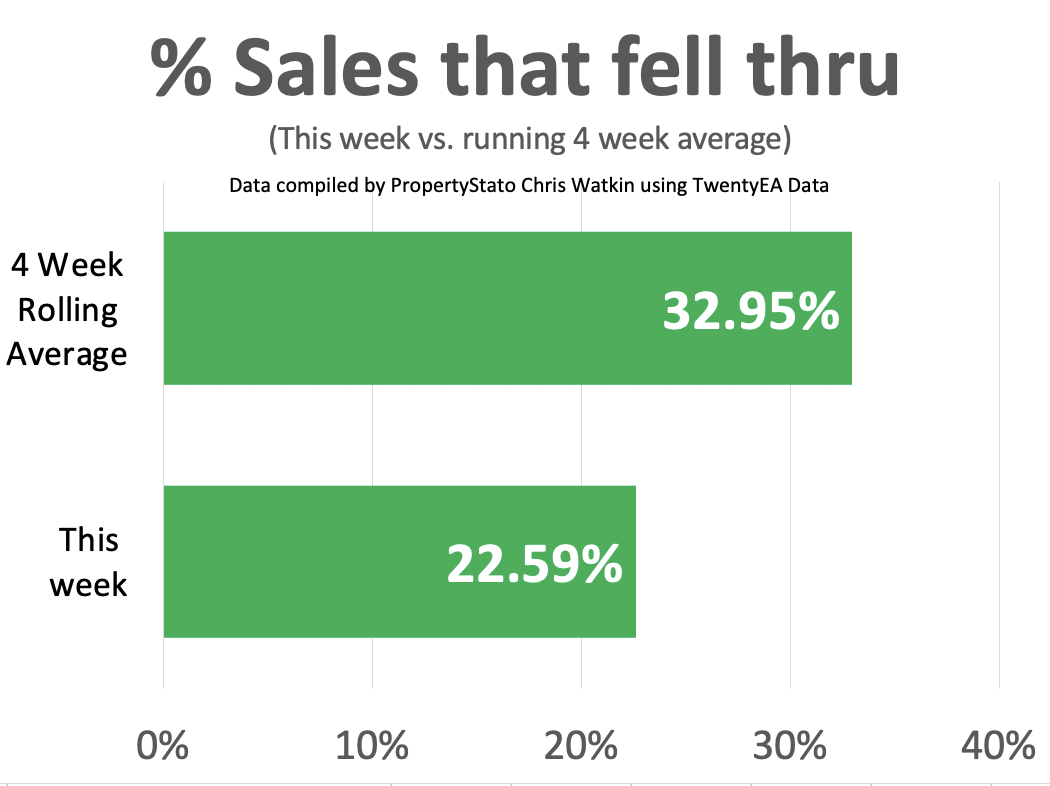
Thats all very interesting but where and how do you get the data from Chris, apart from twentyea? You say compiled that suggests you are looking a more than one set of data. How do you know for sure whats fallin thru? Is this guesswork? Also that bar chart about nat sales that have fallen thru, bit misleading? 5112 vs 4888 that bottom bar should be much bigger. All ver well claiming to be a statto but looking at this it jutst looks like youve taken a press release from twentyea?
Scott – have you watched the the YouTube show itself? The graphs in isollation on tell one side of the story. In the video I explain the data sources and where they came from.
I certainly haven’t taken a press release – this has taken 40+ hours to achieve before I started doing the shows and now about an hour each week to prepare each individual show
I think its only fair you watch the show (as those graphs come that) – and then report back your thoughts.
All constructive feedback is most welcome and I look forward to your thoughts – good and constructive
Thank you again for your comment
Chris
PS I agree the graph you mention has a scale at the bottom of it …and yes I have changed the others – not that one – I will sort going forward.
I dont have 50 odd mins to watch a video Chris. Would be better in future if all this is easier to read in 5 mins between vals.
Cancellations (fall thrus) and exchanges?
Leave it with me Richard
I think these stats are great but we could also do with seeing cumulative stats for each year as well as individual weekly stats…..so eg total number of instructions for the year to the end of week 4 for each year
That’s great idea Richard – I will make it happen
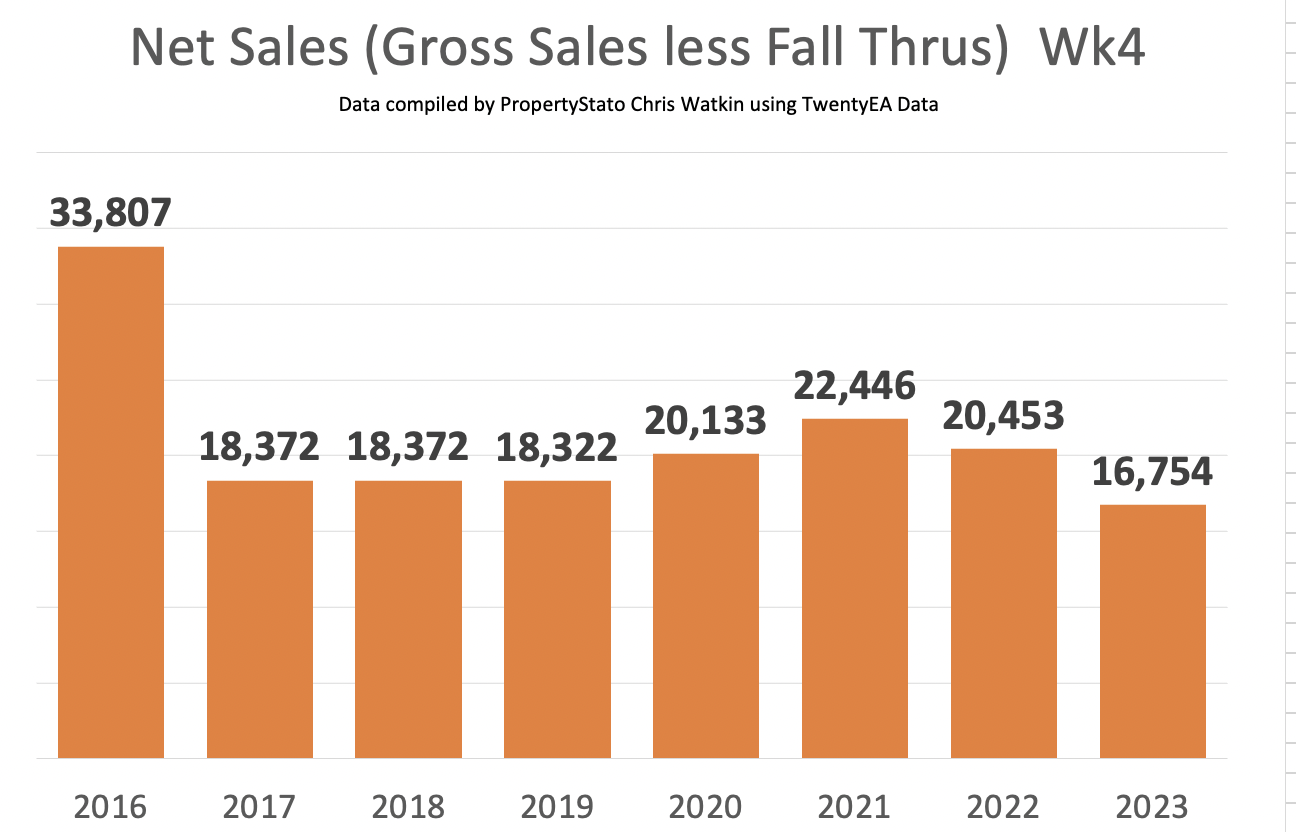
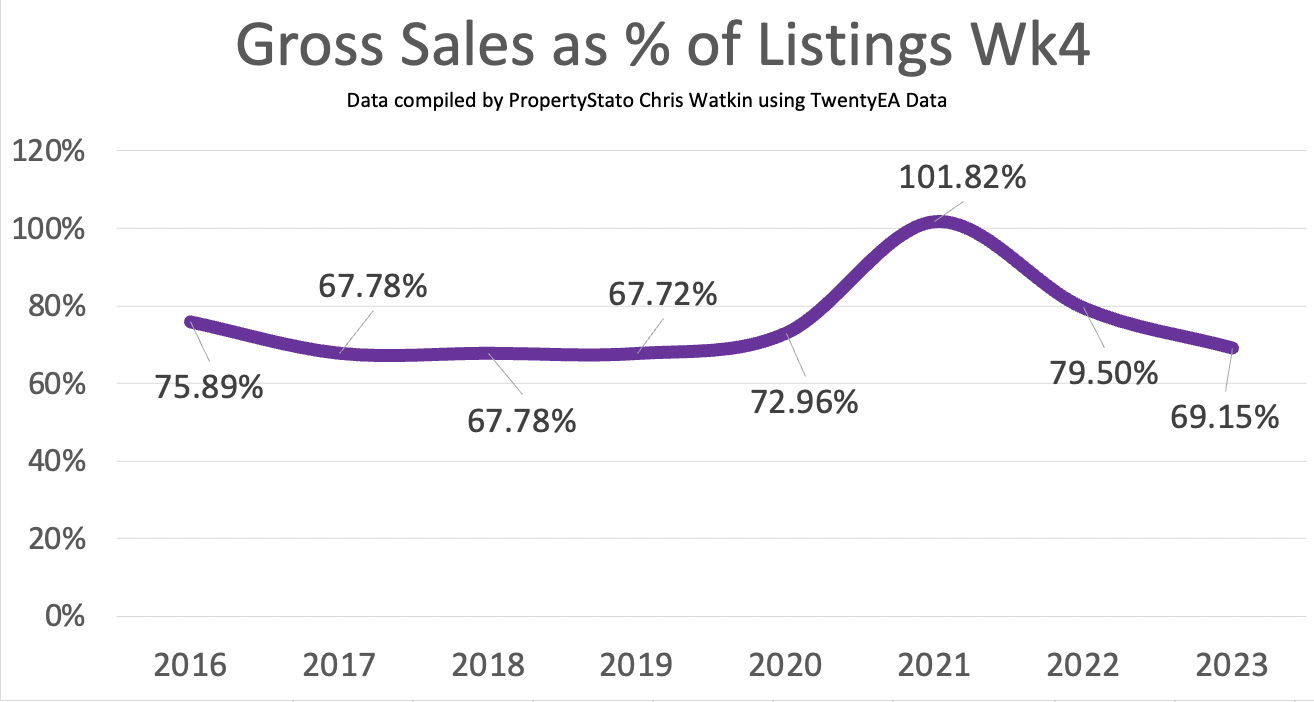
Richard – Listings, net Sales and Gross Sales by Ok – anything else?
Headlines if you don’t want to watch the show
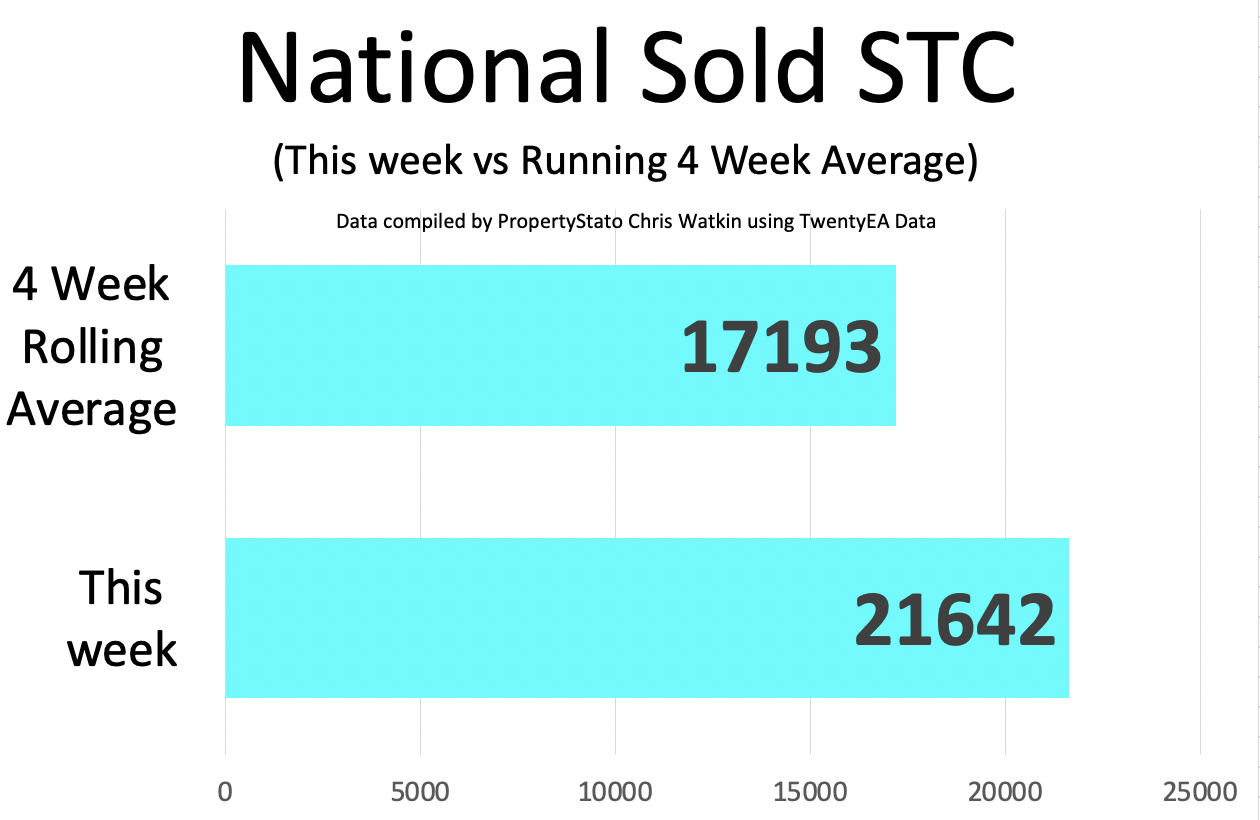
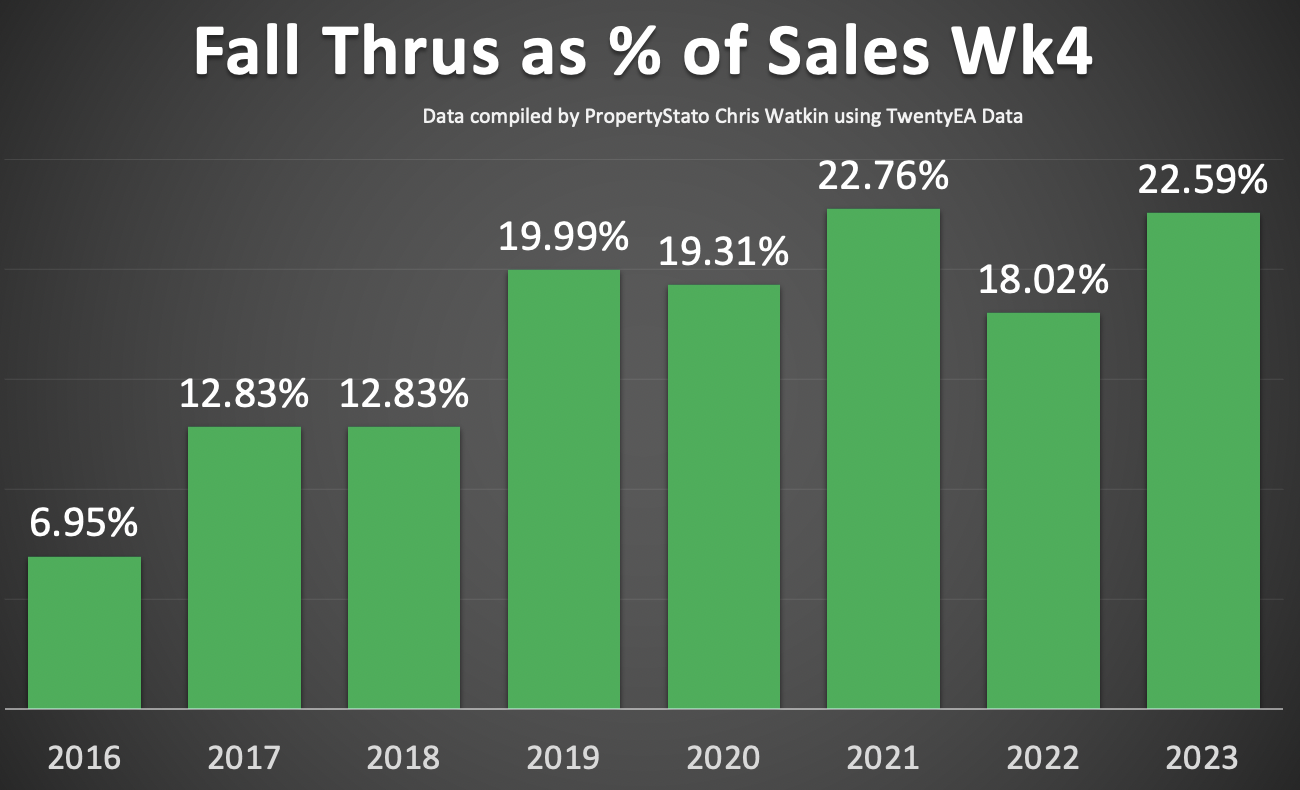
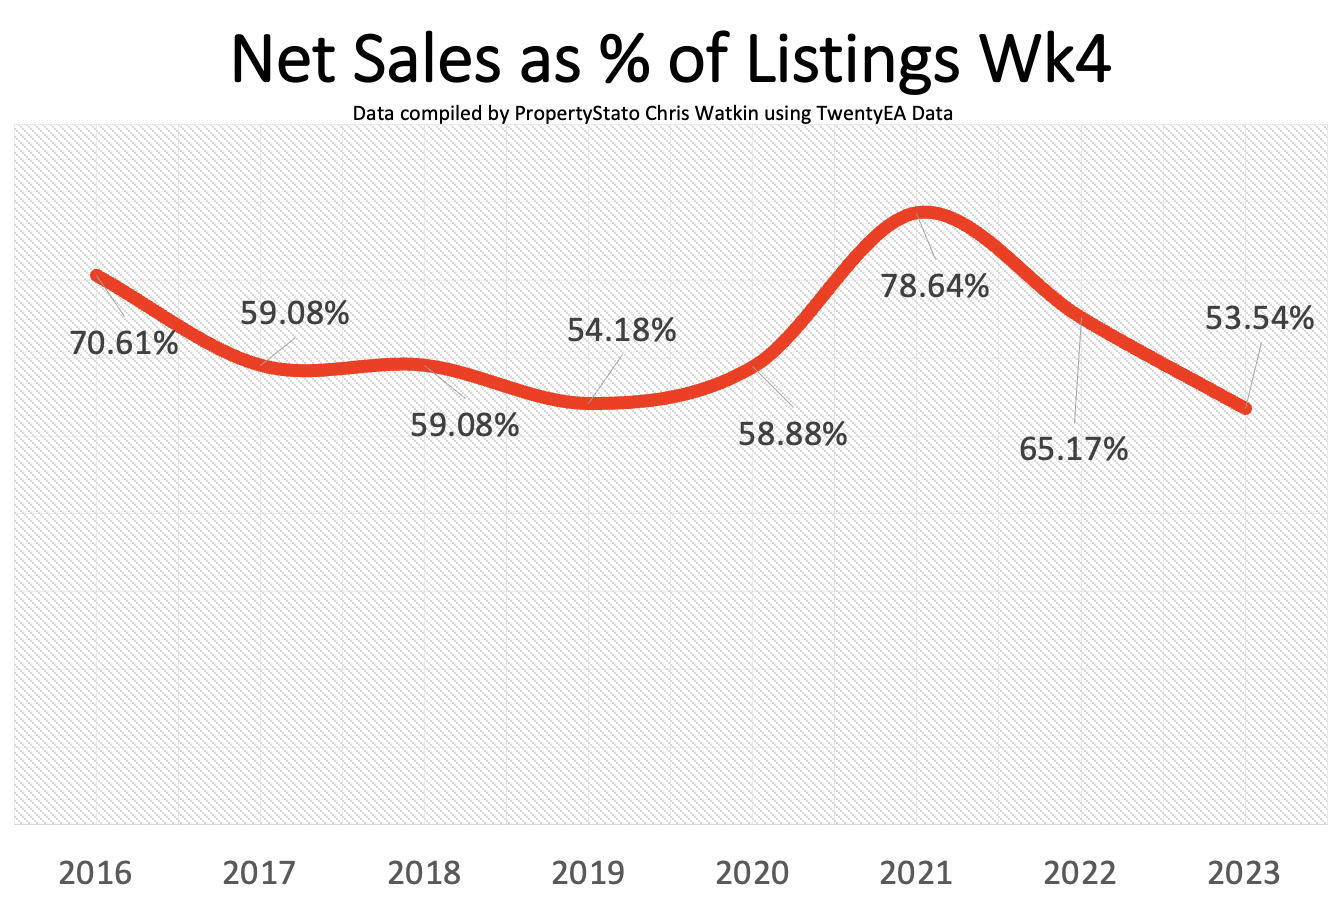
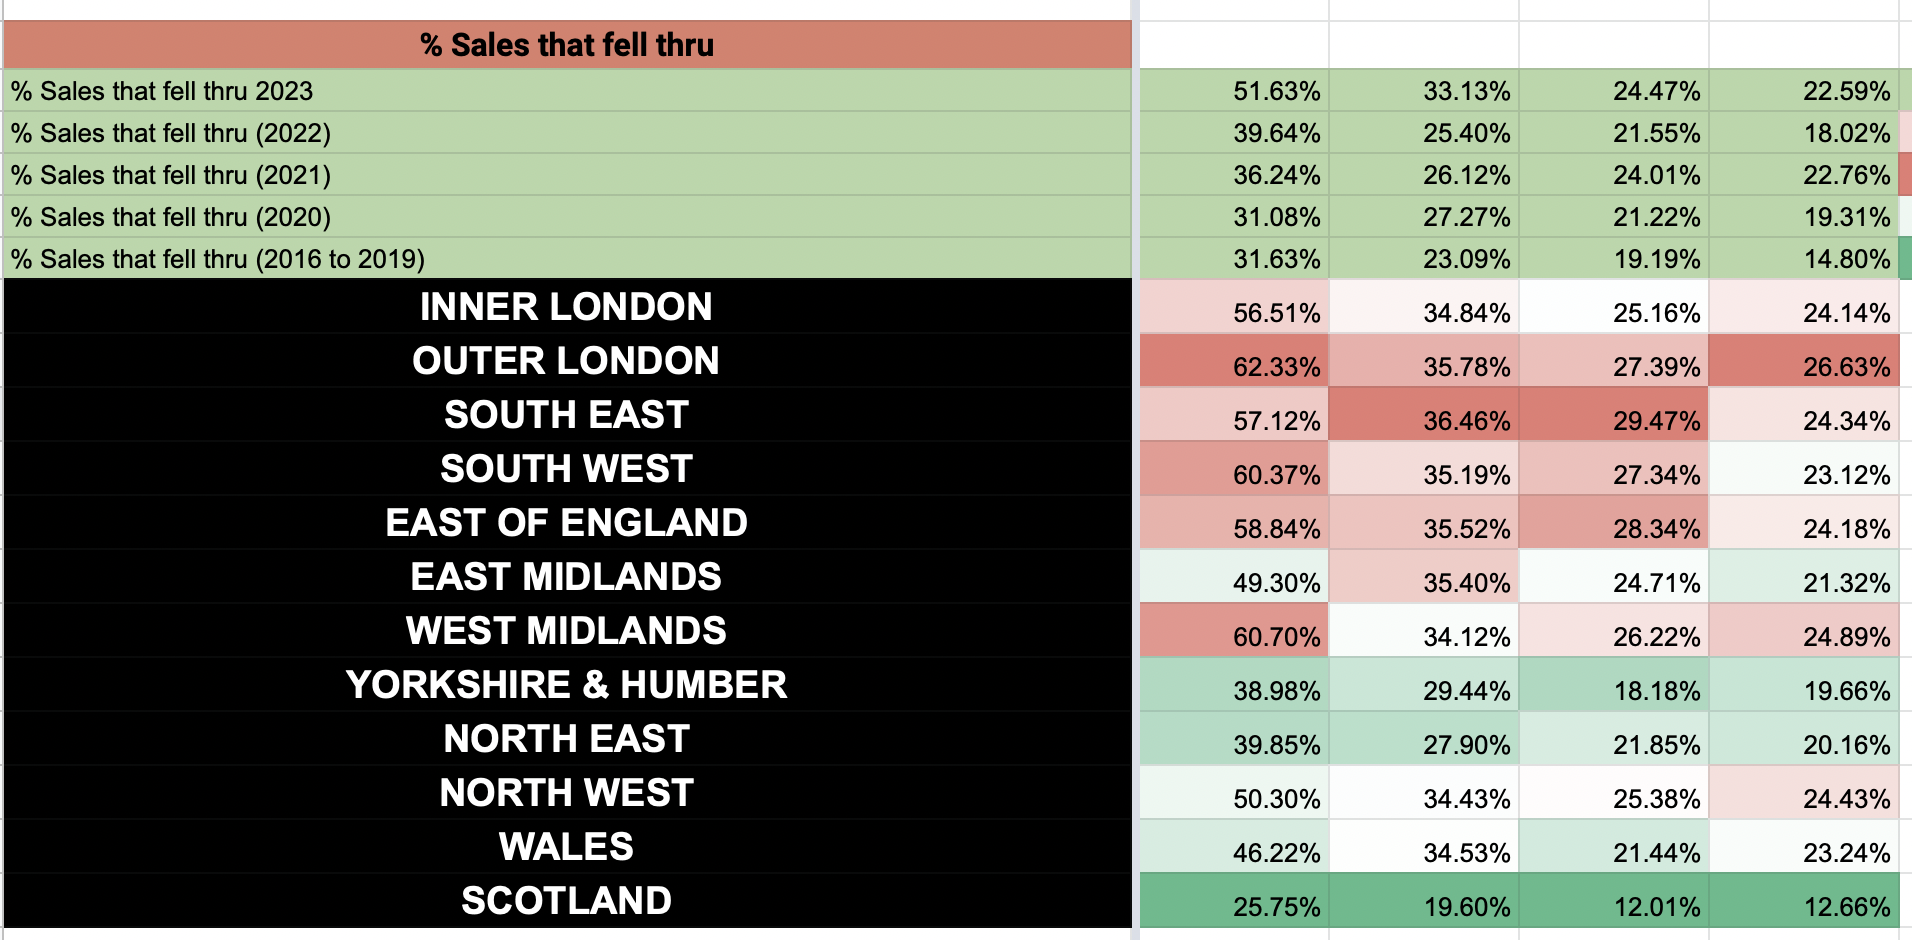
1️⃣ Resi Sales continue to be strong, yet fall thrus are denting net sales.
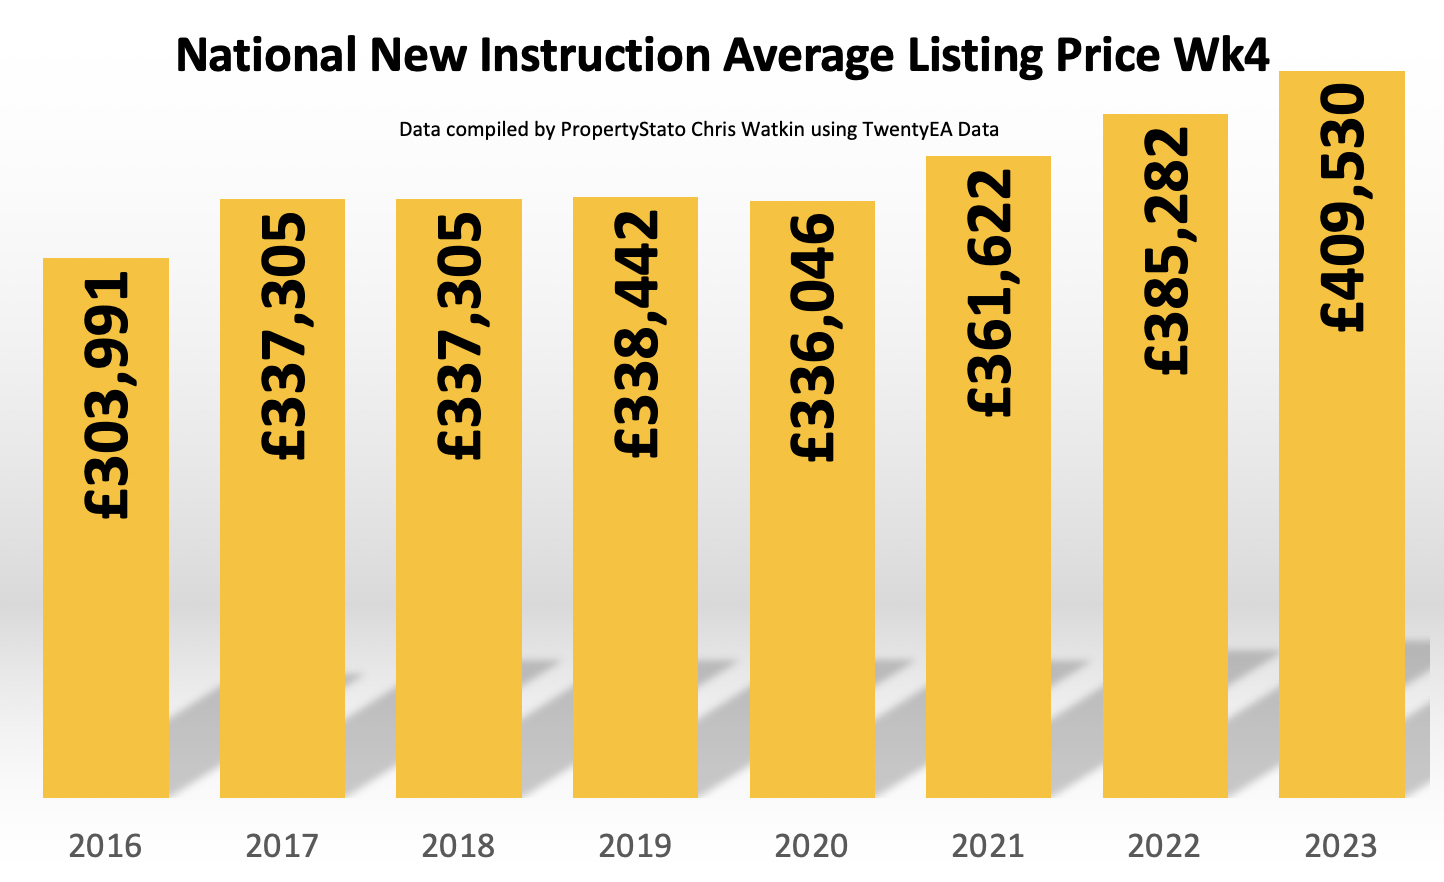
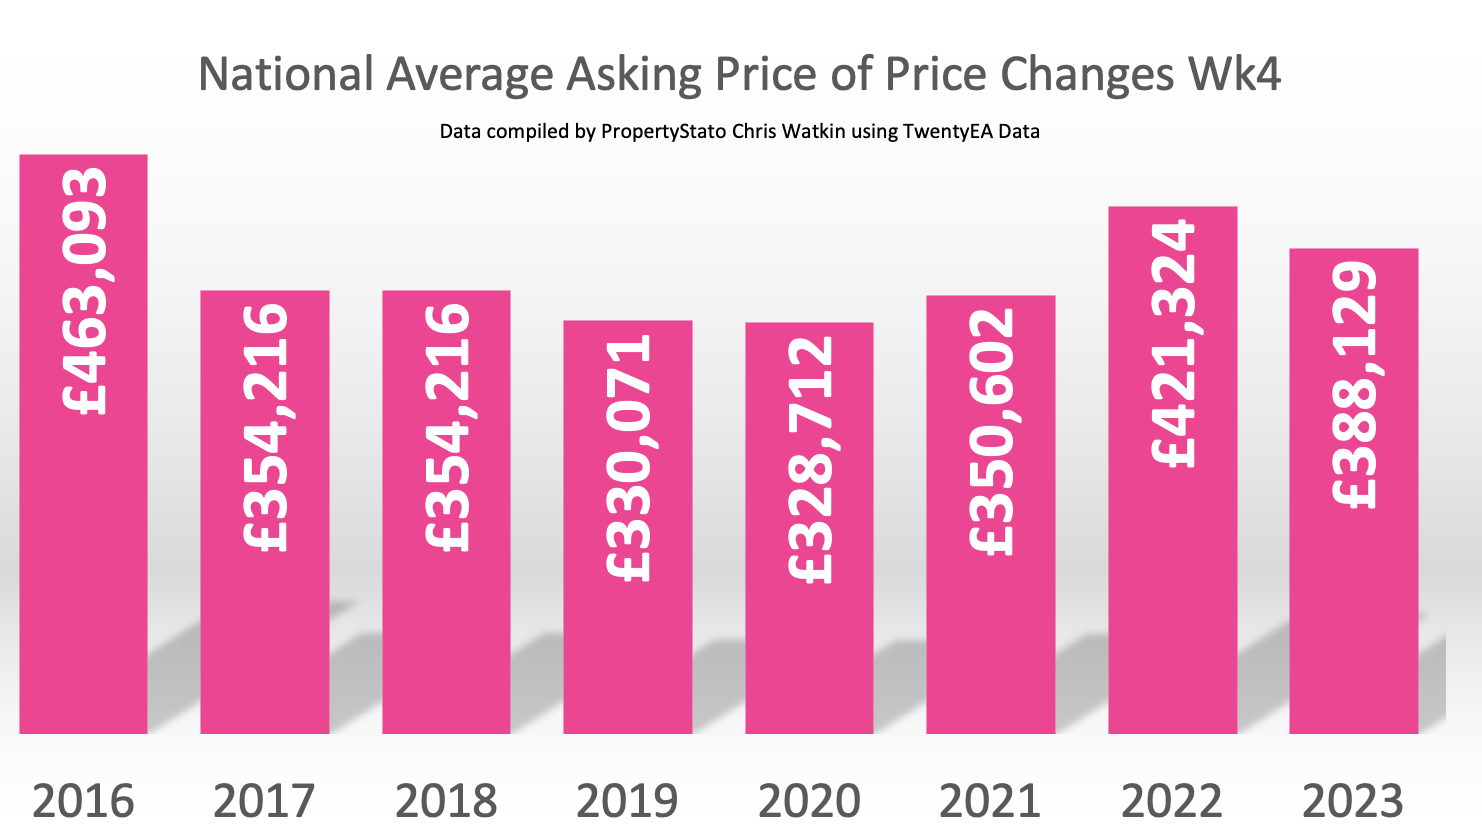
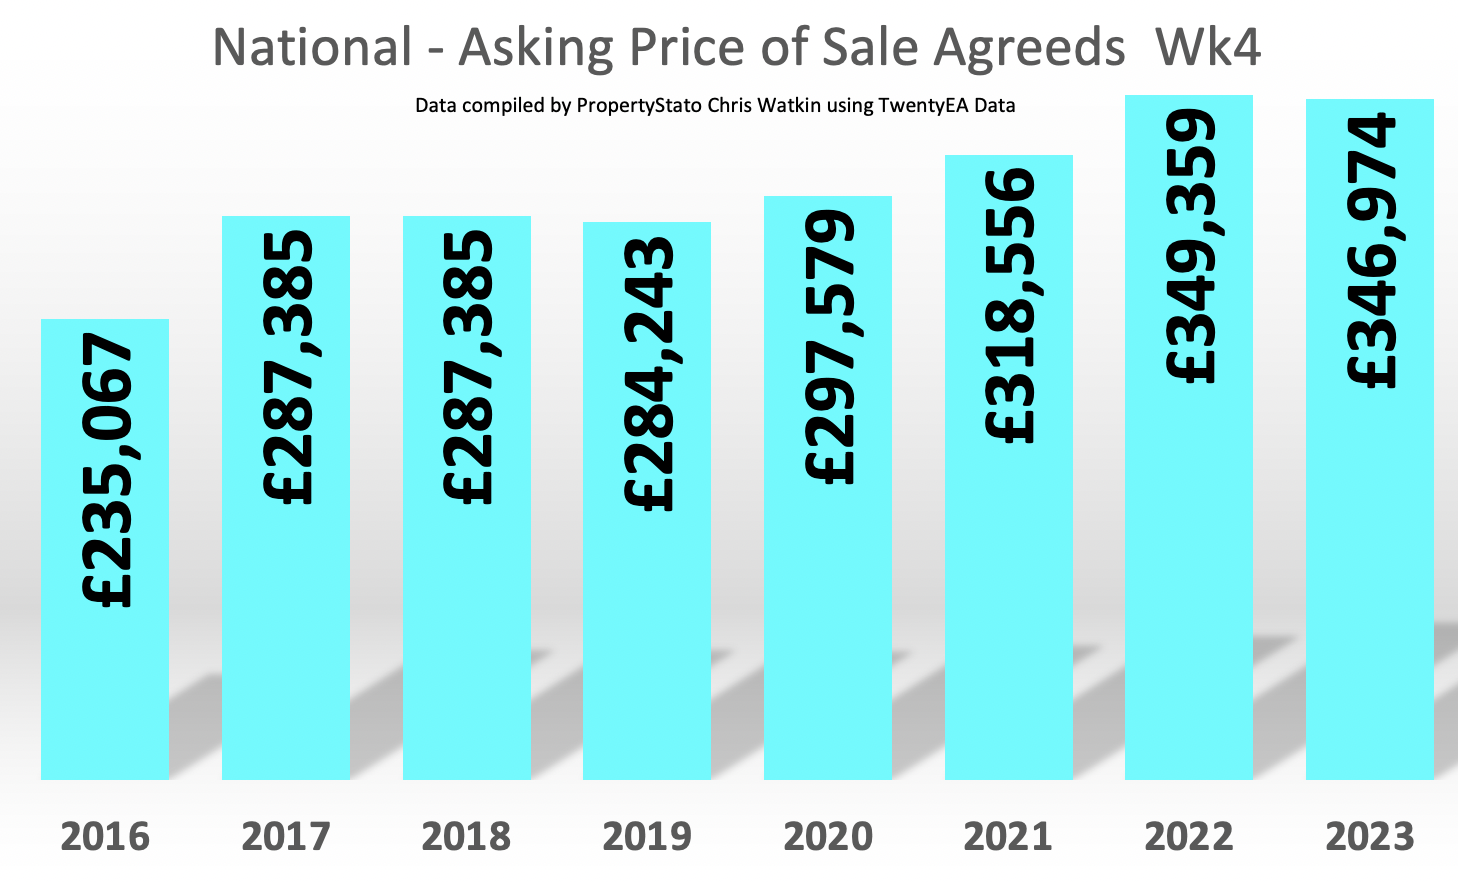
2️⃣ Still a concerning mismatch / gap of the what is coming on the market price wise (£409k) vs what is selling (£347k) – yet could be explained by regional differences and London pulling those figures apart
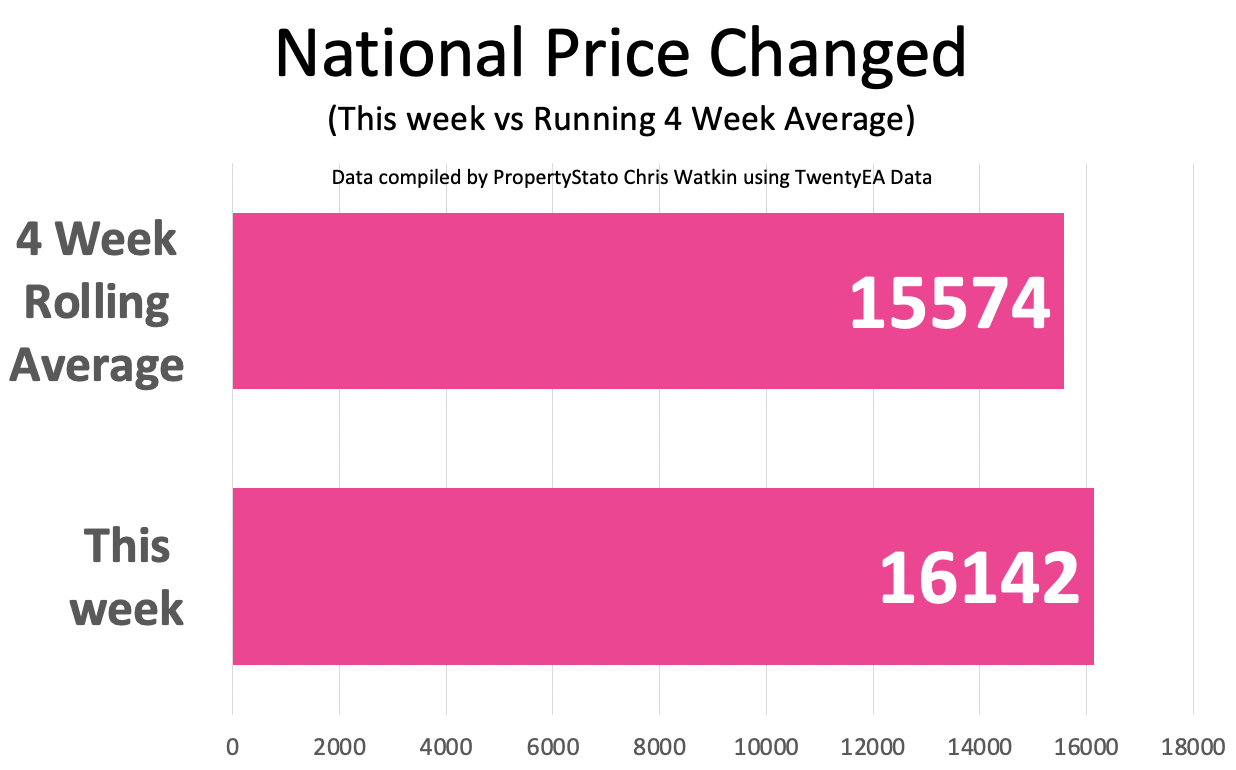
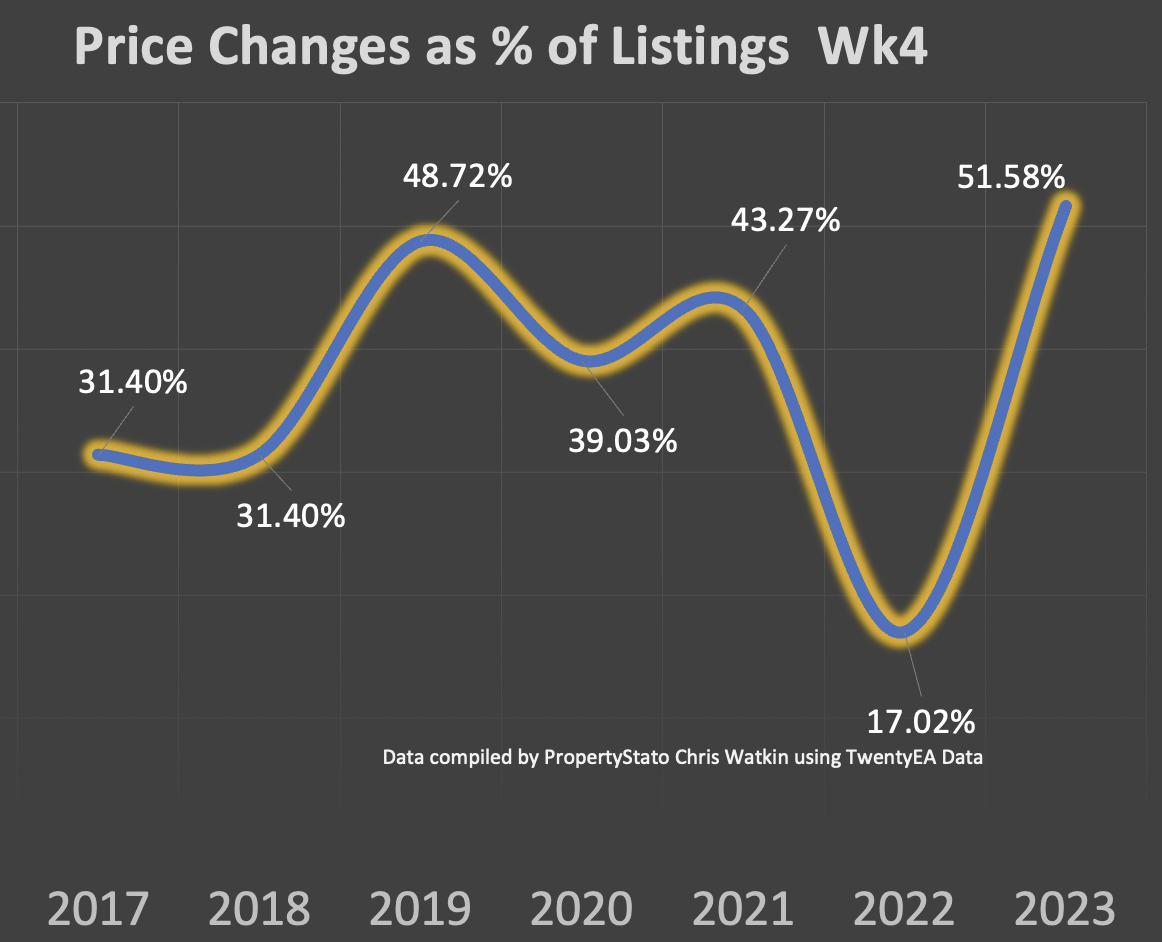
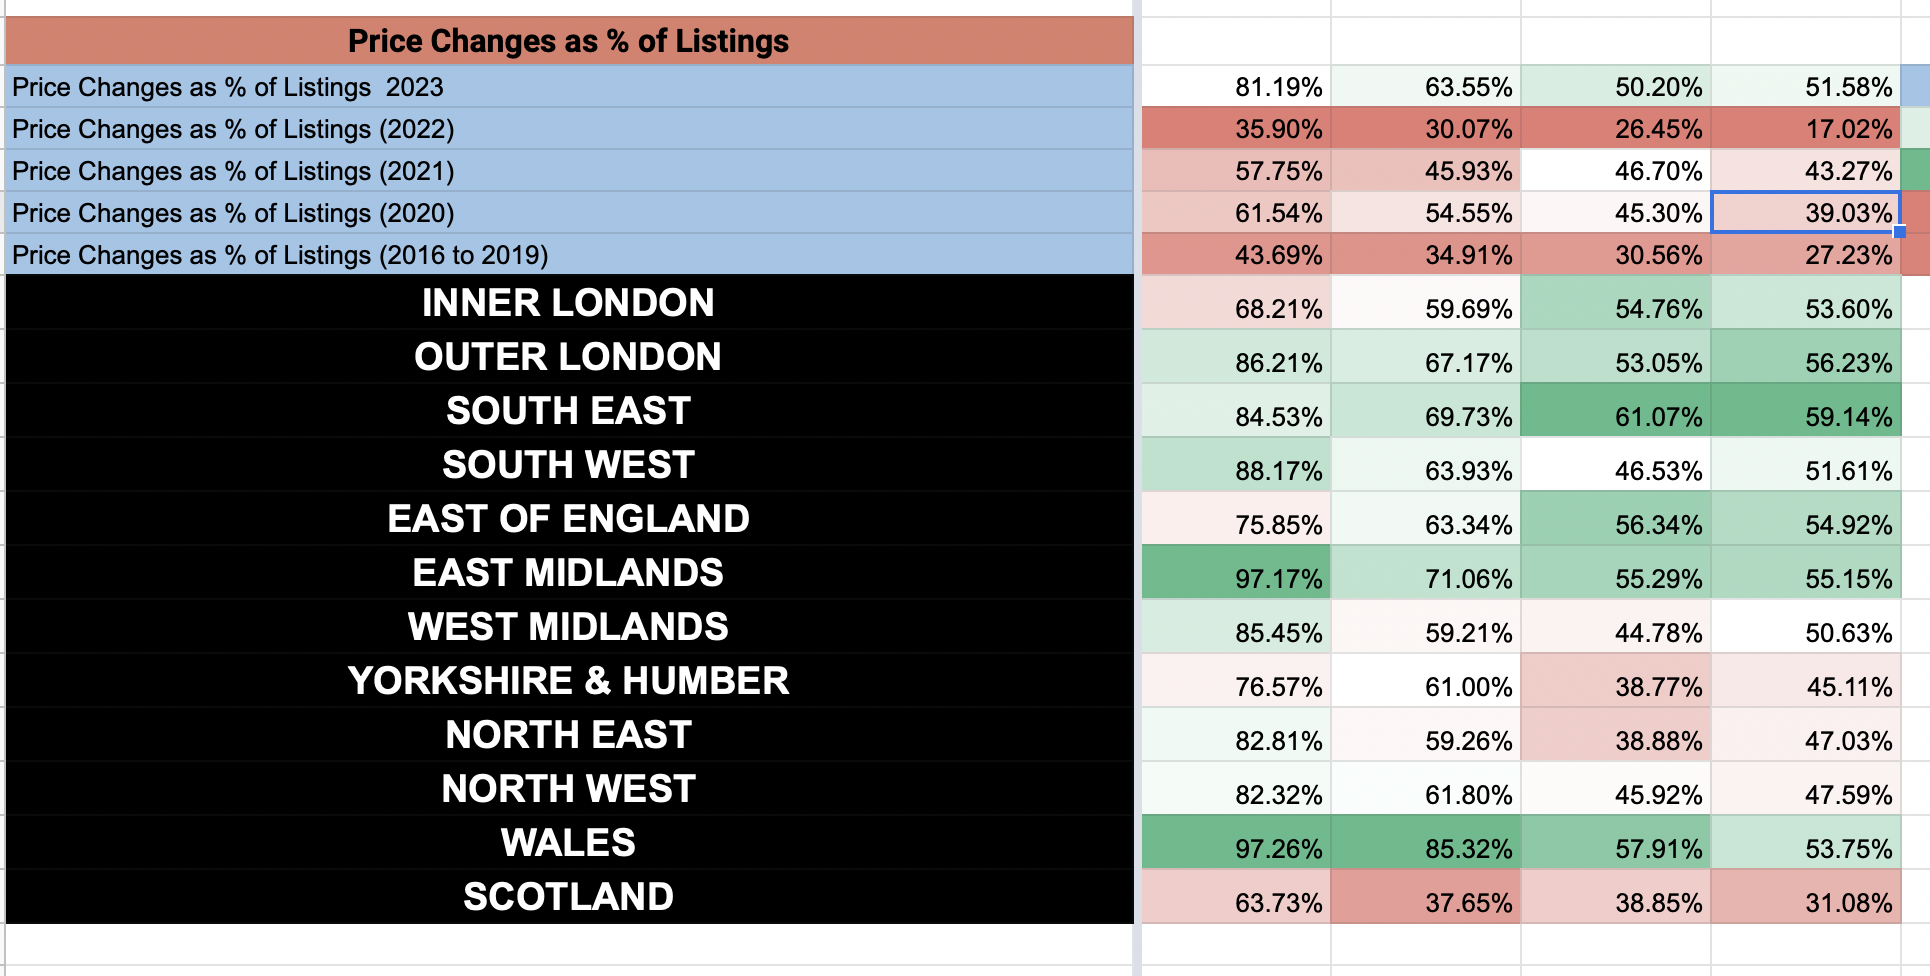
3️⃣ Agents working their stock with decent levels of price reductions
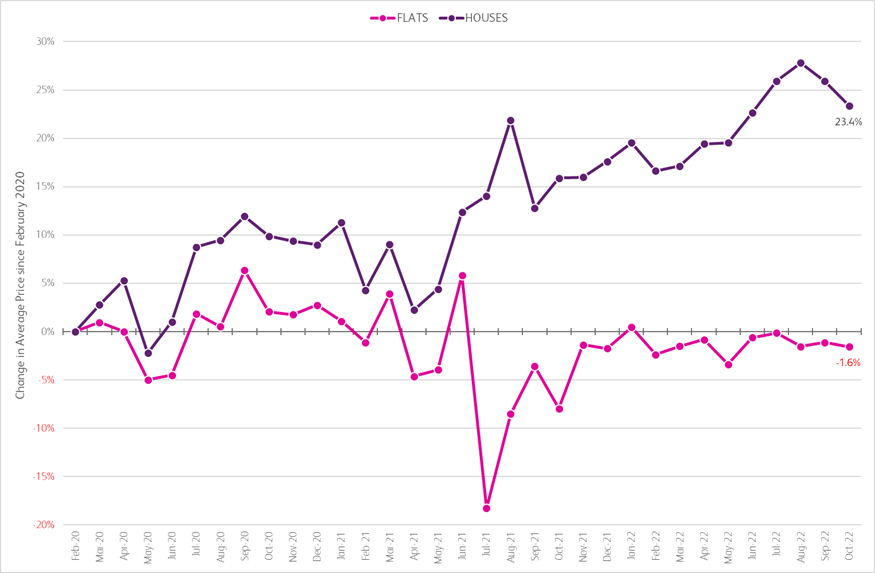
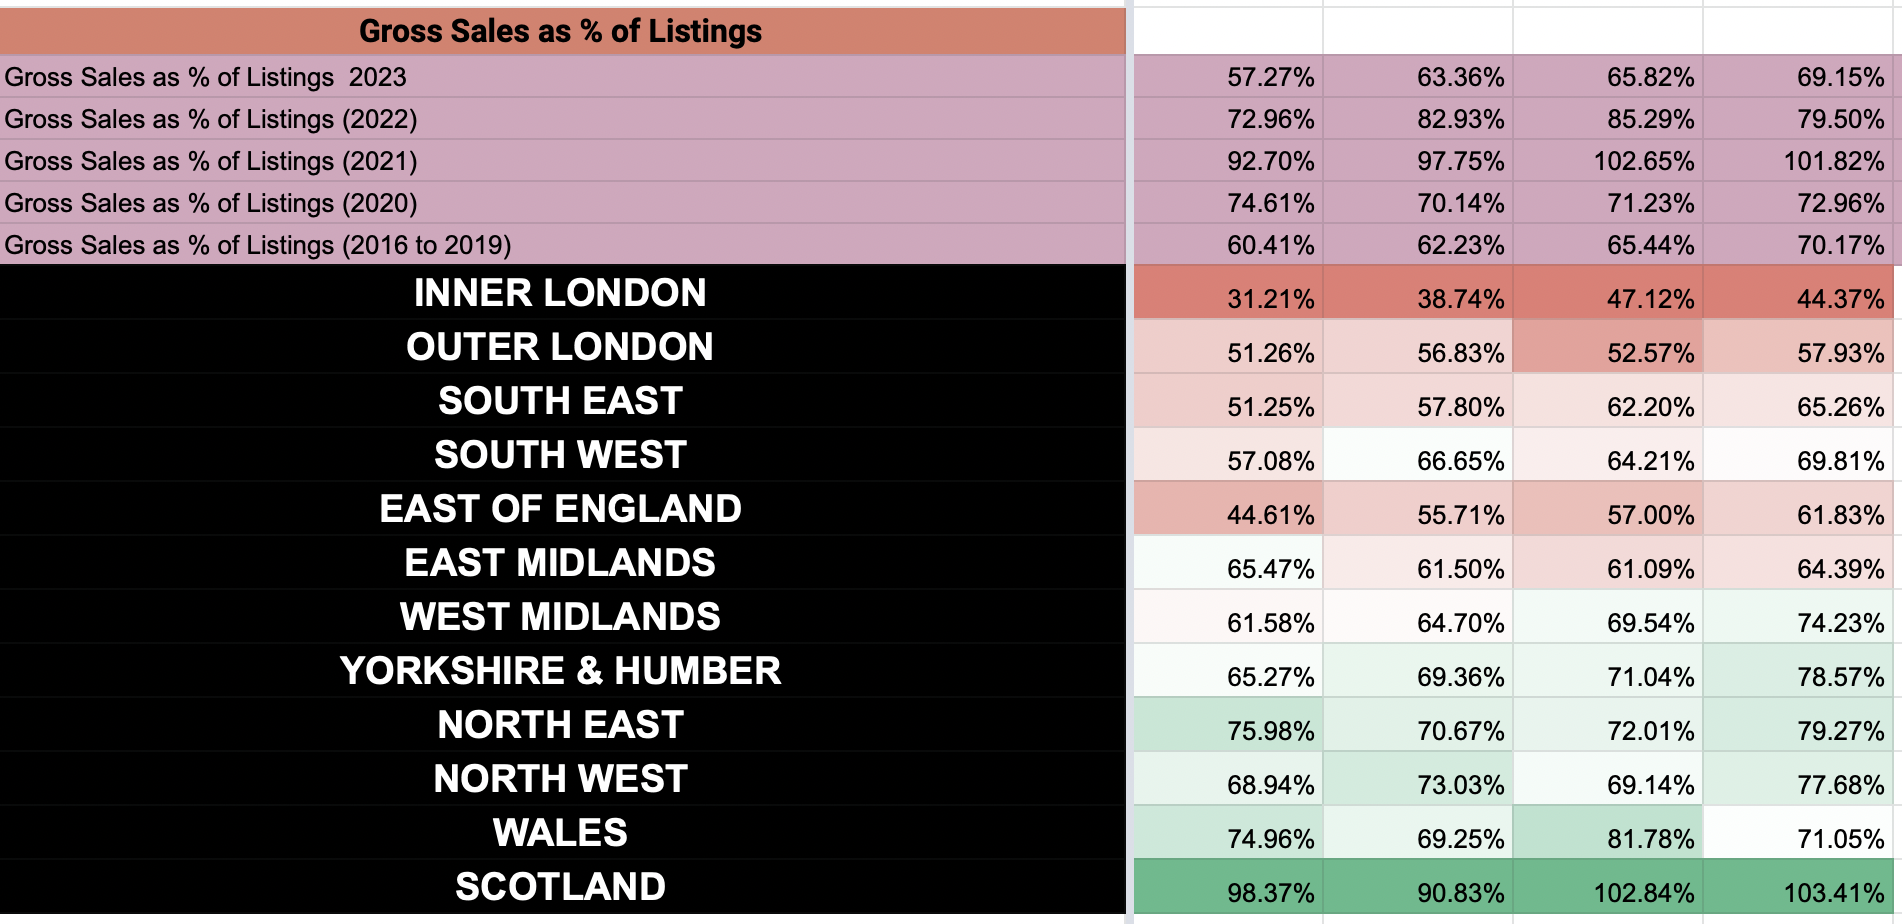
4️⃣ Huge differences between the regions in the UK and their performances.
Also, as an added bonus, this week’s local spot is on the Brighton property market where we look at who are the best agents in that town and how they perfom