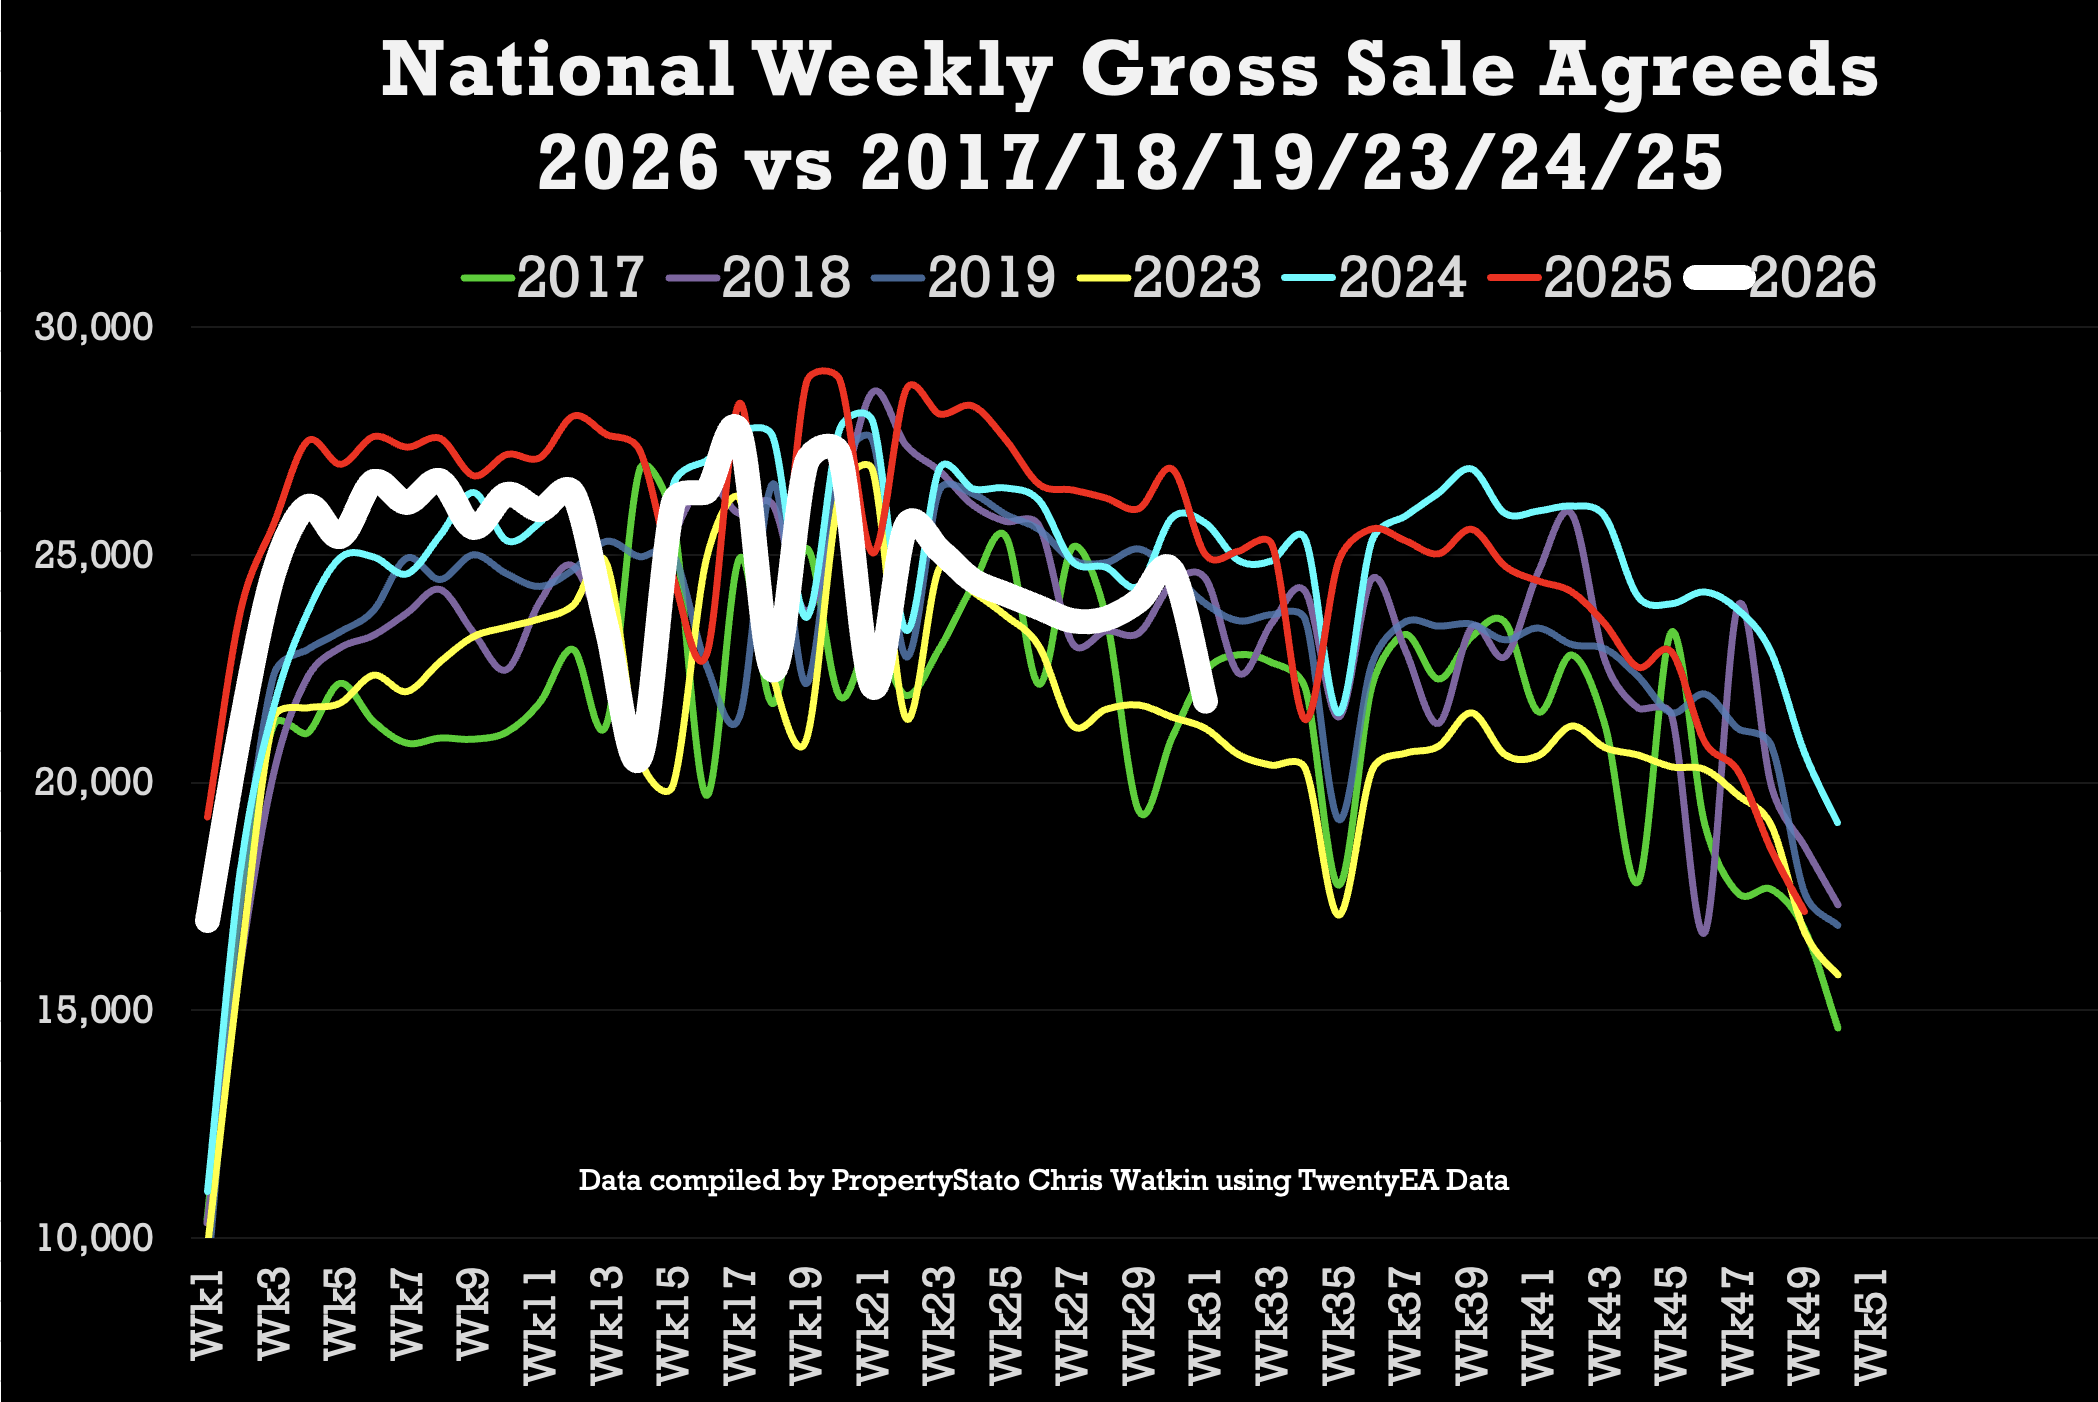
The biggest talking point in the UK property market this week is the 11% drop in sales agreed from last week. Some summer softening is perfectly normal, but the size of this week’s fall was slightly unexpected, particularly after the previous two weeks had been unusually strong and had bucked the normal seasonal trend.
So, is this simply the summer holidays finally catching up with the market, or are we seeing the start of something more significant? One week certainly does not make a trend, especially after those two stronger weeks, but it is exactly the sort of movement that estate agents, sellers and buyers should be watching closely.
This week I am joined by Ian McKenzie from The Guild of Property Professionals to dig beneath the headline numbers in the YouTube video report. We look at listings, stock levels, price reductions, sales agreed, exchanges and withdrawals, before heading to Eastbourne to put its estate agents under the microscope using cold, hard performance data.
So, here are the main stats for UK Property Market Stats for week 31, week ending 9th August 2026.
Listings
Week 31…
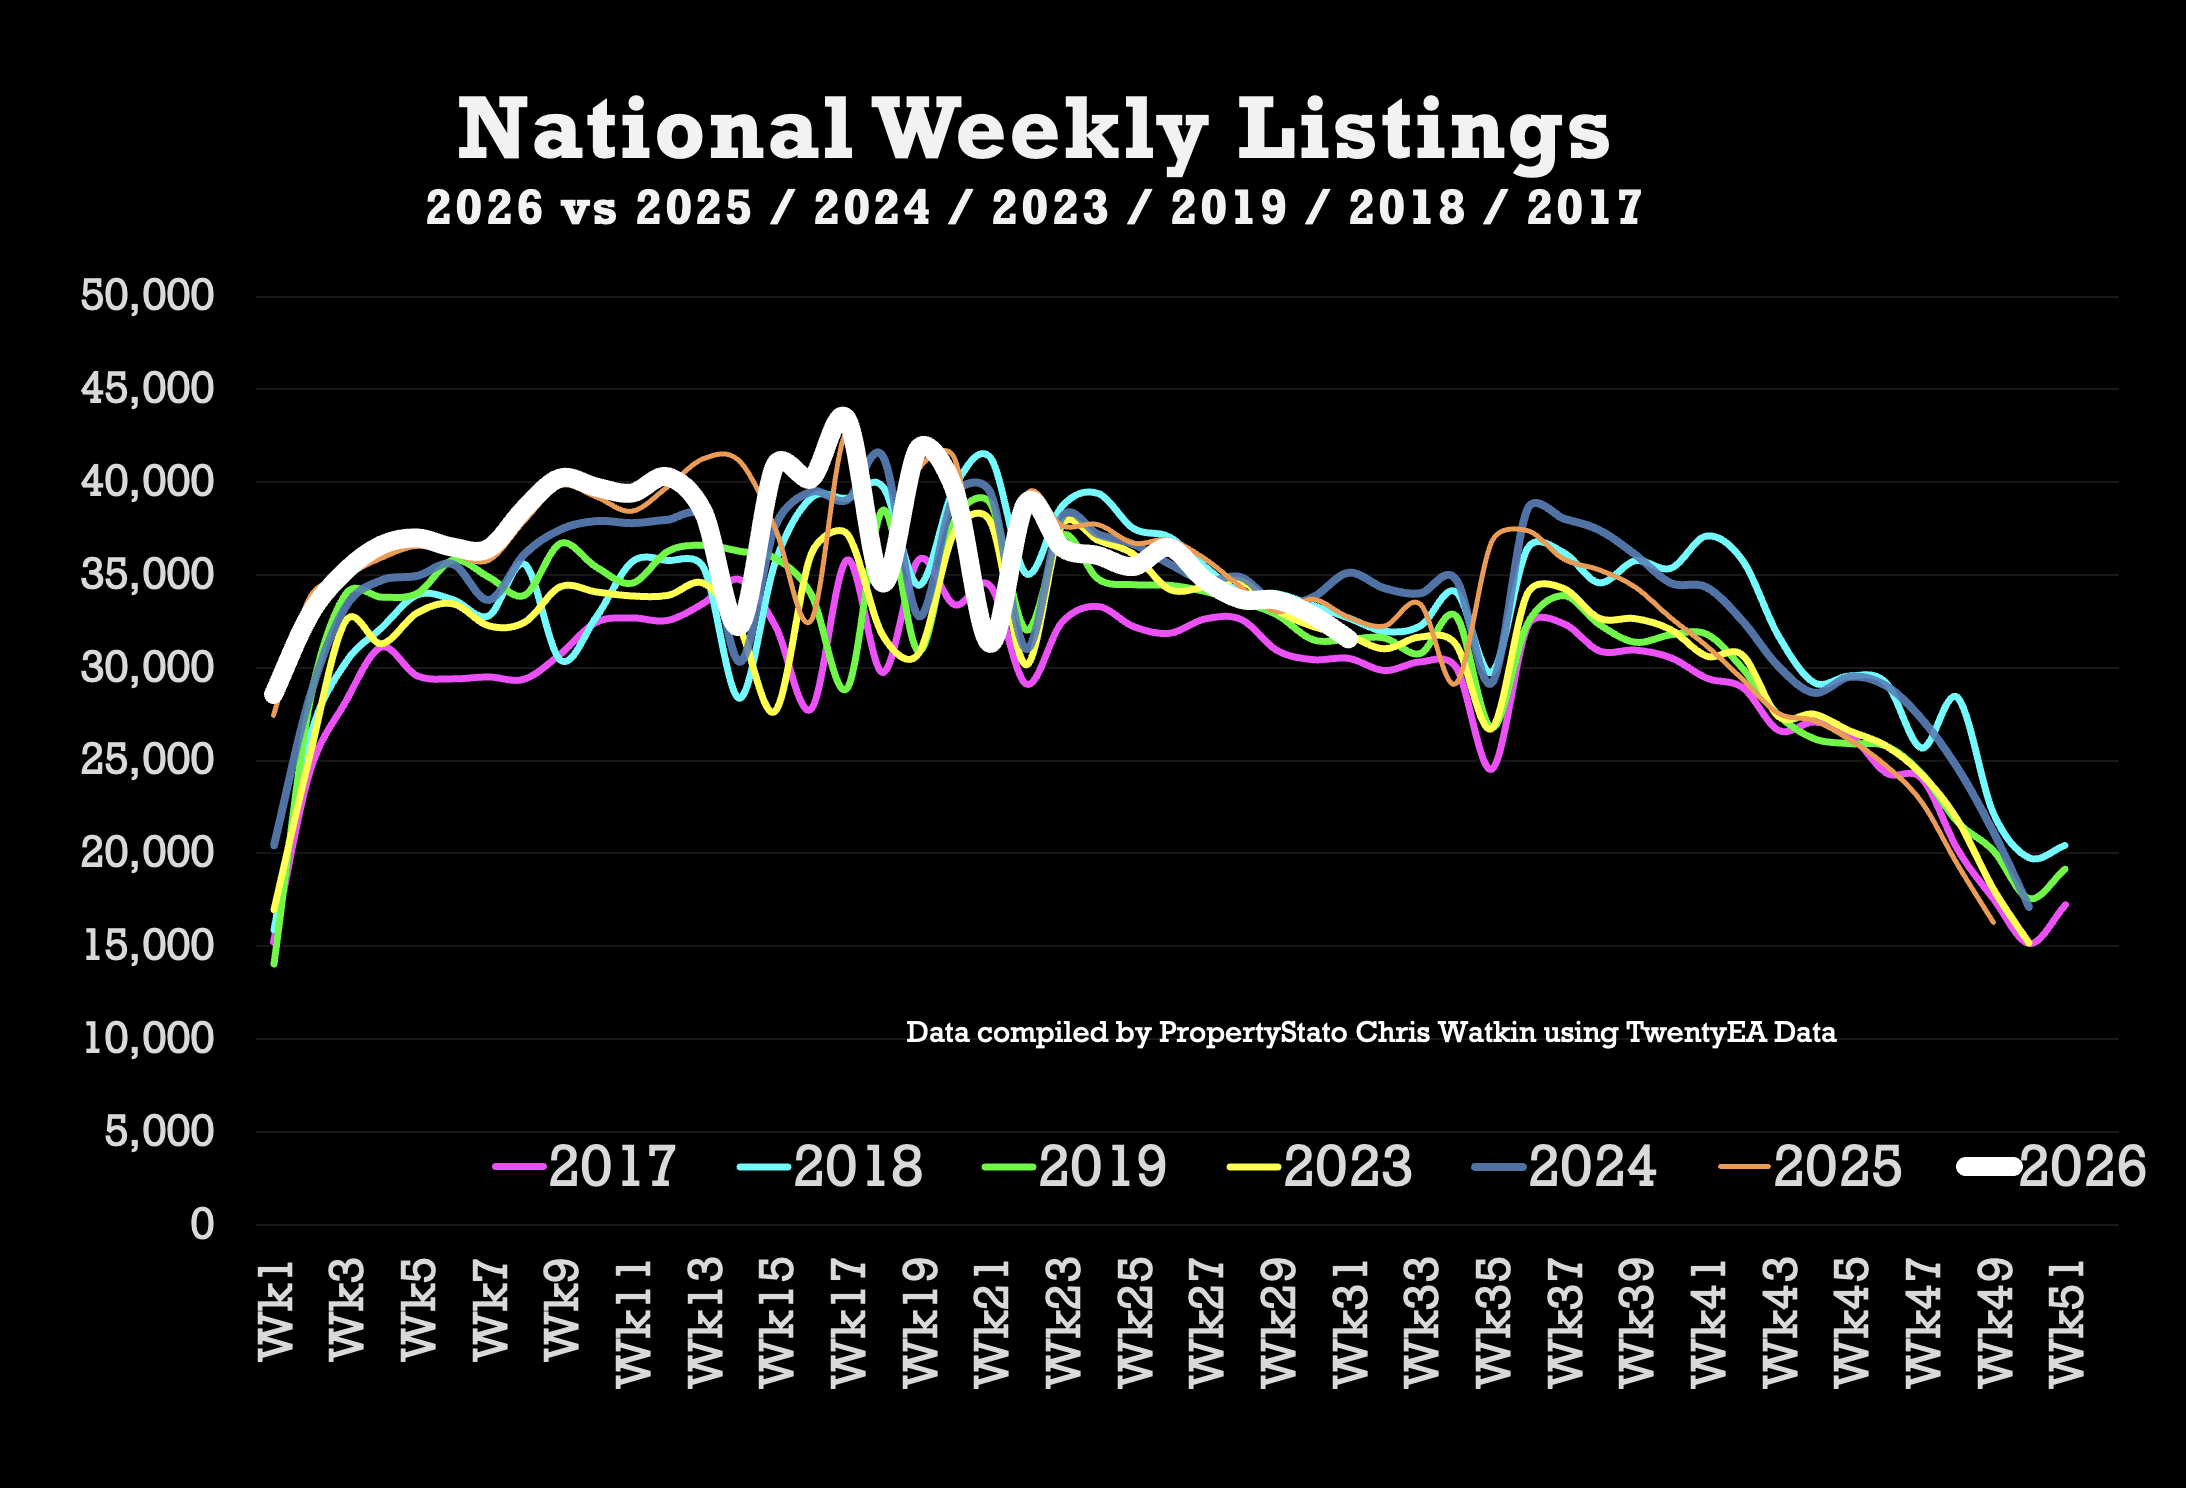
31.5k new listings this week, (32.8k last week)
Weekly 2026 average : 36.6k
10 year week 30 average : 33.2k
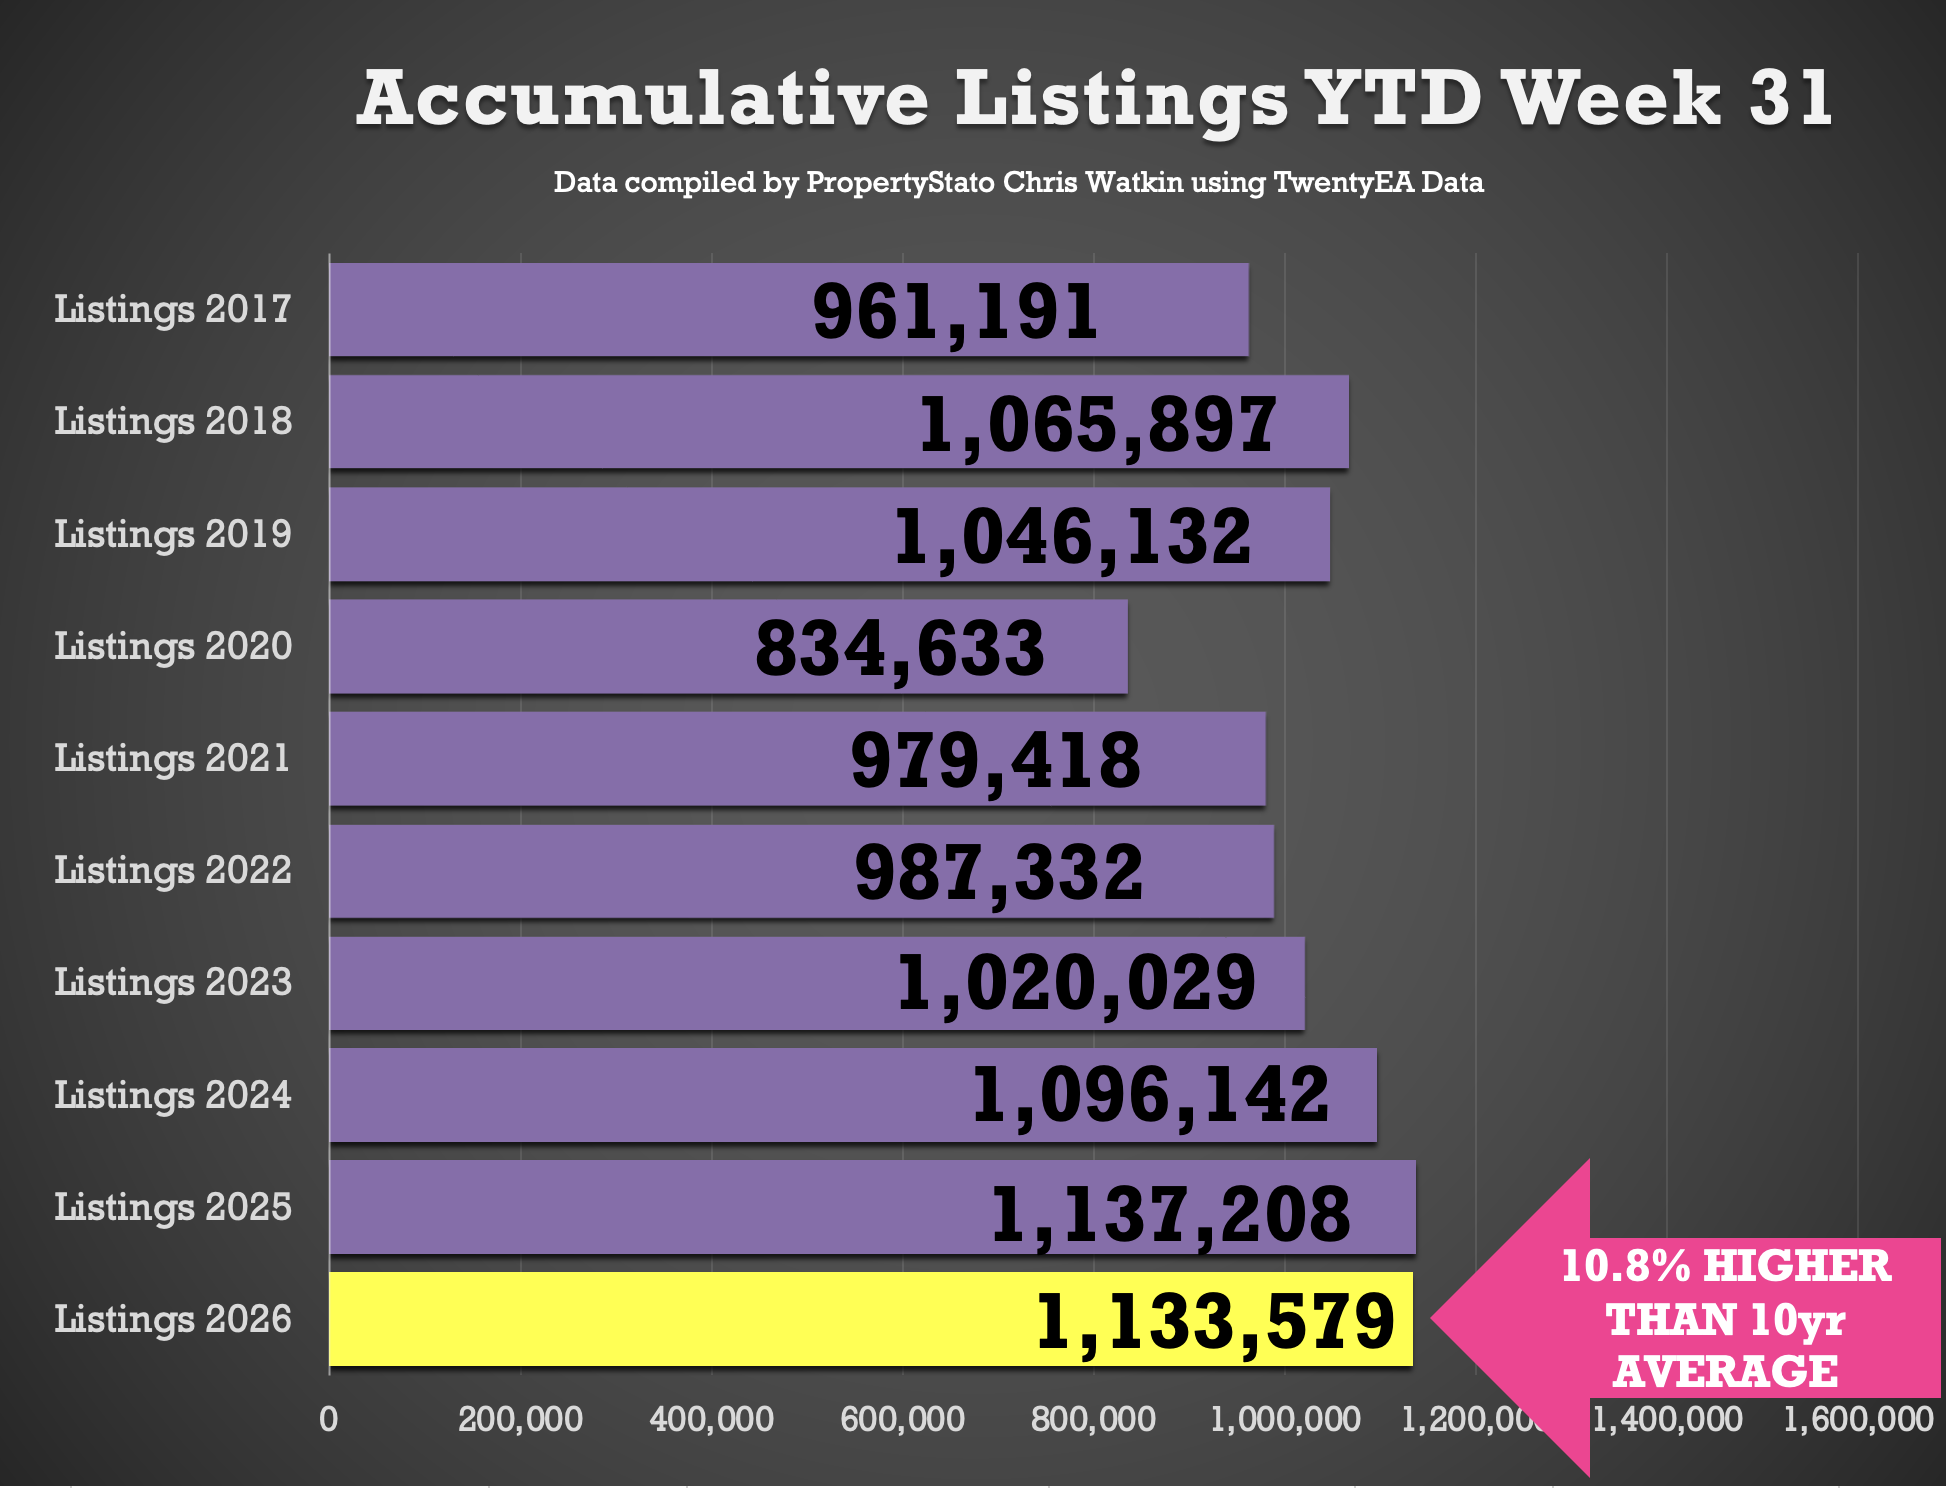
Year to Date
1.113m new listings YTD
0.3% lower than 2025 YTD (1.137m)
3.4% ahead of 2024 YTD (1.096m)
10.7% higher than the 2017–19 average YTD (1.020m)
UK Gross Resi Sales
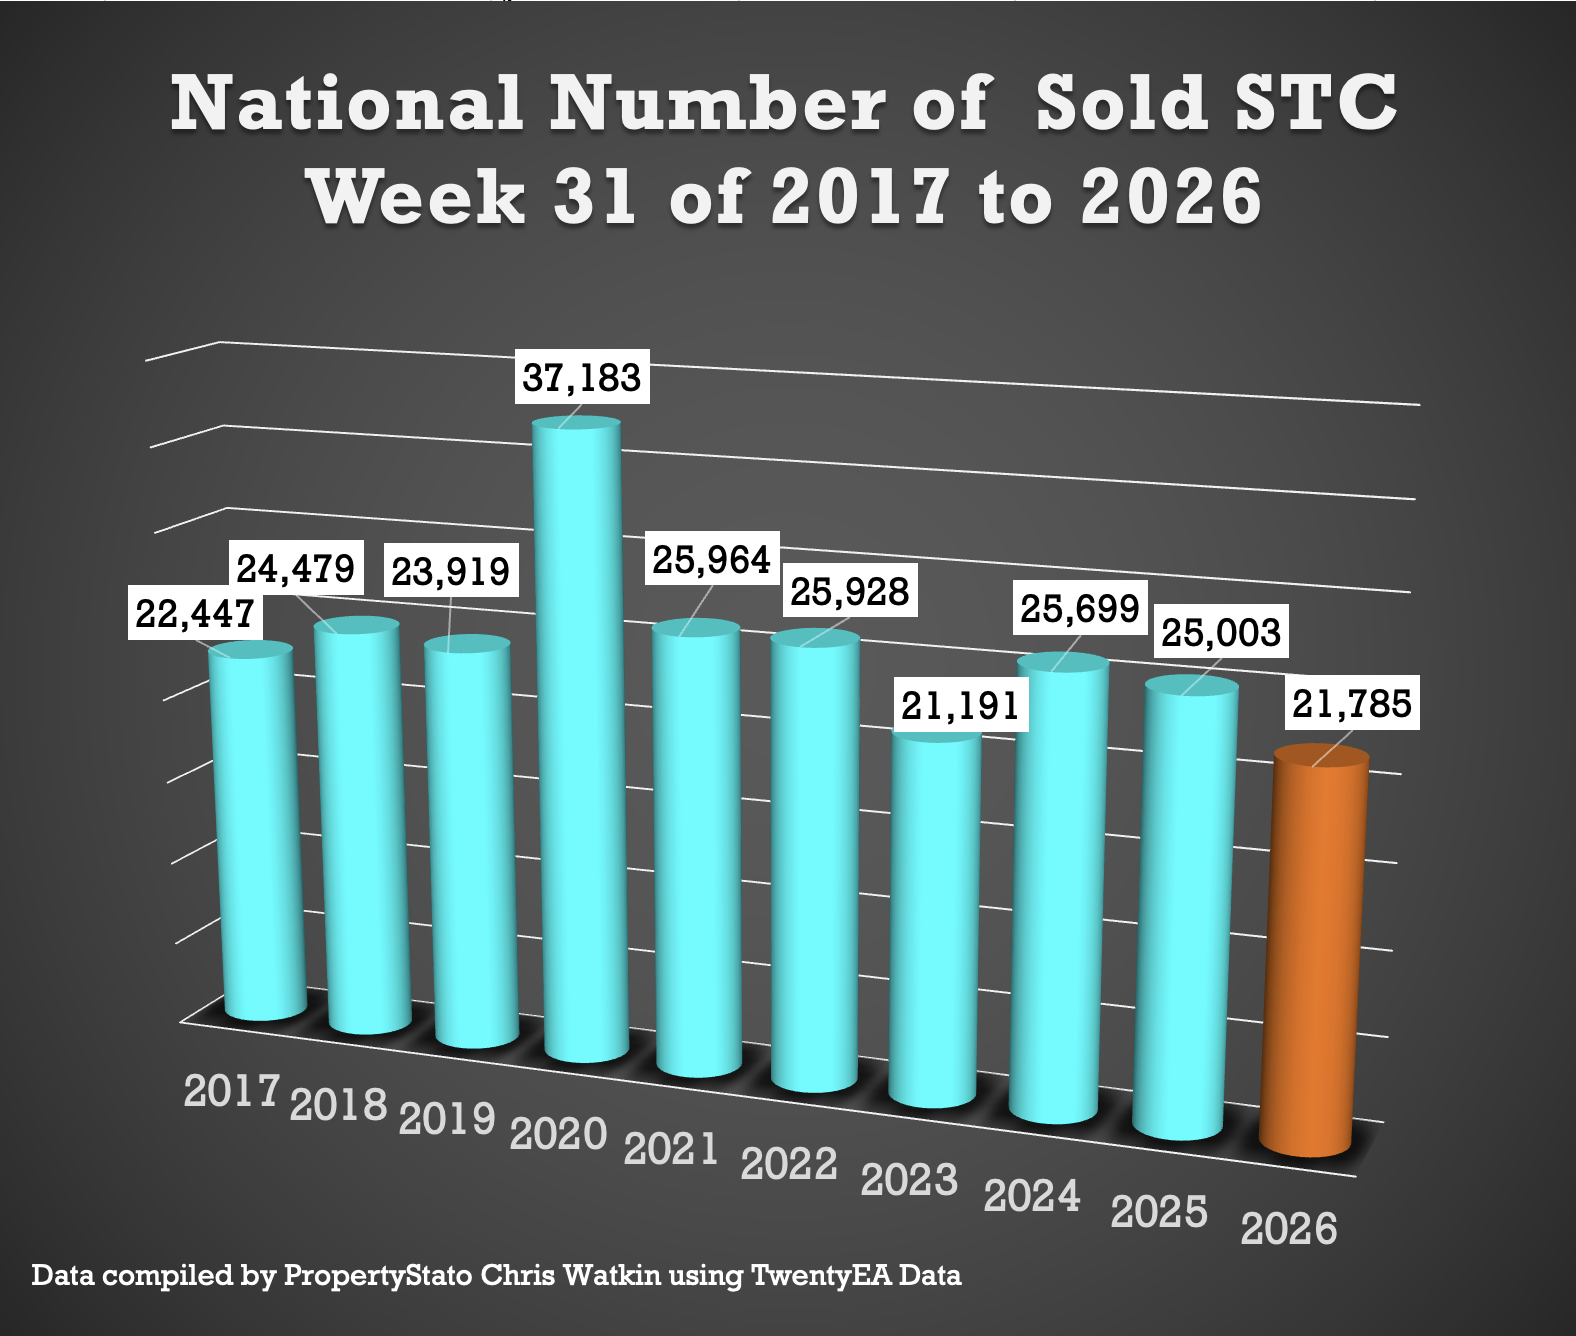
Week 31…
21.8k homes sold stc this week 31 (24.7k last week)
10 year week 31 average : 25.4k
2026 weekly average : 24.6k
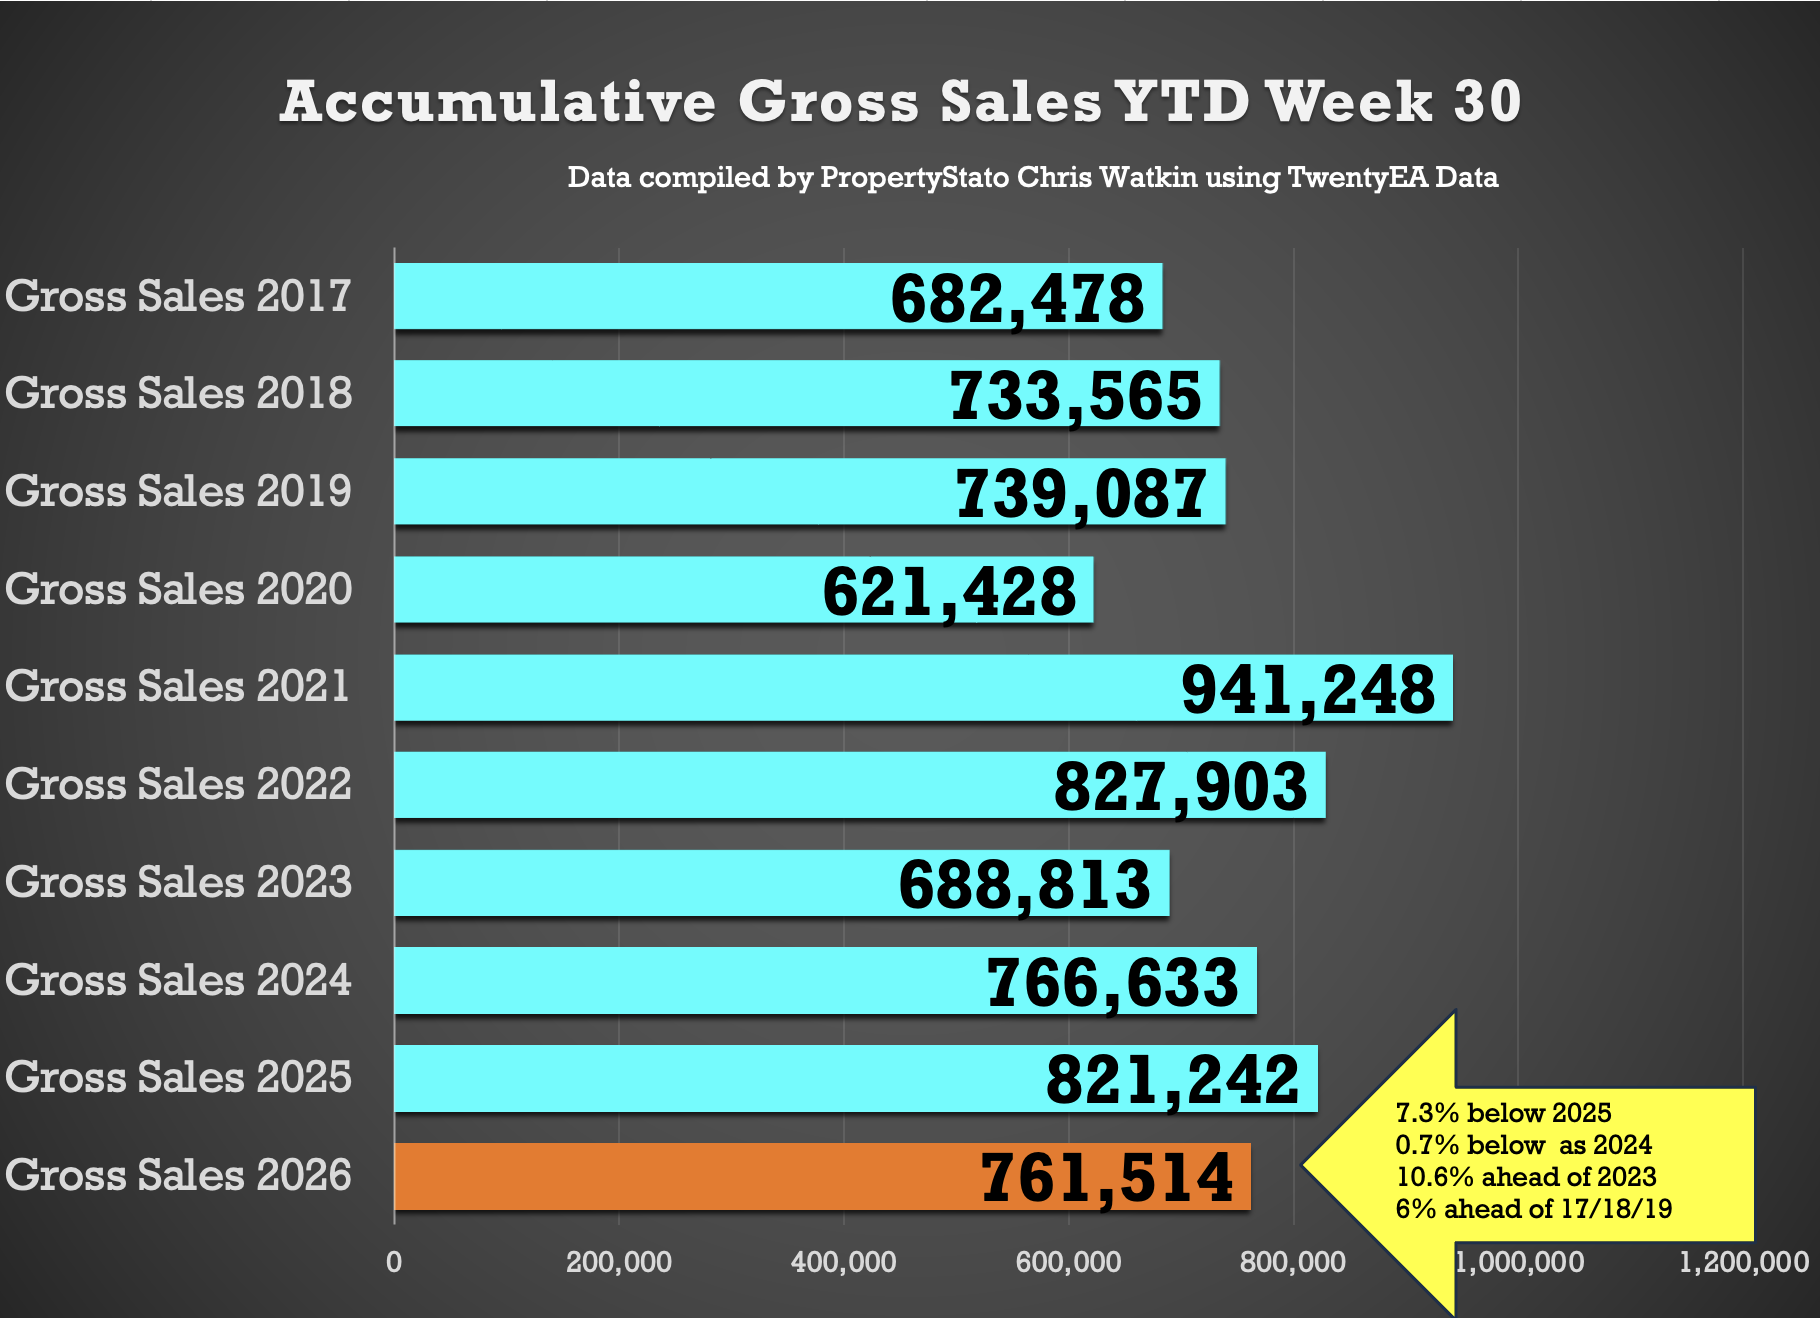
Year to date for house sales
762k UK homes sold stc YTD
7.3% lower than 2025 YTD (821k)
0.7% lower to 2024 YTD (767k)
10.6% higher than 2023 YTD (689k)
6% higher above pre Covid 2017-19 years (718k)
Decade average – 758k YTD
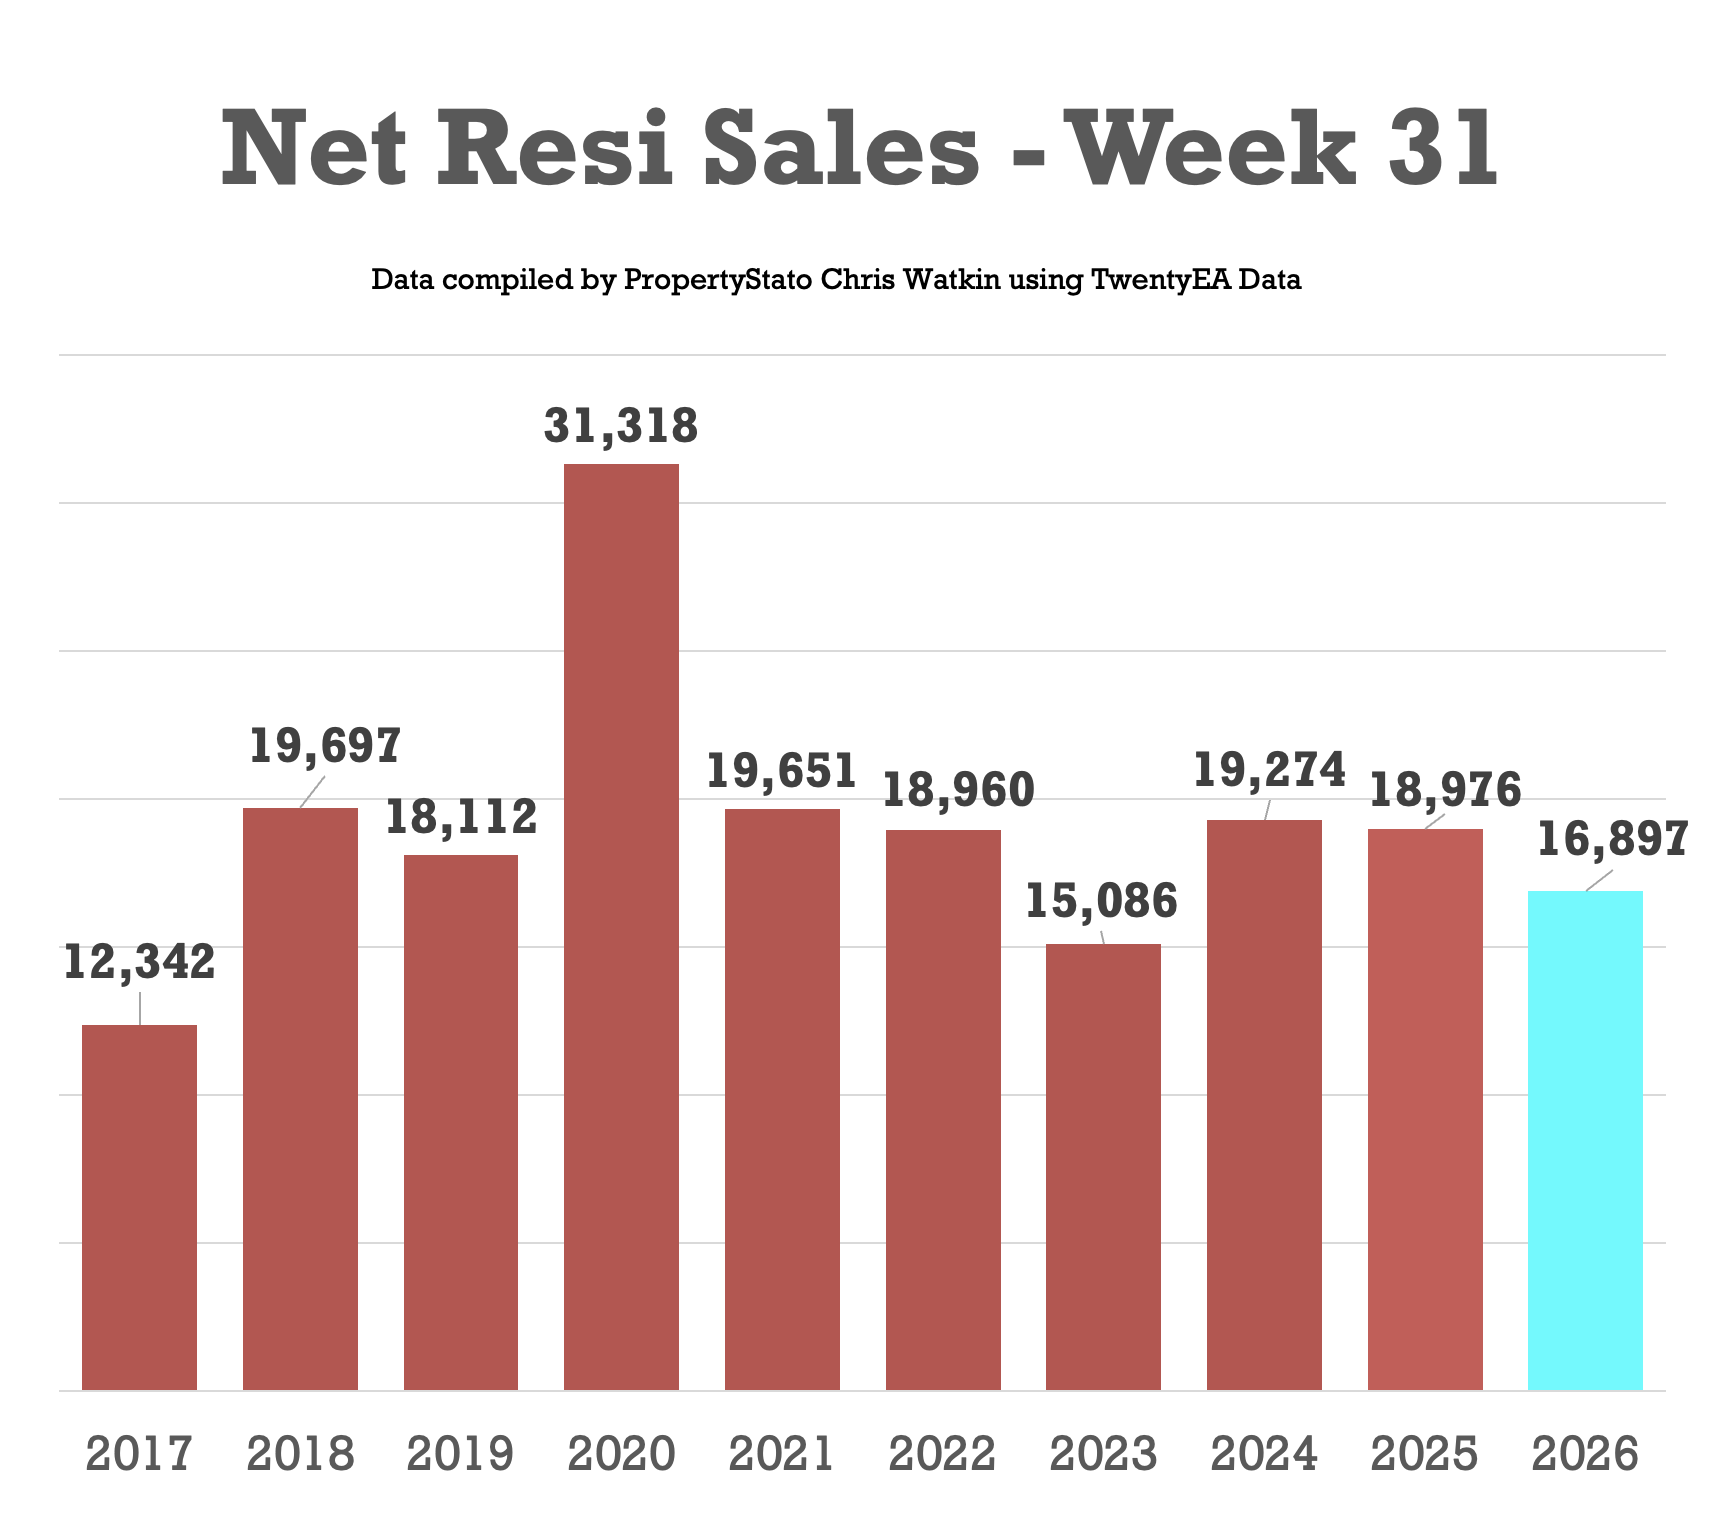
UK Net Resi Sales YTD
(Net Sales being Gross Sales less Sale Fall Throughs).
Week 30
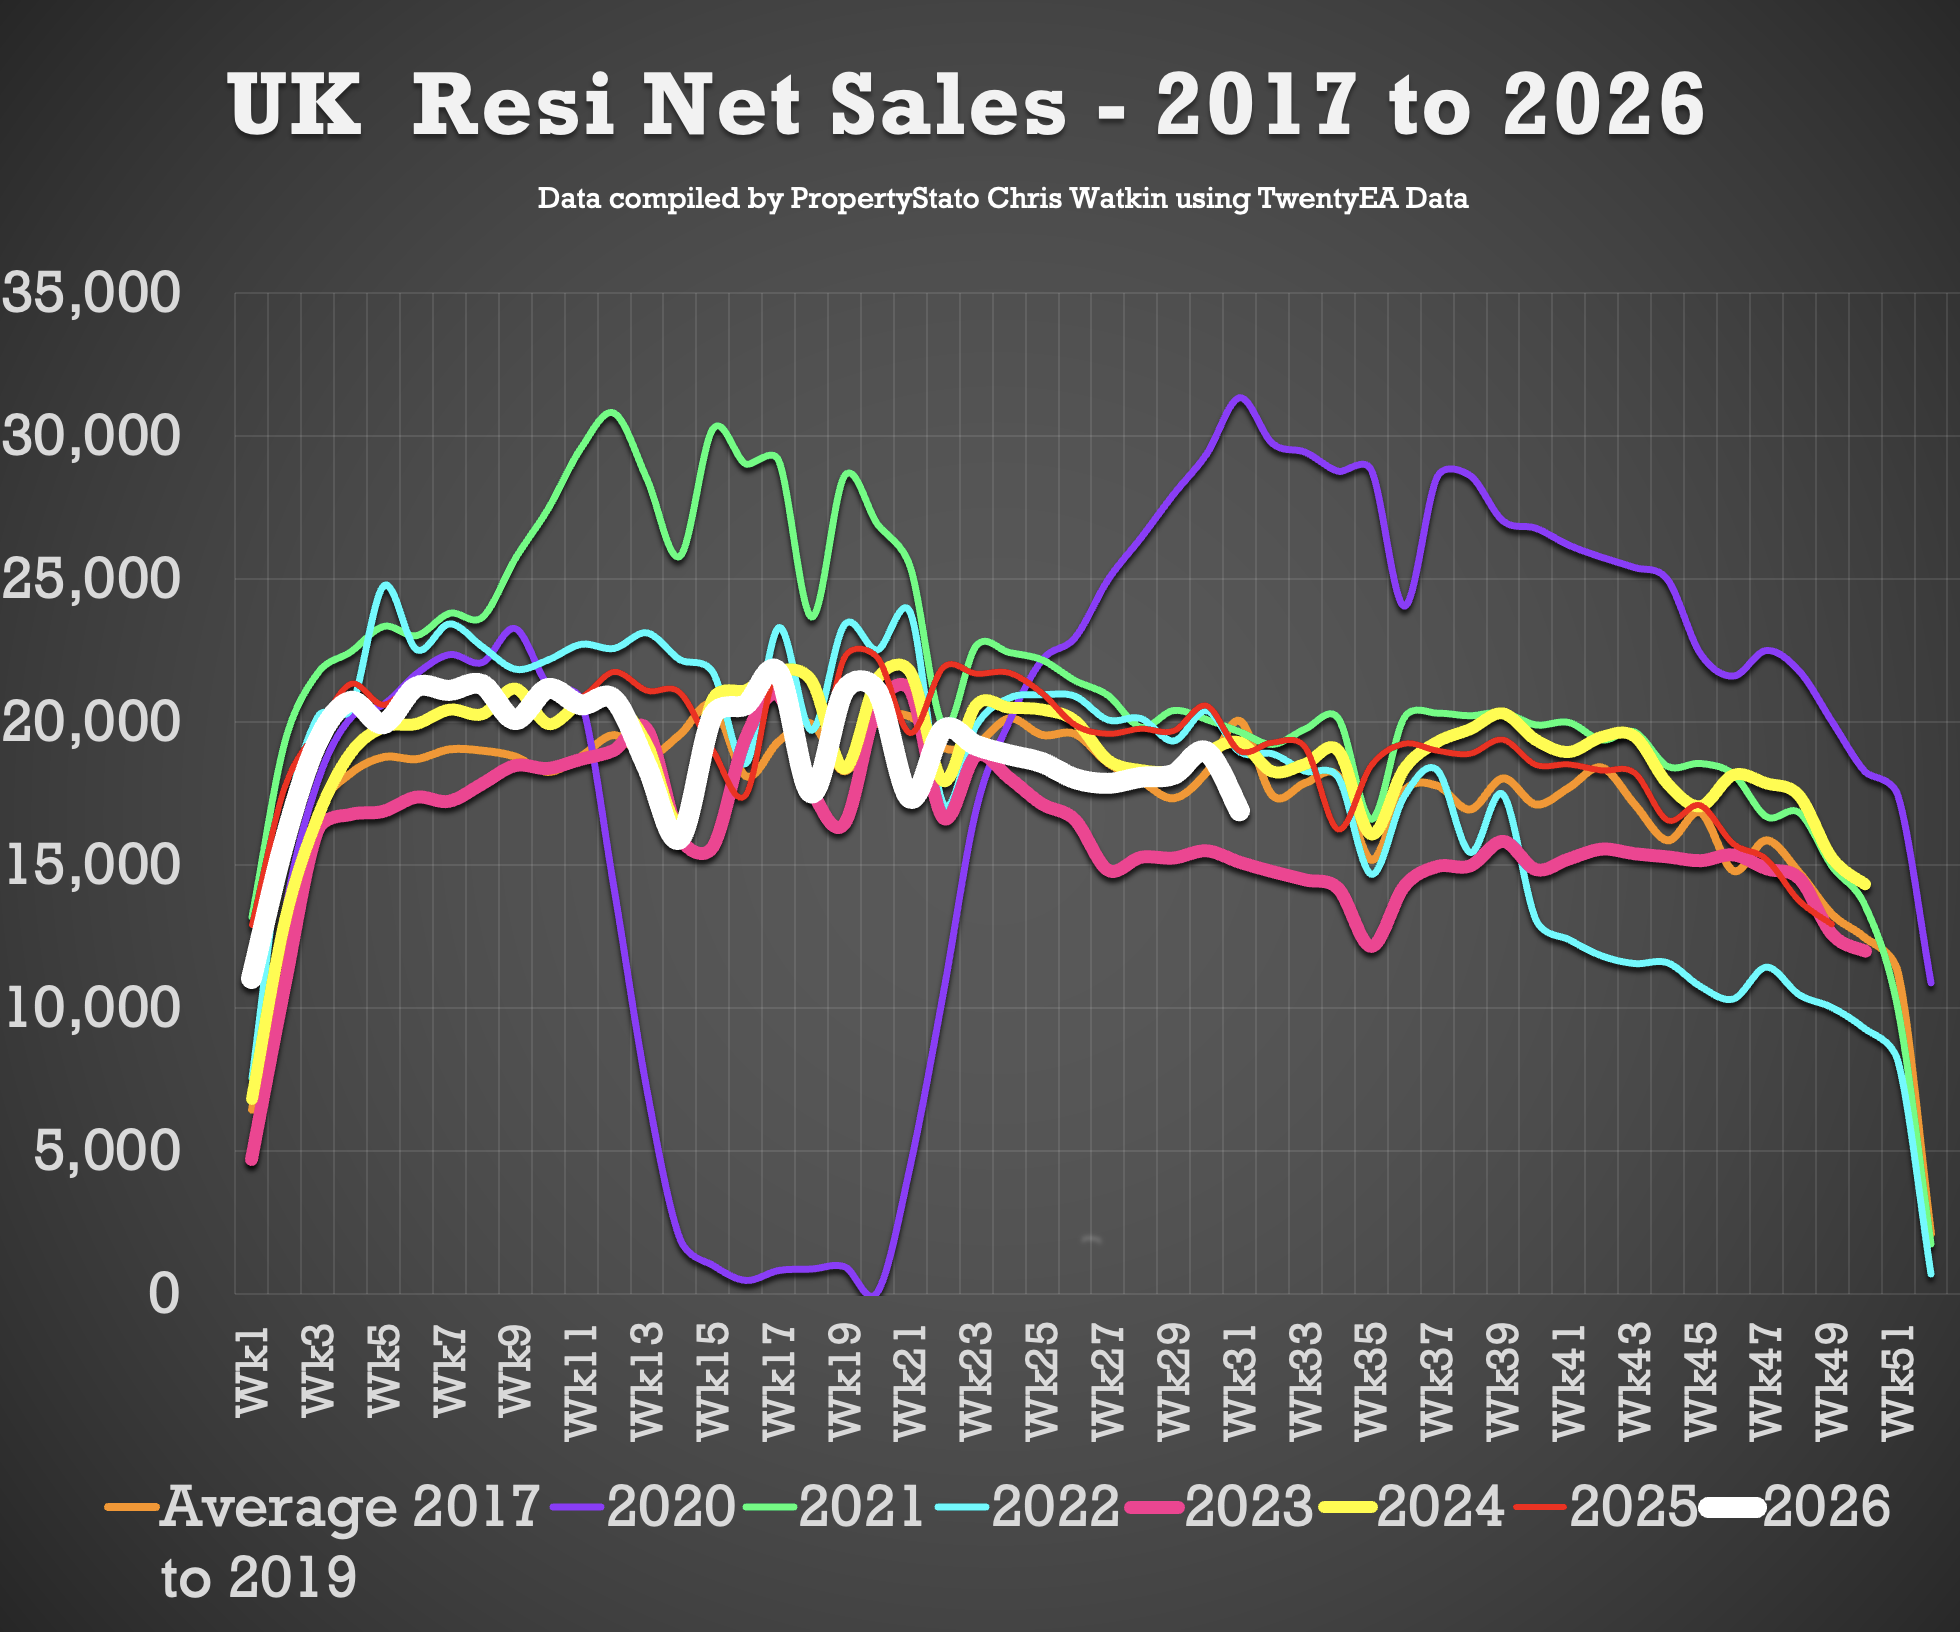
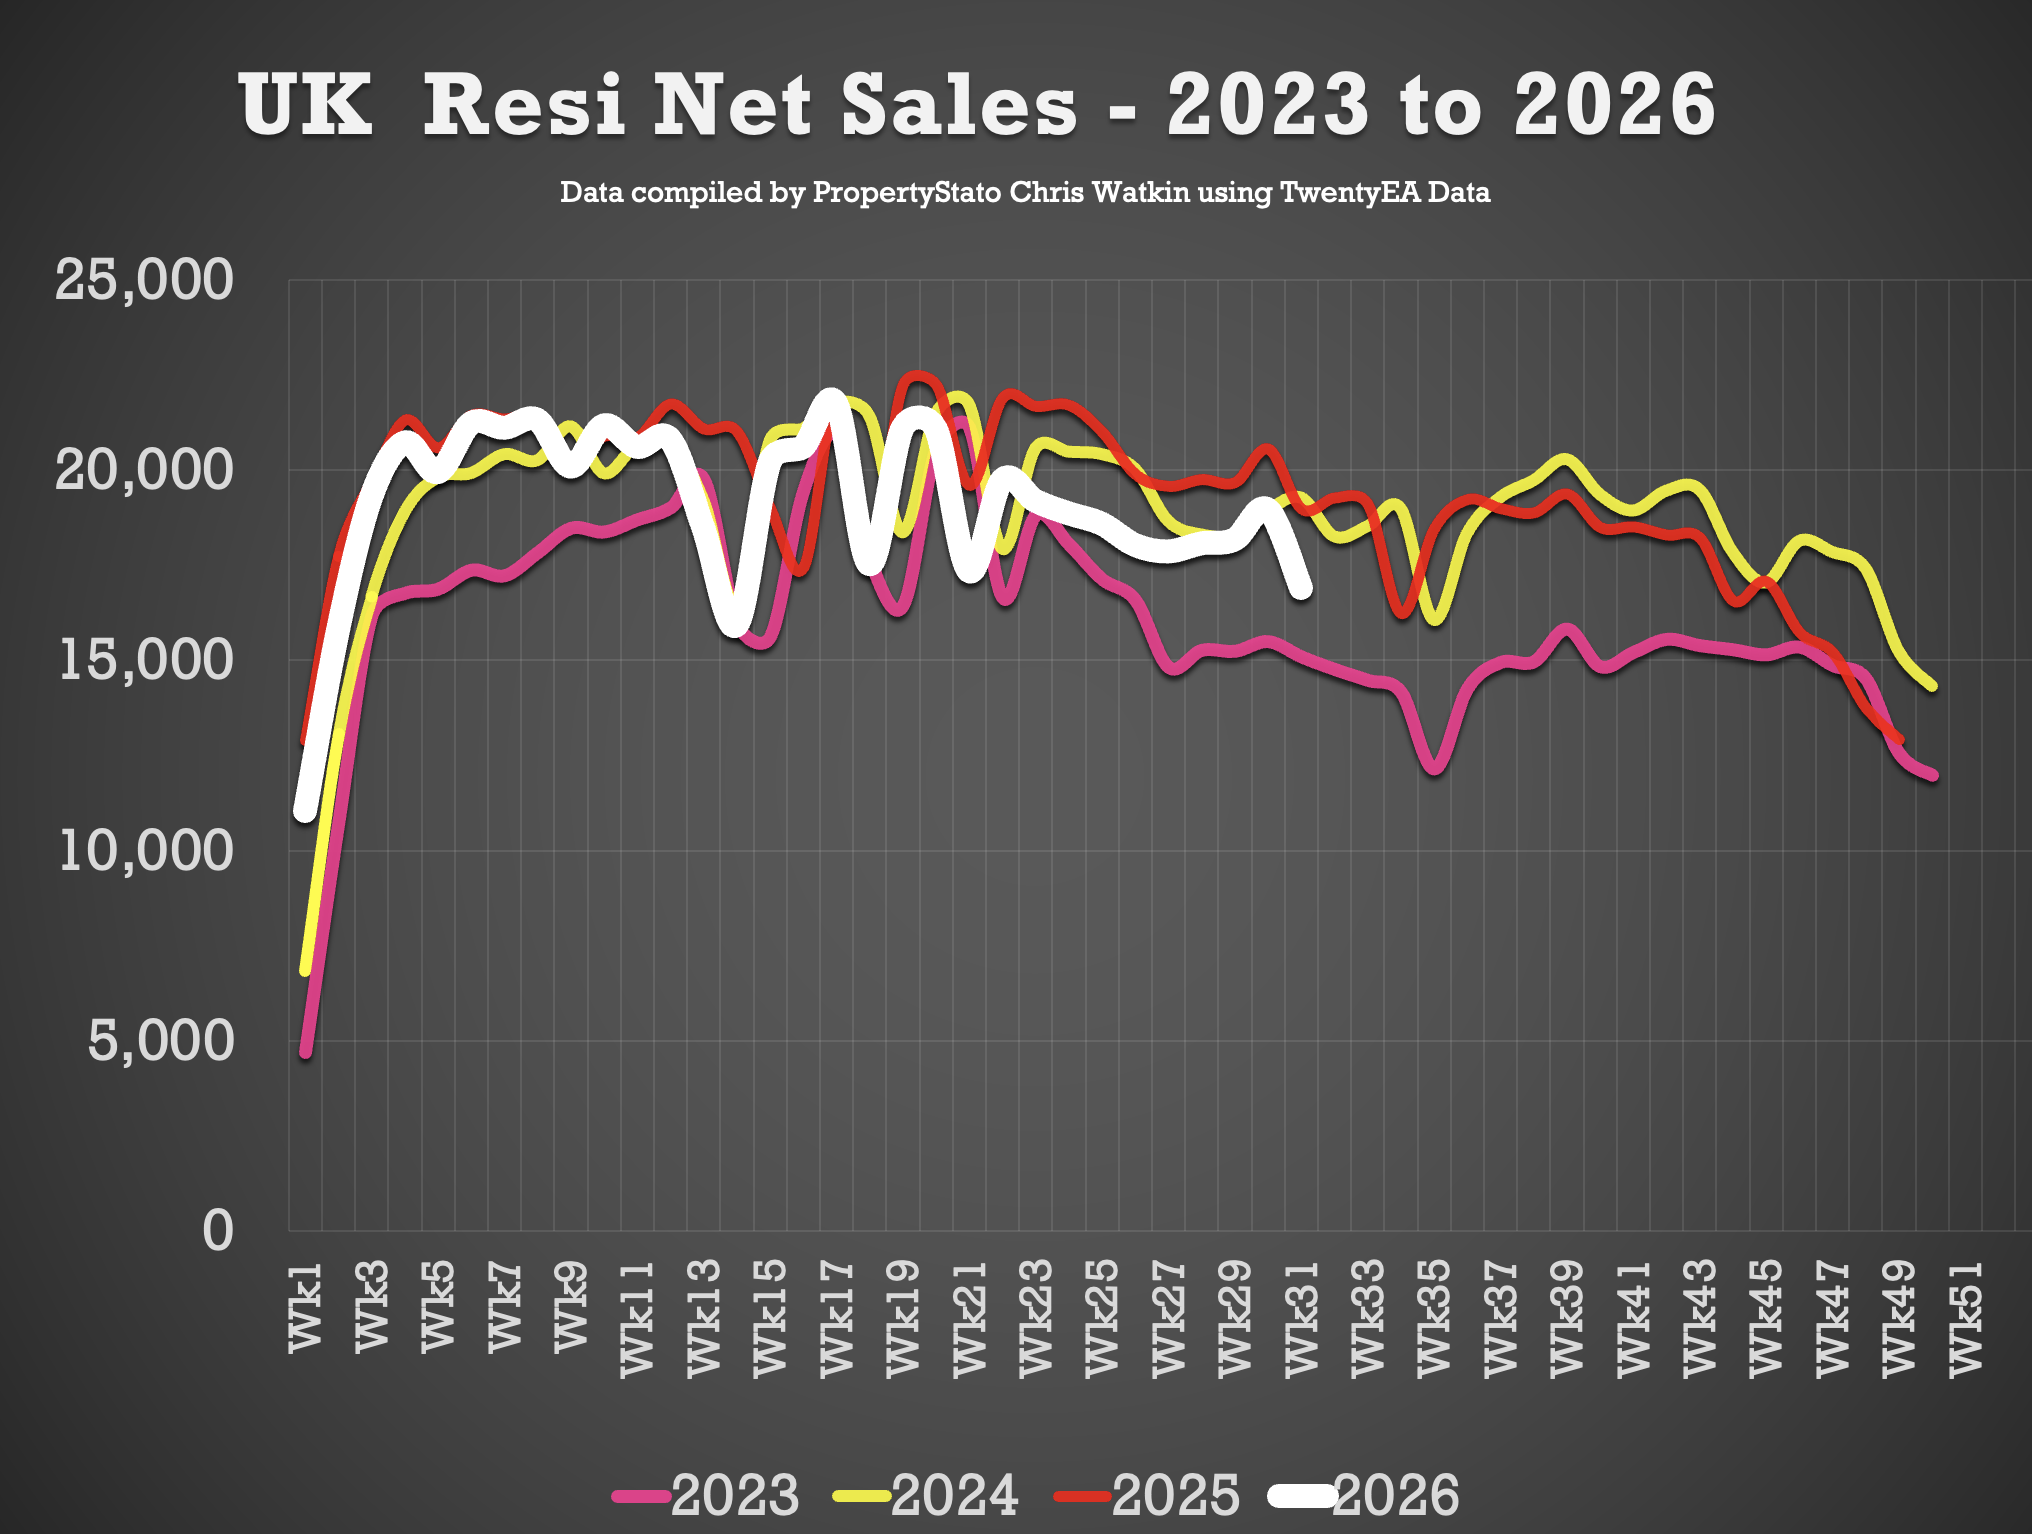
16.9k Net Sales (19k last week)
10 year Week 31 average: 19k
Weekly average for 2026: 19.1k
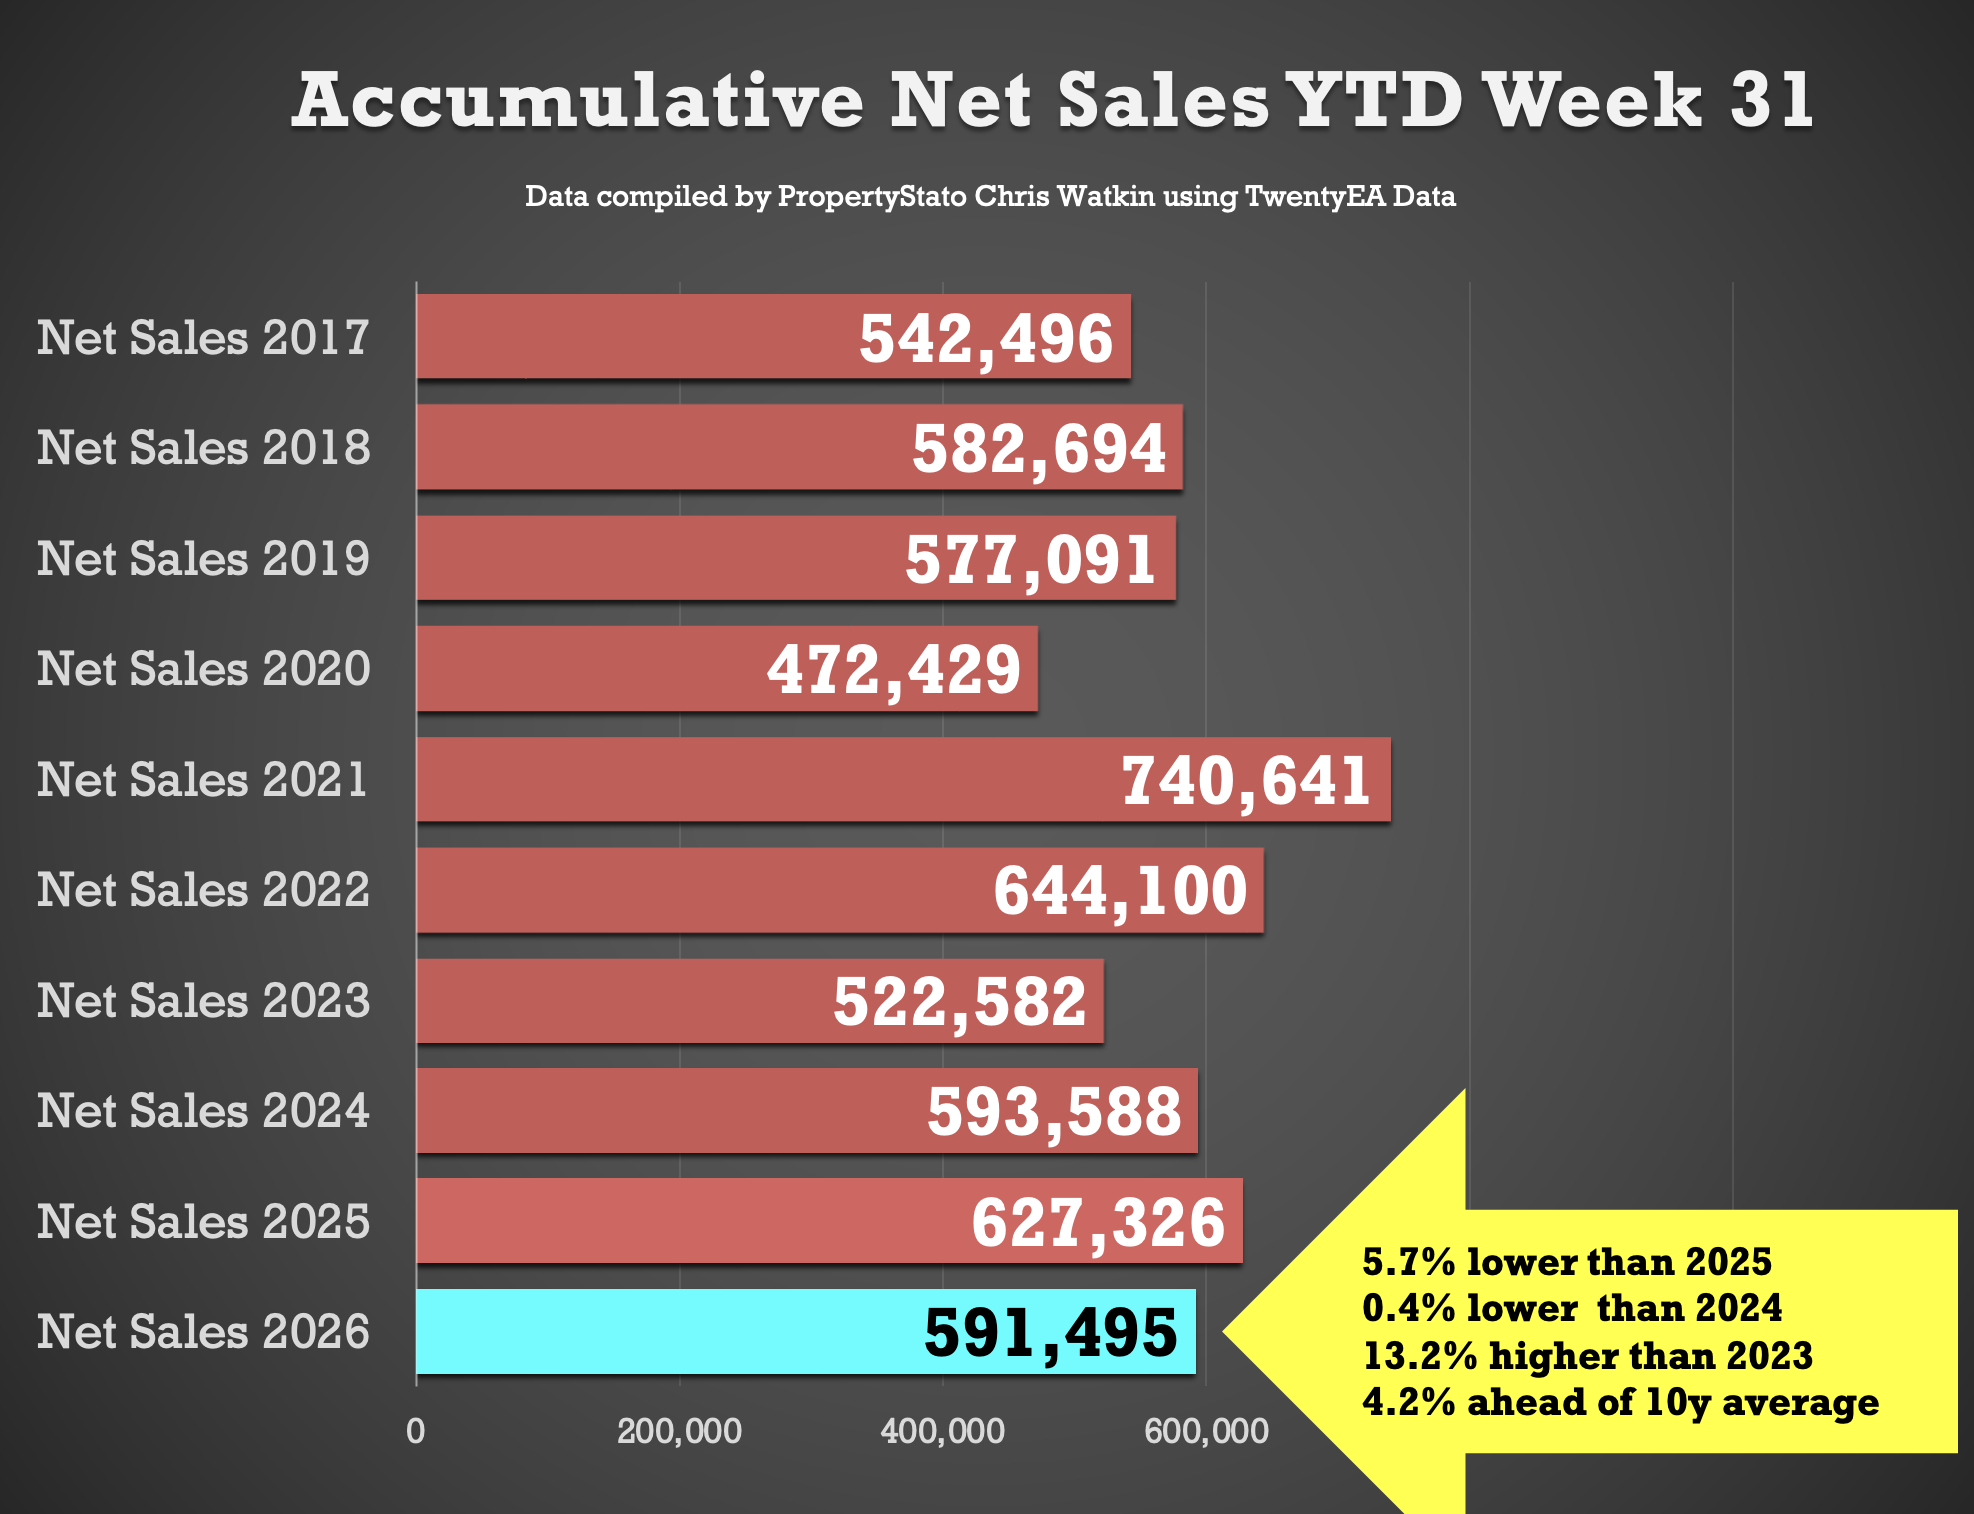
Year to Date
591k UK net home sales YTD
5.7% lower than 2025 (627k),
0.4% lower than 2024 (594k),
13.2% ahead of 2023 (523k)
4.2% above the 2017–19 average (567k)
Exchanges & Withdrawals
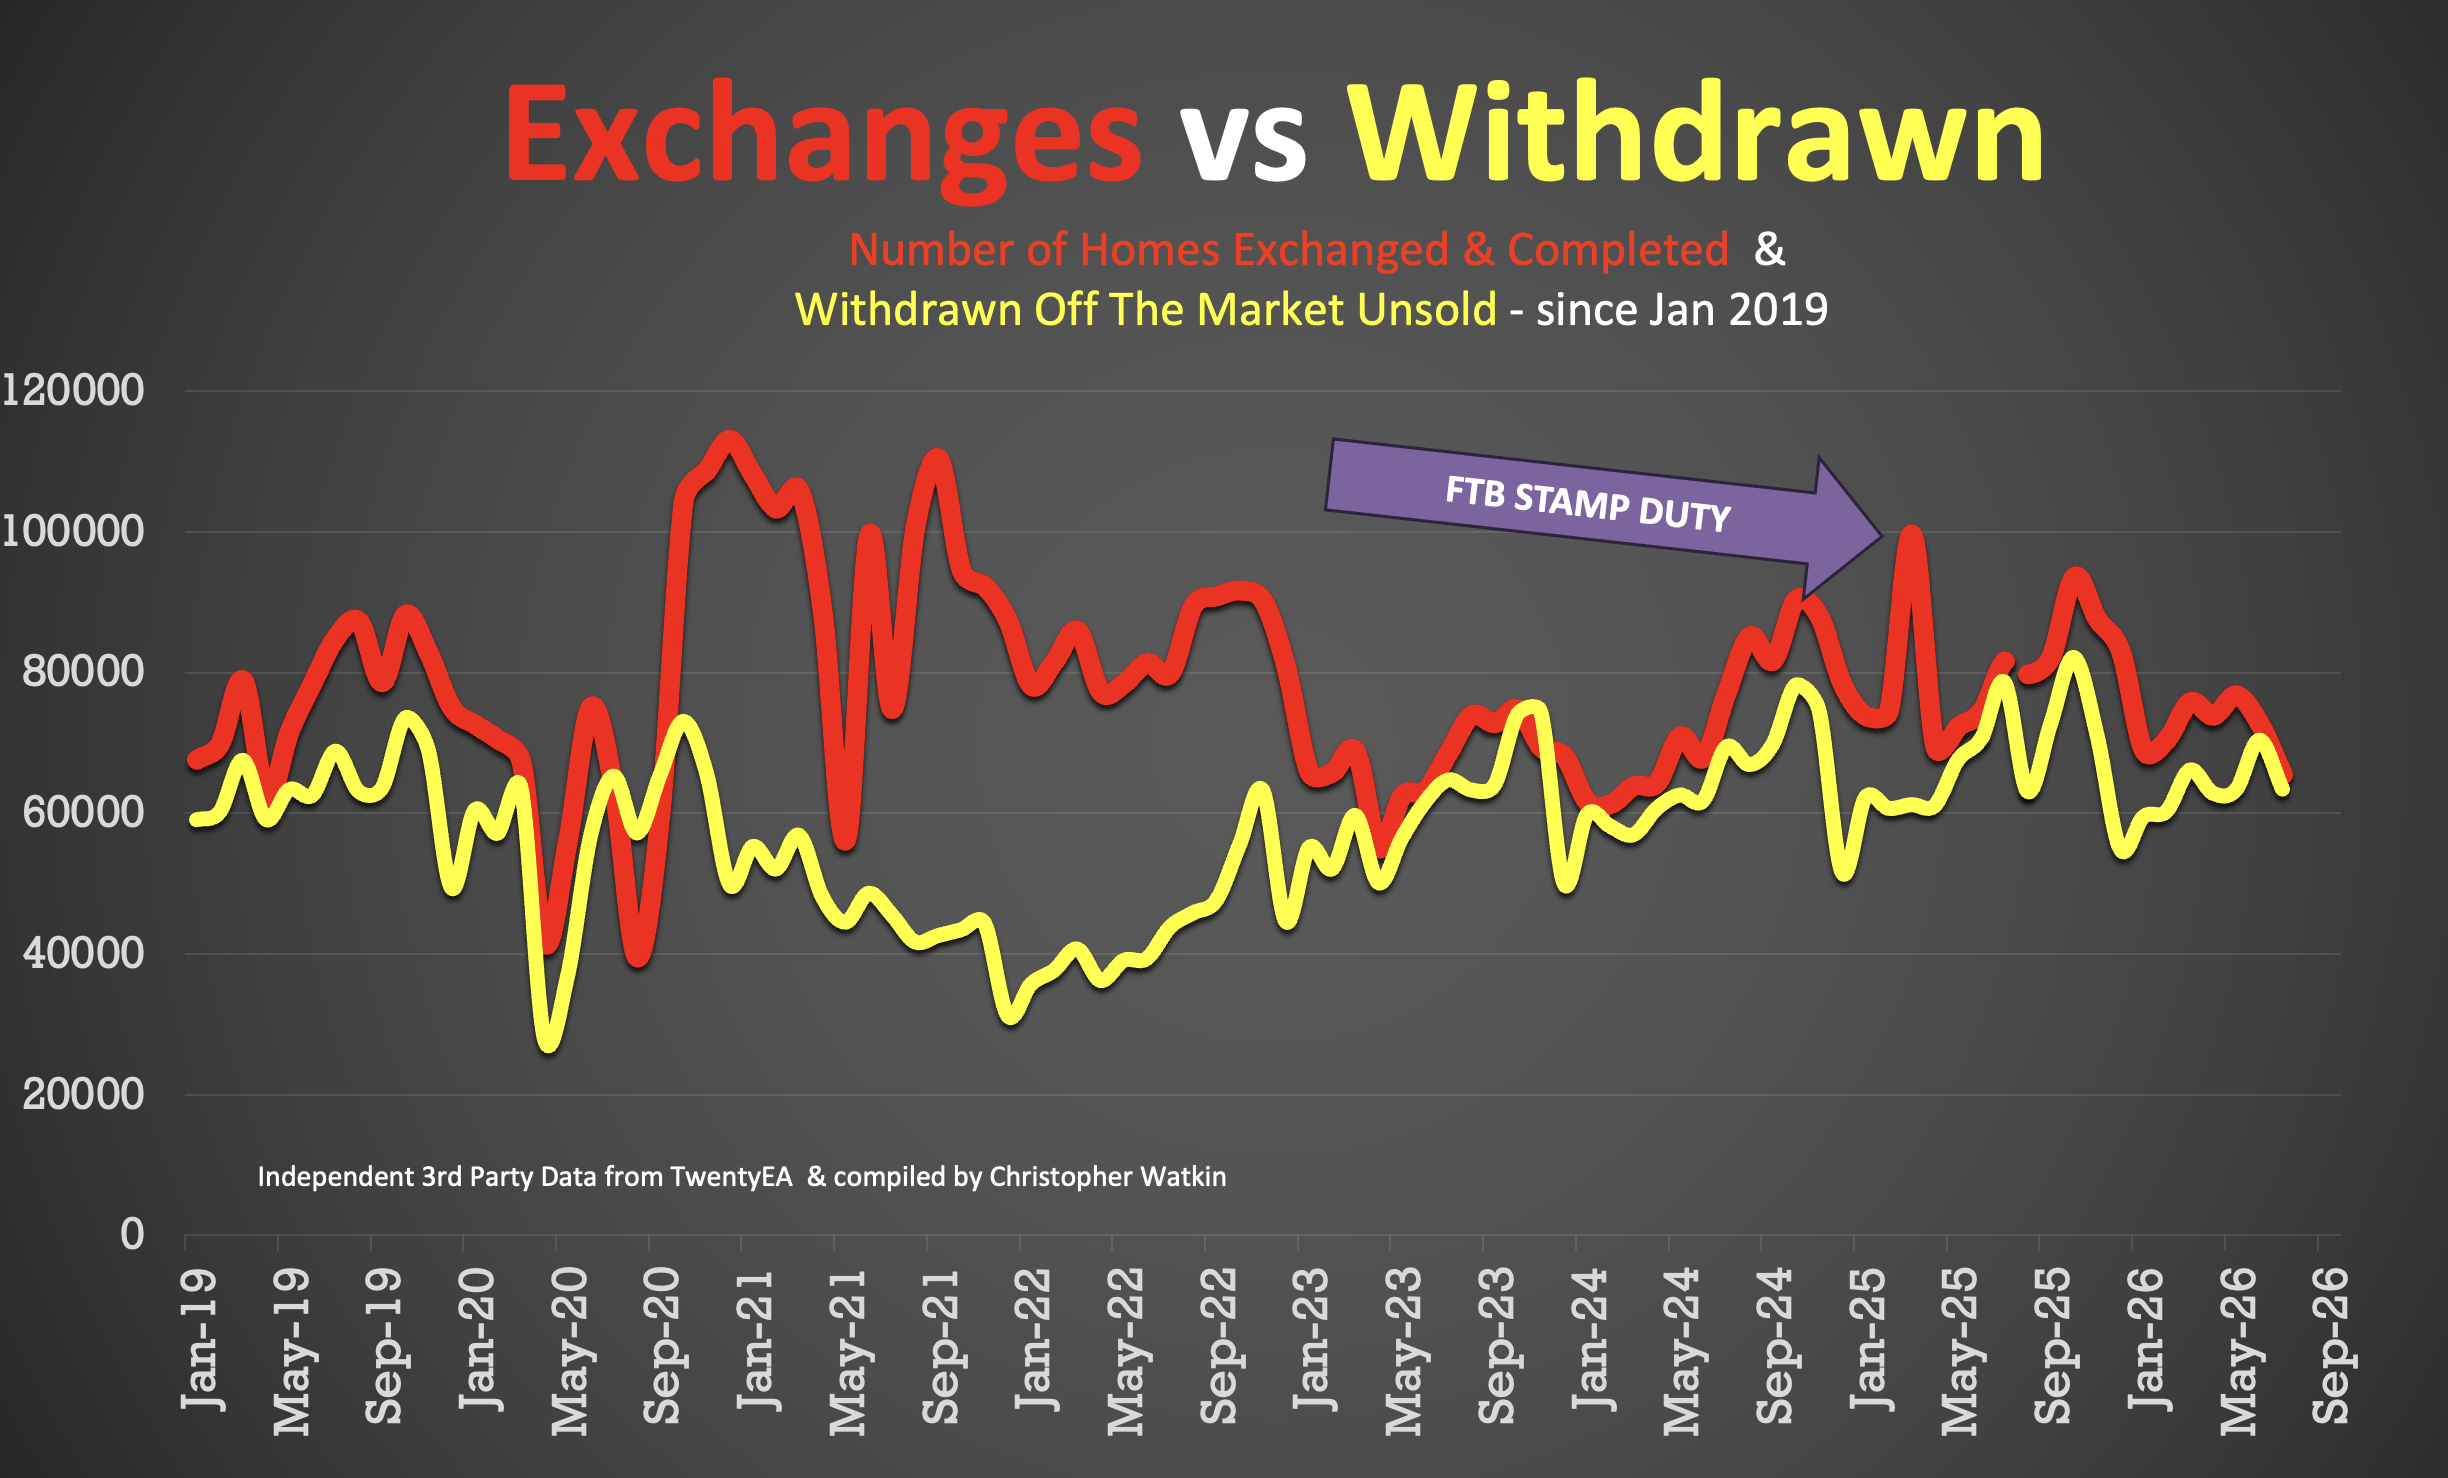
• 65.5k Exchanges in July 2026 (note this figure will rise during August as more exchanges get reported. On past trends, expect that to end on mid/ late 70k’s
• 63.4k Withdrawals in July 2026 – again, this figure will increase as more July withdrawals come thru the system throughout August
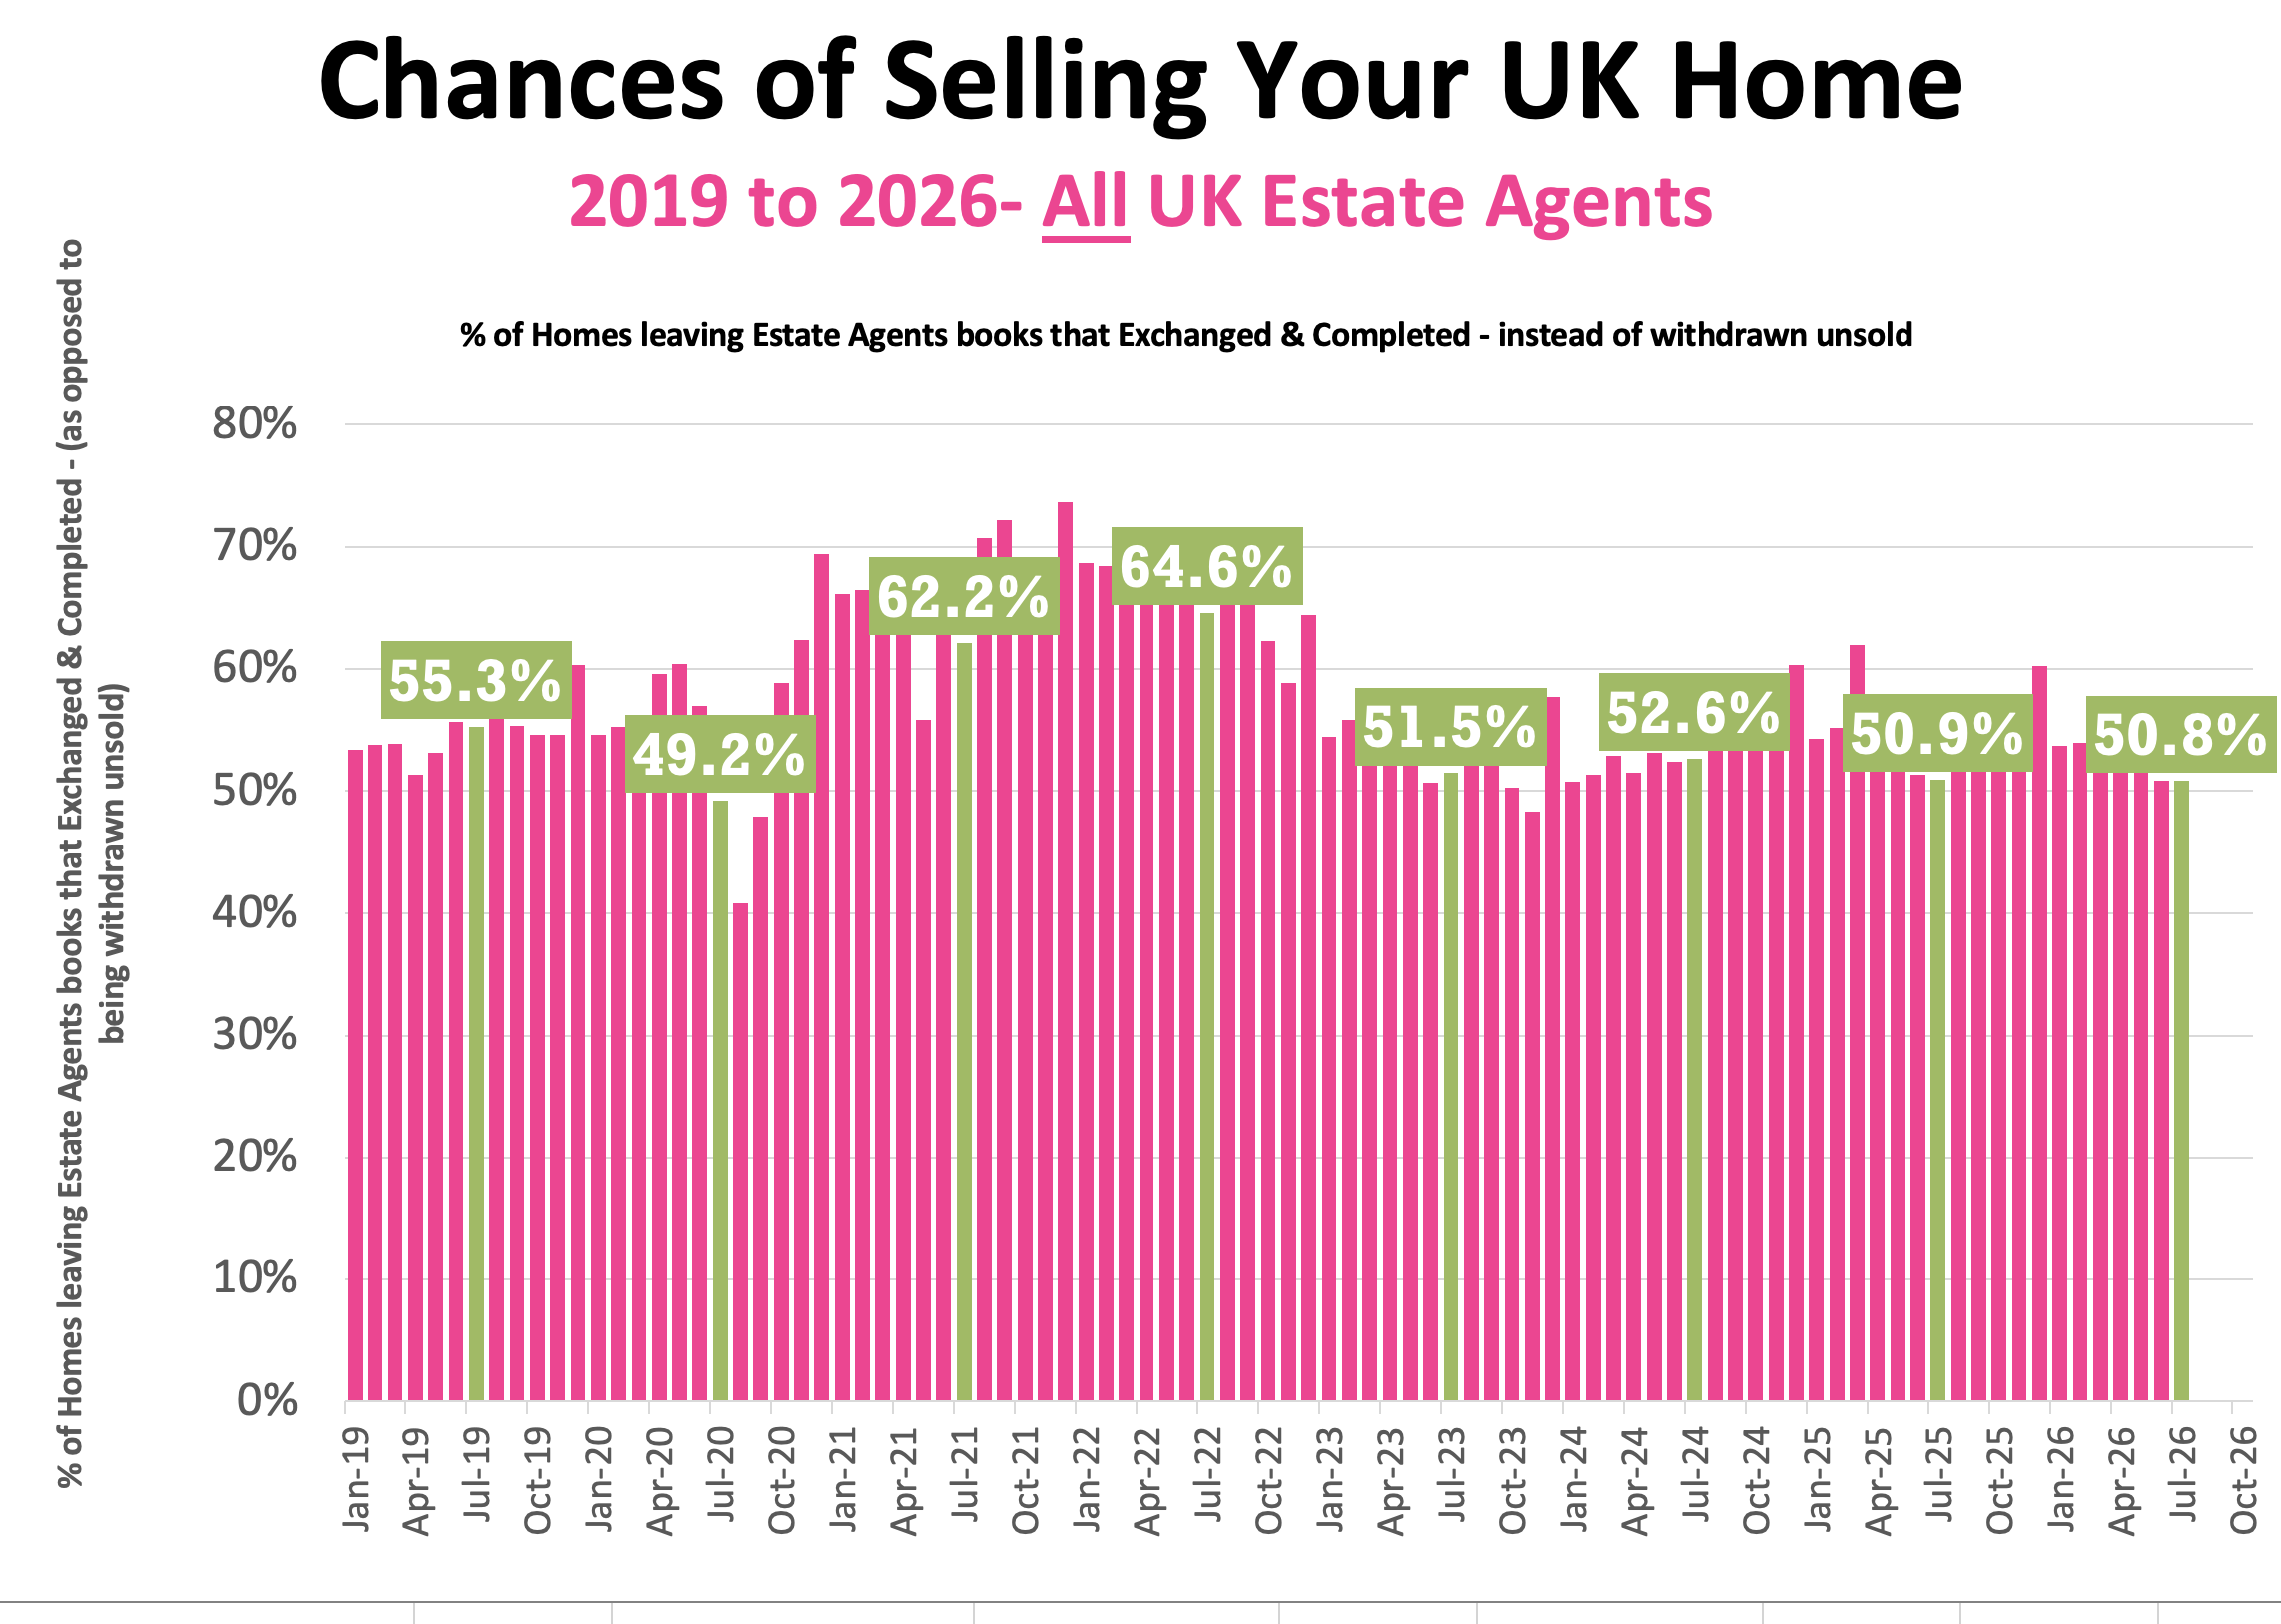
• Therefore, in July 2026, only 50.8% of homes that left agents’ books exchanged & completed in July (the rest – 49.2% withdrew, unsold)
• 57.6% is the 7 year average exchange to listings ratio (which includes the crazy years post lockdown 18 months)
Additional info…
Price Reductions
• 21.2k reductions this week on a 767k UK homes for sale
• 13.7% of UK homes for sale were reduced in July (down from 14.3% in June)
• 2026 YTD average 13%, versus the 6-year long-term average of 11.2%.
Price Difference between Asking Price of Listings & Asking Price of sold Homes (stc)
• 9.9% difference (long term 10 year average is 16% to 17%). (£396k ave Listing Ave Asking price vs £360k Sale Agreed ave Asking price)
Sell-Through Rate
• 14.2% of homes on agents’ books went SSTC in June ’26 (compared to 13.8% in June ’26)
• Pre-Covid average: 15.5%
Sale Fall-Throughs
• Fall-through rate 22.4%
• Decade average: 24.5%
• 5.07% of homes sold STC fell through in June 2026, below both the 2025 average of 5.3% and the 10 year average of 5.8%
Stock Levels
• 767k homes on the market on the 1st of August ’26 (760k the month before and 763k 12 months ago)
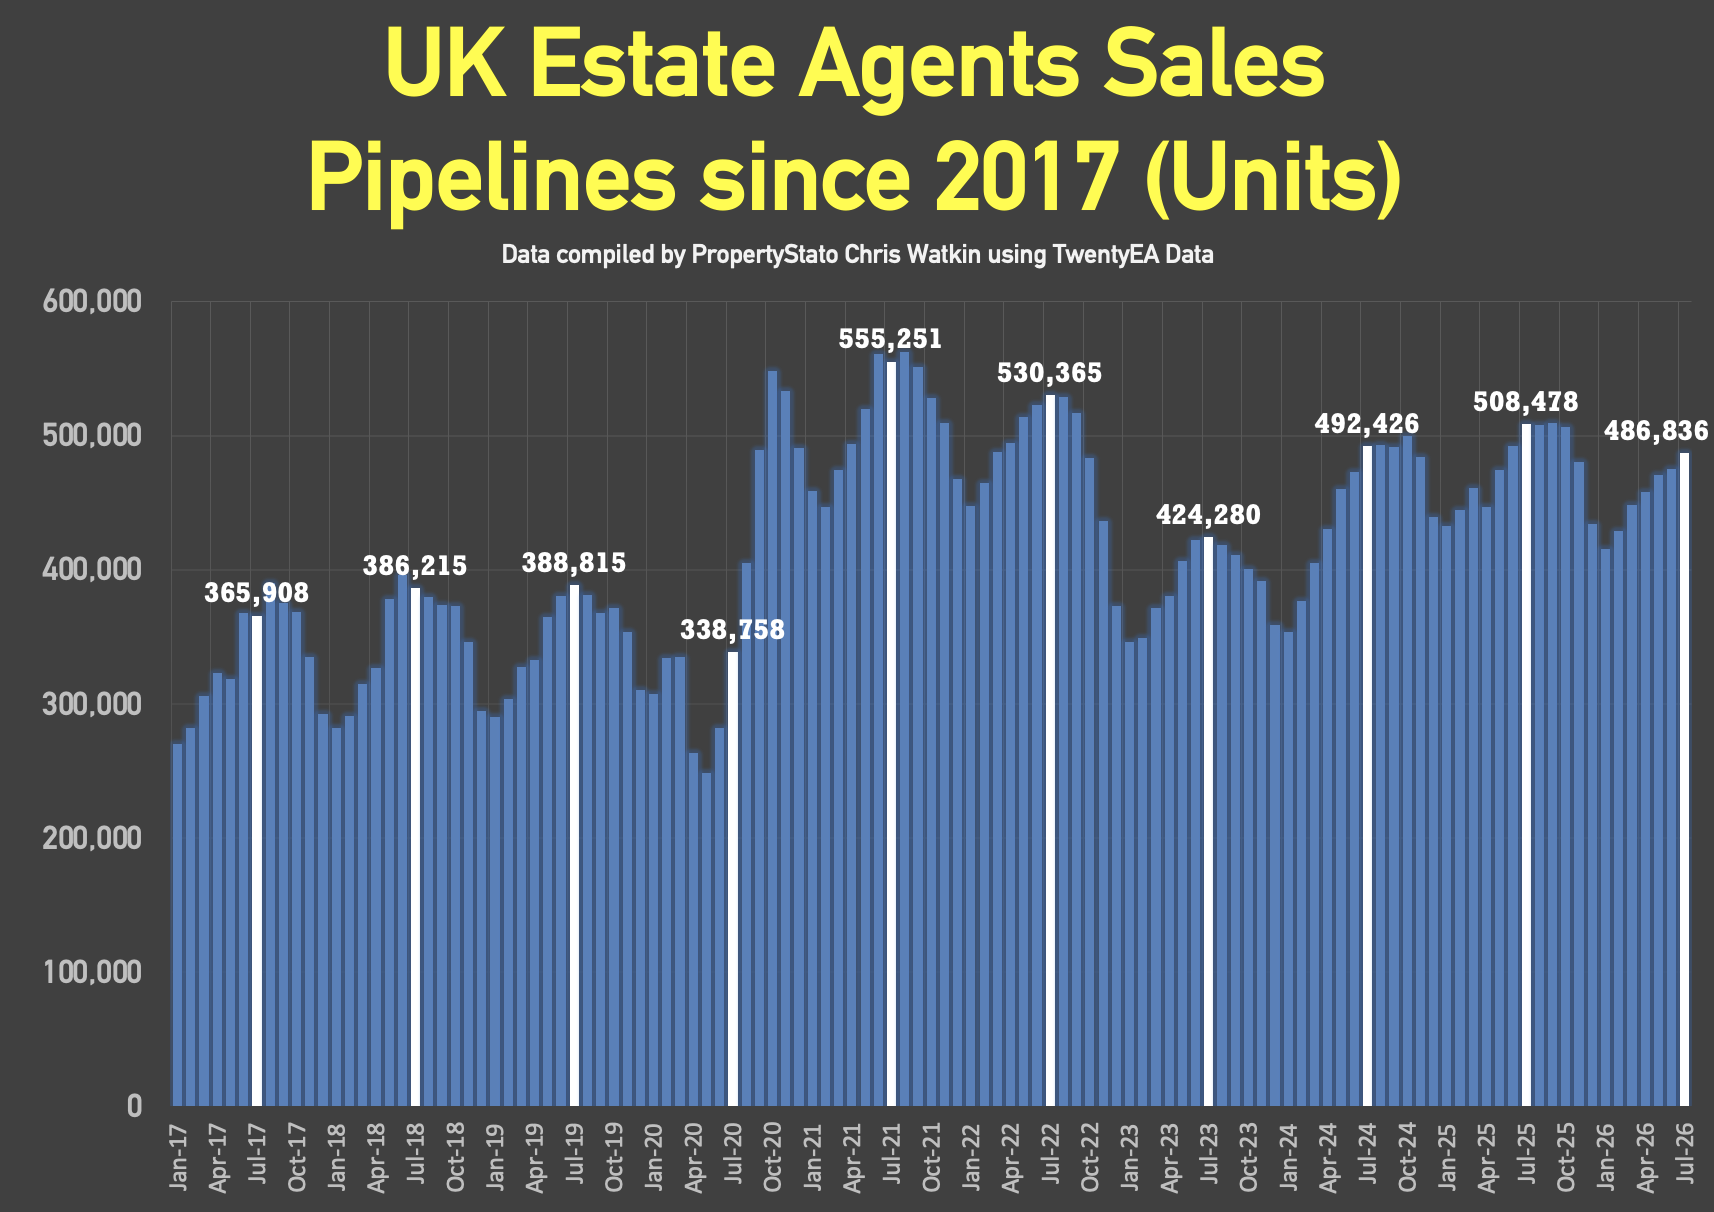
• 487k homes in agent’s sales pipeline on 1st August 2026, lower than 12 months ago on 1st August ’25 (508k)
House Prices (£/sq.ft)
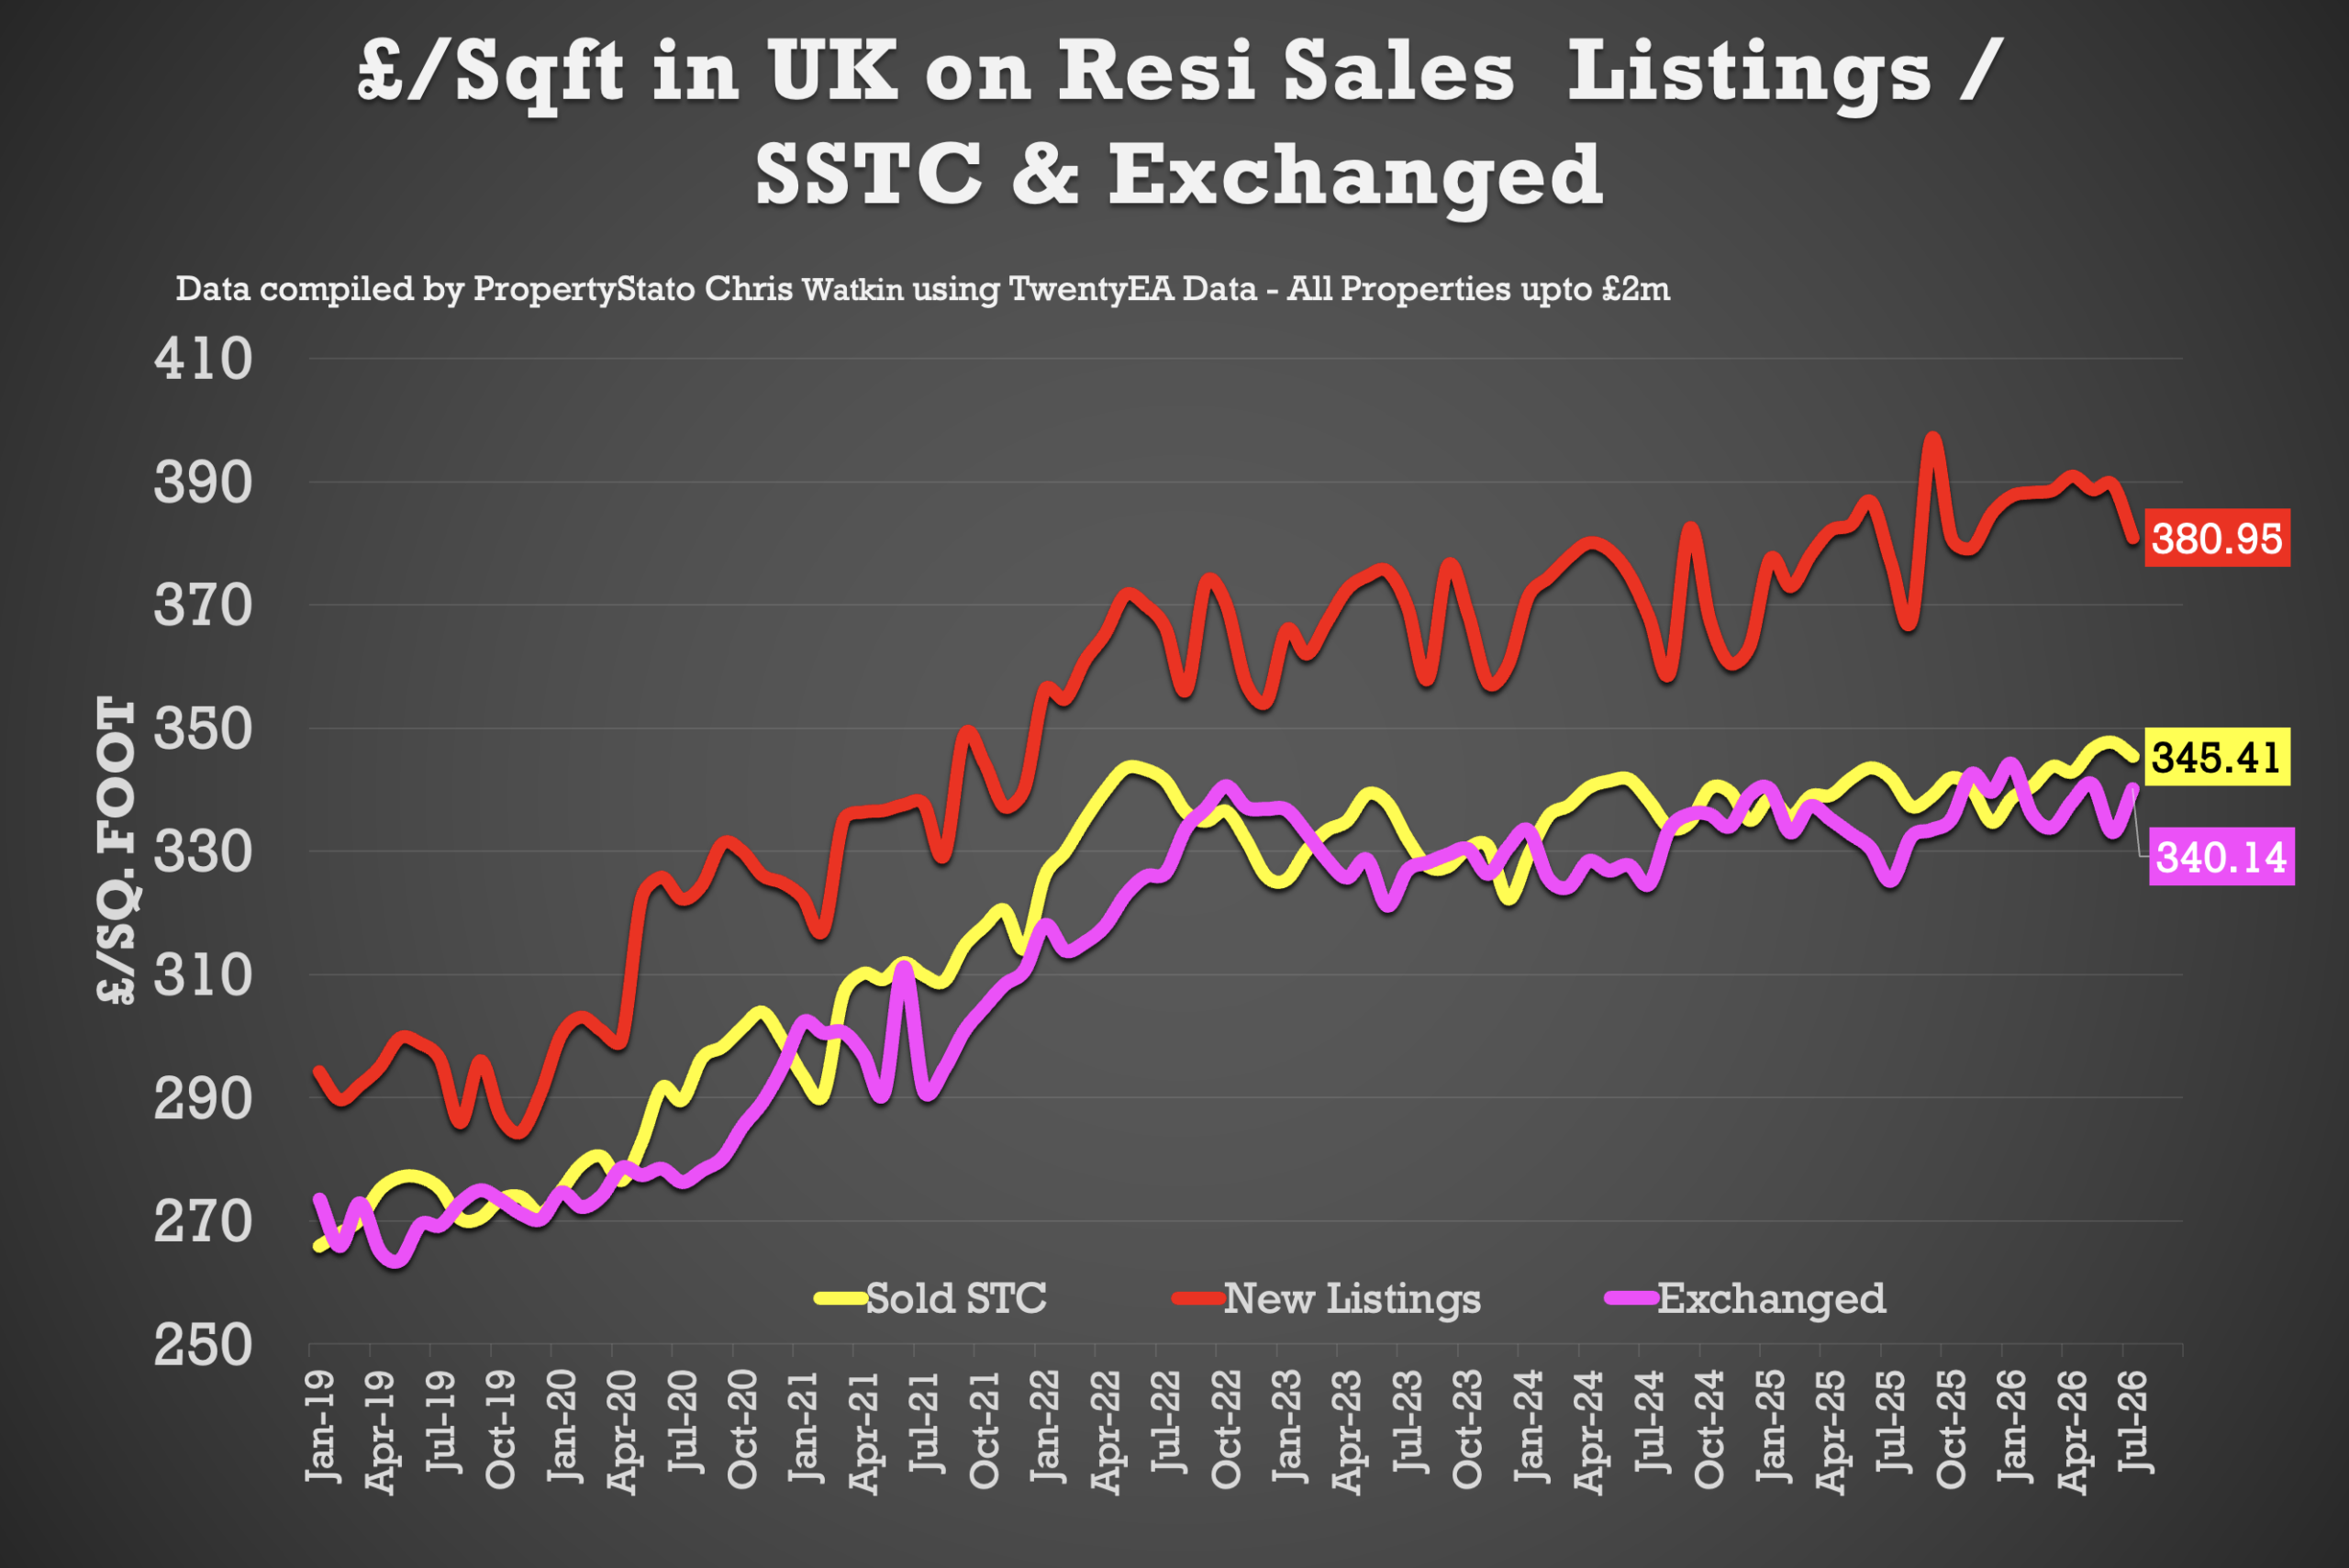
• July ’26 agreed sales averaged £345.41 per sq.ft. 1.2% higher than 12 months ago (£341.43) and 11.9% than 5 years ago (£308.60). The £/sqft at sale agreed matches the HM Land Registry Index with a 98% accuracy, 5 months in advance. That is why it is so important.
UK Rental Data
• Average Rent in Wk 31 – £1,832 pcm
• Average Rent in August 2026 – £1,823 pcm
• Average Rent in August 2025 – £1,800 pcm
• Average Rent in August 2021 – £1,394 pcm
• Average Rent in YTD 2026 – £1,766 pcm
• 323k UK Rental Stock available to rent in July 26 (319k in July 2025)
• New Rental Properties in July 2026 – 135,928. (128,821 in July 2025 & 111,080 in July 2022)
My first boss 40 years ago took me aside on day one to share some (Yorkshire) words of wisdom that have always proved right:
“Never think anything is so bad it can’t get any worse”
And
“You’ll not earn owt if you know nowt about owt”.
AC
Anonymous Coward2 months ago
Hmmm, the Land Registry figures lag behind a bit and tend to get adjusted upwards as old paperwork gets input through the system.
I’ve used just England because the data isn’t complete for the UK as a whole prior to January 2005.
YTD Land Registry figures show 120,611 completions in England only, the third lowest Q1 since modern records began in 1995. The worst Q1 was of course in 2009 with the second in 2011.
The long term average for Q1 is 191,837. But, overall transaction levels have been noticeably lower since the Credit Crunch.
Interestingly Q4 2025 had 174,286 transactions, which is the sixth lowest Q4 on record. Q3 was eighth lowest and Q2 4th lowest.
Overall, 2025 was not a good year for property transactions with just under 750,000 in England.
Poor market confidence due to wars abroad and mortgage rate fluctuations all seem to be dragging market activity down.
Last week a client provided me with three agents’ valuations which mentioned their percentage fees, all of which were below 1%.
It takes a while for reports to start to appear in the national media but down here in the Home Counties it’s starting to look bad. Really bad. No uptake on price reductions, phone not ringing etc etc
CW
Christopher Watkin2 months ago
You are right – it’s really tough in certain parts of the South East. Which town are you in? I will pull the stats for your town
M
mhfleming@btinternet.com2 months ago
Unexpected? Not by me. And there’s more pain to come yet this summer. But, equally, I am expecting a significant upturn in Quarter 4. If you’re interested in my reasoning – or my take on where we’re headed next – grab yourself half an hour and watch my latest webcast. Just search ‘Matt Fleming dirt:3’ on YouTube
WO
Write O Right.2 months ago
The market is obviously subdued, and we had a dramatic and well-documented heatwave. That’s probably about it.
Generally, things seem a little more stable. There is significant pent-up demand, so if any positive news comes out of domestic growth or global improvements, expect a bounce.
CW
Christopher Watkin2 months ago
the stats for the week just gone (which will be published don Friday in PIE) have seen a bounce back
Get your free daily news email from
EYE
Enter your email below to receive the latest news each morning direct to your inbox.

 Listings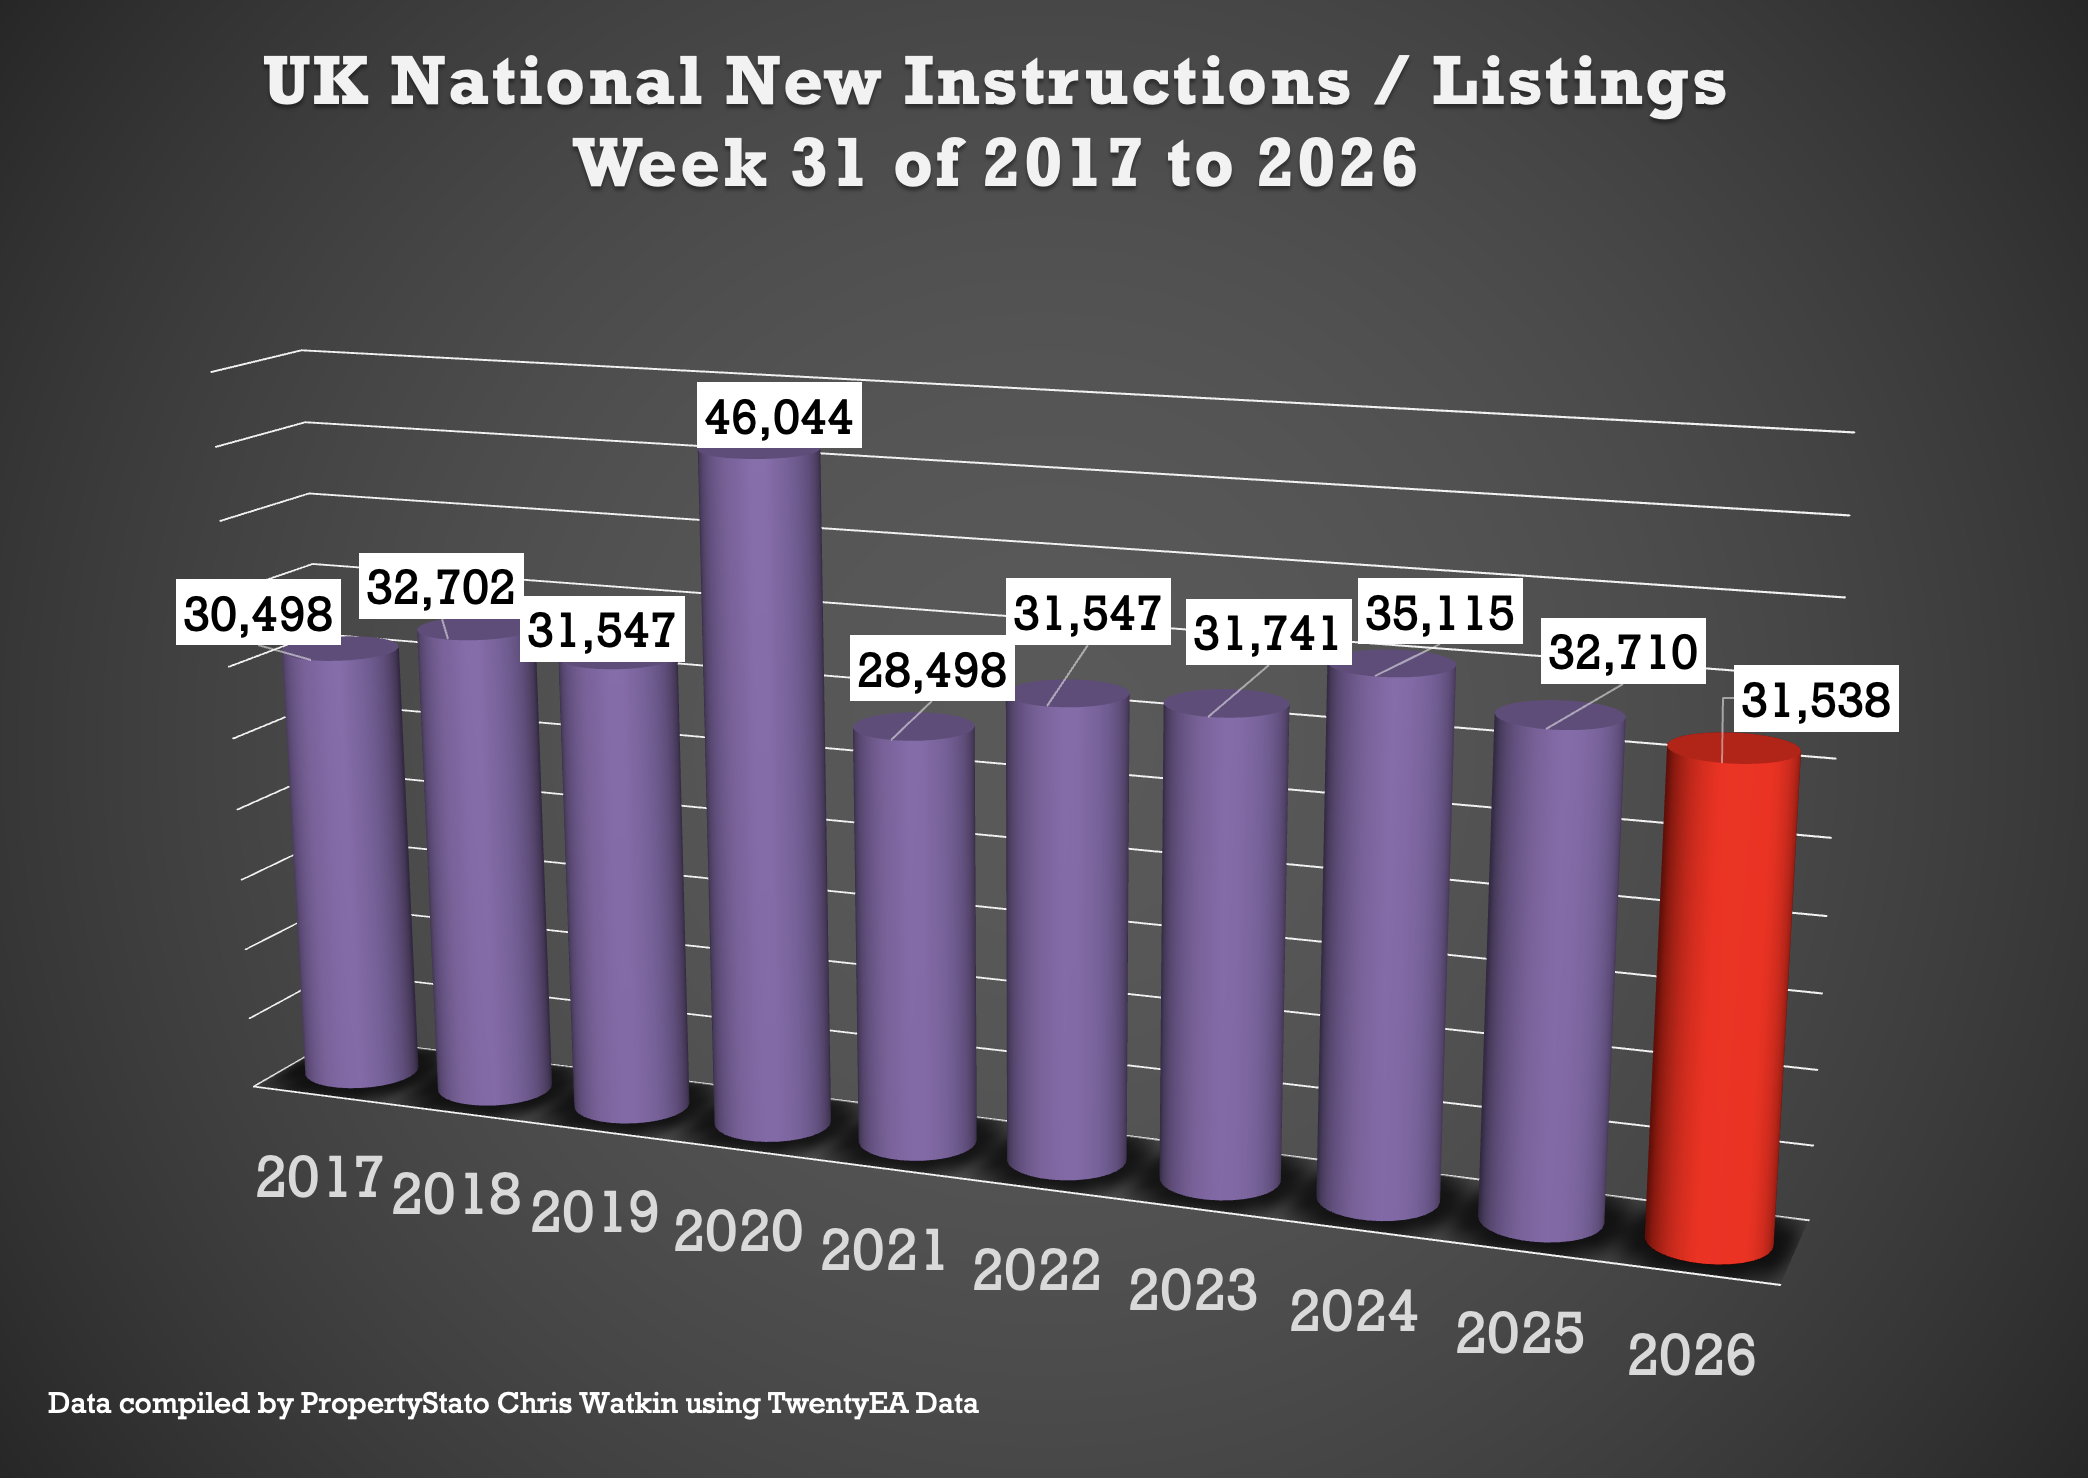
 Price Reductions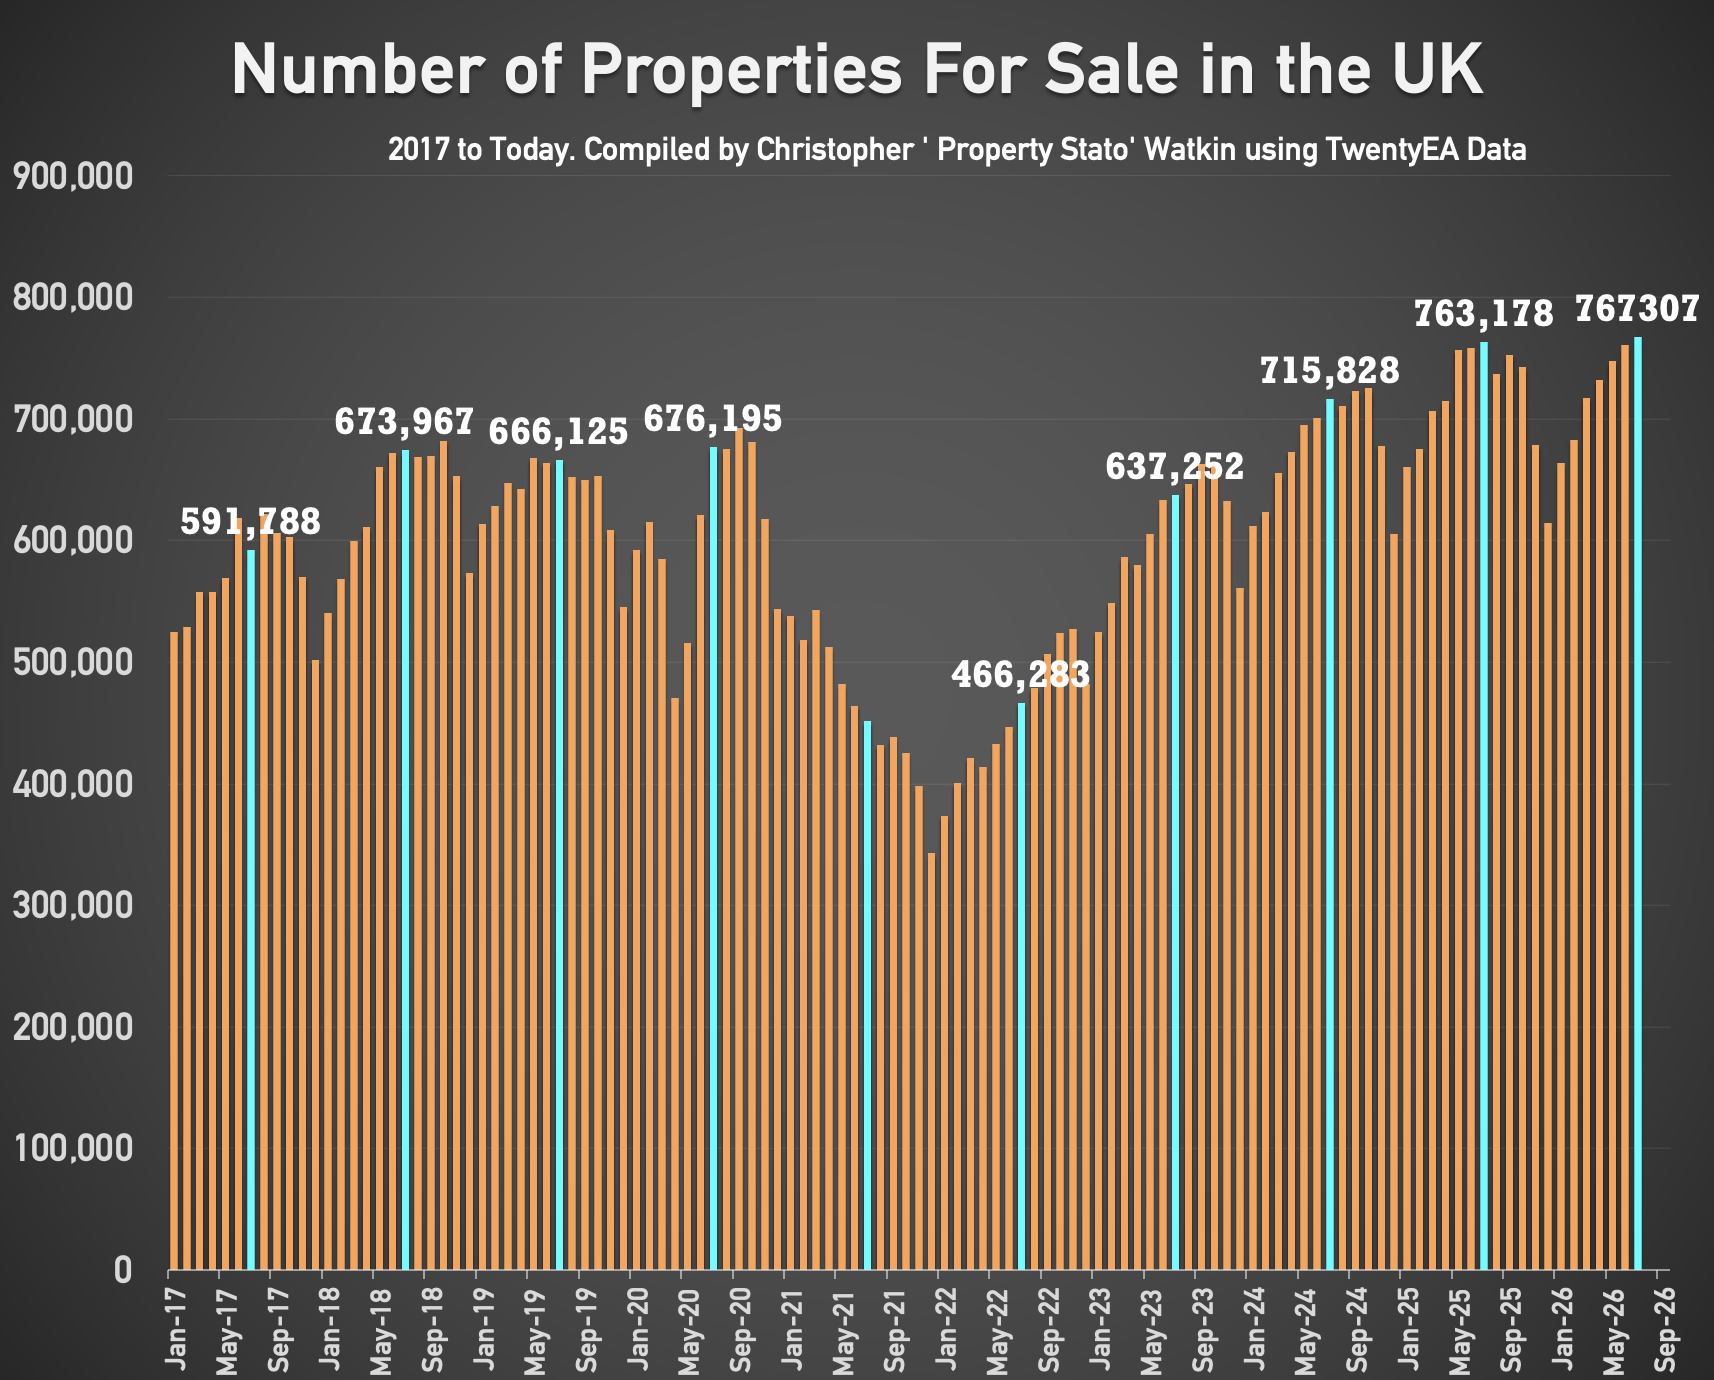







Comments (7)
My first boss 40 years ago took me aside on day one to share some (Yorkshire) words of wisdom that have always proved right:
“Never think anything is so bad it can’t get any worse”
And
“You’ll not earn owt if you know nowt about owt”.
Hmmm, the Land Registry figures lag behind a bit and tend to get adjusted upwards as old paperwork gets input through the system.
I’ve used just England because the data isn’t complete for the UK as a whole prior to January 2005.
YTD Land Registry figures show 120,611 completions in England only, the third lowest Q1 since modern records began in 1995. The worst Q1 was of course in 2009 with the second in 2011.
The long term average for Q1 is 191,837. But, overall transaction levels have been noticeably lower since the Credit Crunch.
Interestingly Q4 2025 had 174,286 transactions, which is the sixth lowest Q4 on record. Q3 was eighth lowest and Q2 4th lowest.
Overall, 2025 was not a good year for property transactions with just under 750,000 in England.
Poor market confidence due to wars abroad and mortgage rate fluctuations all seem to be dragging market activity down.
Last week a client provided me with three agents’ valuations which mentioned their percentage fees, all of which were below 1%.
Prices down, percentage fees down, transaction levels down.
A perfect storm!
It takes a while for reports to start to appear in the national media but down here in the Home Counties it’s starting to look bad. Really bad. No uptake on price reductions, phone not ringing etc etc
You are right – it’s really tough in certain parts of the South East. Which town are you in? I will pull the stats for your town
Unexpected? Not by me. And there’s more pain to come yet this summer. But, equally, I am expecting a significant upturn in Quarter 4. If you’re interested in my reasoning – or my take on where we’re headed next – grab yourself half an hour and watch my latest webcast. Just search ‘Matt Fleming dirt:3’ on YouTube
The market is obviously subdued, and we had a dramatic and well-documented heatwave. That’s probably about it.
Generally, things seem a little more stable. There is significant pent-up demand, so if any positive news comes out of domestic growth or global improvements, expect a bounce.
the stats for the week just gone (which will be published don Friday in PIE) have seen a bounce back