
 Nearly 99,000 UK homes were sold subject to contract during the first four full weeks of June, down 9.4% compared with the same period last year, as higher mortgage costs and political uncertainty continued to weigh on buyer activity.
However, the slowdown should be viewed in context. The June 2026 total remains above the 92,000 sales agreed during the equivalent period in 2023, although it is below the 103,000 recorded in 2024, suggesting the market has softened rather than stalled.
🟩 Listings
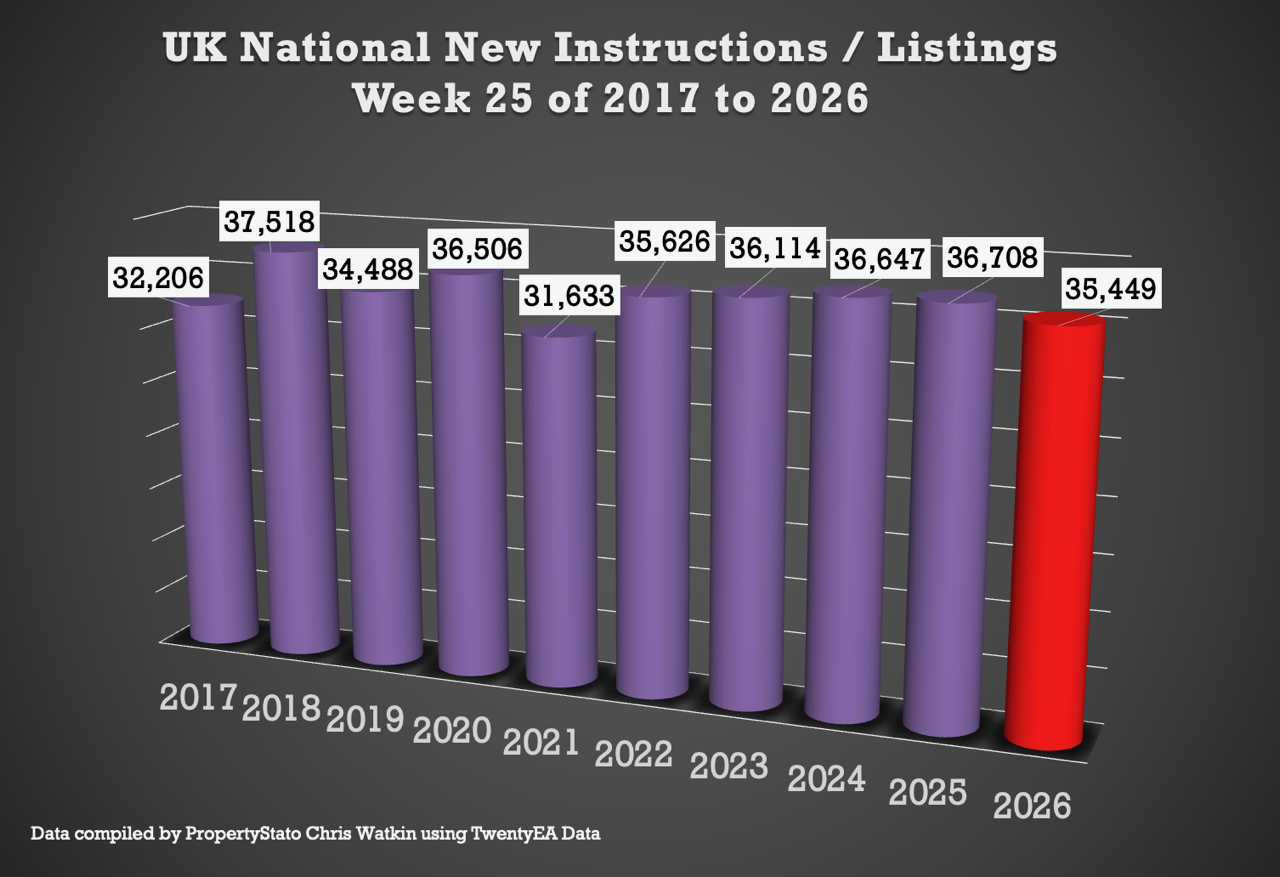
Week 25 ..
35.4k new listings this week, (36k last week).
Weekly 2026 average : 37.3k.
10 year week 25 average : 35.3k
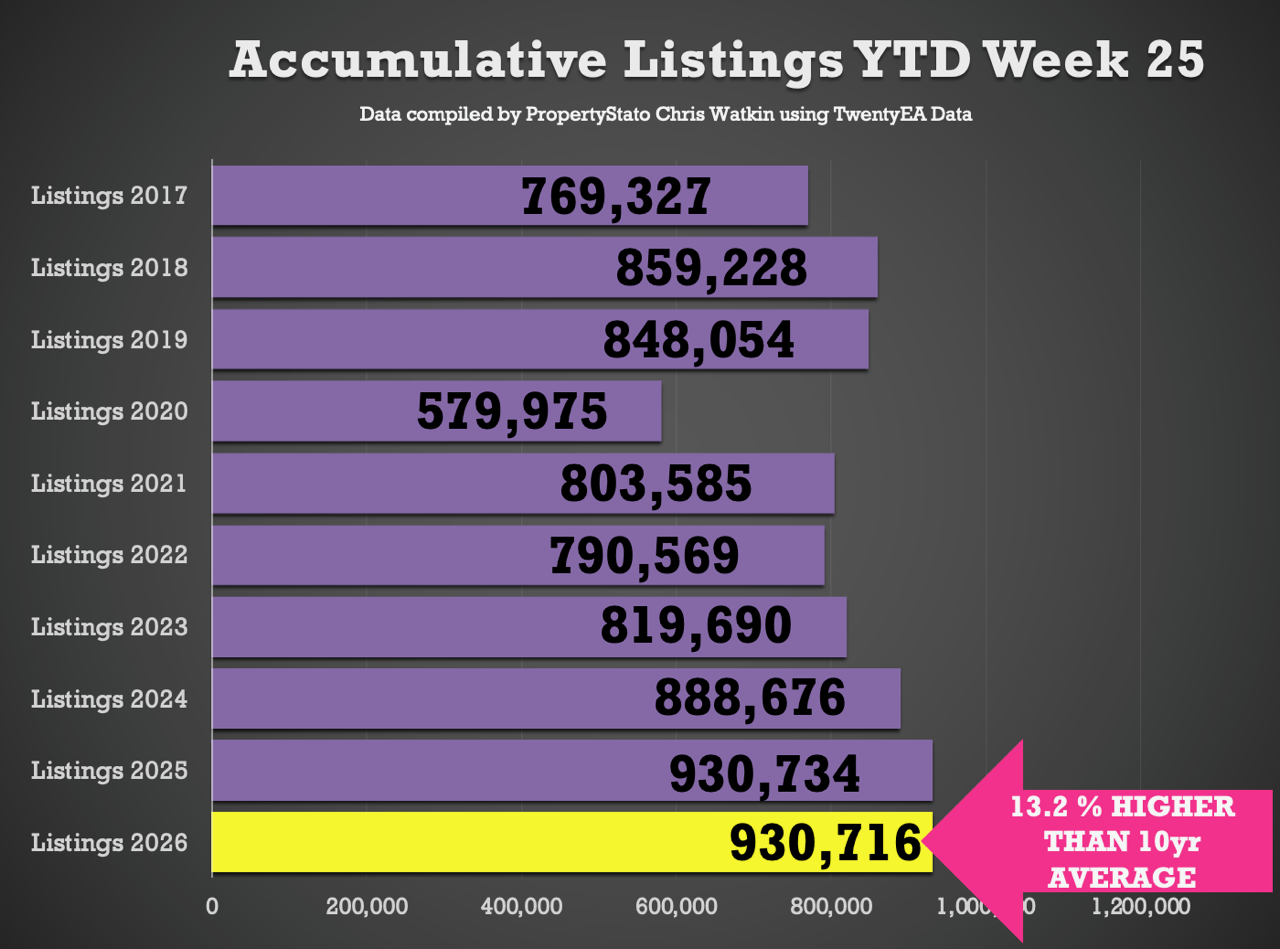
Year to Date
931k new listings YTD
Identical to 2025 YTD (931k)
4.7% ahead of 2024 YTD (889k)
12.7% higher than the 2017–19 average YTD (822k).
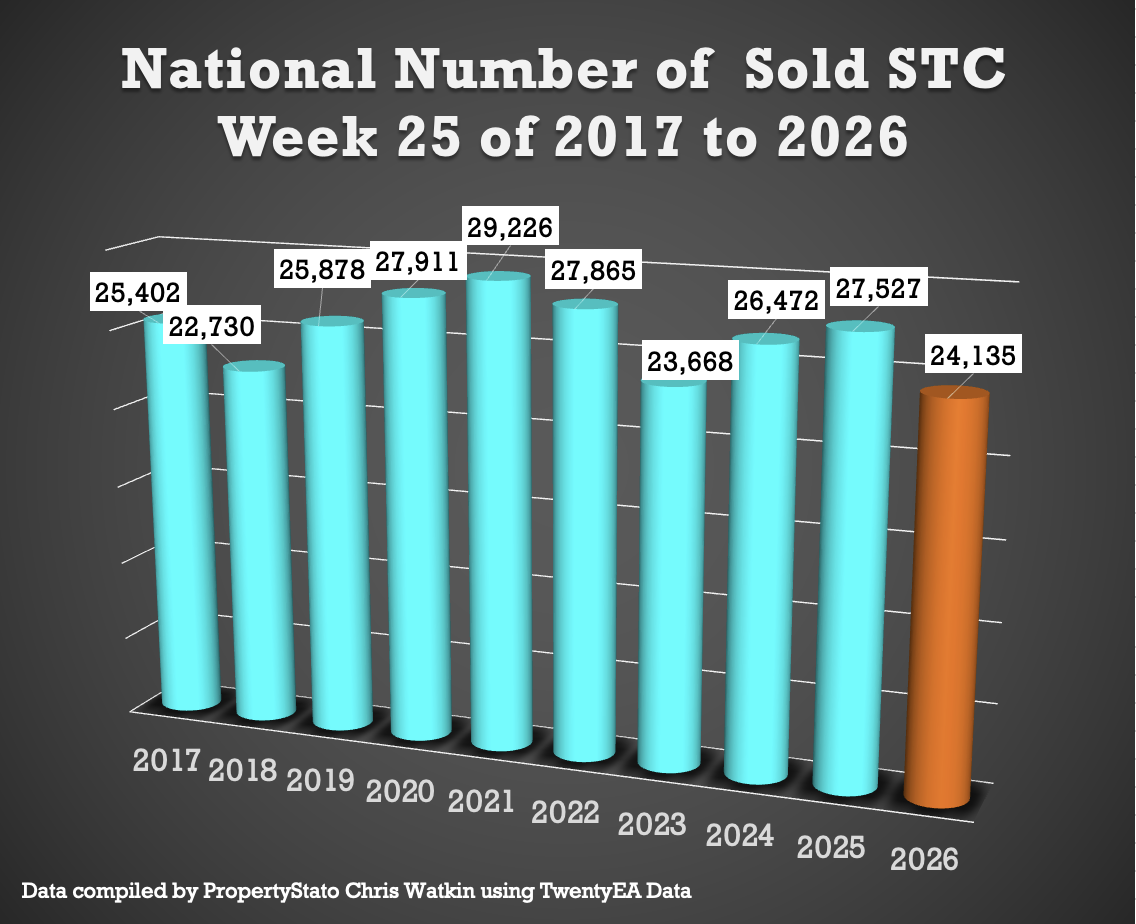
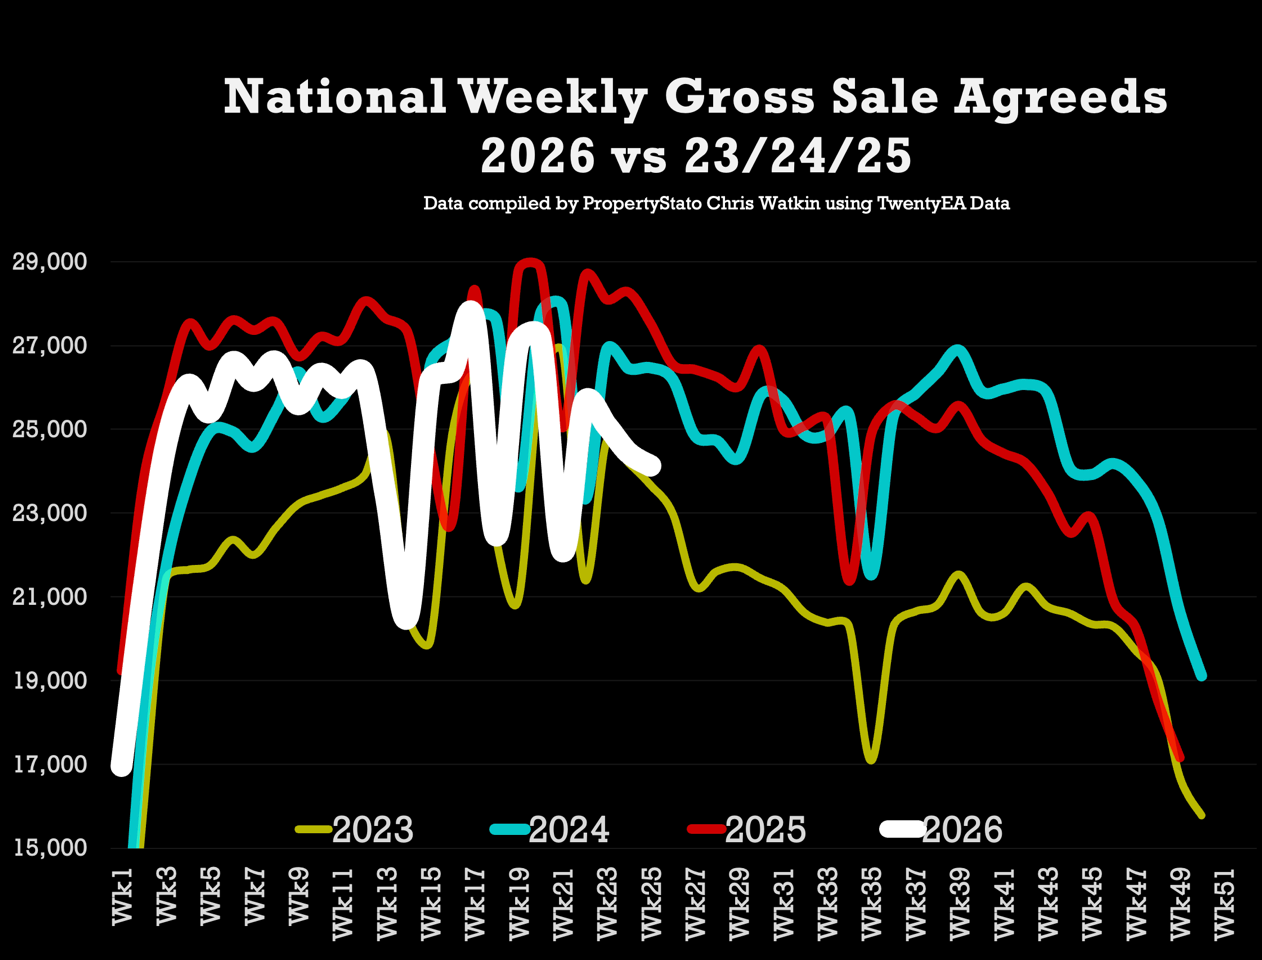
🟩 UK Gross Resi Sales
Week 25 ..
24.1k homes sold stc this week 24 (24.4k last week)
10 year week 25 average : 26.1k
2026 weekly average : 24.8k.
Year to Date for house sales
620k UK homes sold stc YTD
6.6% lower than 2025 YTD (664k)
Yet still Gross Sales are still …
0.8% higher than 2024 YTD (615k)
11% higher than 2023 YTD (559k)
7.9% higher above pre Covid 2017-19 years (575k).
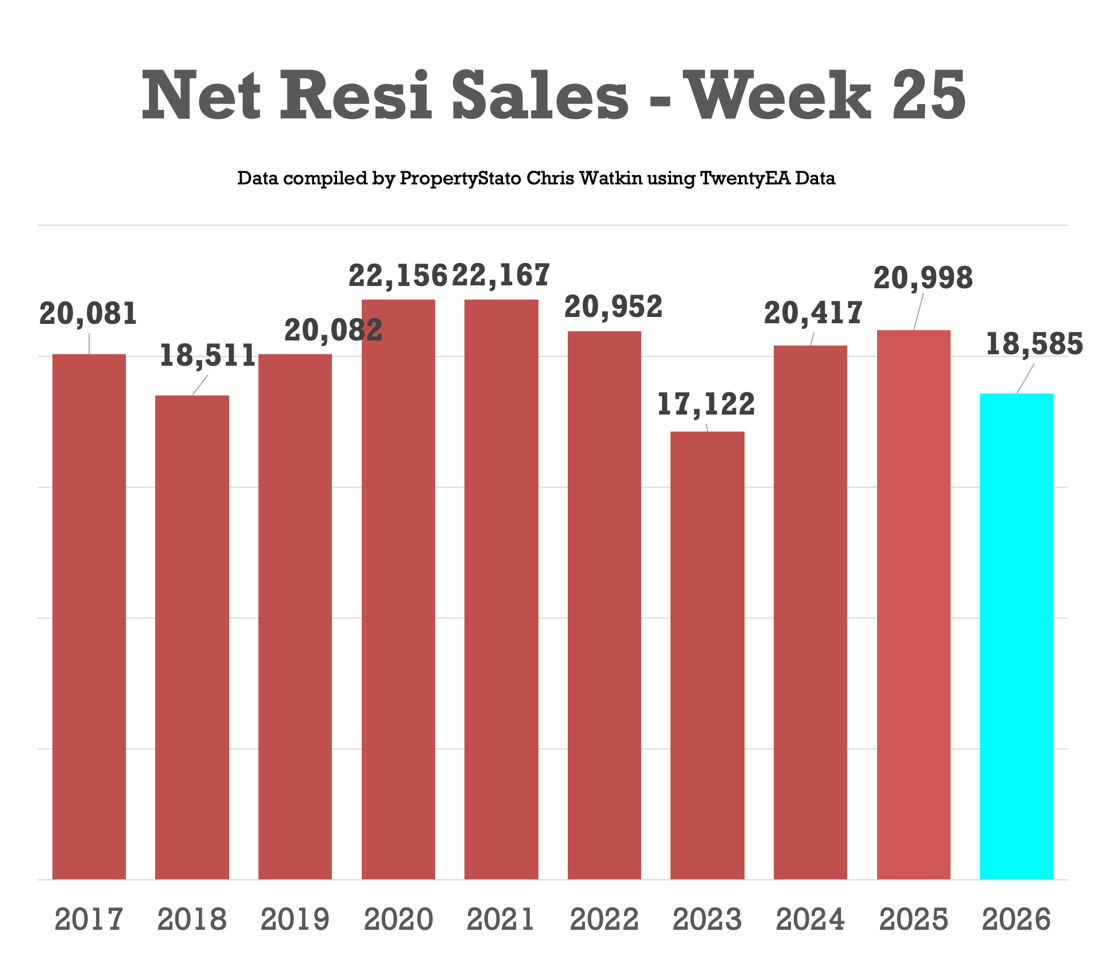
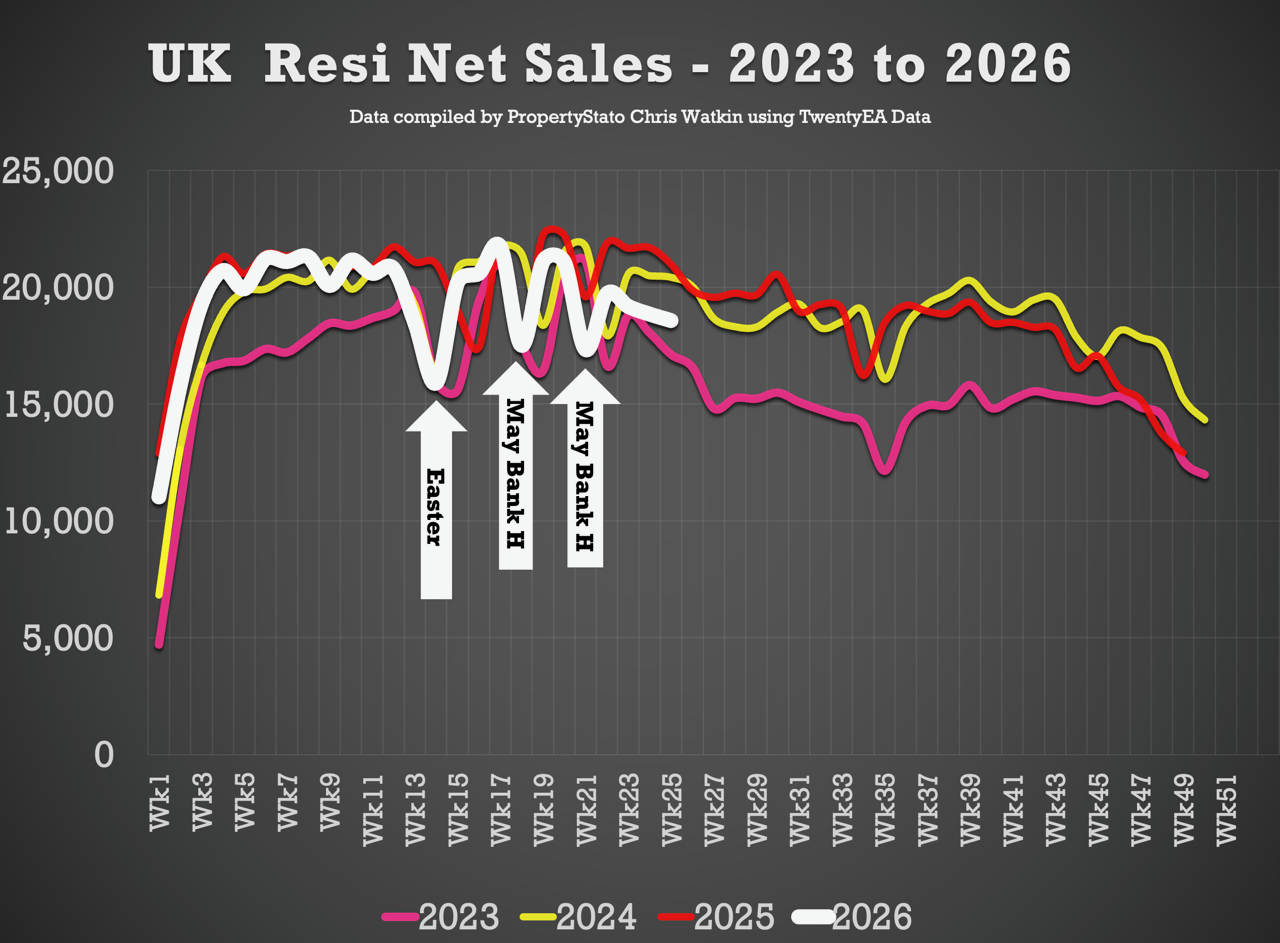
🟩 UK Net Resi Sales YTD
(Net Sales being Gross Sales less Sale Fall Thrus).
Week 25
18.6k Net Sales (18.9k last week)
10 year Week 25 average: 20.1k.
Weekly average for 2026: 19.3k.
Year to Date
484k UK net home sales YTD
5% lower than 2025 (509k),
0.7% ahead of 2024 (480k),
12.4% ahead of 2023 (430k)
5.5% above the 2017–19 average (458k).
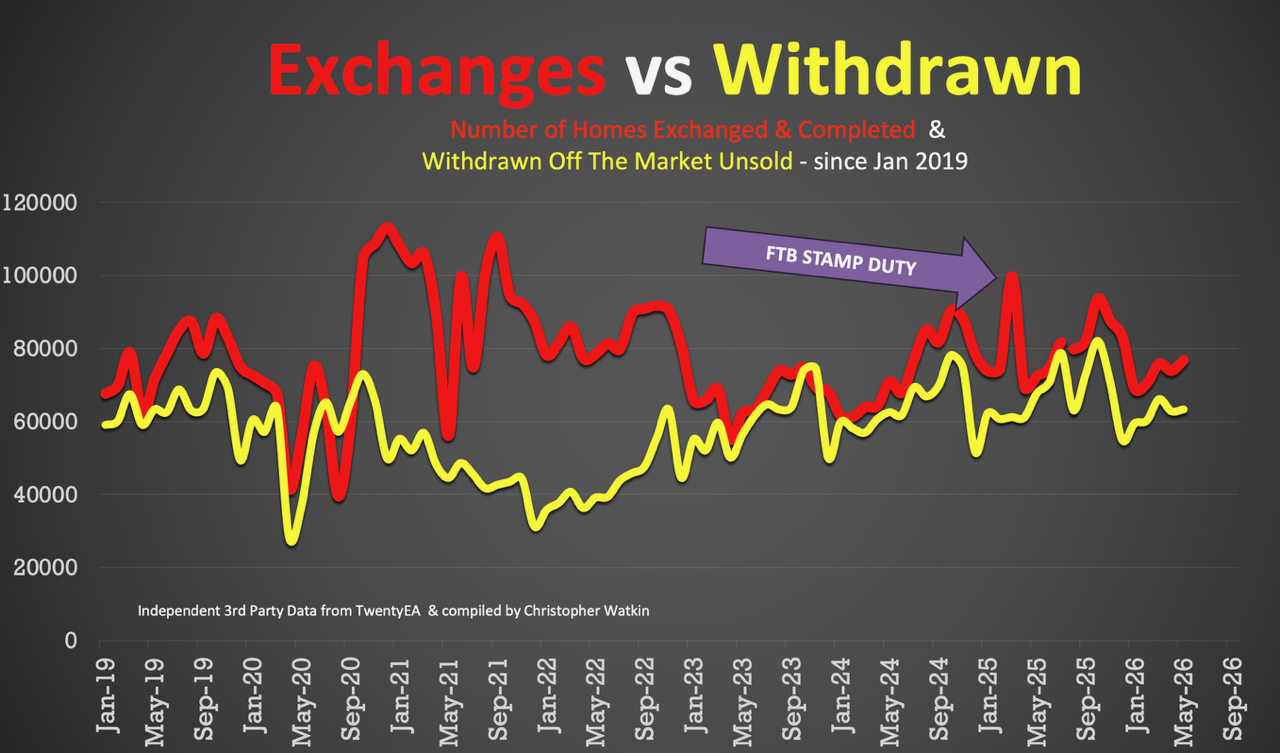
🟩 Exchanges
• May 2026 – 76.8k Exchanges. (Always a month in arrears as they take time to come through)
• 365k UK Exchanges YTD to end of May 2026. 5.5% lower than Jan to May 2025, when it was 386k. NB. There were more exchanges in Q1 2025 because of the stamp duty holiday which finished in April 2025.
Additional info …
🟥 Price Reductions
• 25.8k reductions this week on a 747k UK homes for sale
• 13.4% of UK homes for sale were reduced in May (June figures to follow next week)
• 2025 average 12.8%, versus the 6-year long-term average of 10.7%.
🟥 Withdrawals
• May 2026 – 64k Withdrawals – again, this figure will increase as more May withdrawals come thru the system throughout June
• That means that 45.2% of all homes that left UK Estate Agent books in May went unsold.
🟥 Price Difference between Asking Price of Listings & Asking Price of those Homes that go Sold stc
• 17.9% difference (long term 10 year average is 16% to 17%). (£442k ave Listing Ave Asking price vs £375k Sale Agreed ave Asking price)
🟥 Sell-Through Rate
• 14.6% of homes on agents’ books went SSTC in May ’26.
• Pre-Covid average: 15.5%.
🟥 Sale Fall-Thrus
• Fall-thru rate 23%
• Decade average: 24.5%
• 5.05% of homes sold STC fell thru in May 2026, below both the 2025 average of 5.3% and the 10 year average of 5.8%. (May figures to follow next week)
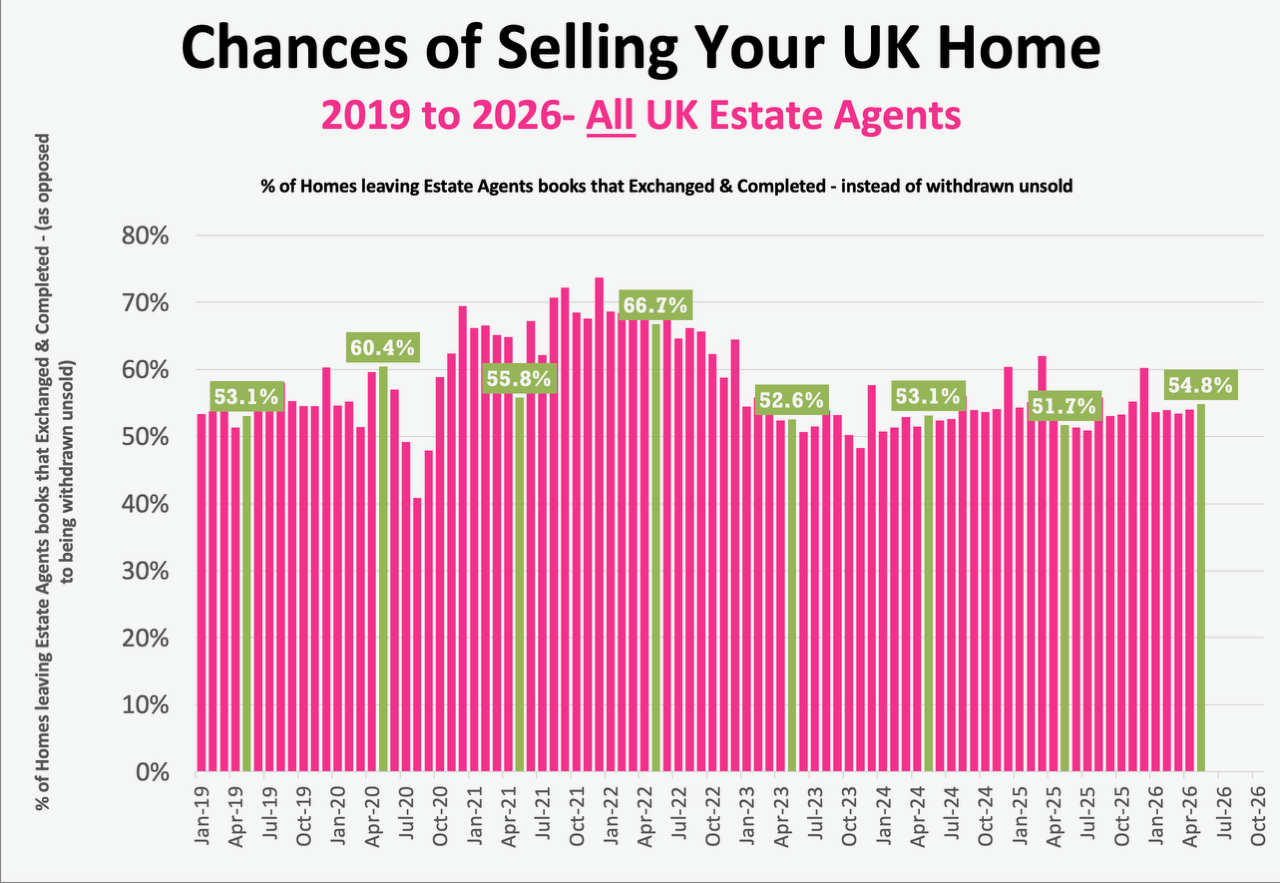
🟥 Probability of Selling (% that Exchange vs withdrawal)
• May 2026 Stats : 54.8% of homes that left agents’ books exchanged & completed in May. (Note this figure will change throughout the month as more May stats come in).
• 57.6% is the 7 year average (which includes the crazy years post lockdown 18 months).
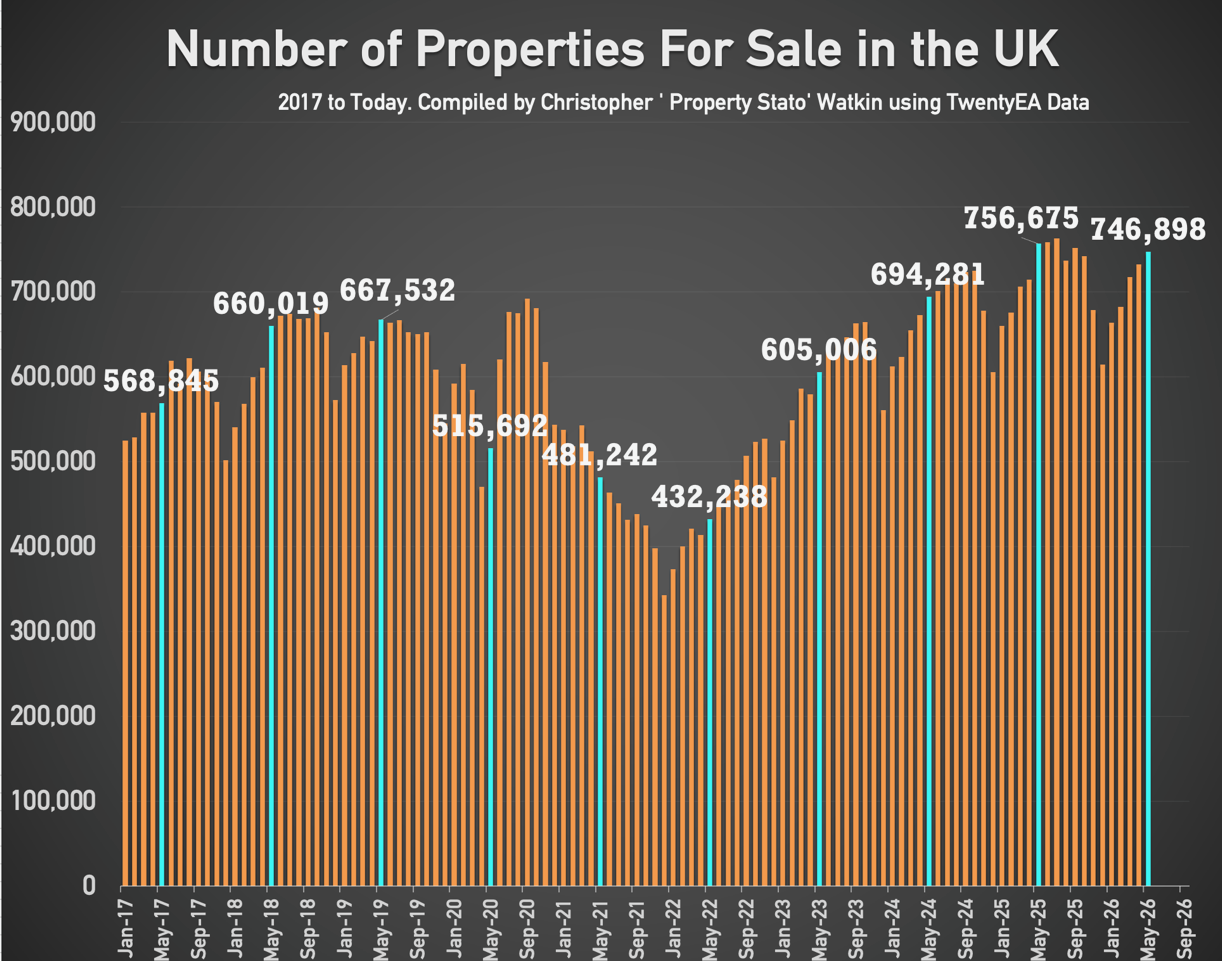
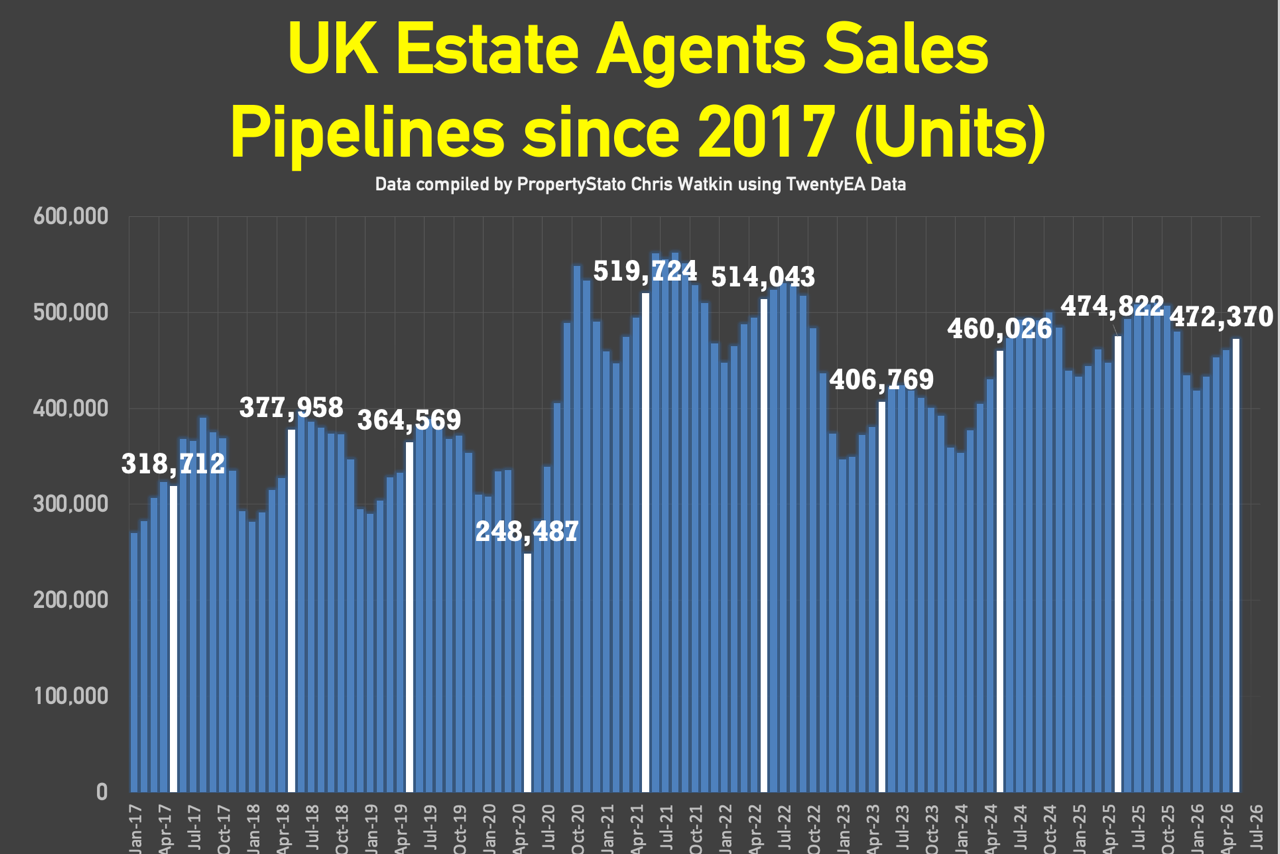
🟥 Stock Levels
• 747k homes on the market on the 1st of June ’26.
• 472k homes in agent’s sales pipeline on the 1st June 2026, slightly lower than 12 months ago on 1st June ’25 (474k).
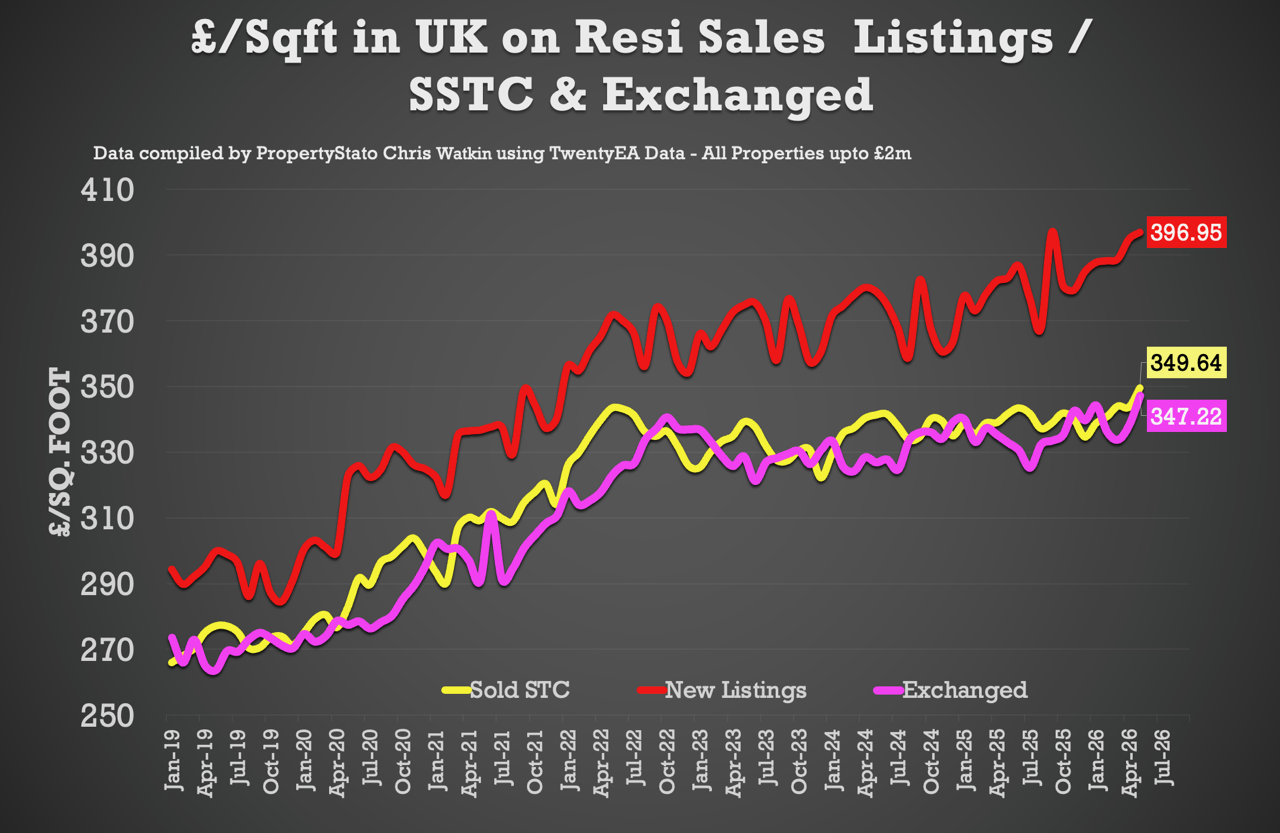
🟥 House Prices (£/sq.ft)
• May ’26 agreed sales averaged £349.64 per sq.ft. 1.9% higher than 12 months ago (£342.87) and 13.2% than 5 years ago (£308.94). The £/sqft at sale agreed matches the HM Land Registry Index with a 98% accuracy, 5 months in advance. That is why it is so important.
🟥 UK Rental Data
• Average Rent in Wk 24 – £1,842 pcm
• Average Rent in June 2026 – £1,811 pcm (£1,791 in June 25)
• Average Rent in YTD 2026 – £1,753 pcm
• 305k UK Rental Stock available to rent in May 26 (311k in May 2025)
🟥 Local Focus this week in the Show
Solihull


