The UK Property Market is on life support and almost dead according to some, yet has anyone told the buyers?
Doom. Gloom. The Budget. Read enough headlines and you would wonder why estate agents bother opening their doors.
Yet homes are still selling. Many Homes. People are still moving. So what are the headlines missing?
This week, Toby Phillips joins me on the UK Property Market Stats Show to get into the numbers. And some agents might find those numbers harder to stomach than the headlines.
Overvaluing. Cheap fees. Price reductions left too late. How much of what gets blamed on “the market” actually starts in the valuation appointment?
Winning the instruction feels good. Explaining three months of silence to the homeowner feels rather different.
Then we head to Weybridge and put the local estate agents under the microscope.
Who gives homeowners the strongest chance of moving? Who achieves the better prices? And does the agent with the most boards have the results to back them up?
Wherever you work, watch how we pull apart the Weybridge figures. Then ask yourself whether you would want your own results on that screen.
Watch this week’s show. The headlines tell you one story.
Let us show you what the numbers say.
🟩 Listings
Week 43 ..
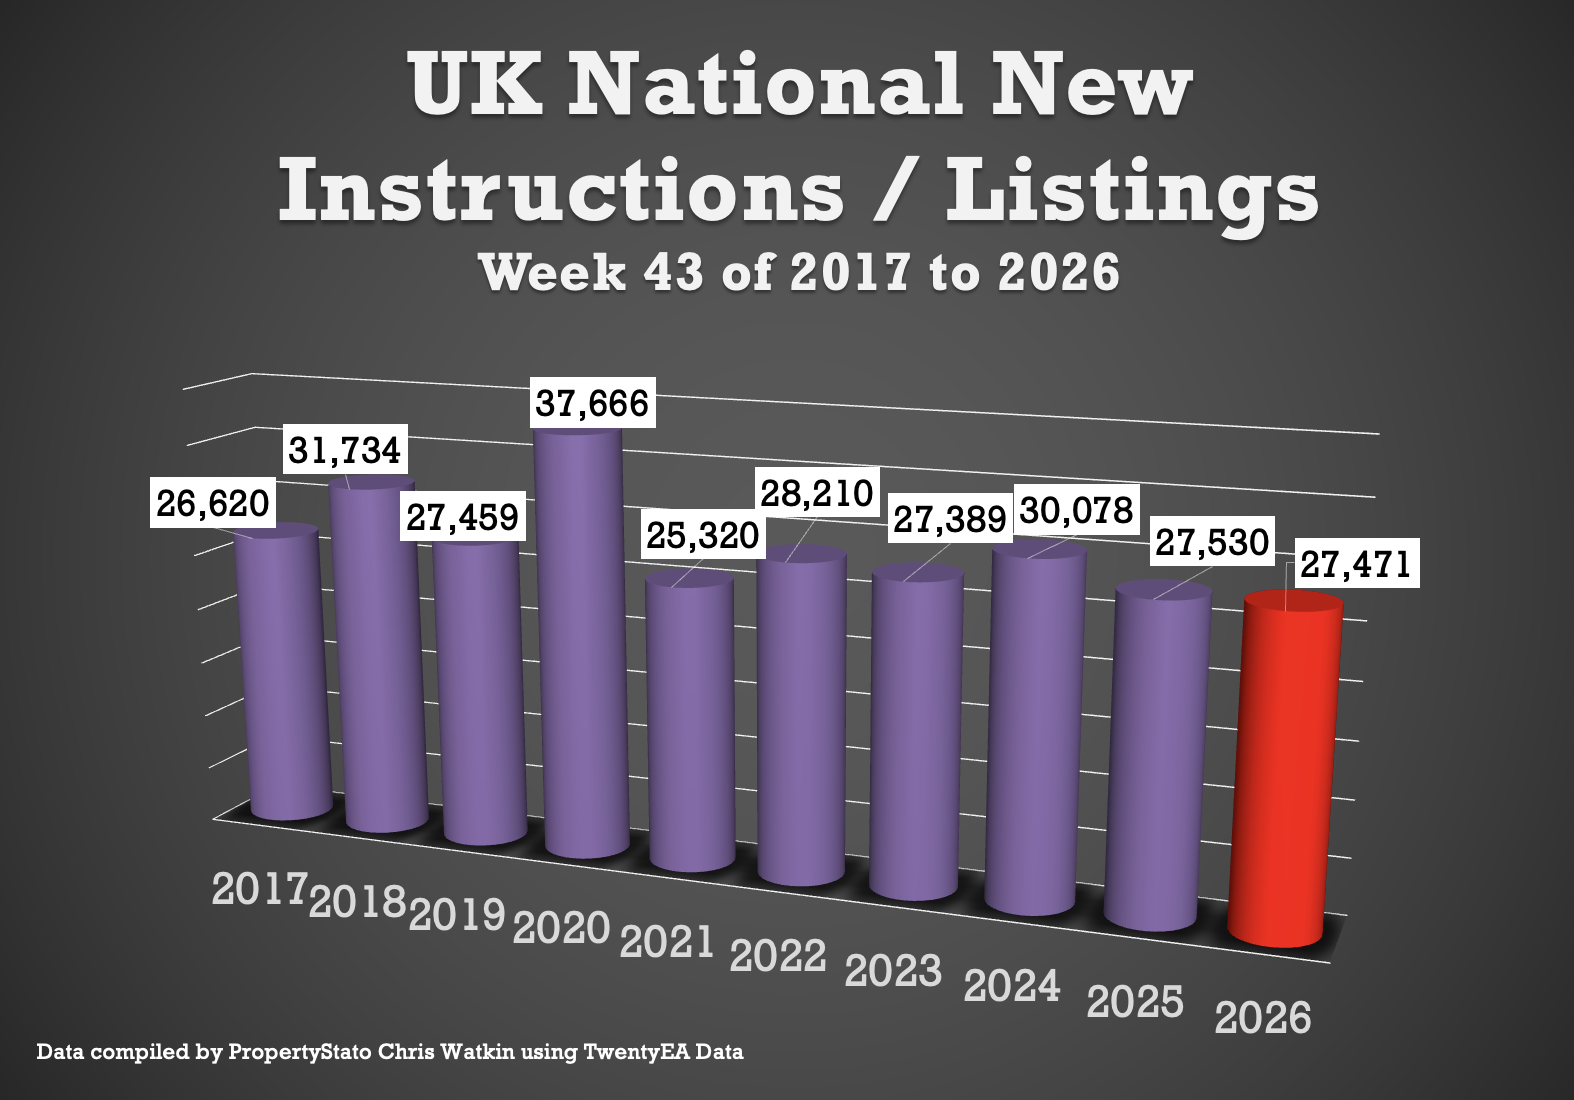
27.5k new listings this week, (30.3k last week).
Weekly 2026 average : 35.5k.
10 year week 43 average : 28.9k
Year to Date
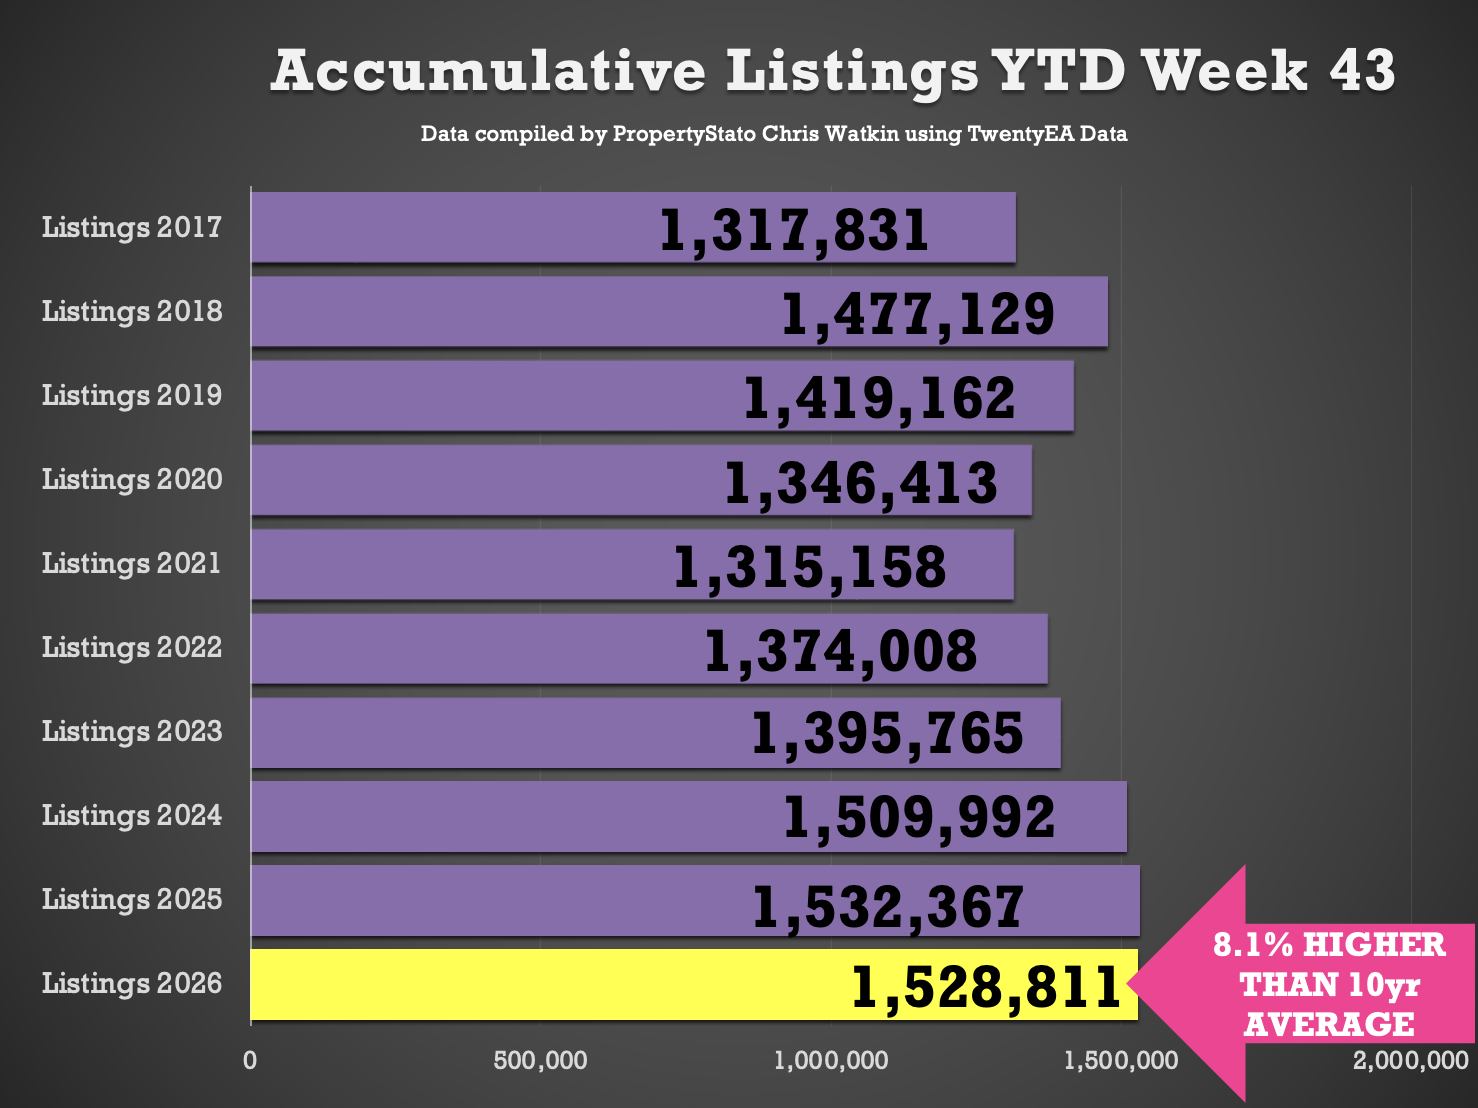
1.529m new listings YTD, which is …
0.2% below 2025 YTD (1.532m)
1.2% higher of 2024 YTD (1.509m)
8.8%higher of 2023 YTD (1.396m)
8.8% higher than the 2017–19 average YTD (1.405m).
7.8% higher than last decade YTD average – 1.421m.
🟩 UK Gross Resi Sales
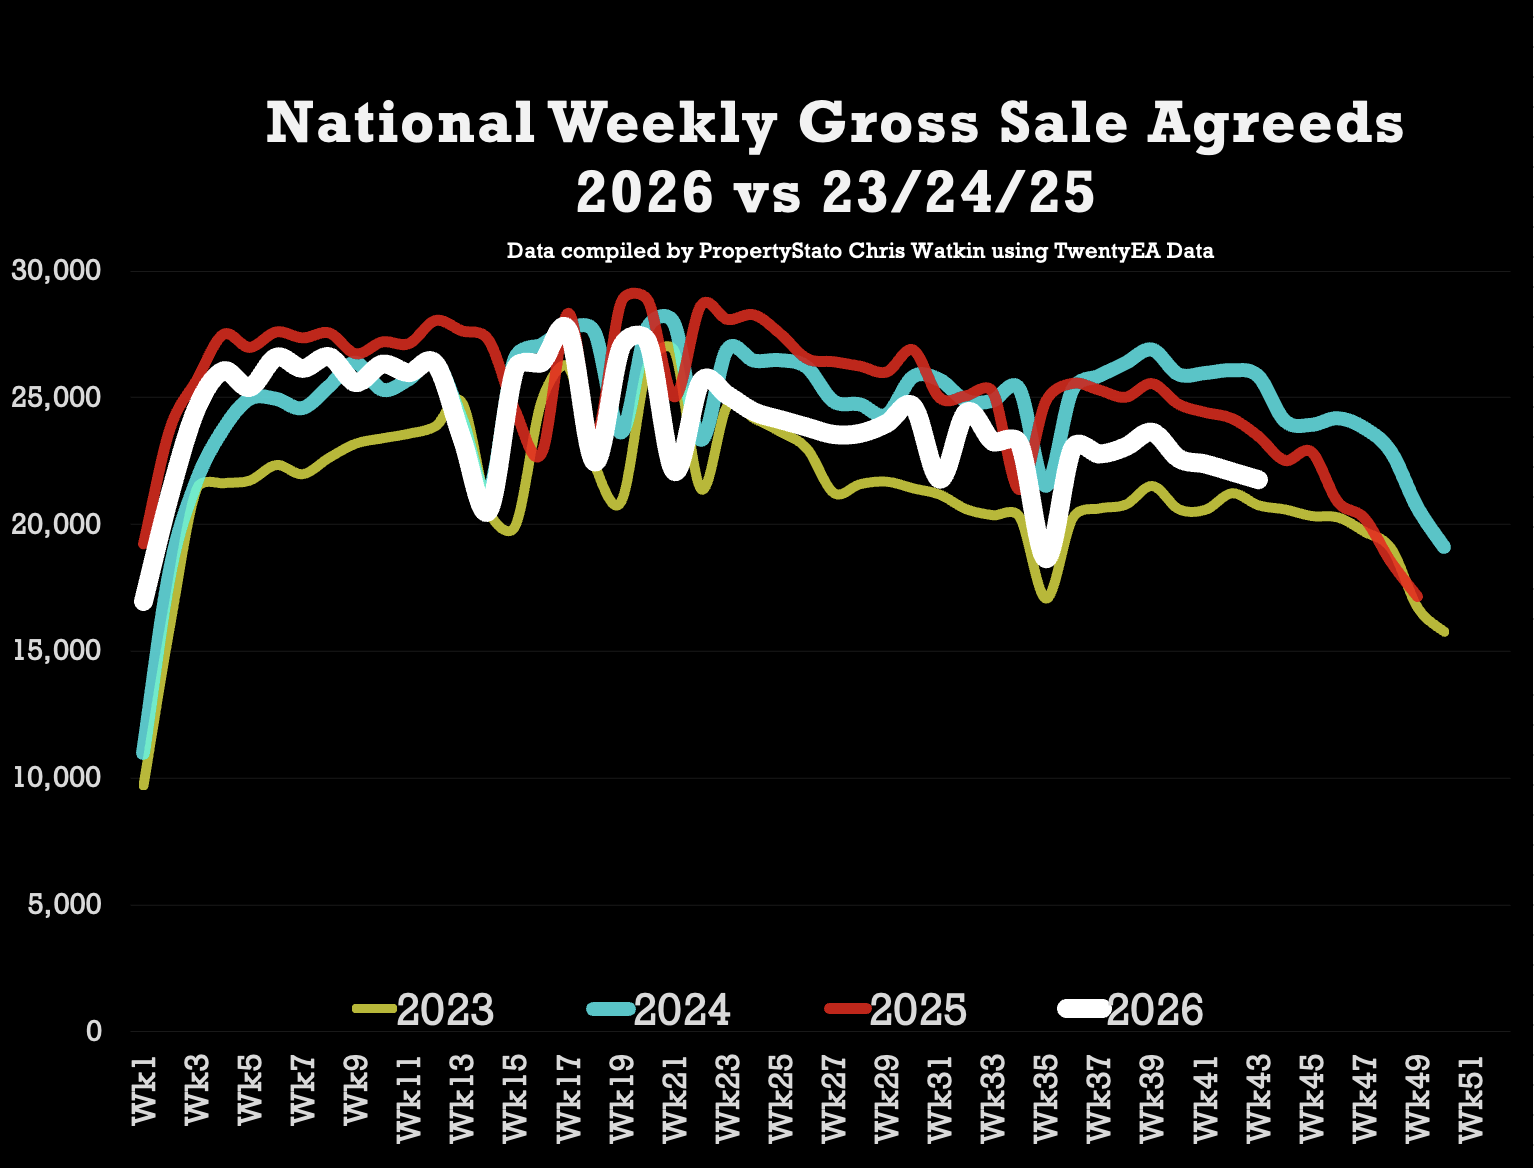
Week 43 ..
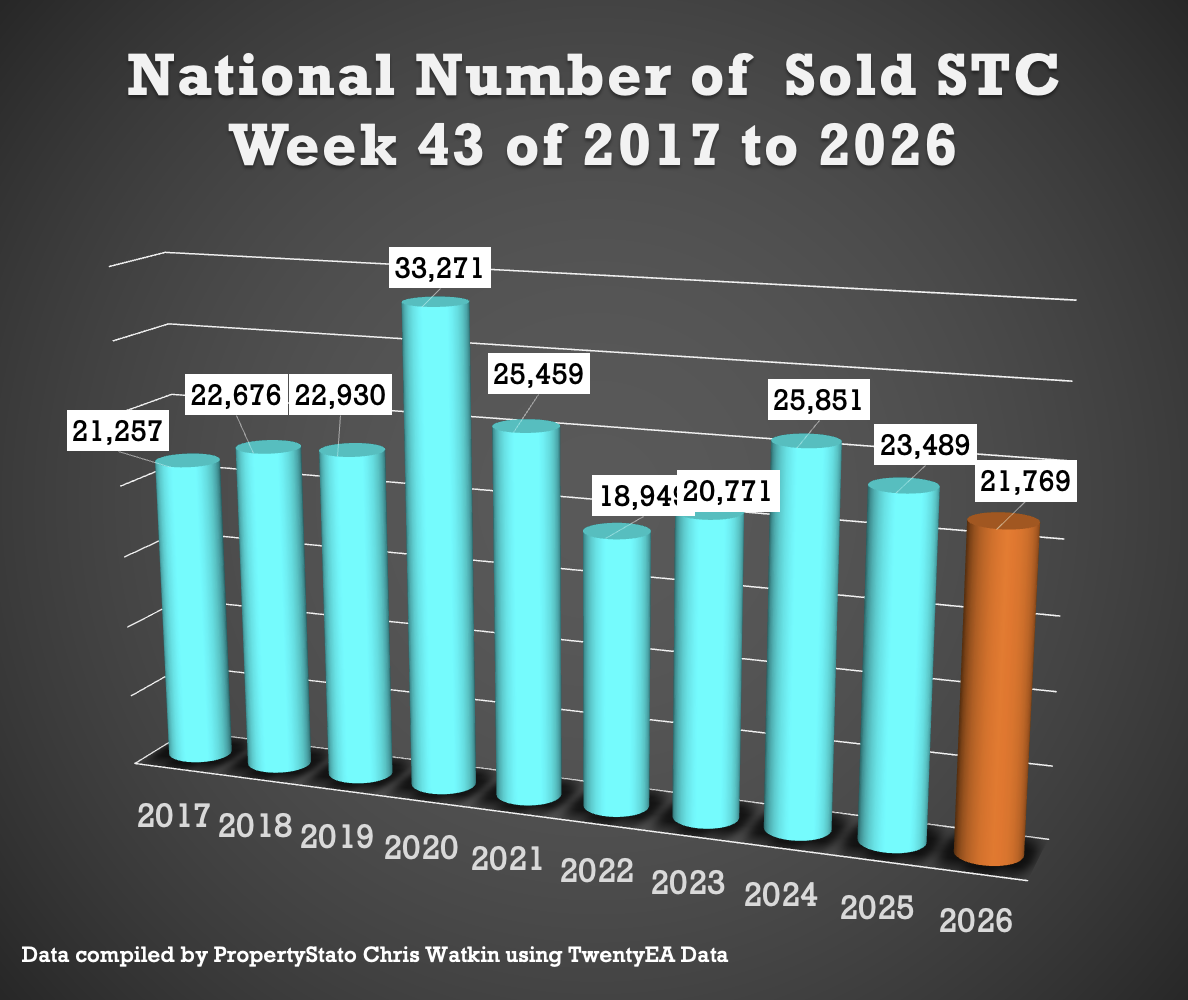
21.8k homes sold stc this week 42 (22.1k last week)
10 year week 43 average : 23.6k
2026 weekly average : 24k.
Year to Date for house sales
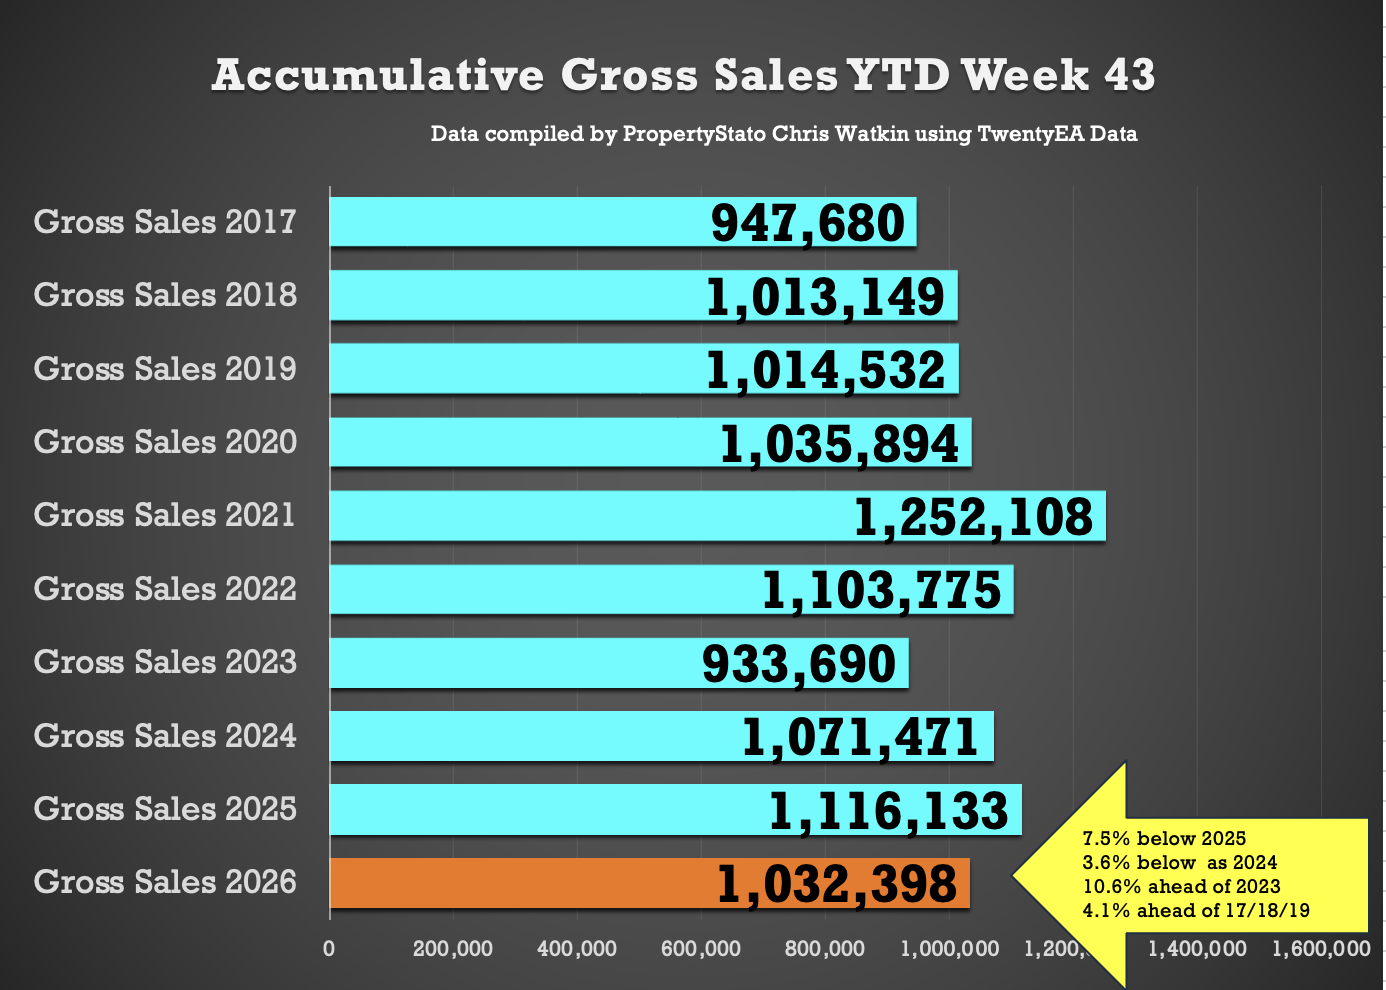
1.032m UK homes sold stc YTD, which is …
7.5% lower than 2025 YTD (1.116m)
3.6% lower to 2024 YTD (1.071m)
10.6% higher than 2023 YTD (934k)
4.1% higher above pre Covid 2017-19 years (992k).
1.9% lower than the decade YTD average (1.052m).
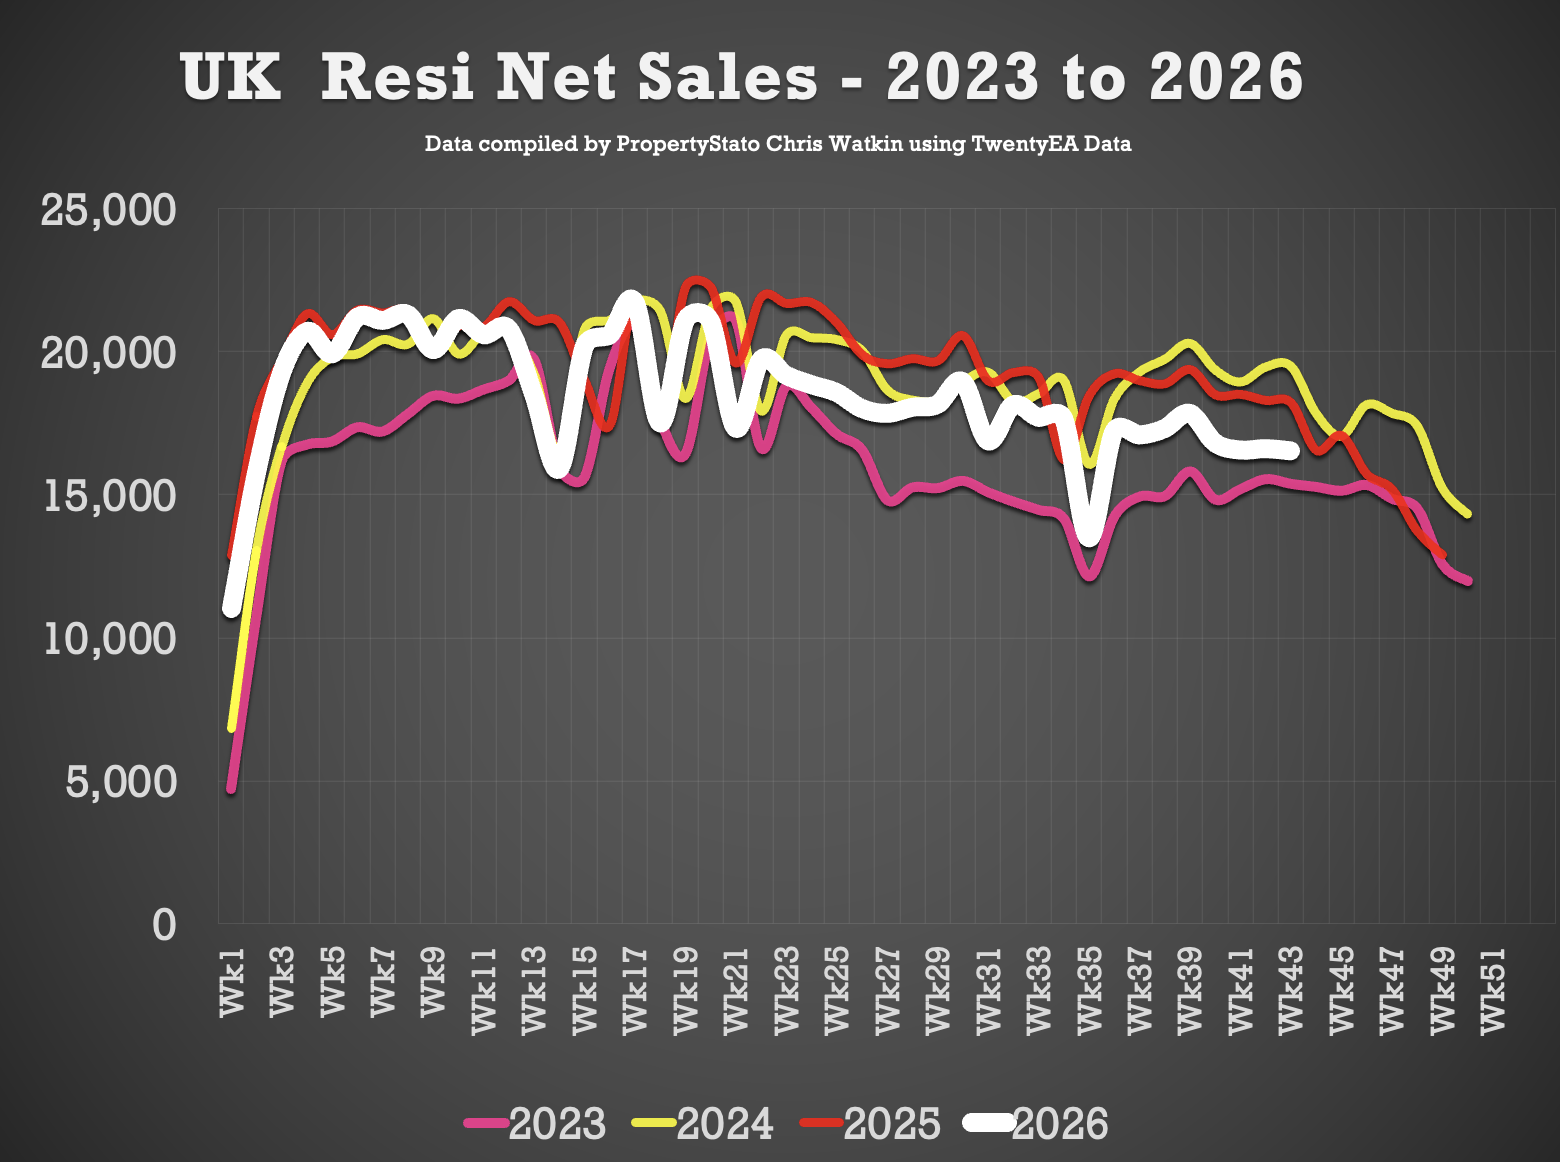
🟩 UK Net Resi Sales YTD
(Net Sales being Gross Sales less Sale Fall Thrus).
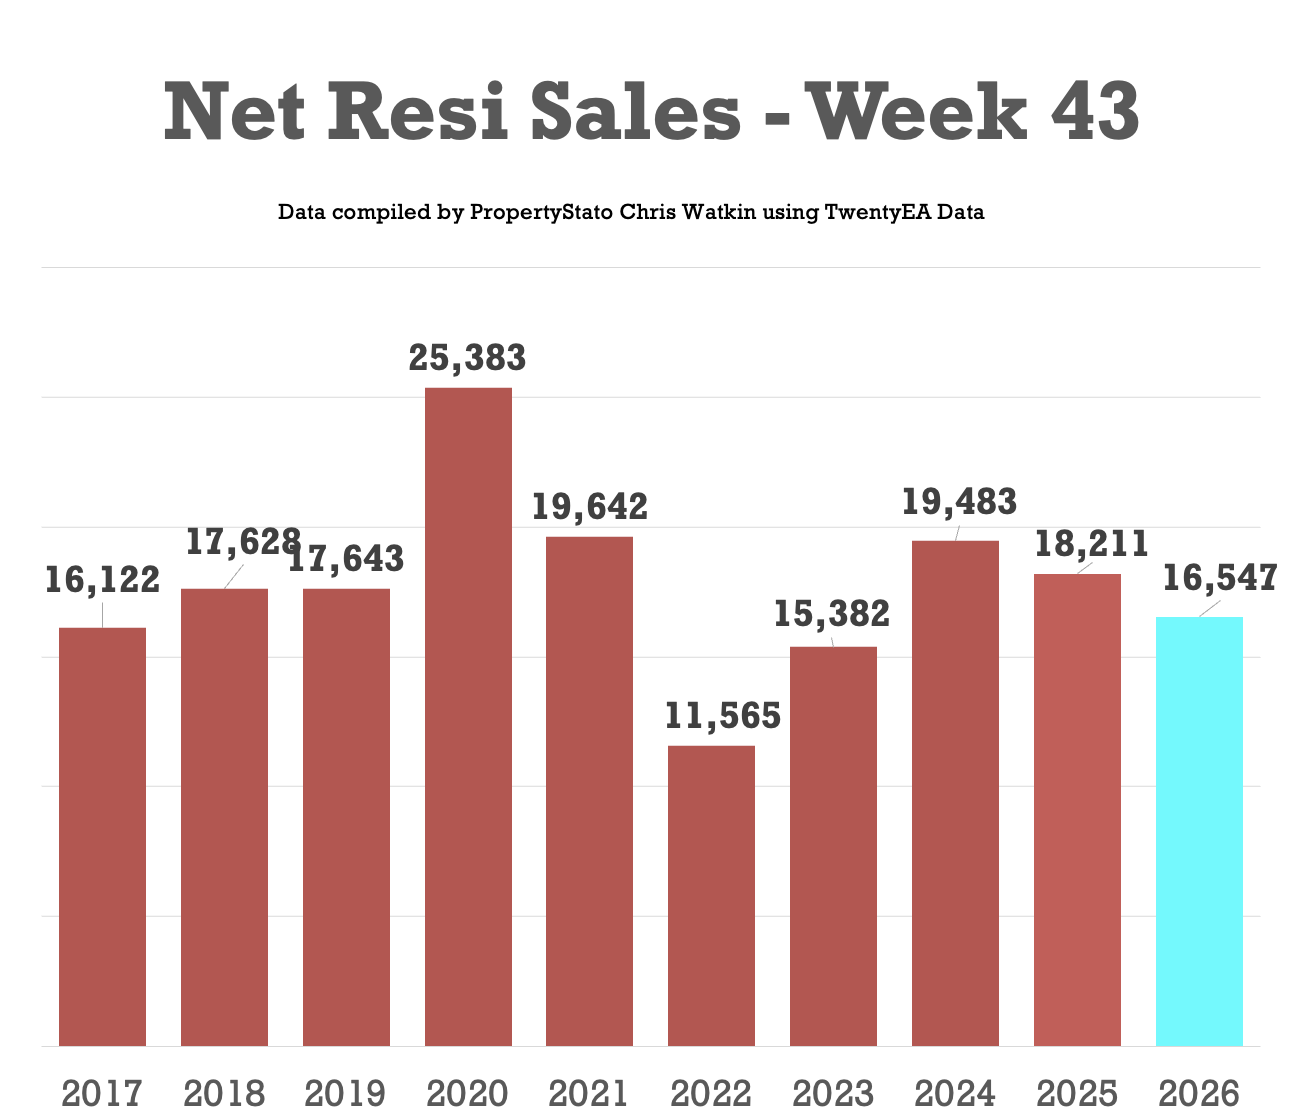
Week 43
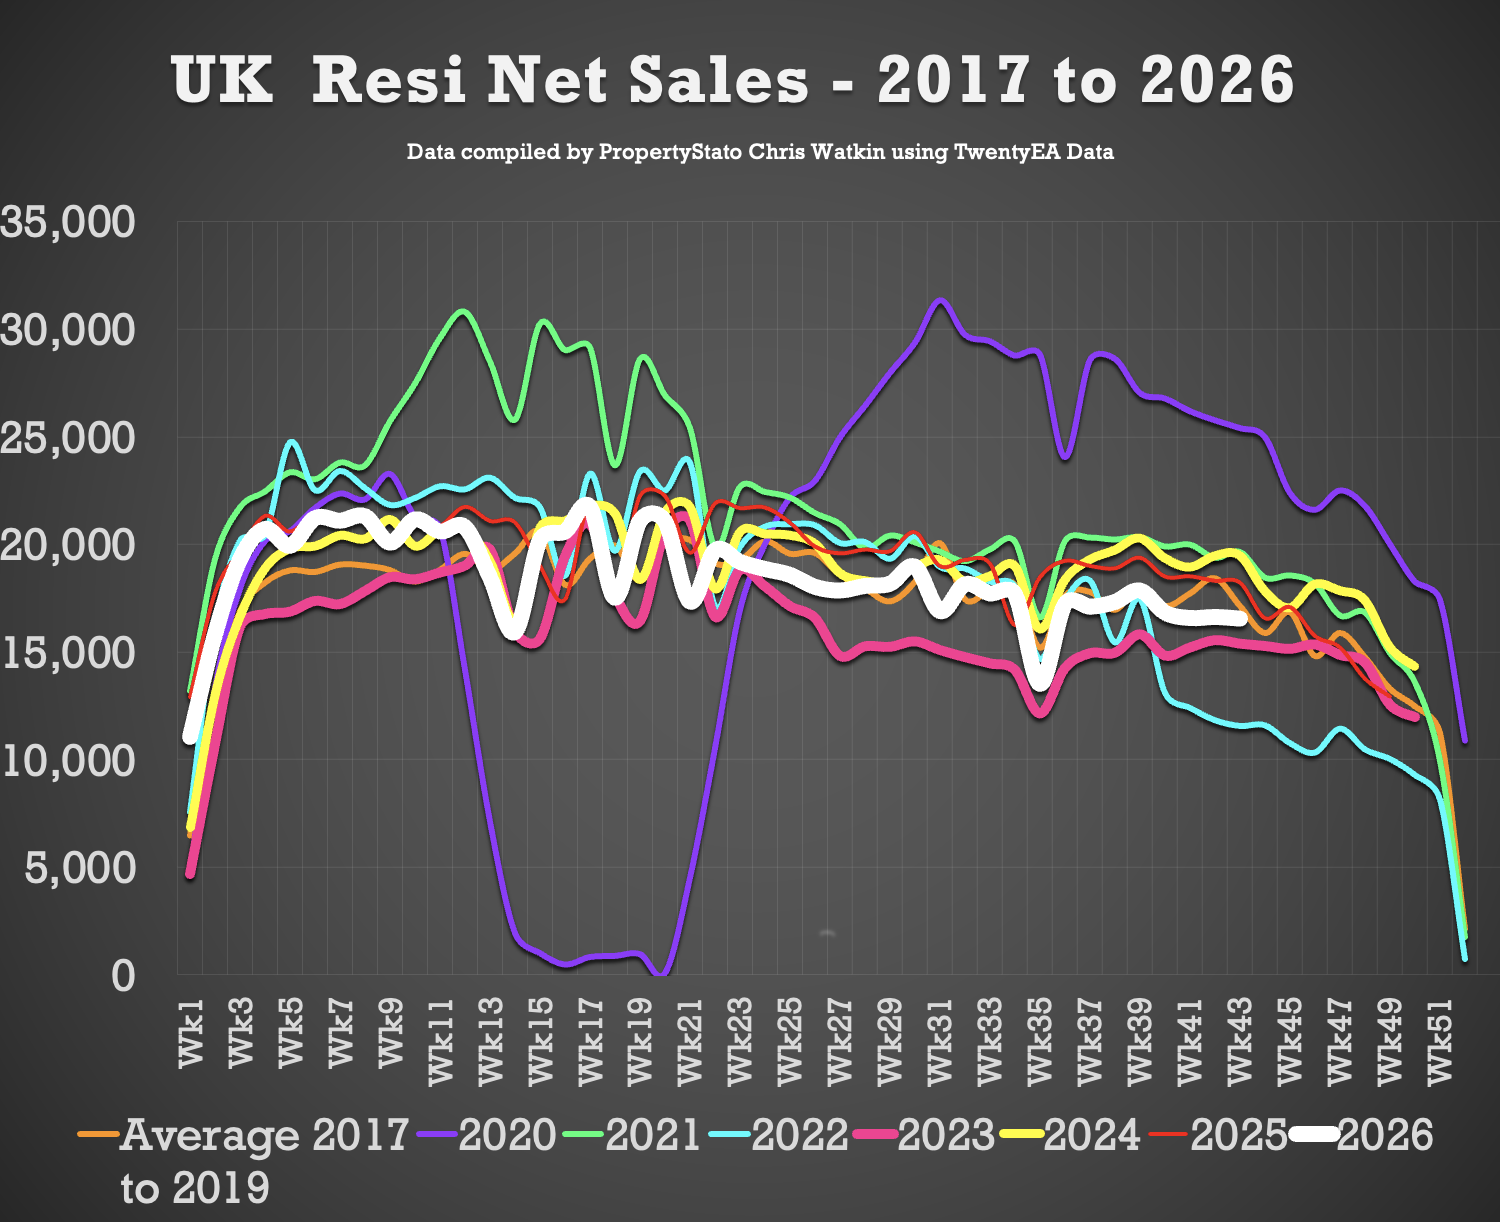
16.5k Net Sales (16.6k last week)
10 year Week 43 average: 17.8k.
Weekly average for 2026: 18.5k.
Year to Date
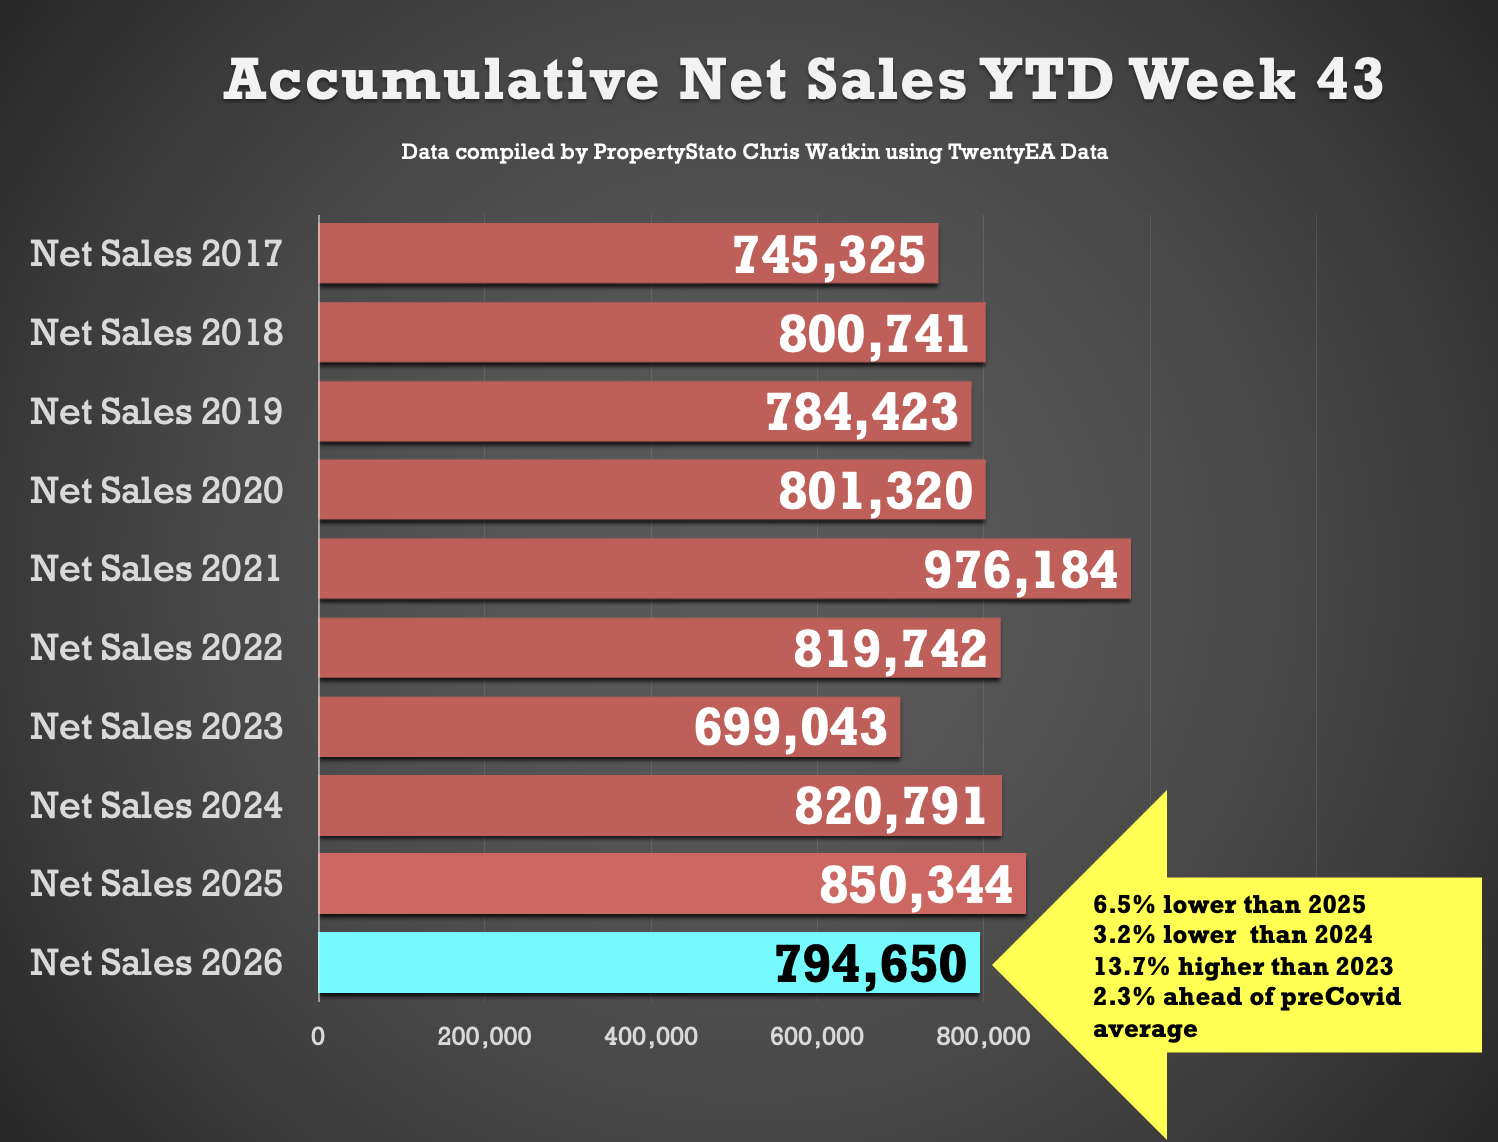
795k UK net home sales YTD, which is …
6.5% lower than 2025 (850k),
3.2% lower than 2024 (821k),
13.7% ahead of 2023 (699k)
2.3% above the 2017/18/19 average 777k).
🟩 Exchanges & Withdrawals
• 47k Exchanges in Oct 2026
• 48.6k Withdrawals in Oct 2026
(Note these numbers will change as more exchanges/ withdrawals from October come in during the first few weeks of November)
• Therefore, in October 2026, just 49.2% of homes that left agents’ books exchanged & completed in October (the rest – 50.8% withdrew, unsold)
• 57.6% is the 7 year average exchange to listings ratio (which includes the crazy years post lockdown 18 months).
Additional info …
🟥 Price Reductions
• 21.2k reductions this week on 758k UK homes for sale
• 13.7% of UK homes for sale were reduced in October (down from 14.7% in September)
• 2026 YTD average 13.1%, versus the 7 year long term average of 11%.
🟥 Price Difference between Asking Price of Listings & Asking Price of those Homes that go Sold stc
• Week 43 – 15.5% difference (long term 10 year average is 16% to 17%). (£409k ave Listing Ave Asking price vs £354k Sale Agreed ave Asking price)
🟥 Sell-Through Rate
• 13.4% of homes on agents’ books went SSTC in October ’26 (compared to 14.7% in Sept, 14.7% in August ’26 & 13.8% in June ’26).
• Pre-Covid average: 15.5%.
🟥 Sale Fall-Thrus
• Week 43 Fall-thru rate 23.99%
• Decade average: 24.5%
• 5.2% of homes sold STC fell thru in September 2026. Interesting when compared with the 2026 YTD average of 5.1% and 2025 average of 5.3% and the 10 year average of 5.7%. OCTOBER FIGURES TO FOLLOW NEXT WEEK
🟥 Stock Levels
• 758k homes on the market on the 1st of November ’26 (742k on Nov 25, 724k on Nov 24, 664k in Nov 23)
🟥 UK Rental Data
• Average Rent in Wk 43 – £1,835 pcm ( high growth from October overall average because of student lets coming online in late October in University cities)
• Average Rent in MTD October 2026 – £1,804 pcm
• Average Rent in October 2025 – £1,880 pcm (NB this is £103 higher than this year’s average (the £1,737 figure below) … this is because student rentals in some Uni Cities start at the end of Oct and that will increase the overall for October 2025 by around £50/£60 per month
• Average Rent in October 2021 – £1,432 pcm
• Average Rent in YTD 2026 – £1,767 pcm
• 320k UK Rental Stock available to rent on 1st Nov 26 (323k on 1st Nov 2025)
• New Rental Properties coming onto the market in Oct 2026 – 149.7k (153k in Oct 2025 & 116k in Oct 2022)
🟥 House Prices (£/sq.ft)
• Sept ’26 agreed sales averaged £338.98 per sq.ft. 0.2% higher than 12 months ago (£338.90) and 13.7% than 5 years ago (£298.25).
OCTOBER FIGURES follow next week
The £/sqft at sale agreed matches the HM Land Registry Index with a 98% accuracy, 5 months in advance. That is why it is so important.

 The UK Property Market is on life support and almost dead according to some, yet has anyone told the buyers?