
 The number of UK homes sold subject to contract is running 6.8% below the same point last year, with around 47,000 fewer sales agreed so far in 2026.
However, the latest market data suggests activity remains above longer-term norms. Sales agreed are still 7.3% higher than at the same stage in 2019, before the pandemic, and 10.3% ahead of 2023 levels.
The figures indicate that while the market has cooled from the stronger conditions seen in 2025, transaction levels remain relatively resilient. With more homes available for sale, buyers have greater choice and sellers are facing increased competition, placing greater emphasis on accurate pricing.
The latest figures relate to week 26 of 2026, covering the week ending 5 July.
🟩 Listings
Week 26 ..
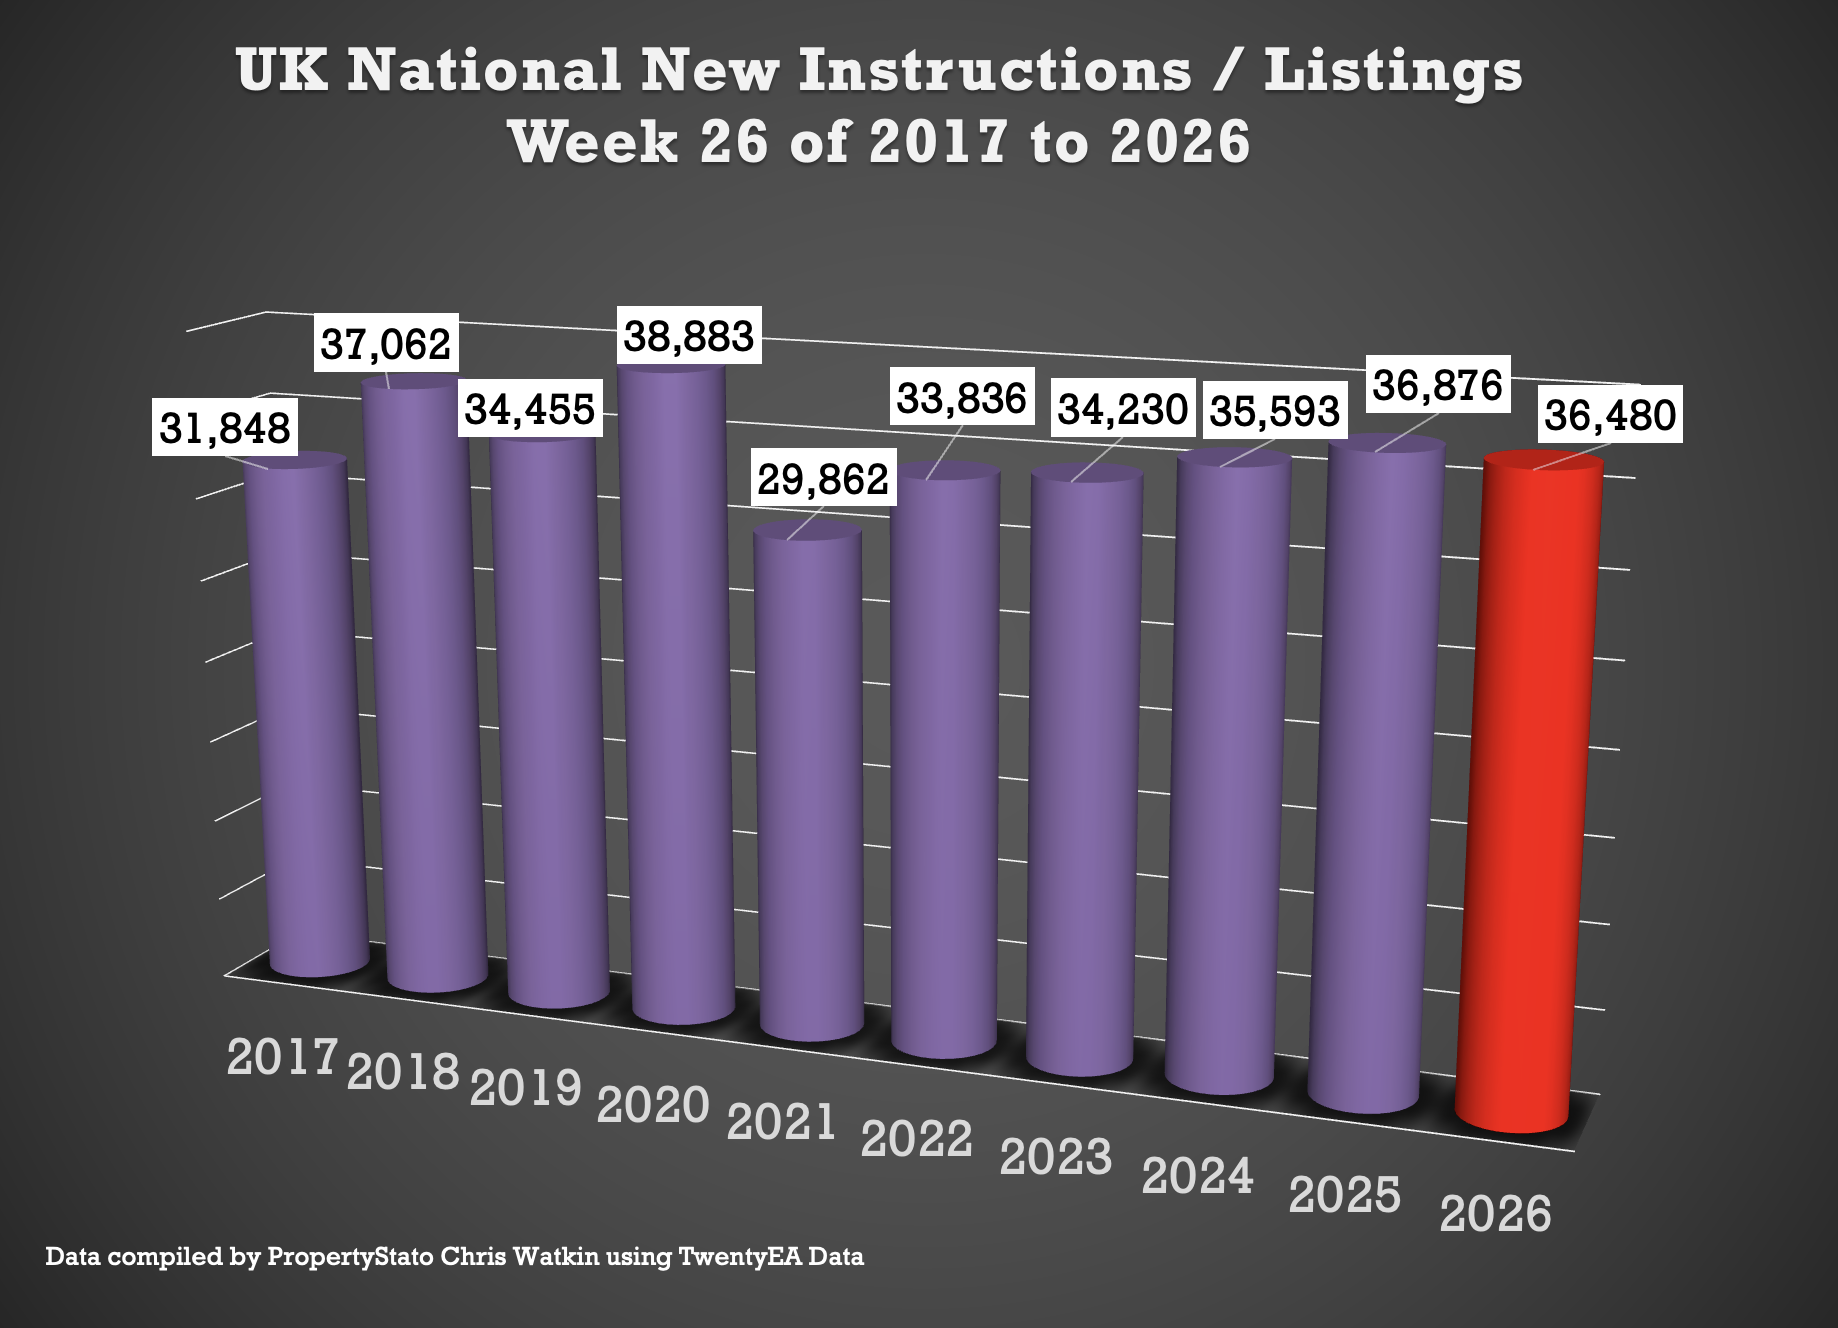
36.5k new listings this week, (35.4k last week).
Weekly 2026 average : 37.2k.
10 year week 26 average : 34.9k
Year to Date
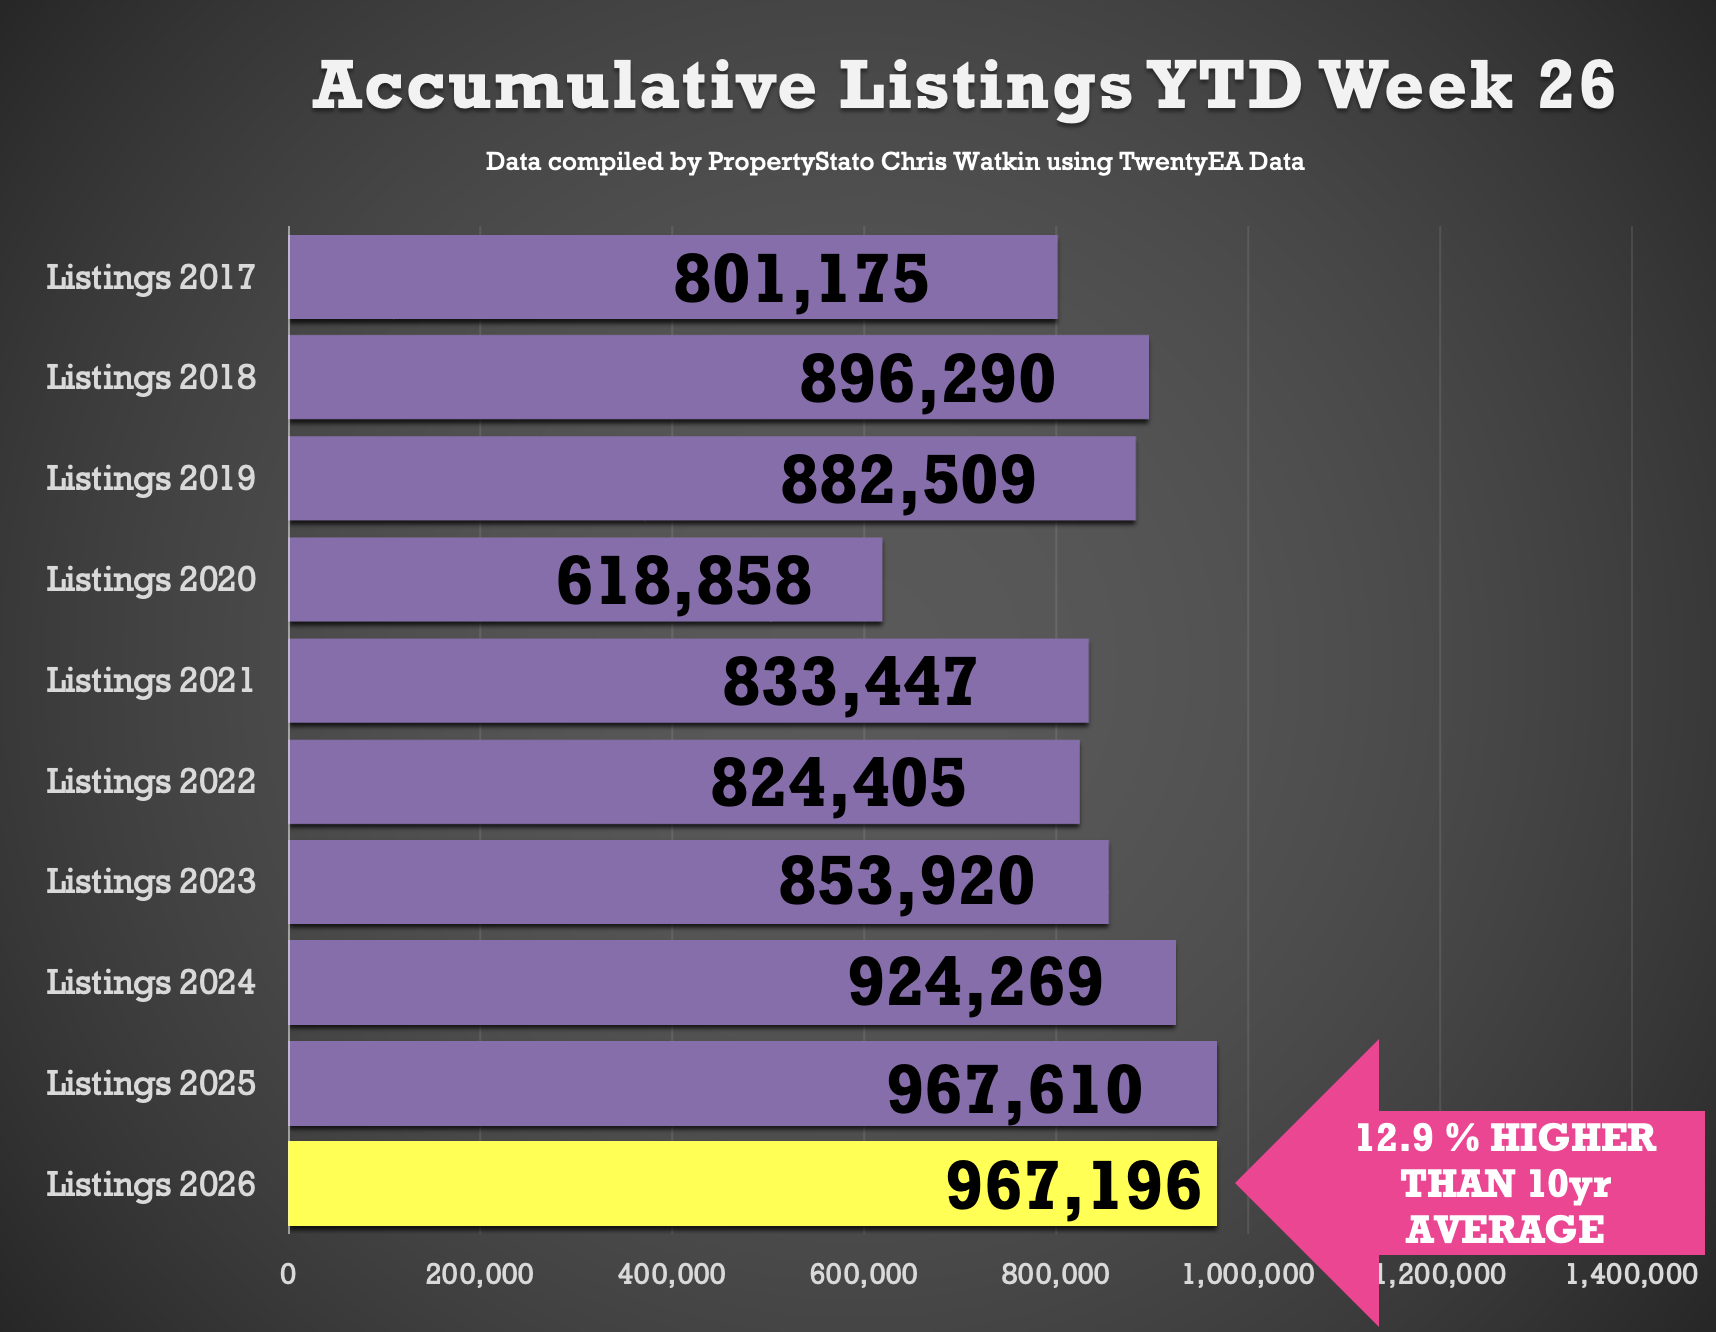
967k new listings YTD
Identical to 2025 YTD (967k)
4.6% ahead of 2024 YTD (924k)
12.5% higher than the 2017–19 average YTD (860k).
🟩 UK Gross Resi Sales
Week 26 ..
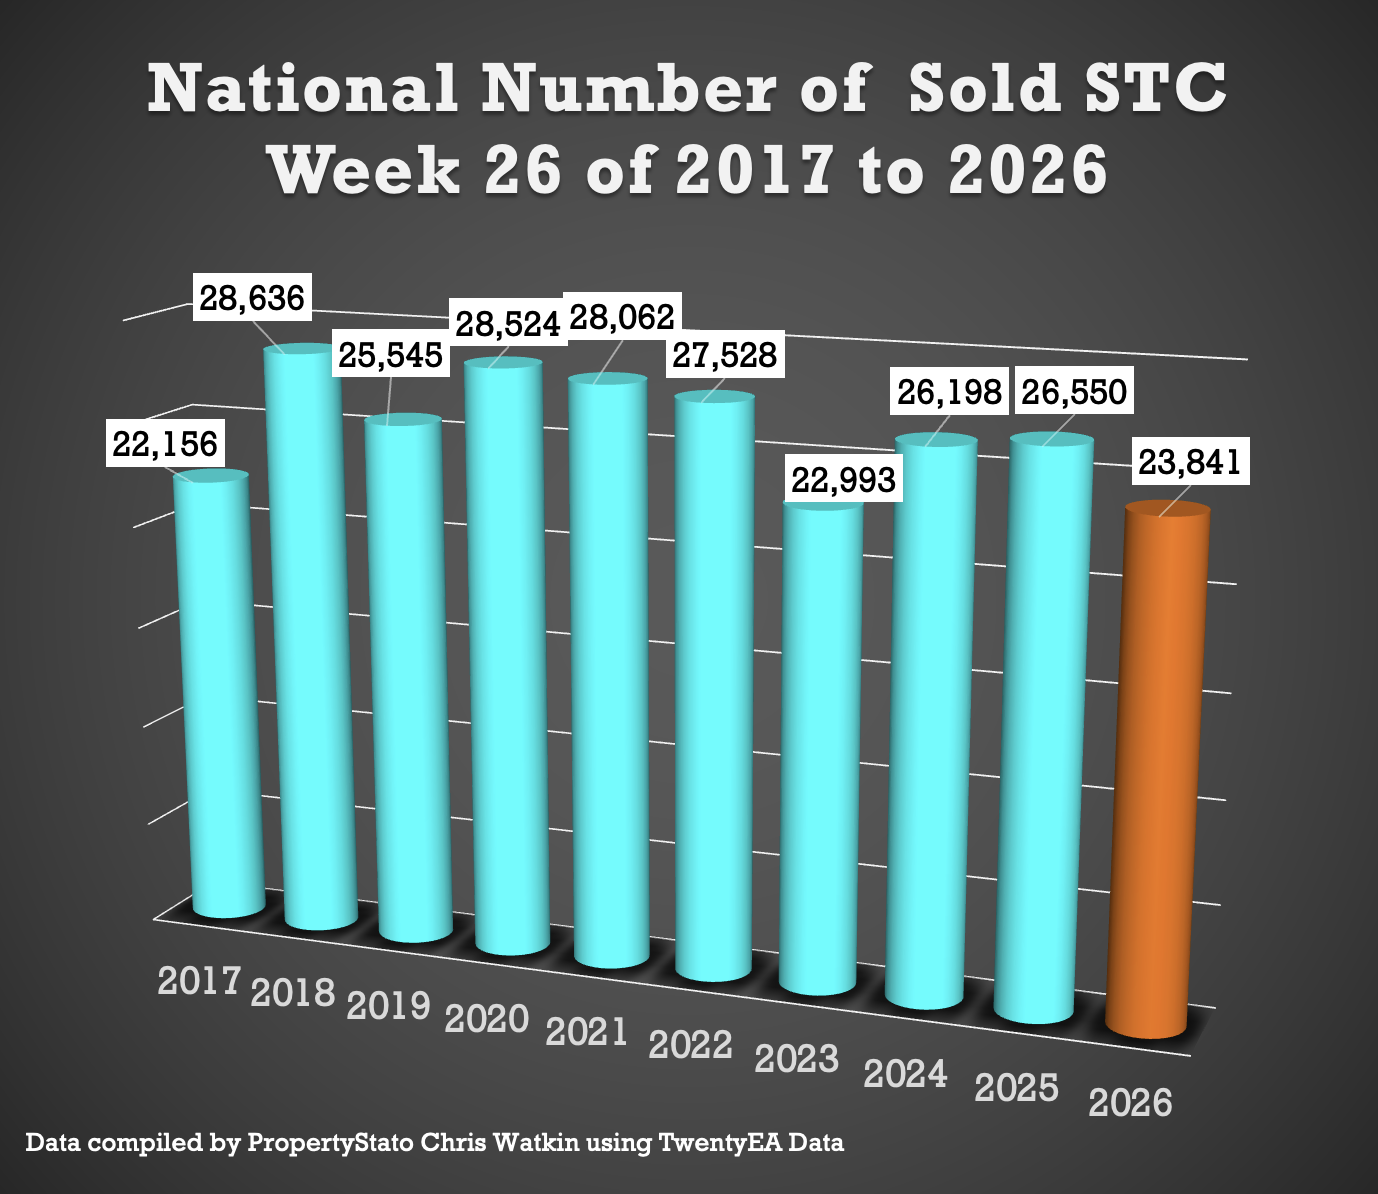
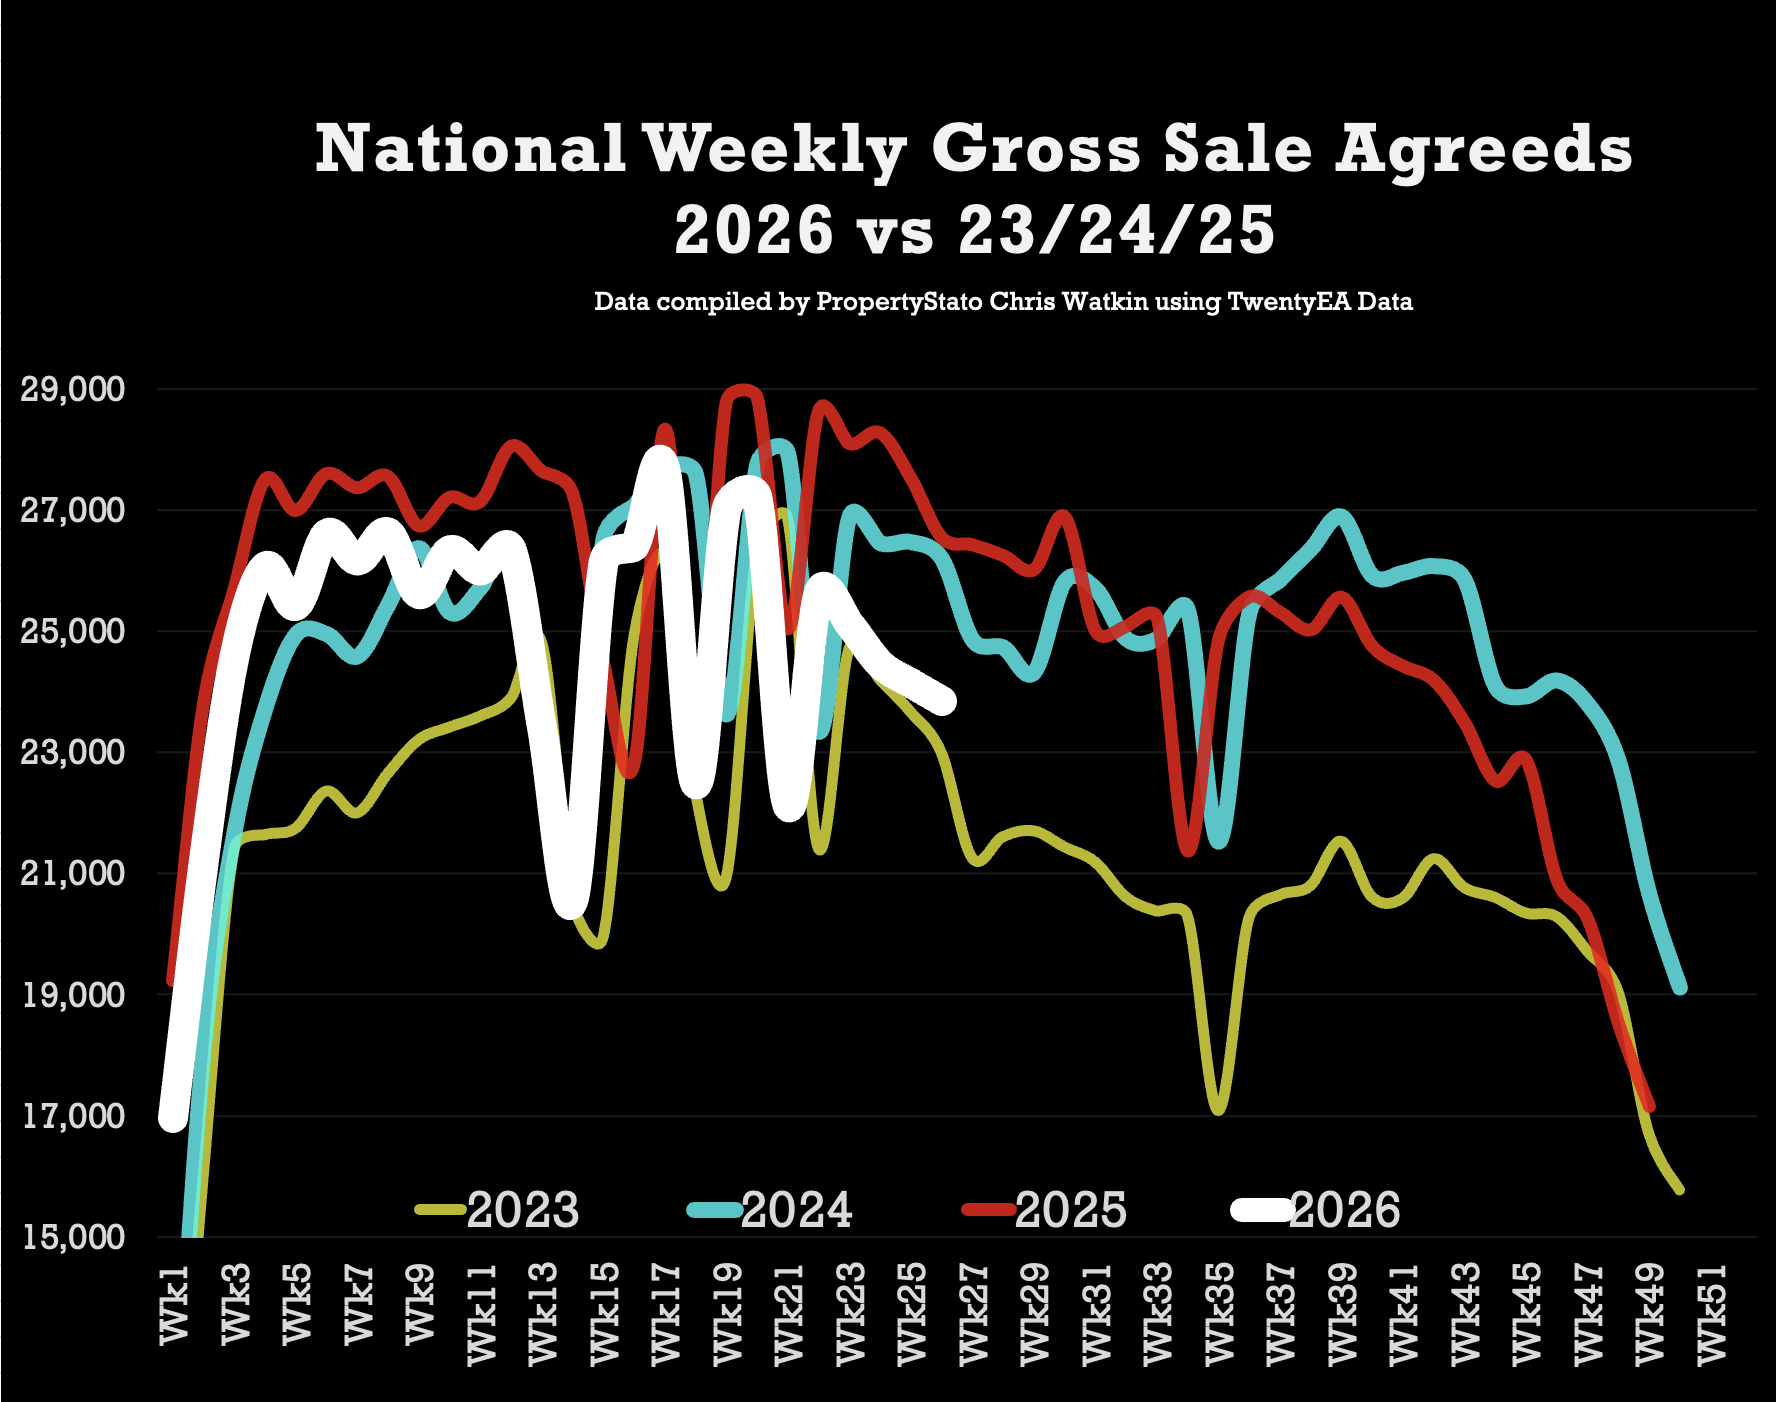
23.8k homes sold stc this week 26 (24.1k last week)
10 year week 26 average : 26k
2026 weekly average : 24.8k.
Year to Date for house sales
644k UK homes sold stc YTD
6.8% lower than 2025 YTD (691k)
Yet still Gross Sales are still …
0.8% higher than 2024 YTD (641k)
10.7% higher than 2023 YTD (582k)
7.3% higher above pre Covid 2017-19 years (600k).
🟩 UK Net Resi Sales YTD
(Net Sales being Gross Sales less Sale Fall Thrus).
Week 26
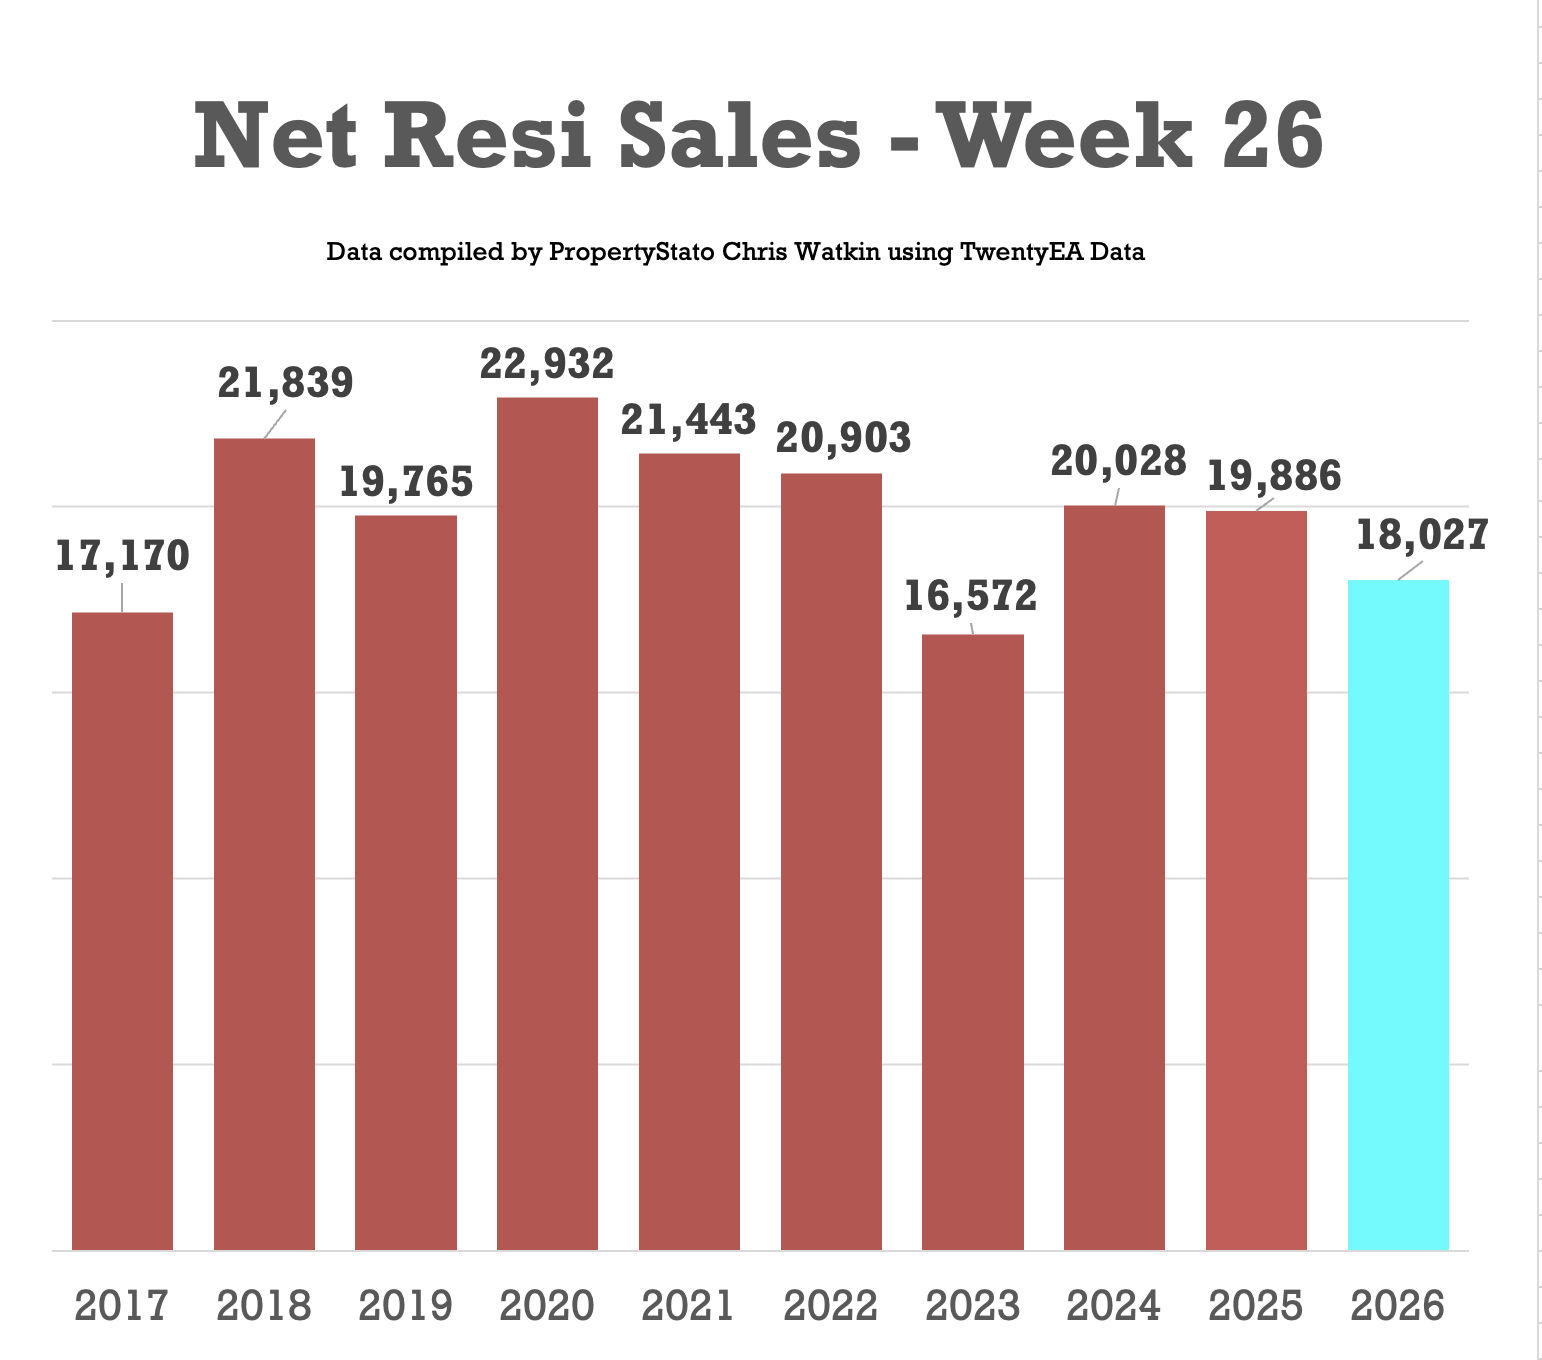
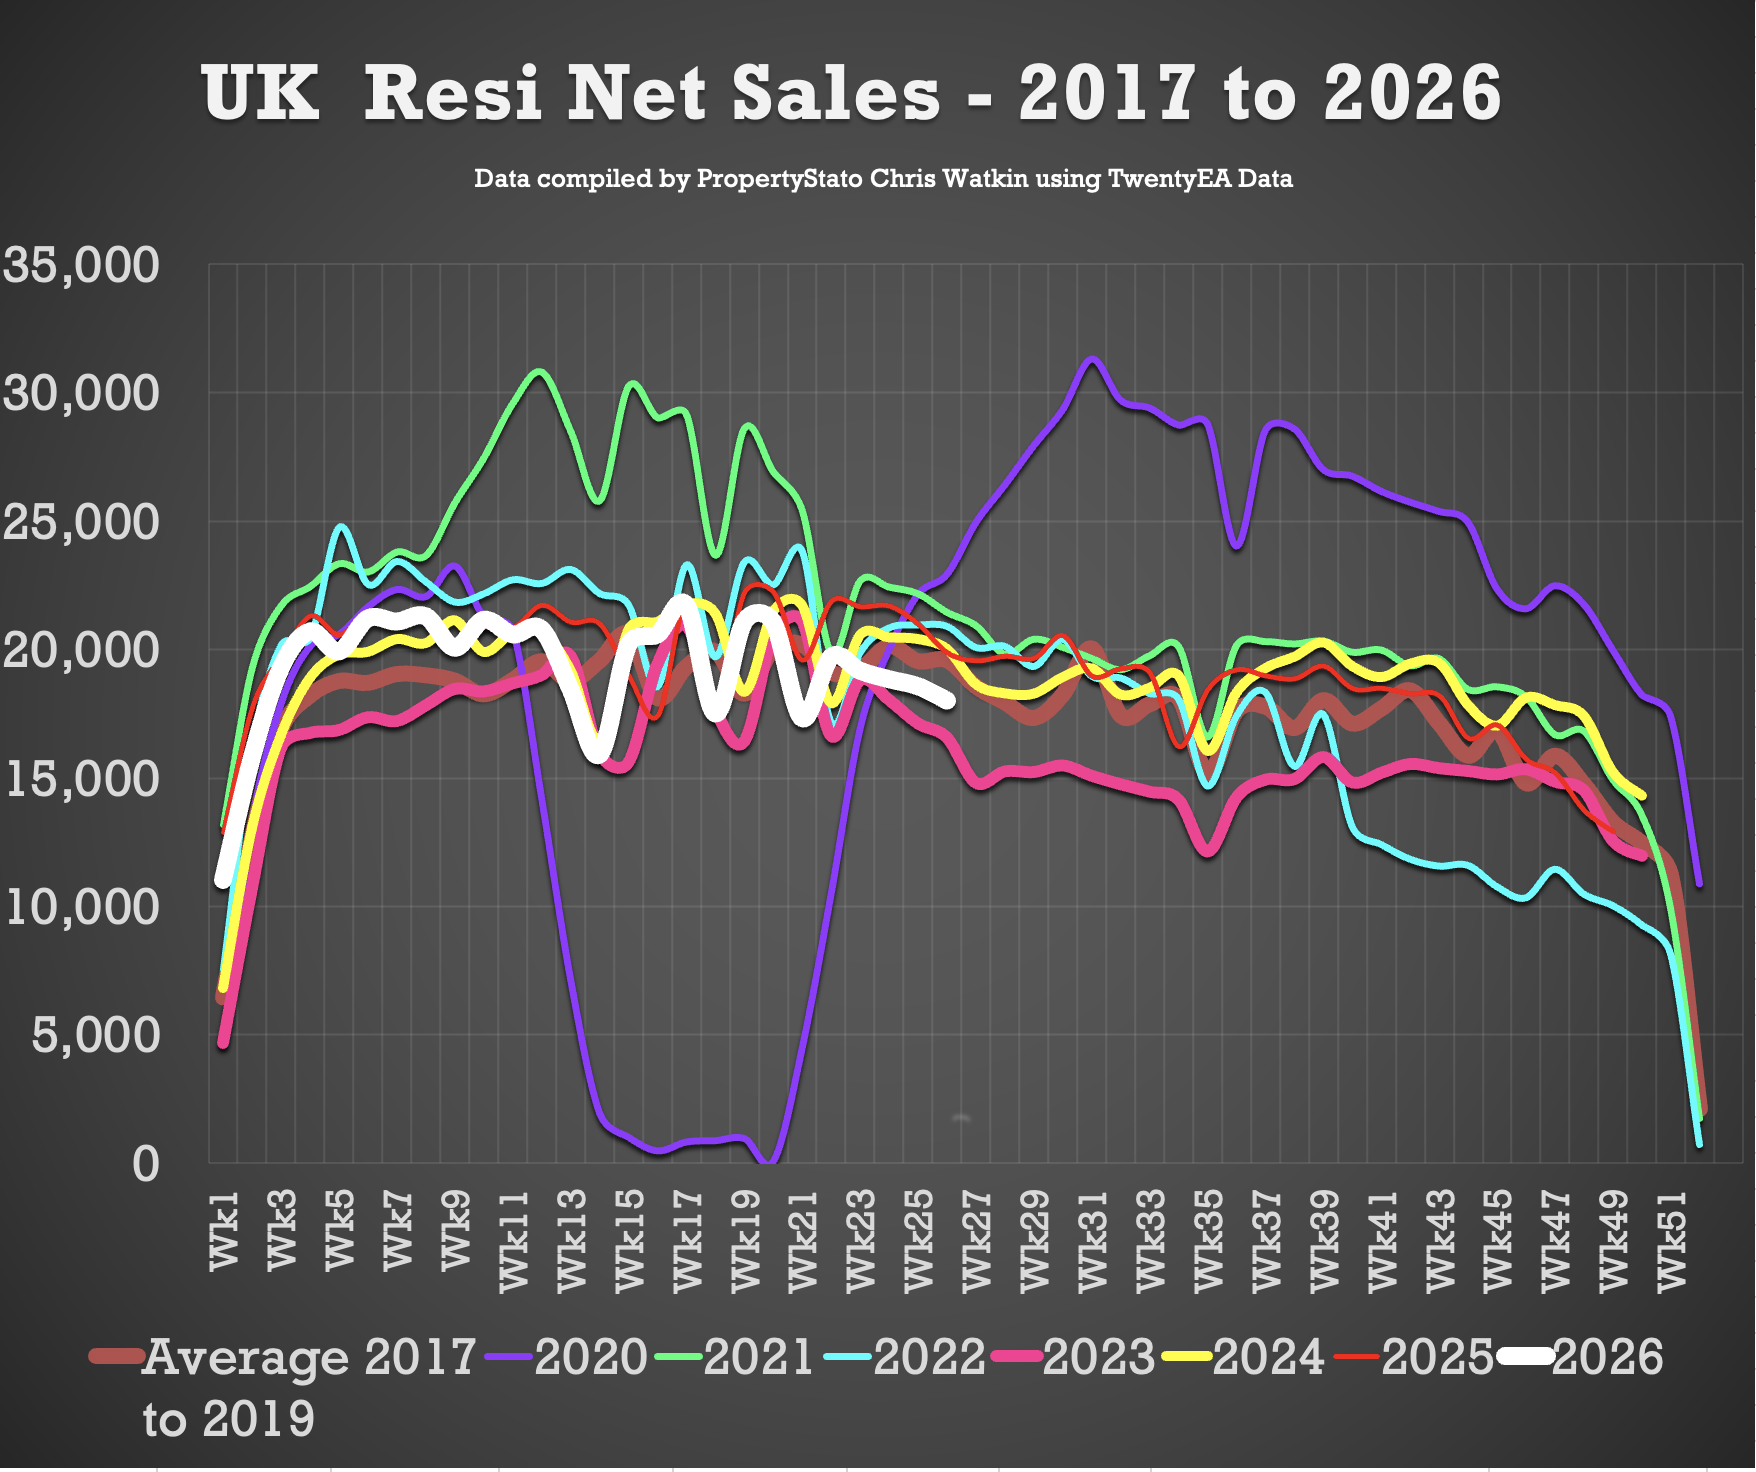
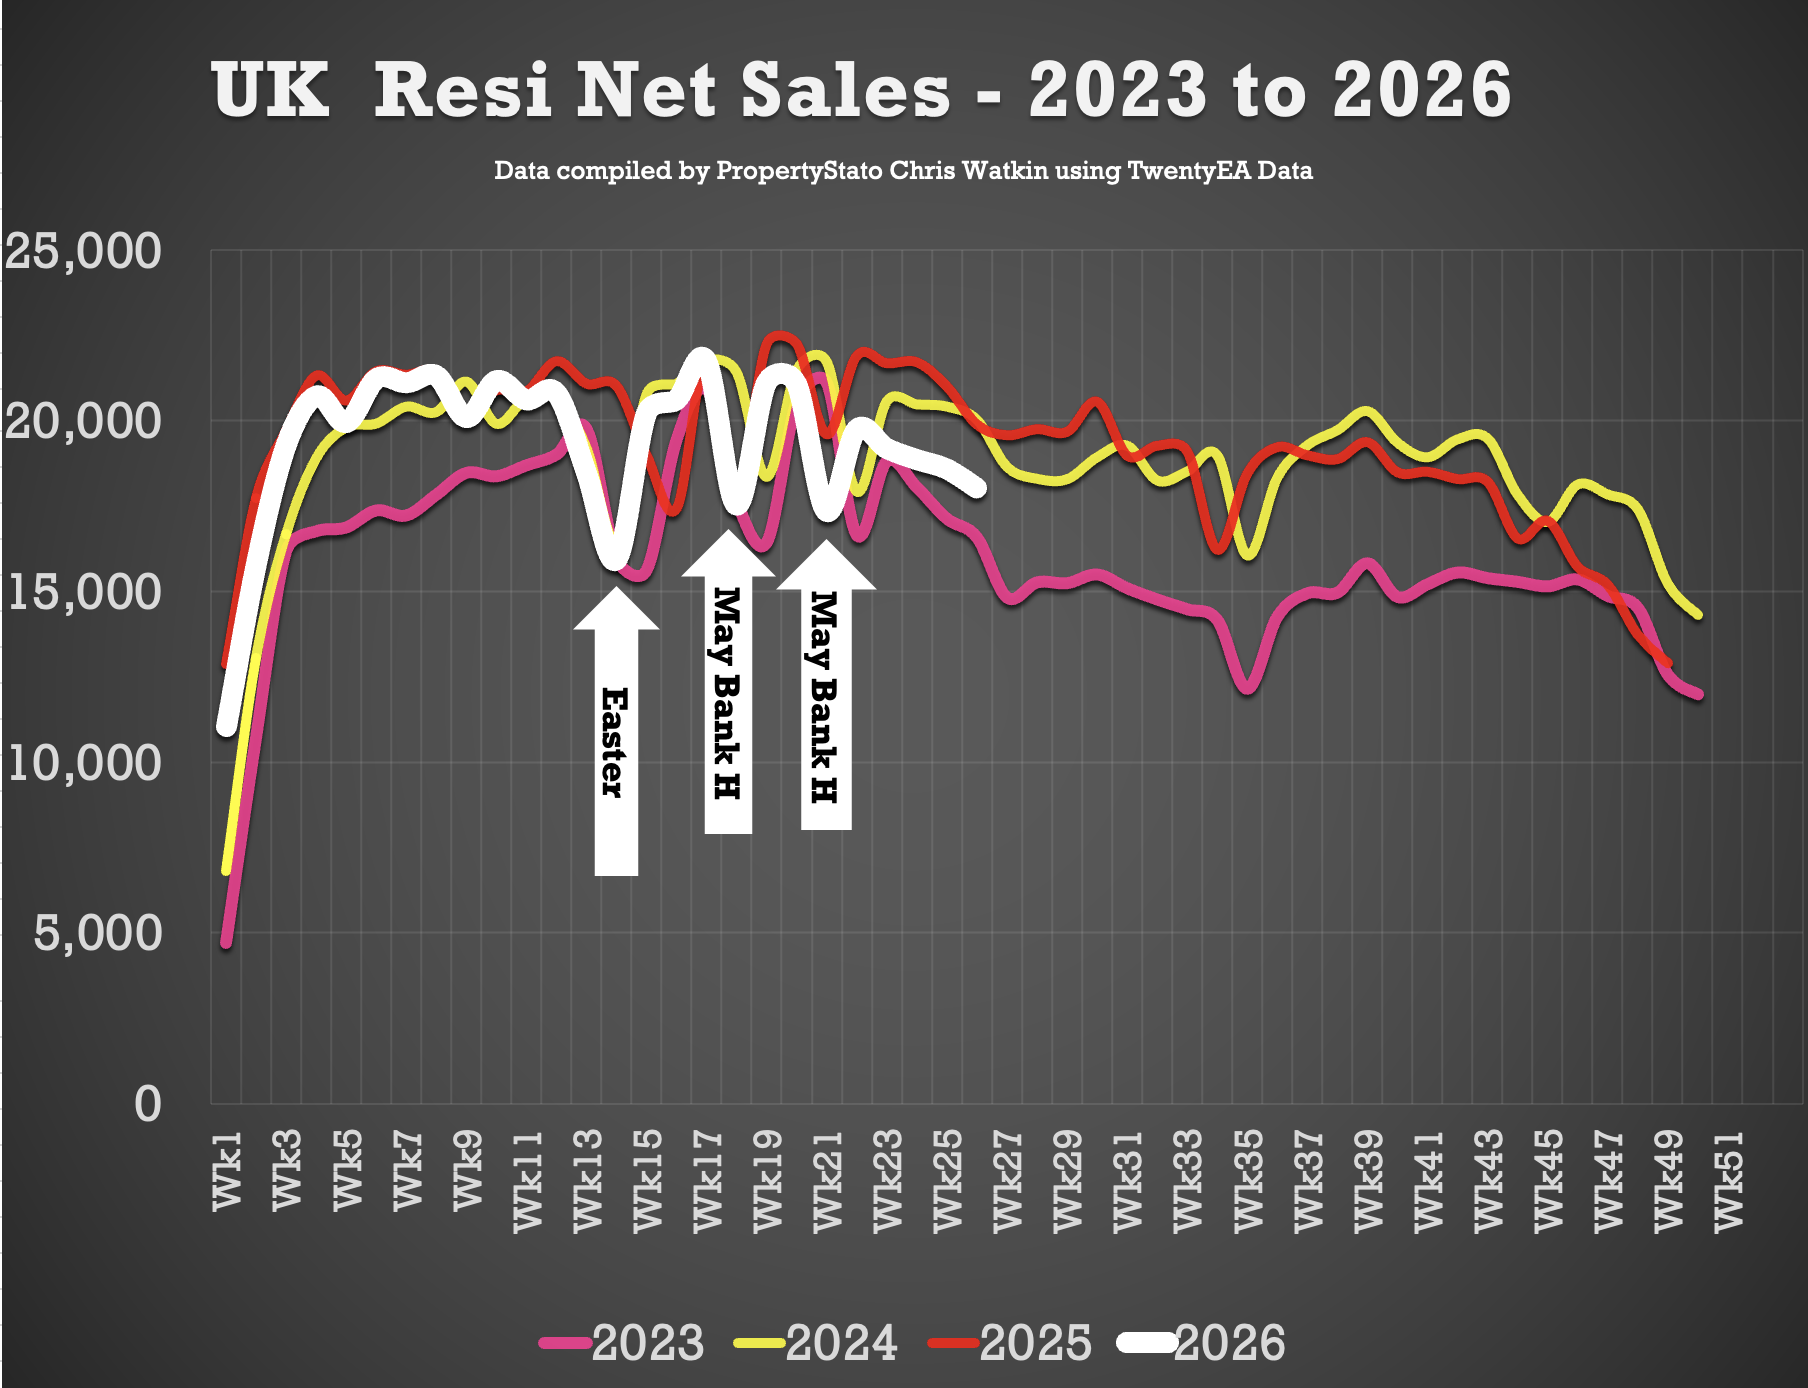
18k Net Sales (18.6k last week)
10 year Week 25 average: 19.9k.
Weekly average for 2026: 19.3k.
Year to Date
502k UK net home sales YTD
5.2% lower than 2025 (529k),
0.3% ahead of 2024 (500k),
12.3% ahead of 2023 (447k)
5% above the 2017–19 average (478k).
🟩 Exchanges
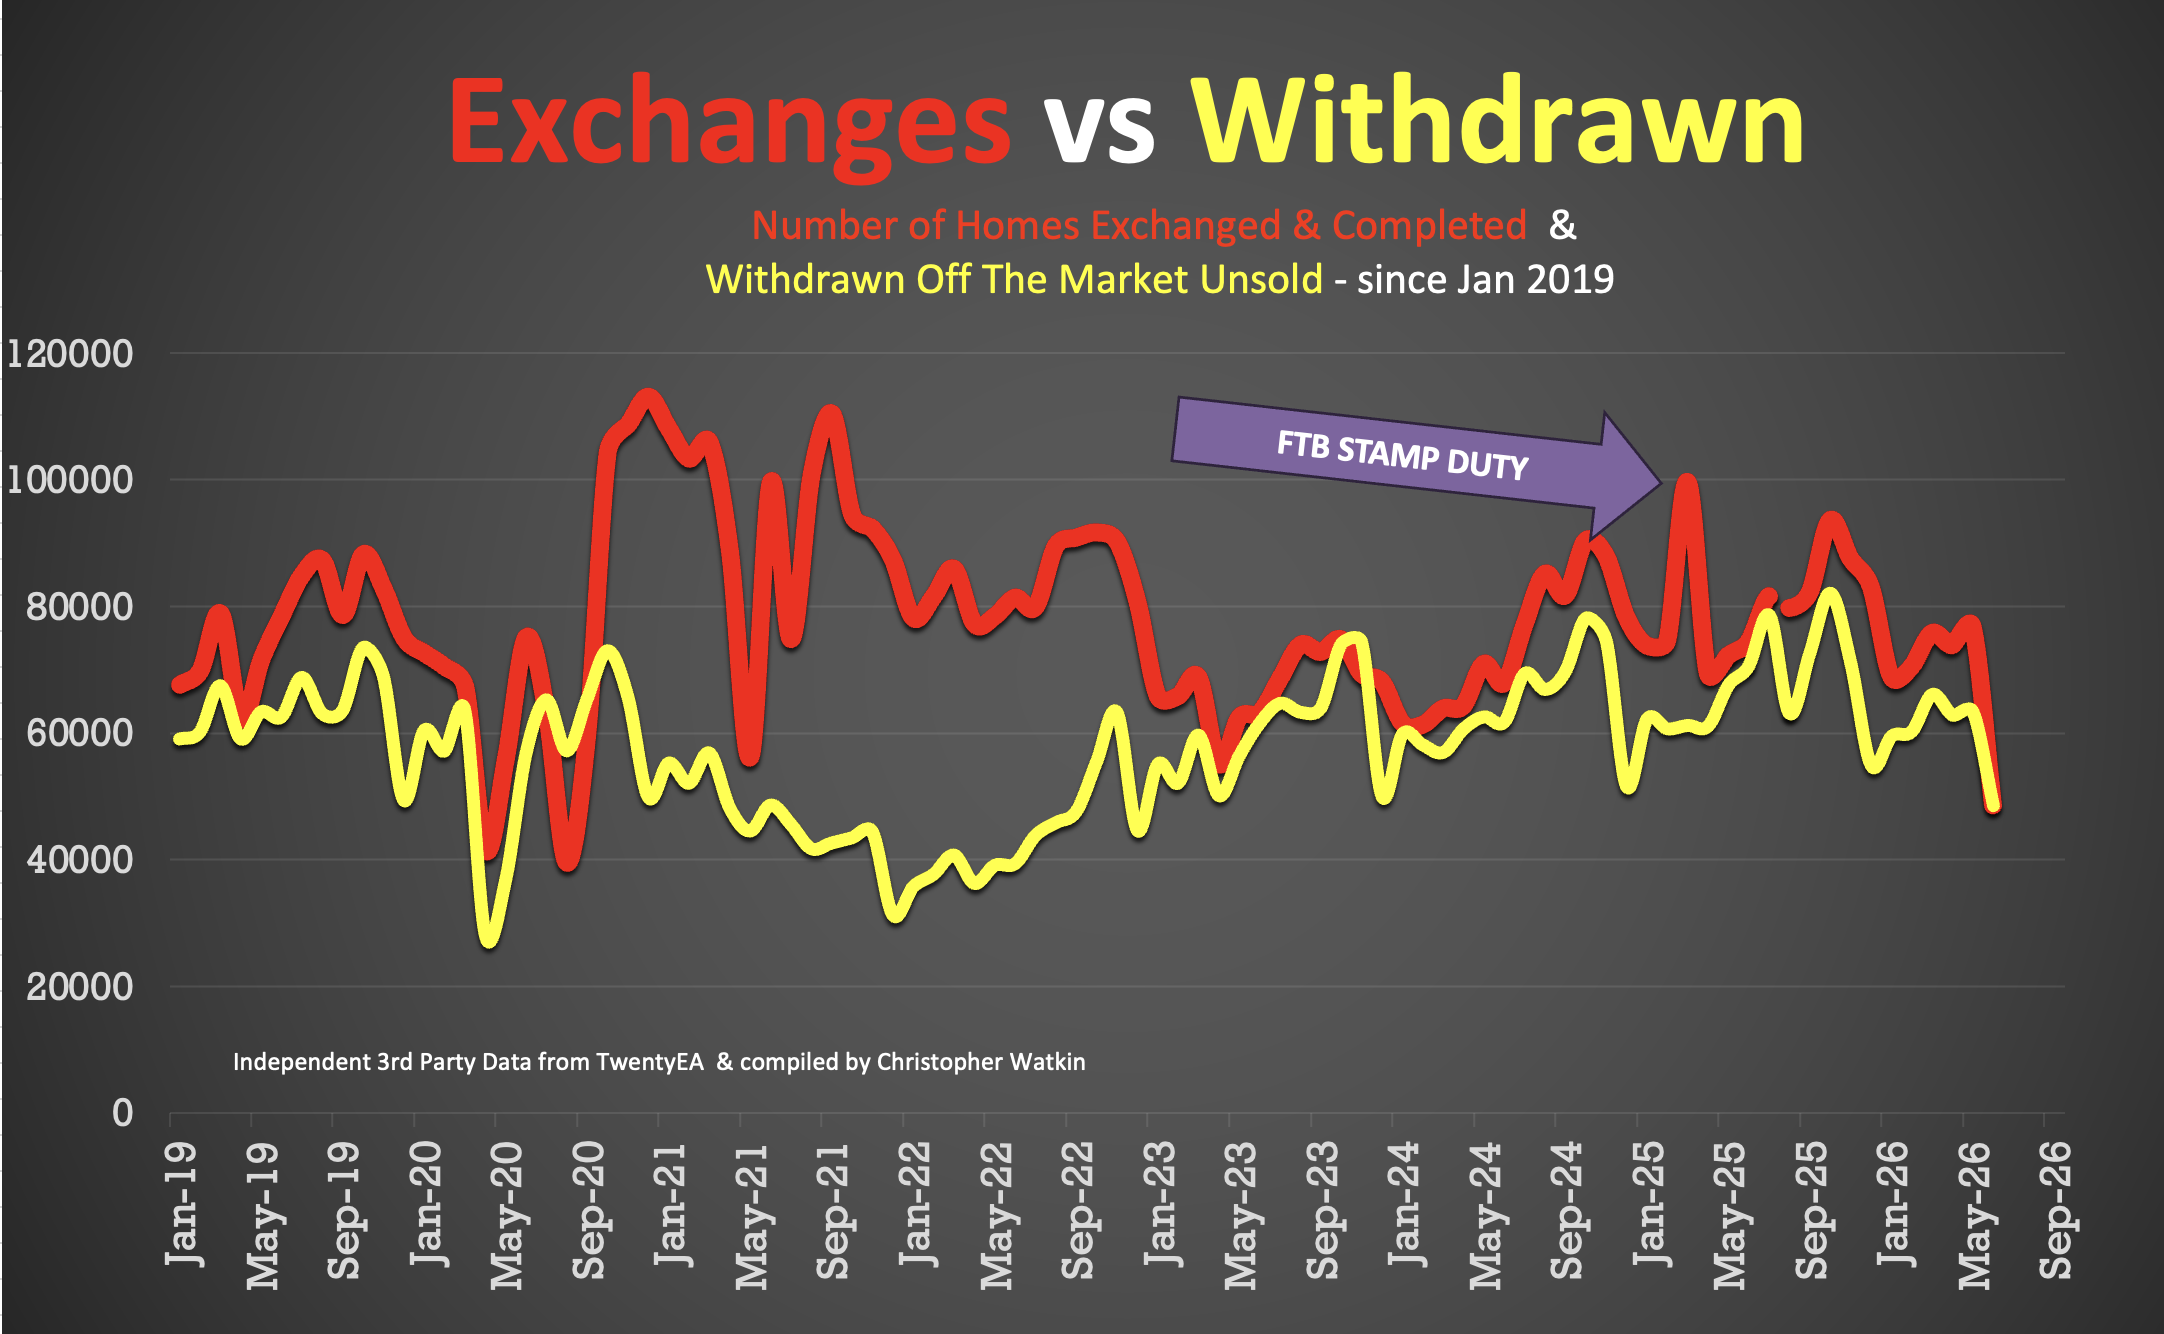
• June 2026 – 48.6k Exchanges.(not this figure will rise during July as more exchanges get reported. On past trends, expect that to end on late 70k’s
Additional info …
🟥 Price Reductions
• 25.8k reductions this week on a 760k UK homes for sale
• 14.3% of UK homes for sale were reduced in June (up from 13.4% in May)
• 2026 YTD average 12.9%, versus the 6-year long-term average of 10.7%.
🟥 Withdrawals
• June 2026 – 49k Withdrawals – again, this figure will increase as more June withdrawals come thru the system throughout July.
🟥 Price Difference between Asking Price of Listings & Asking Price of those Homes that go Sold stc
• 16.6% difference (long term 10 year average is 16% to 17%). (£423k ave Listing Ave Asking price vs £369k Sale Agreed ave Asking price)
🟥 Sell-Through Rate
• 13.8% of homes on agents’ books went SSTC in June ’26 (compared to 14.6% n May ’26).
• Pre-Covid average: 15.5%.
🟥 Sale Fall-Thrus
• Fall-thru rate 24.4%
• Decade average: 24.5%
• 5.07% of homes sold STC fell thru in June 2026, below both the 2025 average of 5.3% and the 10 year average of 5.8%.
🟥 Probability of Selling (% that Exchange vs withdrawal)
• June 2026 Stats : 50% of homes that left agents’ books exchanged & completed in June. (Note this figure will change throughout the month as more June stats come in).
• 57.6% is the 7 year average (which includes the crazy years post lockdown 18 months).
🟥 Stock Levels
• 760k homes on the market on the 1st of July ’26 (747k the month before and 763k 12 months ago)
• 475k homes in agent’s sales pipeline on the 1st July 2026, lower than 12 months ago on 1st July ’25 (493k).
🟥 House Prices (£/sq.ft)
• June ’26 agreed sales averaged £350.22 per sq.ft. 1.94% higher than 12 months ago (£343.54) and 12.3% than 5 years ago (£311.93). The £/sqft at sale agreed matches the HM Land Registry Index with a 98% accuracy, 5 months in advance. That is why it is so important.
🟥 UK Rental Data
• Average Rent in Wk 26 – £1,835 pcm
• Average Rent in June 2026 – £1,808 pcm (£1,791 in June 25)
• Average Rent in YTD 2026 – £1,752 pcm
• 315k UK Rental Stock available to rent in June 26 (307k in June 2025)
🟥 Local Focus this week in the Show
Stafford








Comments (1)
I was having a terrible day at work and needed a distraction during my commute back home. I remembered a colleague mentioning a mobile casino that had fast-loading table games. https://six6sbd1.com/app/ was exactly what I needed to take my mind off things. I played a few hands of baccarat, and to my amazement, I won seven out of ten rounds. It completely turned my mood around, and I arrived home with a smile and a heavier wallet. Having a reliable gambling app that works flawlessly on the Dhaka metro Wi-Fi is surprisingly rare. The card dealing animations are crisp, and the betting interface is very responsive. I never felt rushed to place my bets, which made the whole experience very relaxing.