
With Halifax reporting a +0.4% monthly change in house prices and predicting that buyer activity will ease in the coming months, latest analysis of the prime central London property market shows transaction volumes falling as the Stamp Duty holiday winds up, and under-offers and new instructions returning to historic long-run levels.
Independent property analysts, LonRes have crunched the numbers and, as might be expected, found that sales which would normally have been going to complete in July were rushed forward to complete in June.
Commenting on the analysis, Marcus Dixon, head of research at LonRes said:
“A month on from a record-breaking June, the impact of the stamp duty holiday is still with us. It’s been a quiet July for exchanges as sales which under normal conditions would have occurred this month were pushed forward into June.
“Unsurprisingly, the lower end of the market saw the biggest fall in activity between June and July. Only the top end of the market, above £5 million, recorded an annual increase. Buyers here were perhaps less inclined to be part of the conveyancing scrum leading up to 30 June.
“The stamp duty holiday announcement on 8 July 2020 led to a surge in new instructions and under offers over the month. This makes comparing July 2021 with July 2020 somewhat misleading.
“While July this year looked particularly quiet compared to the same time last, the reality is that new instructions and properties going under offer over the course of the month were much more in line with the long-run average. And if confidence were needed, these key metrics suggest the prime London markets are holding up well.”
Transactions
![]()
The number of sales recorded in the run-up to the end of the first phase of the stamp duty holiday on 30 June saw new monthly and quarterly records for activity across prime London.
But the lure of a £15,000 saving meant many deals were pulled forward into June. For July this resulted in fewer transactions. Overall, the number of properties sold was down 22% on July 2020, when the market had been driven by pent-up demand built over the first lockdown, and 39% down on the five-year July average (2015 -2019).
It was properties in lower price brackets that saw the greatest fall in sales. Not surprising as this is where stamp duty savings made up the highest proportion of a buyer’s overall bill. The number of properties sold below £1 million was down 40% on July 2020 and 58% lower than the 2015 – 2019 July average.
Conversely the top end of the market, where the £15,000 stamp duty saving accounted for a negligible amount of a purchaser’s overall buying costs, activity increased.
The number of properties sold at £5 million or more was 22% higher than in July 2020, 9% higher than the longer run five-year average. Indeed, the number of July sales this year at £5 million or more was the highest since 2015.
Prices
A higher proportion of more expensive homes sold in July has impacted average prices. This in contrast to May and June when a higher proportion of lower priced properties sold. As a result, average prices increased 15.8% annually in July, following a 6.2% year-on-year fall in June.
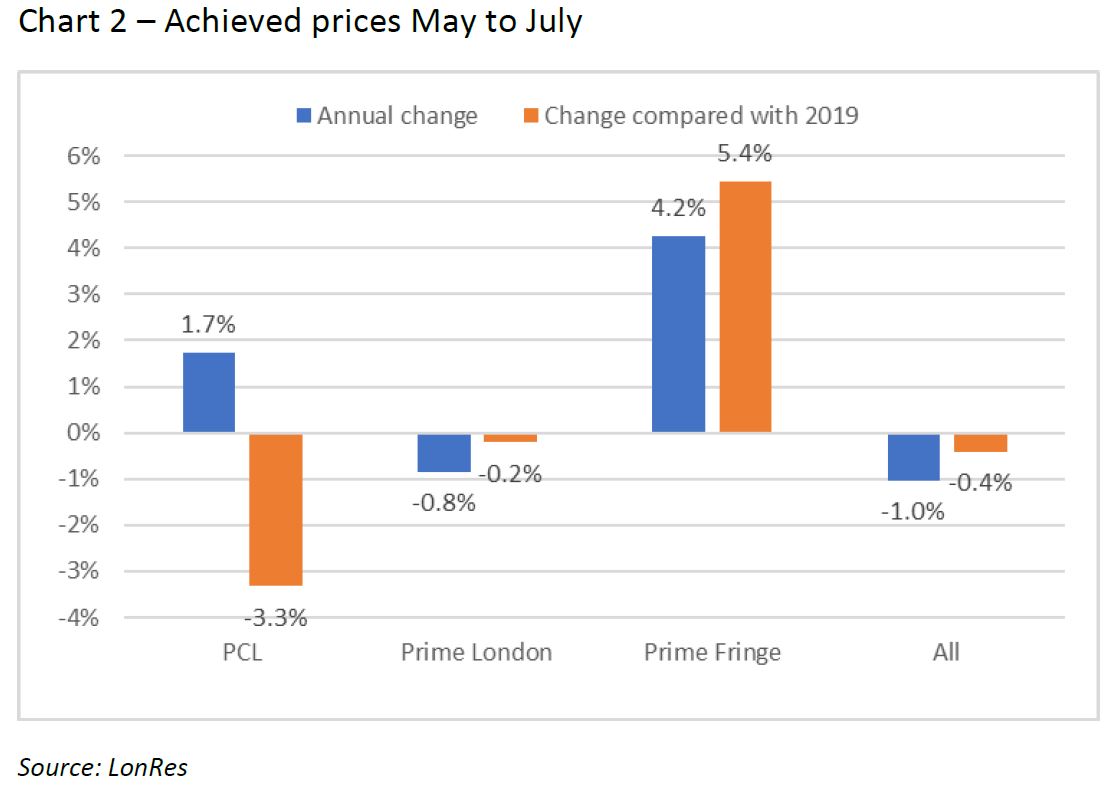
Comparing prices achieved over the last three months gives a more balanced picture. Across prime areas of London prices in the three months to July were down 1% on July 2020.
Prime Fringe areas, popular with domestic buyers, saw the highest annual increase, with prices up 4.2% on 2020 and 5.4% higher than 2019.
Looking ahead
The 30 June stamp duty deadline has made analysis of sales activity and prices more difficult this month. But both new instructions and under offers appear to be returning to long-run levels.
LonRes’ under offer data, which is a good indicator of activity over the coming months, shows the number of properties put under offer was down just 1% on the 2015 to 2019 July average and 8% down on 2020 when activity was recovering as the market re-opened and the stamp duty holiday was announced.
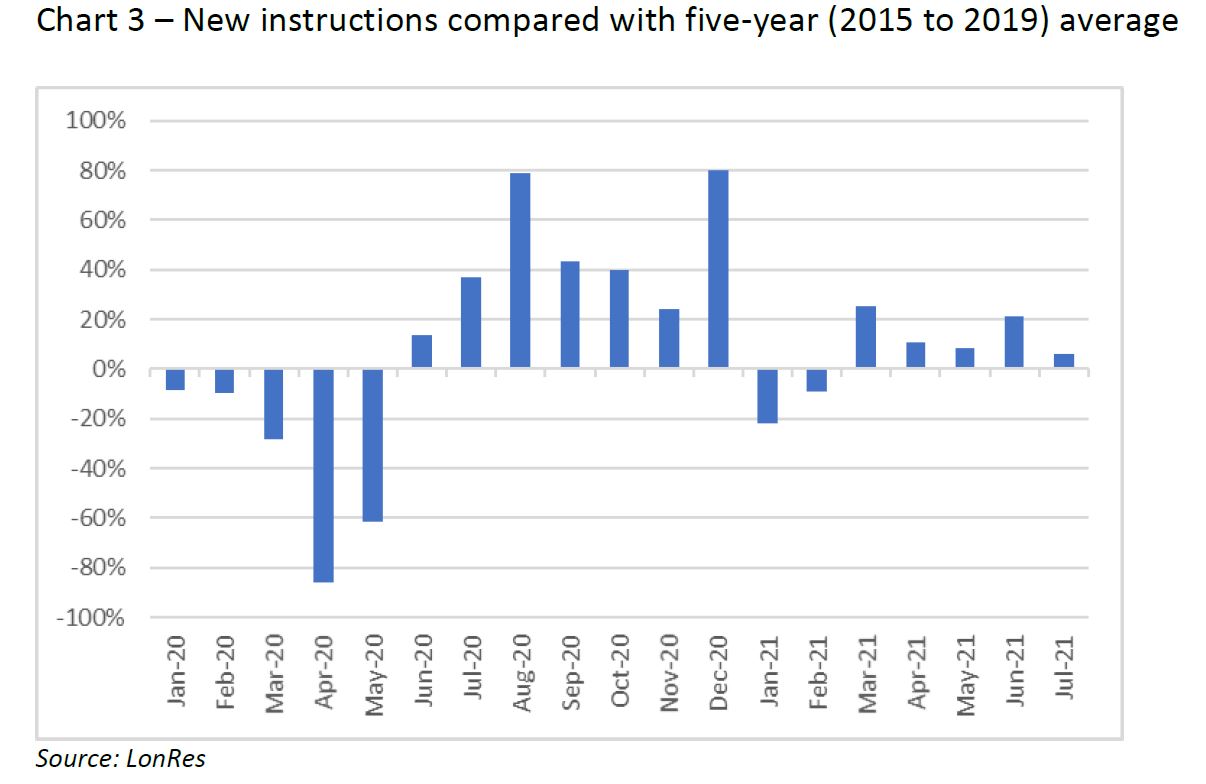
New instructions were also up – by 6% on the five-year average (2015 to 2019) and by 5% on July 2019. However, new instructions did fall short of 2020 levels, when stamp duty incentives and lack of activity over the first lockdown brought more homes to market.
As a result, new instructions were down 23% this July compared to July last.


