
 The UK property market for the week ending Sunday, 12th May 2024 (Week 19) saw the expect early May Bank Holiday dip in listings & sales.
+ House Prices on the 56k Sale Agreed homes in May stands at £350/sq.ft (April ’24 – £344/sq.ft, March ’24 & Feb ’24 both at £339/sq.ft & Jan ’24 to £331/sq.ft)
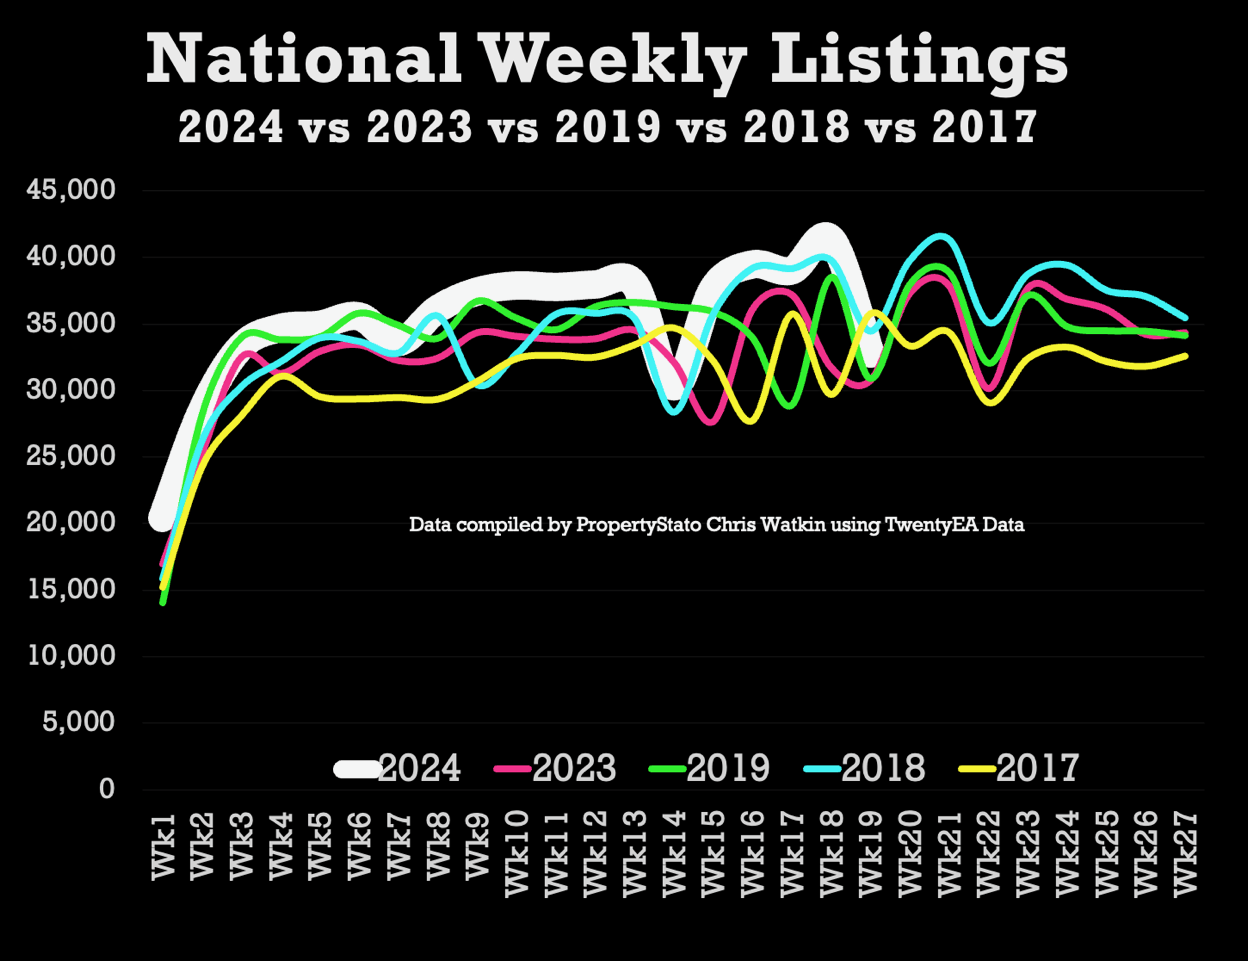
+ Listings – 20.2% fewer listings this week than last week (because of the Bank Holiday -see the graph for previous May bank Holiday dips)
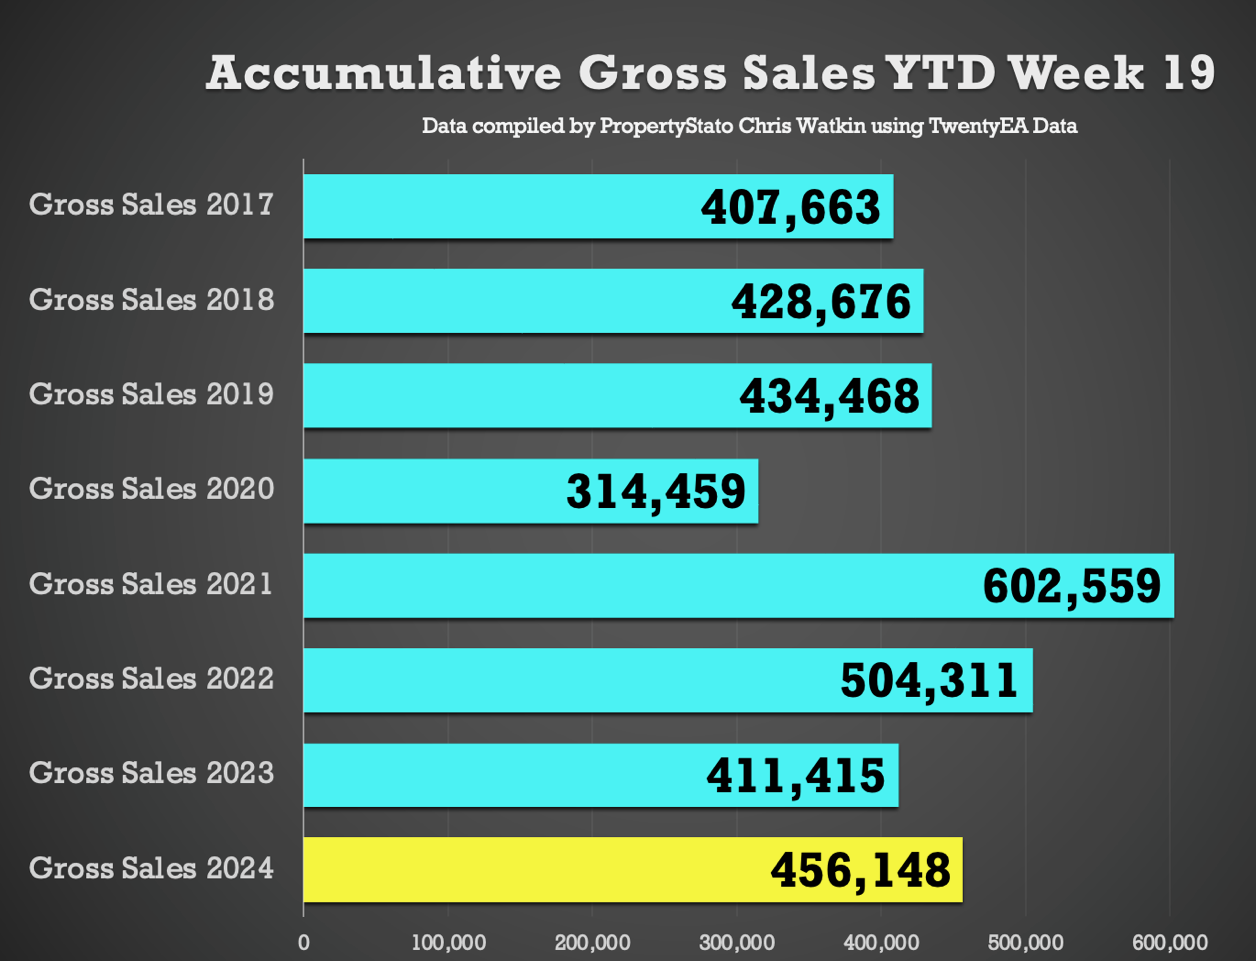
+ Total Gross Sales YTD are 10.9% higher than 2023 YTD levels and 7.7% higher than 2017/18/19 levels.
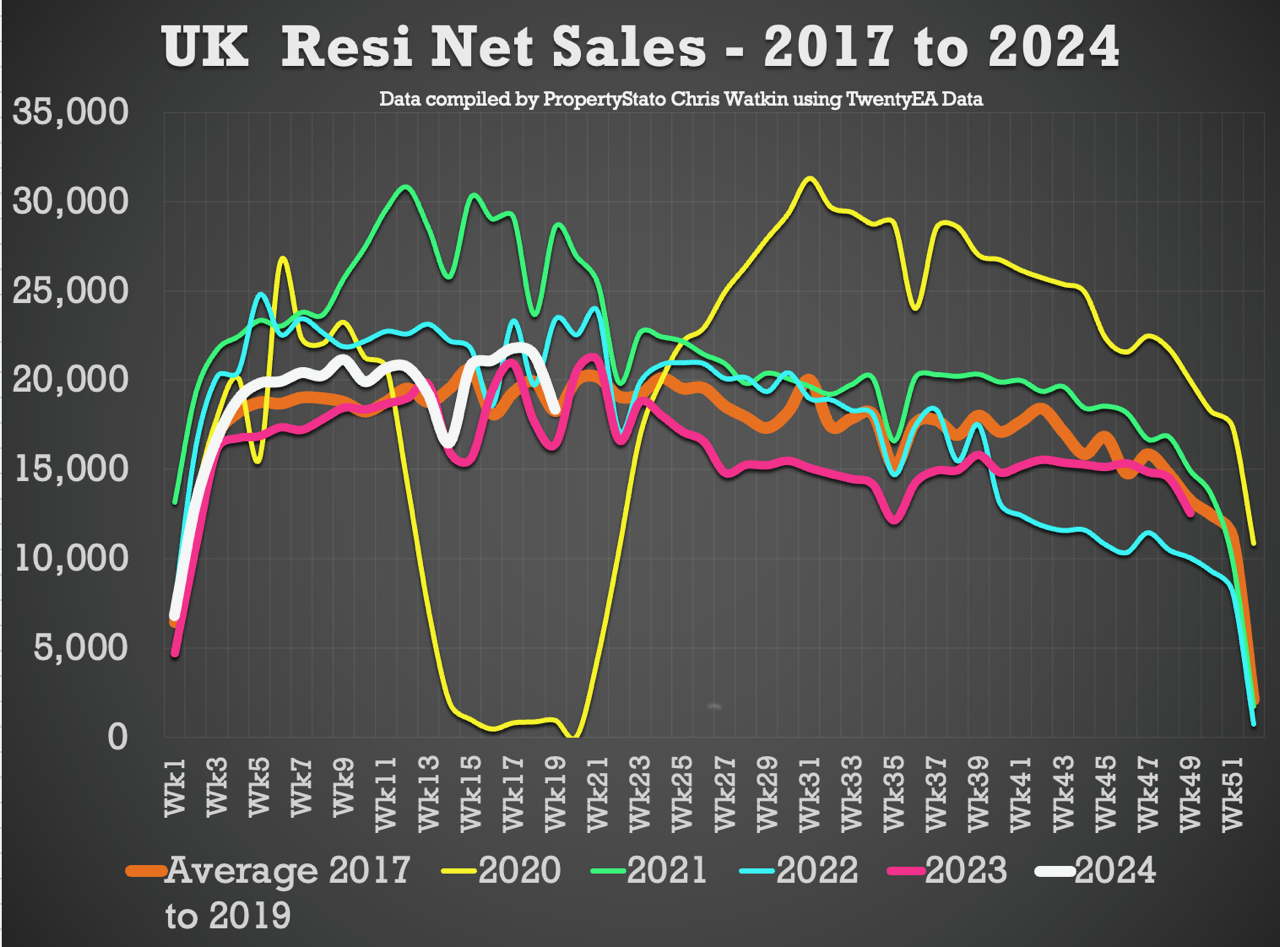
+ Net Sales last week were 11.7% higher than Week 19 2023, and only 2.4% lower the 2024 weekly average (despite it being a bank Holiday week).
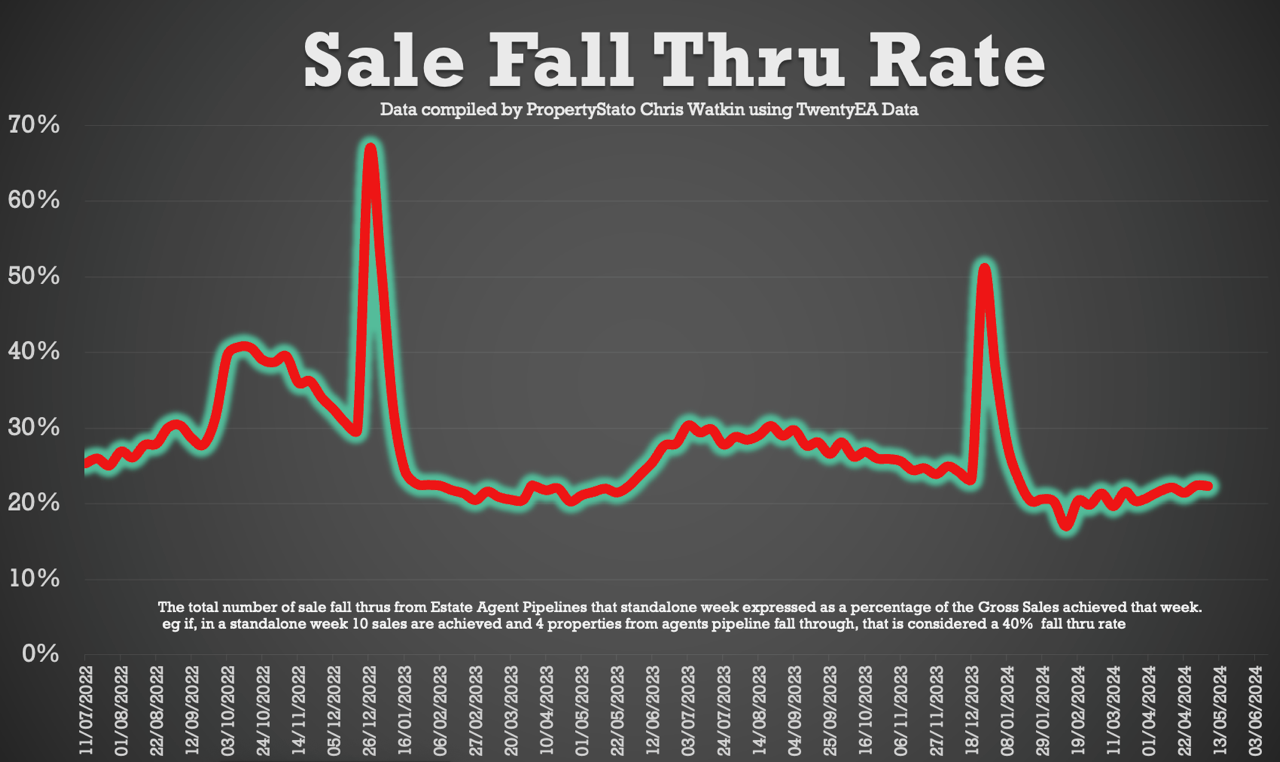
+ Sale fall-throughs still at just over 1 in 5 sales.
Chris’s In-Depth Analysis (Week 19) :
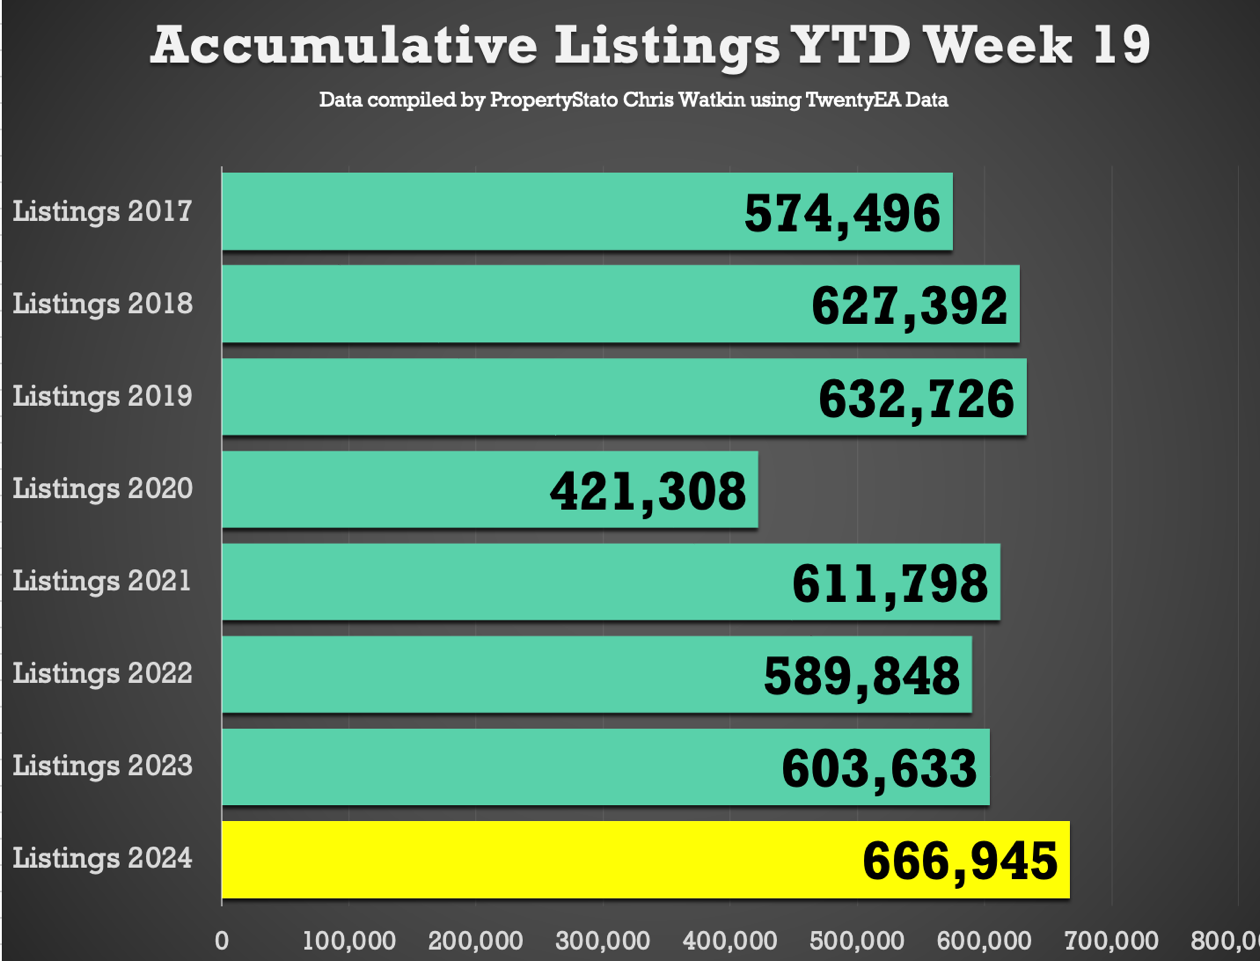
New Properties to Market: The UK saw 32,778 new listings. This year’s YTD listings stand at 666,945, 12.8% higher than the historical 8 year YTD average of 591,018 and 10.5% higher YTD 2023.
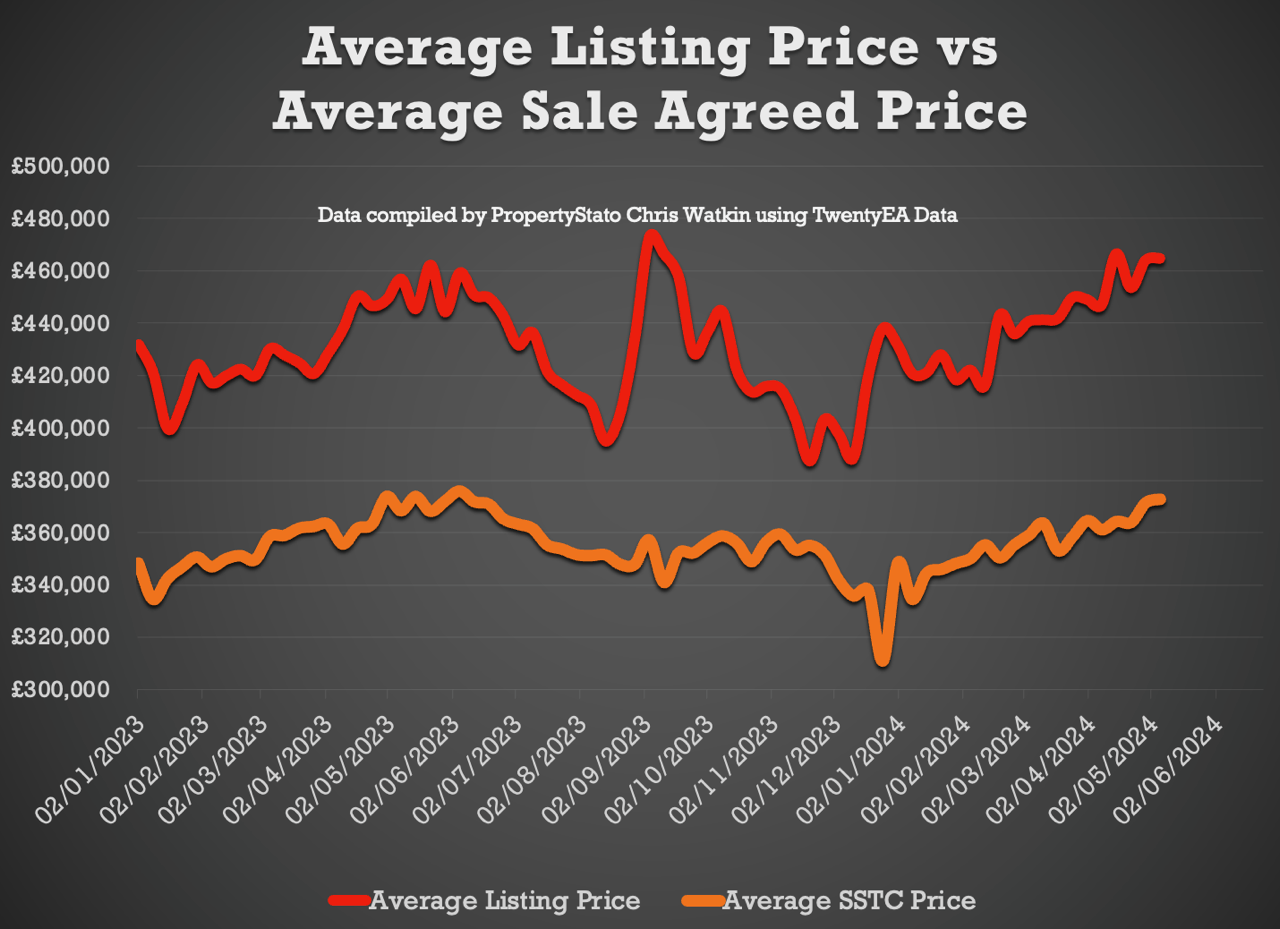
Average Listing Price: £464,745.
Average Asking Price of this week’s Listings vs Average Asking Price of the Properties that Sale Agreed this week: 24.6%. The long-term average is between 16% and 17%. Over valuing in the whole of the UK, higher valuing properties for sale (downsizing) and a lower propensity of London & SE properties to sell causing this.
Price Reductions: Last week, 20,663 properties saw price reductions, a significant number compared to the 8-year Week 18 average of 14,286. This means 1 in 7.17 properties each month are being reduced (Long term average 1 in 9.9 per month)
Average Asking Price for Reduced Properties: £415,128
Gross Sales: 23,628 properties were sold stc last week
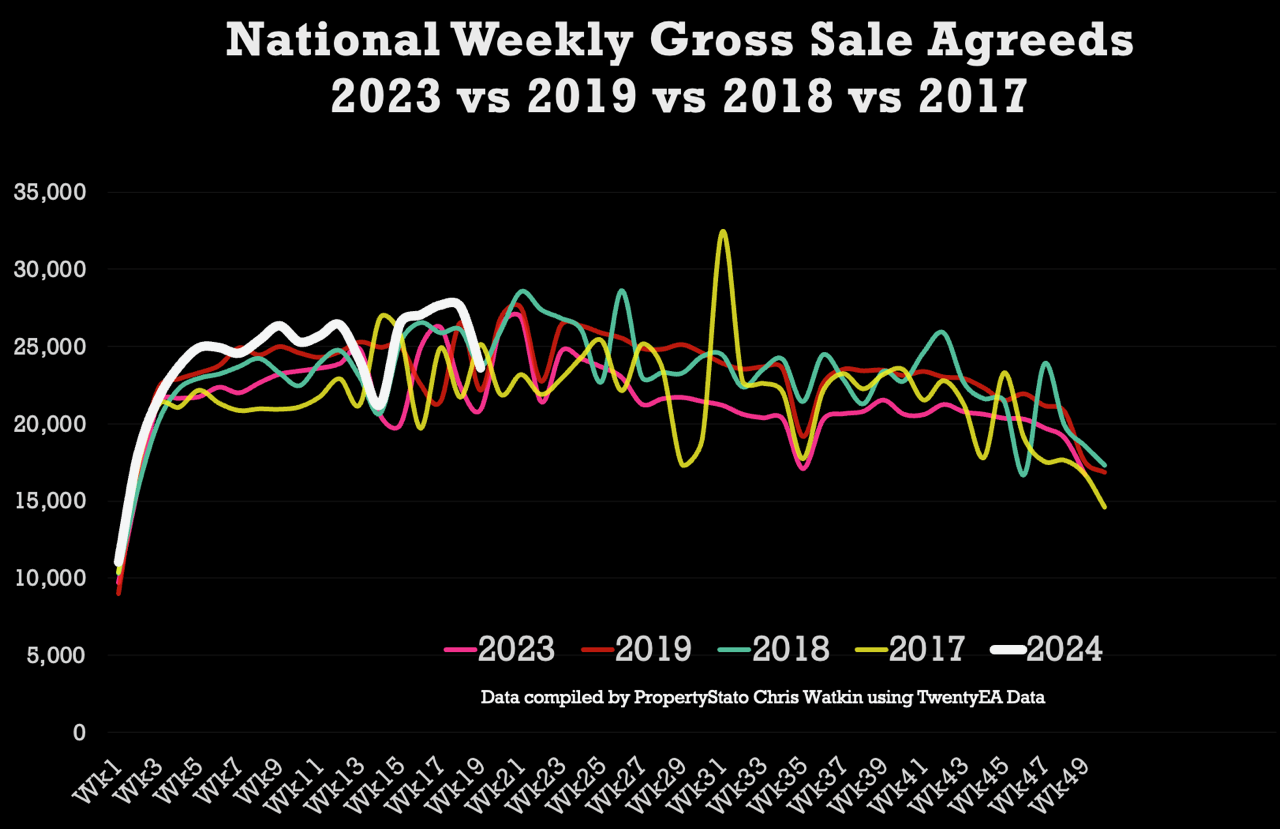
Accumulative Gross Sales YTD: The total stands at 456,148, exceeding the average of 423,602 from 17/18/19 and 411,415 in the same week 19 in 2023.
Average Asking Price of Sold STC Properties: Still staying in the mid £360/370k’s range at £372,876.
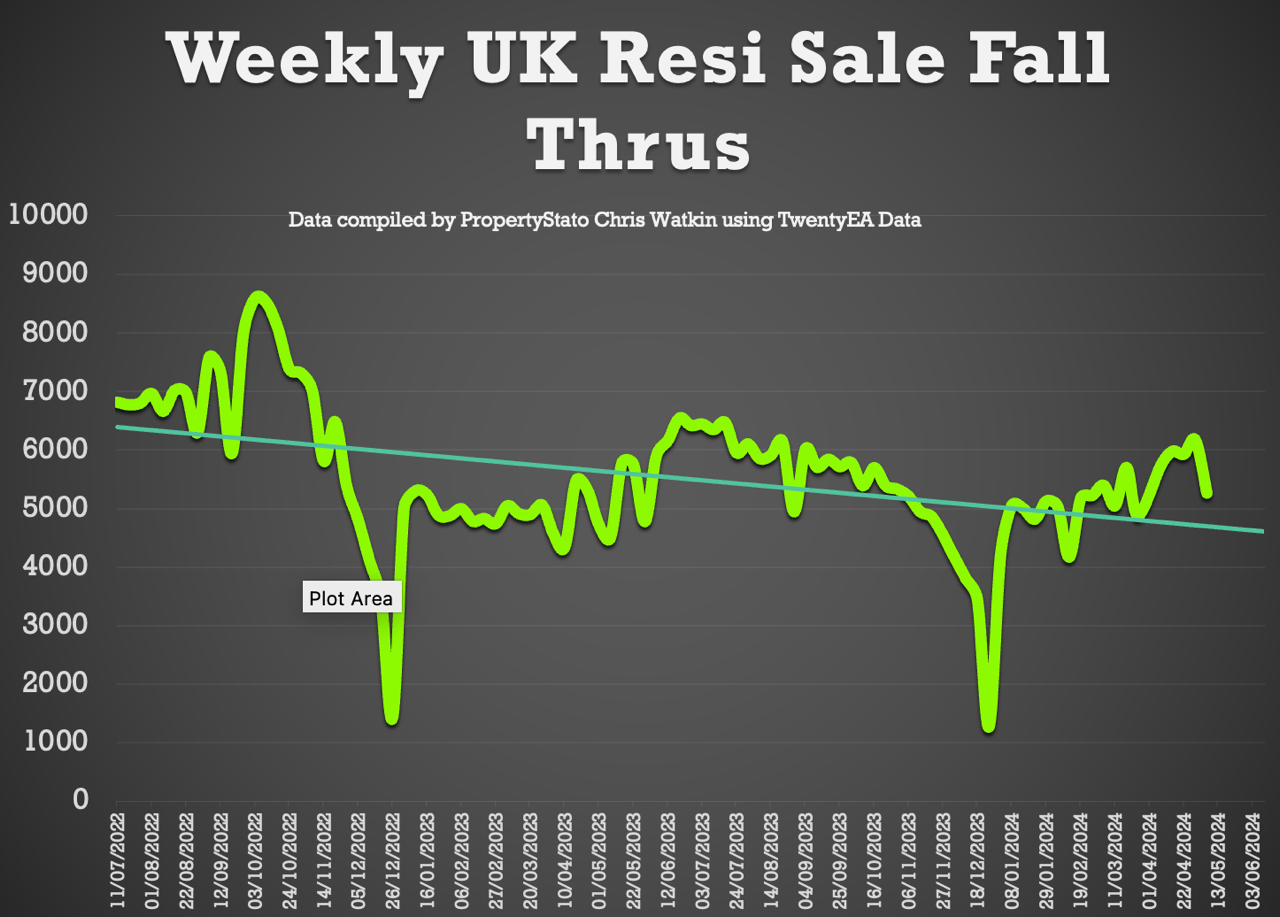
Sale Fall Throughs: Slightly lower to last week at 5,266. For comparison, 5,193 YTD ’24 average weekly figure (& 7,590 weekly sale fall thrus in two months after Truss Budget in Q4 2022)
Sale Fall Through Rate: Slight decrease from last week’s figures, to 22.3% for the week (8 years average is 24.8%) (Remember it was 40%+ in Q4 2022).
Net Sales – at 18,362. YTD ’24 average 18,814.
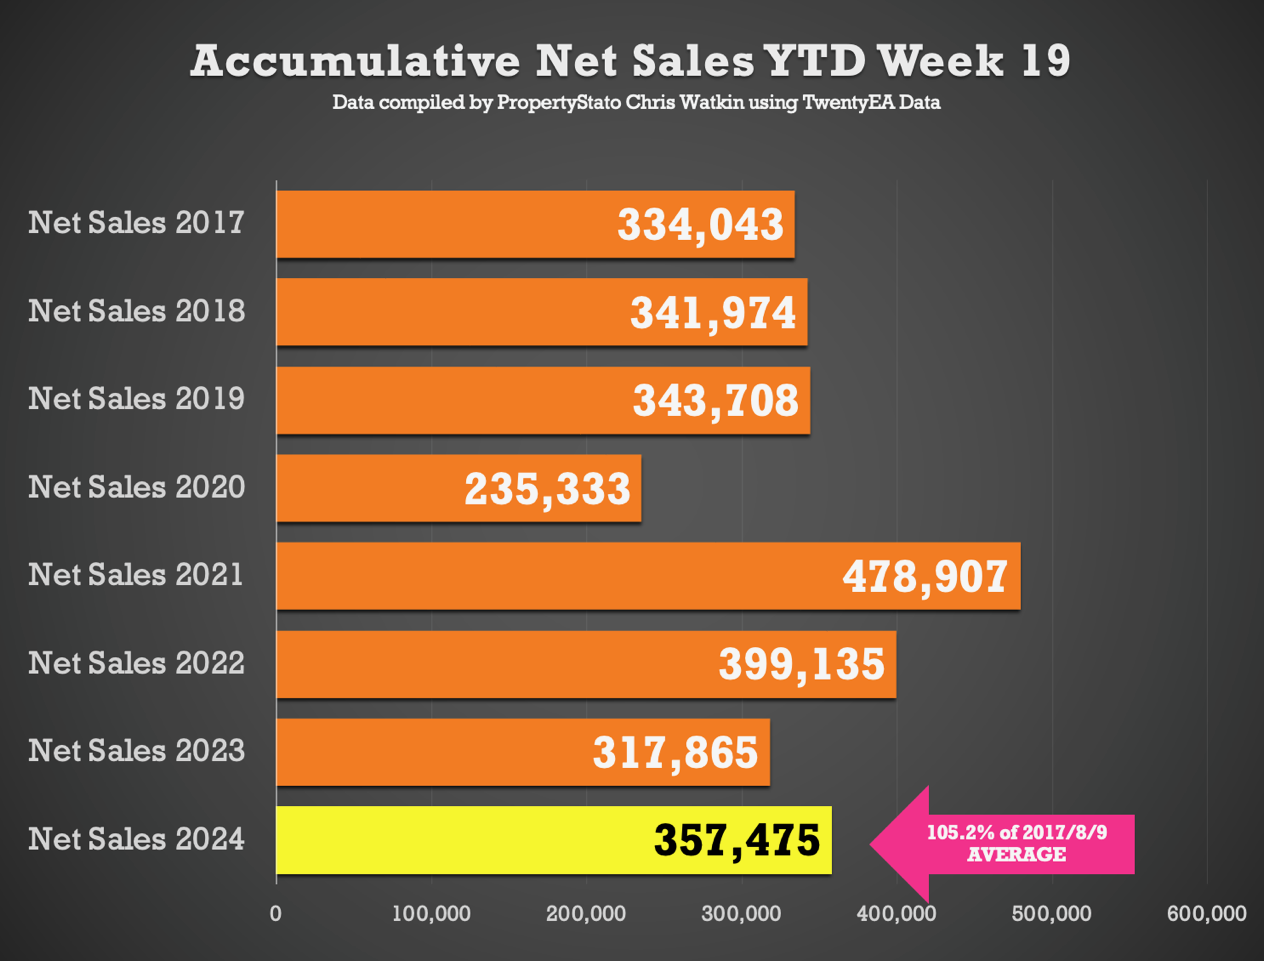
Accumulative Net Sales YTD: The total stands at 357,475, 5.2% higher the 17/18/19 YTD Net sales average (339,908) and 12.5% higher than the YTD figure for 2023 for Net Sales (2023 YTD : 317,865).
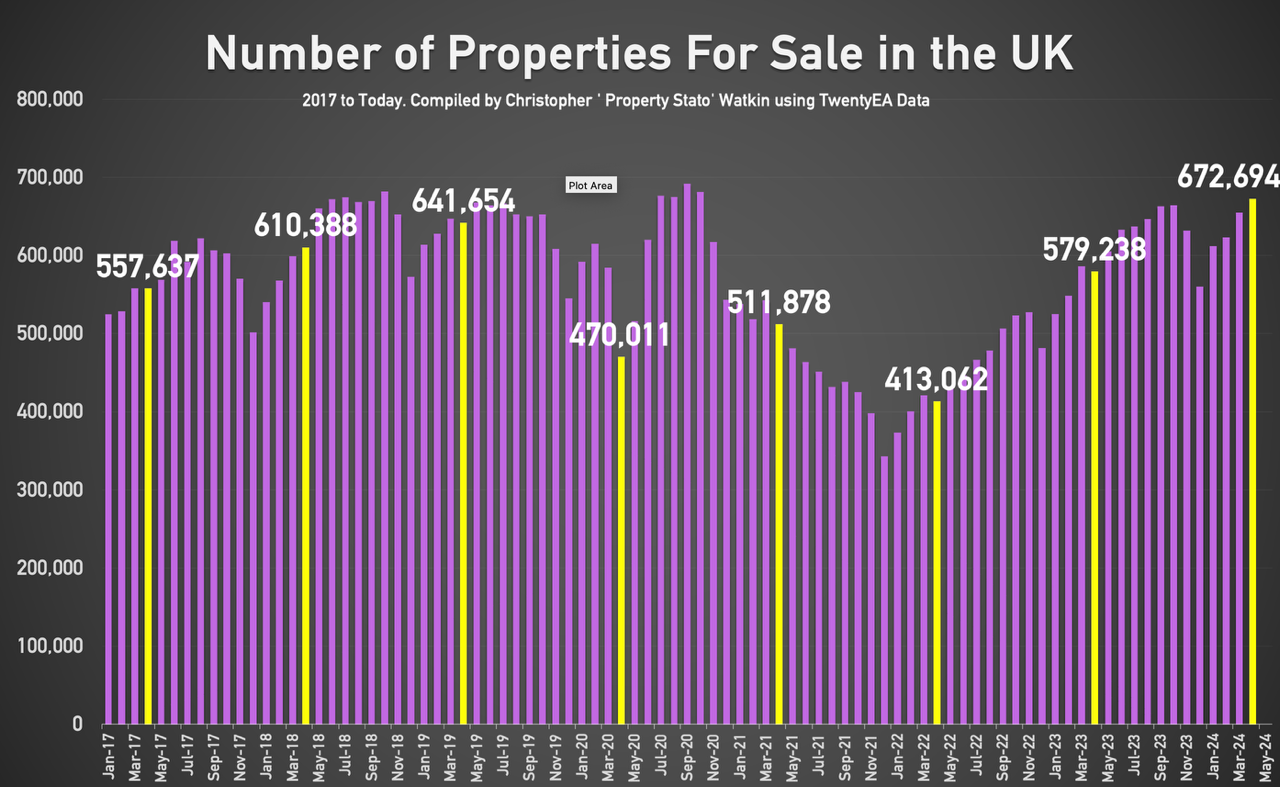
Number of Properties for sale in the UK as at 30th April 2024 – 672k, 16.1% higher than 30th April 2023 (at 579k).
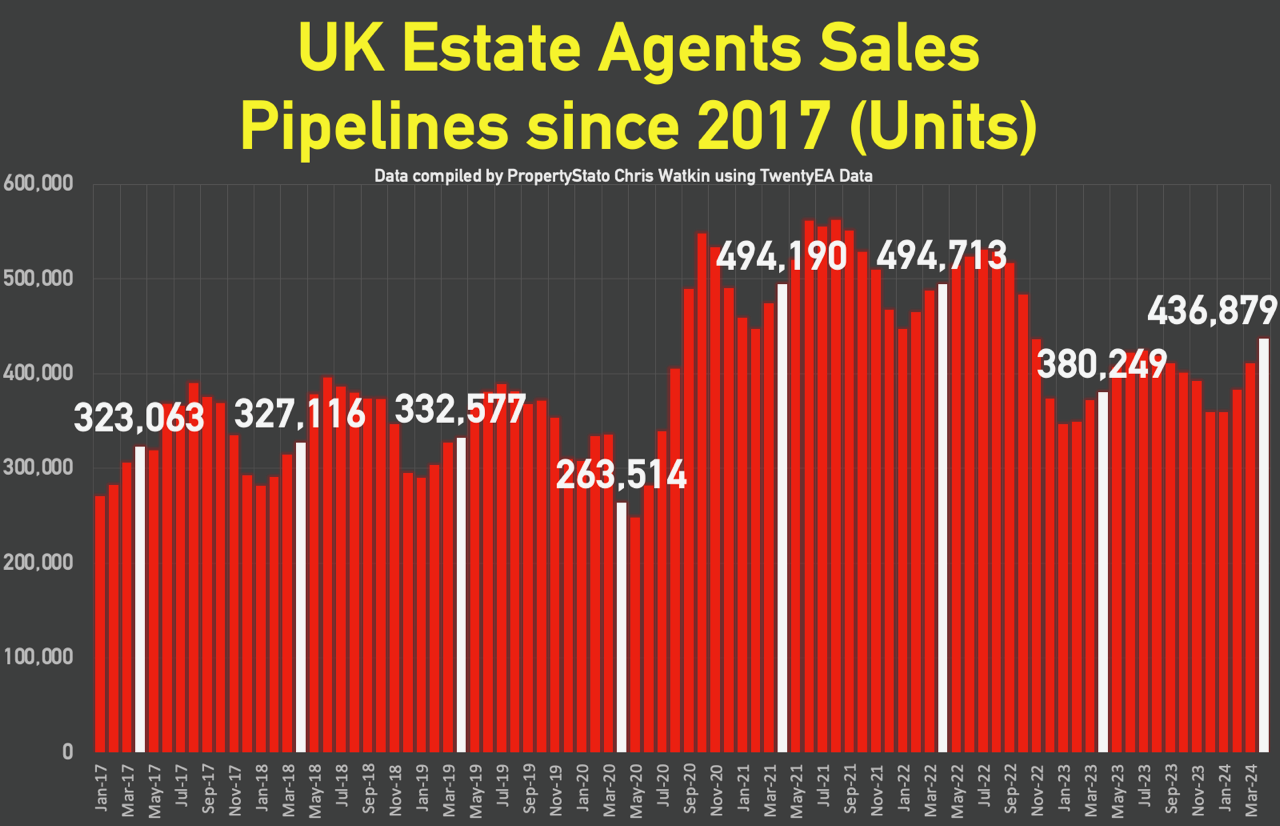
Estate Agents Sales pipelines (by units of properties) at 436,879, 14.9% higher than same times 12 months ago.
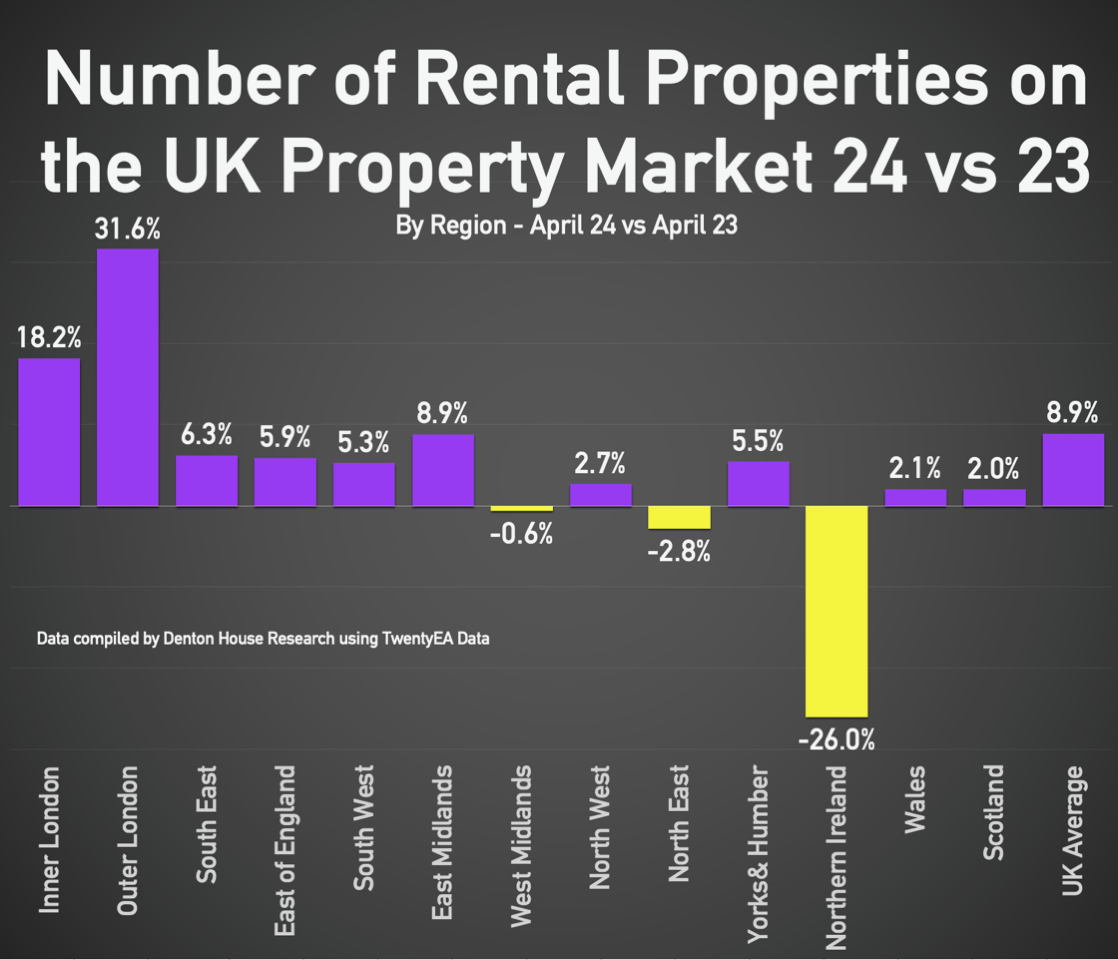
Rise in Rental properties in most regions coming onto the market in April 24, compared to April 23.
This week’s local focus is on Hereford


