 In this week’s show, special guest Iain White and I talk about the current state of play in the UK property market for week 47 (week ending Sunday, 26th November 2023).
Considering the time of year, the economics headwinds, you will be pleasantly surprised!
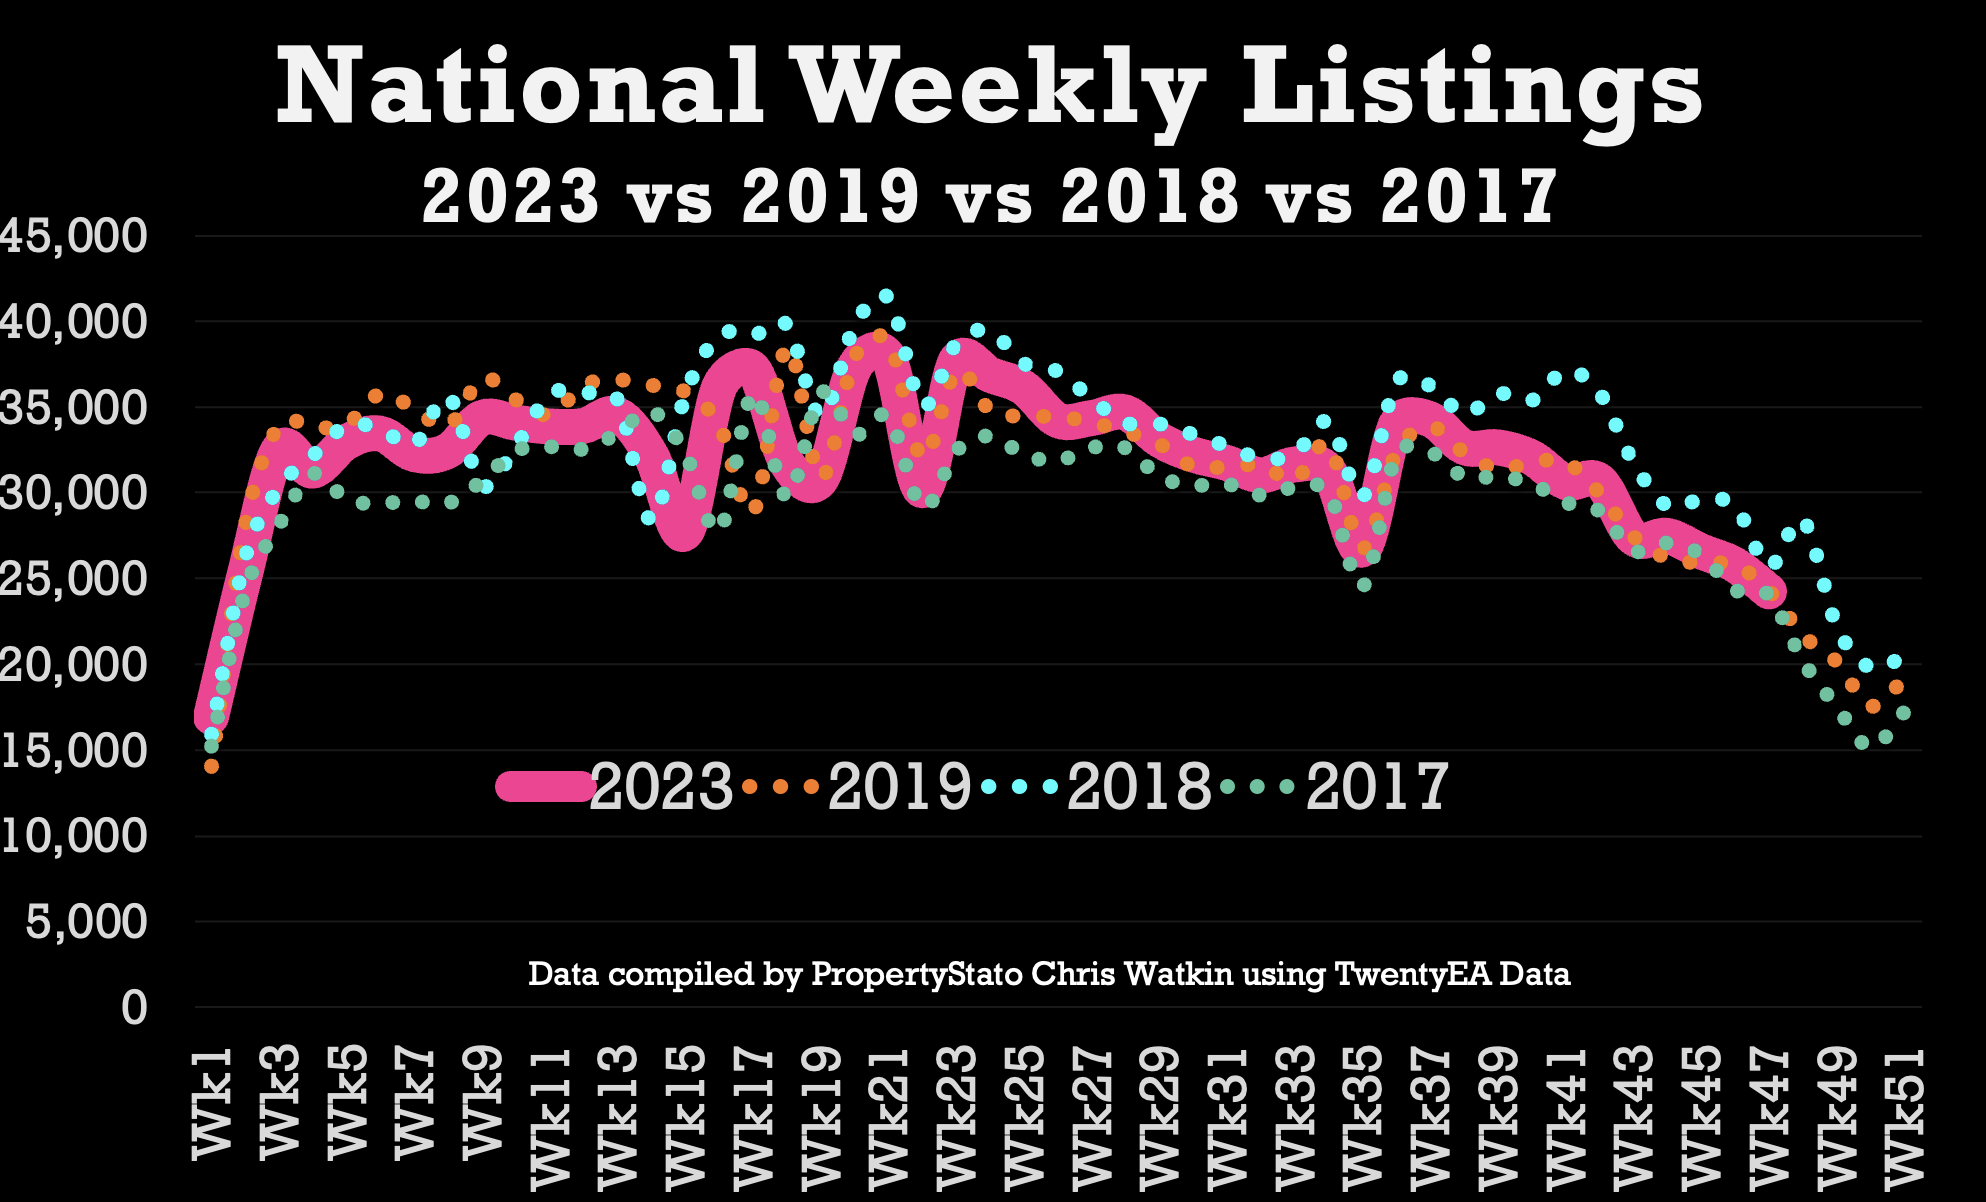
Listings YTD 2023 are 99.4% of the 2017/8/9 YTD average (last week 99.4%)
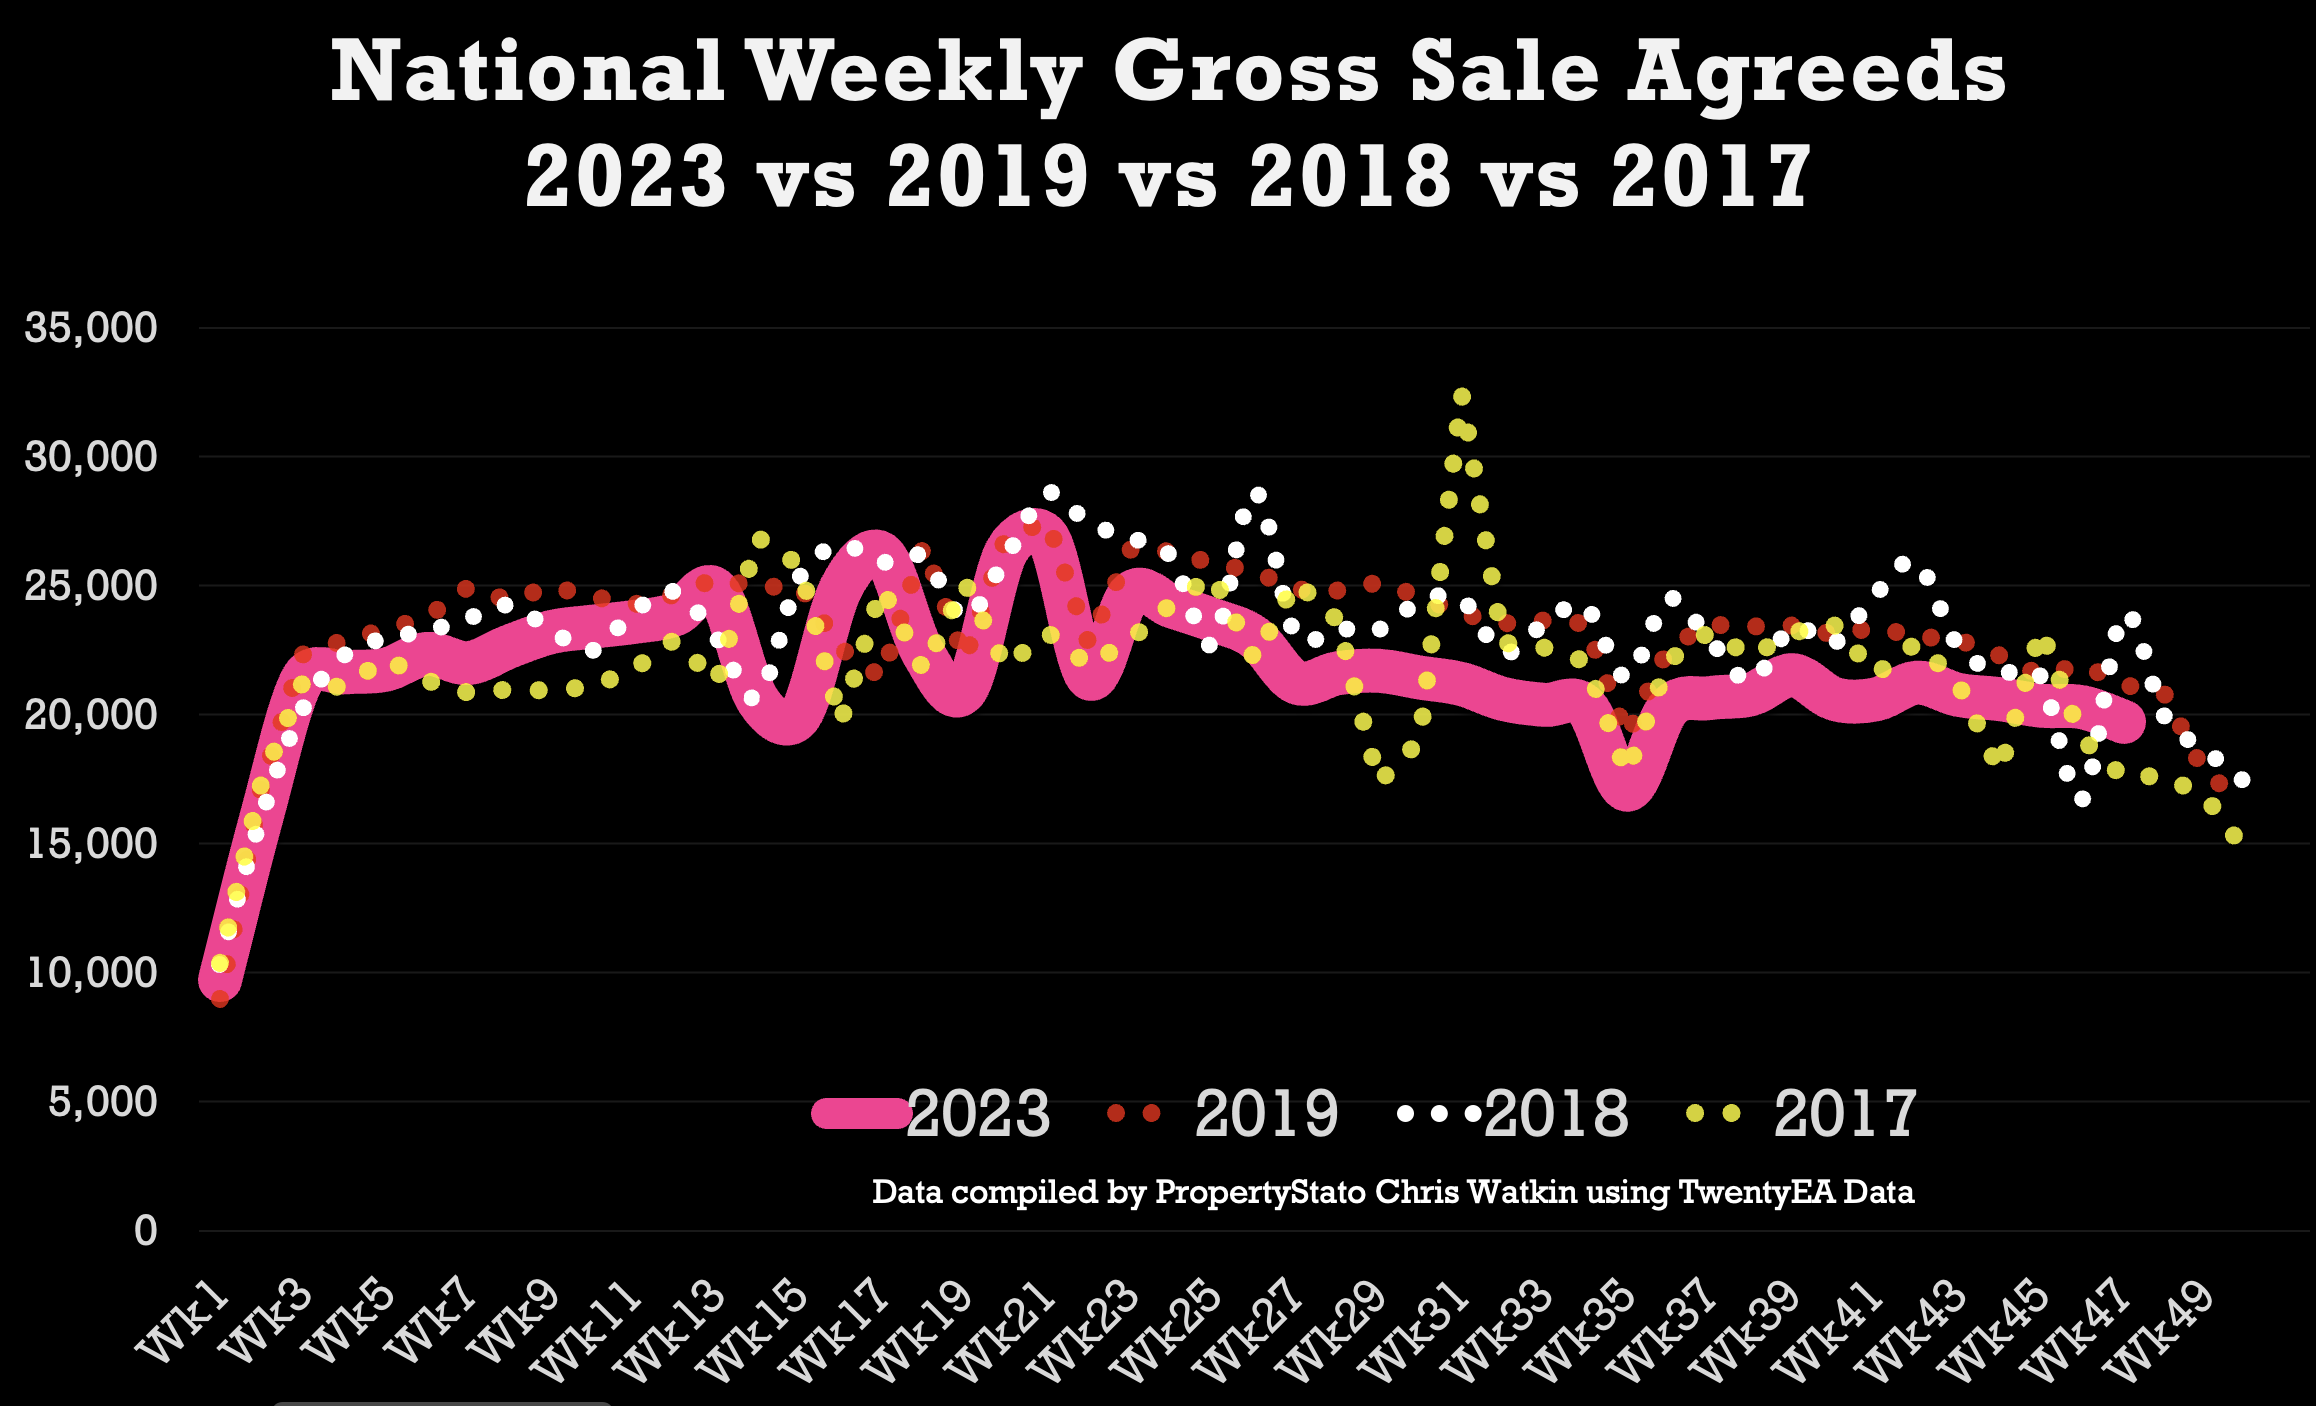
Gross Sales YTD 2023 are 94.3% of the 2017/8/9 YTD average (last week 94.3%)
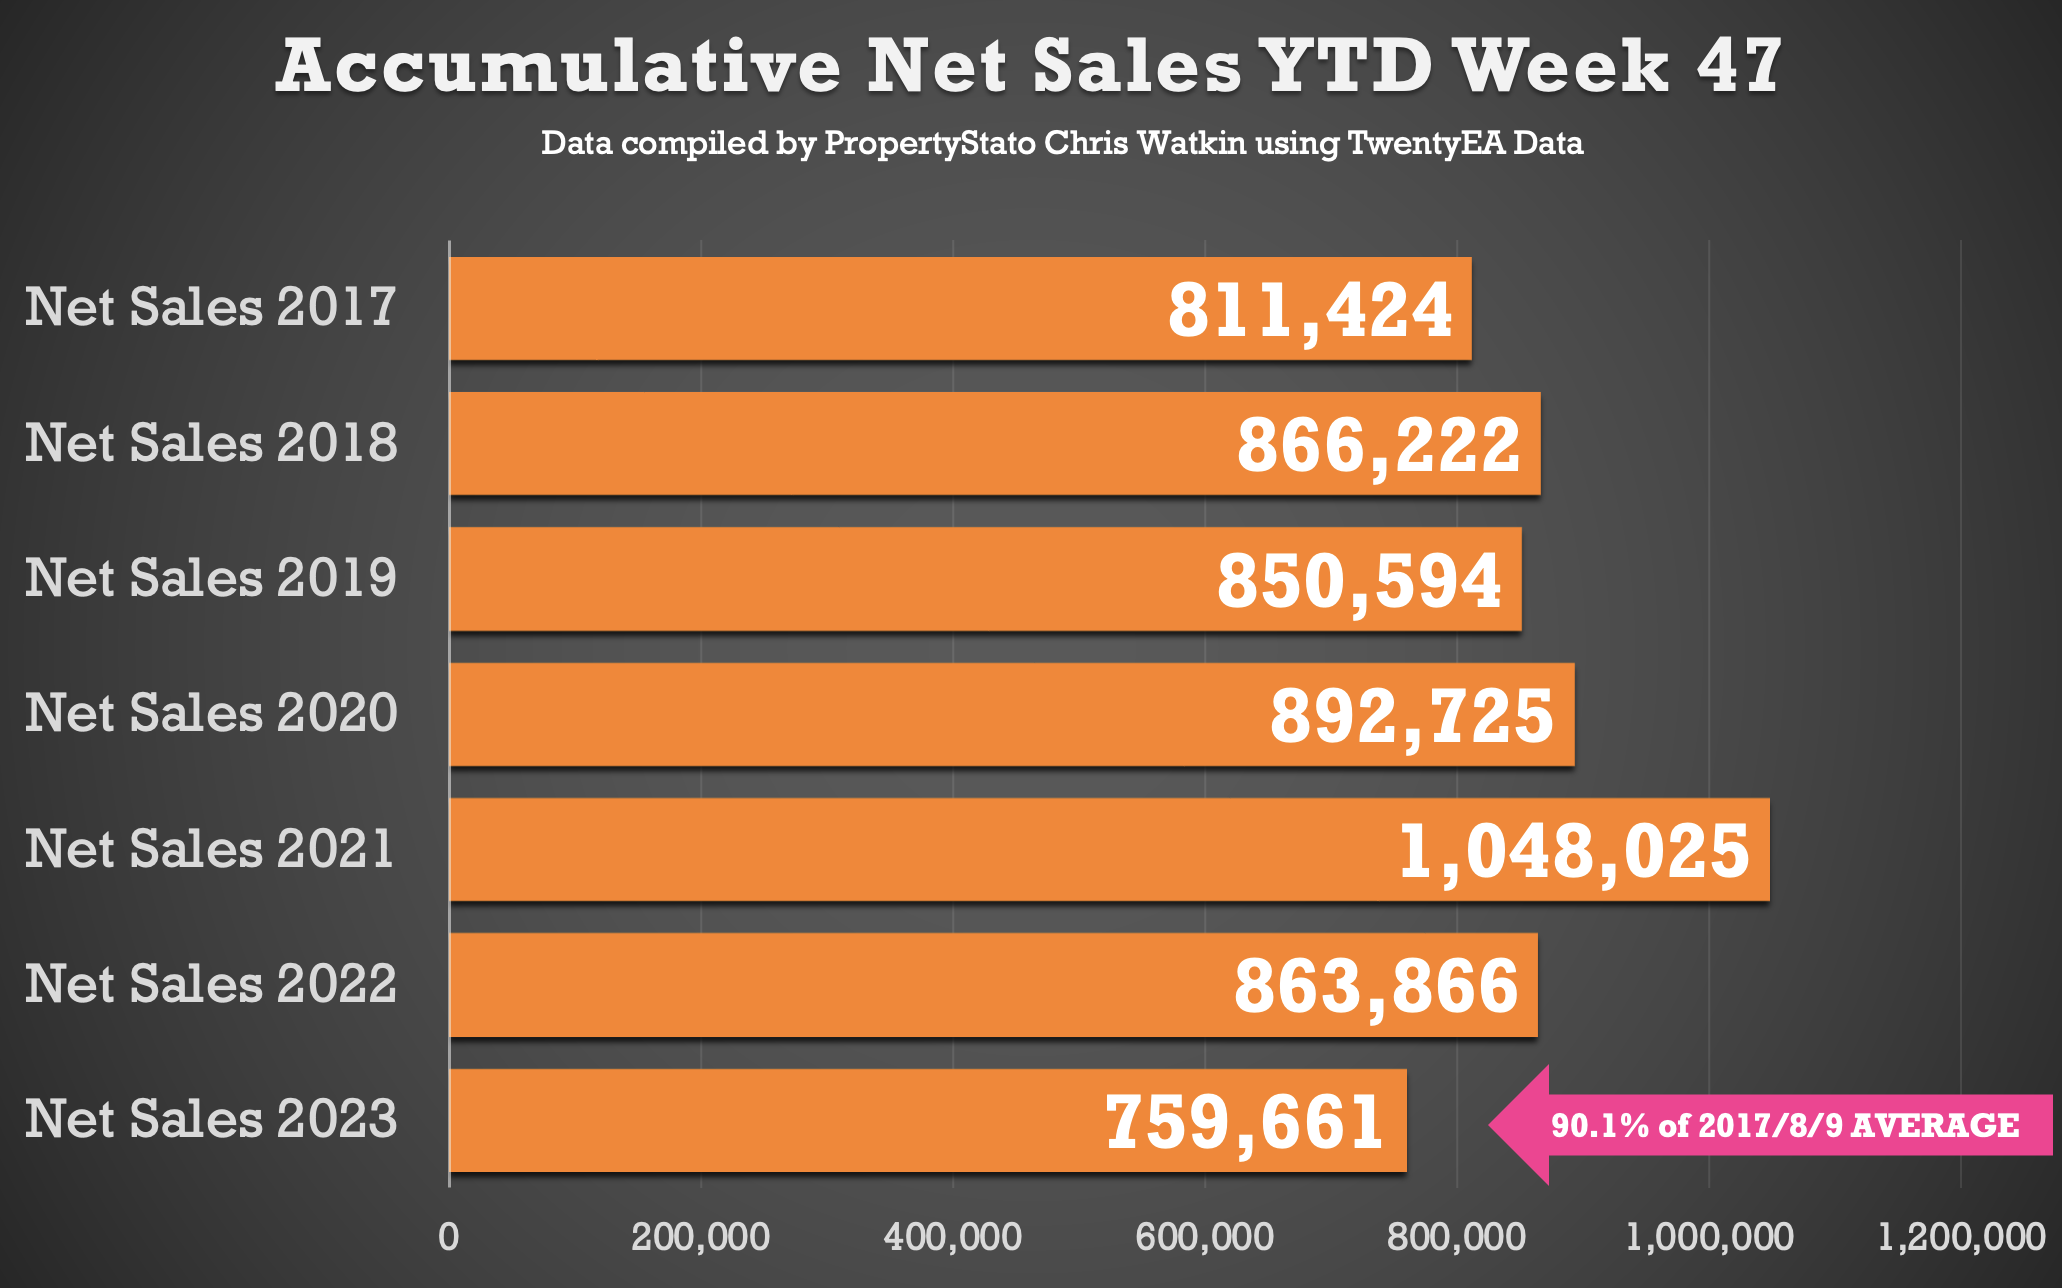
Net Sales YTD 2023 are 90.1% of the 2017/8/9 YTD average (last week 90%)
Looking at key statistics in more detail.
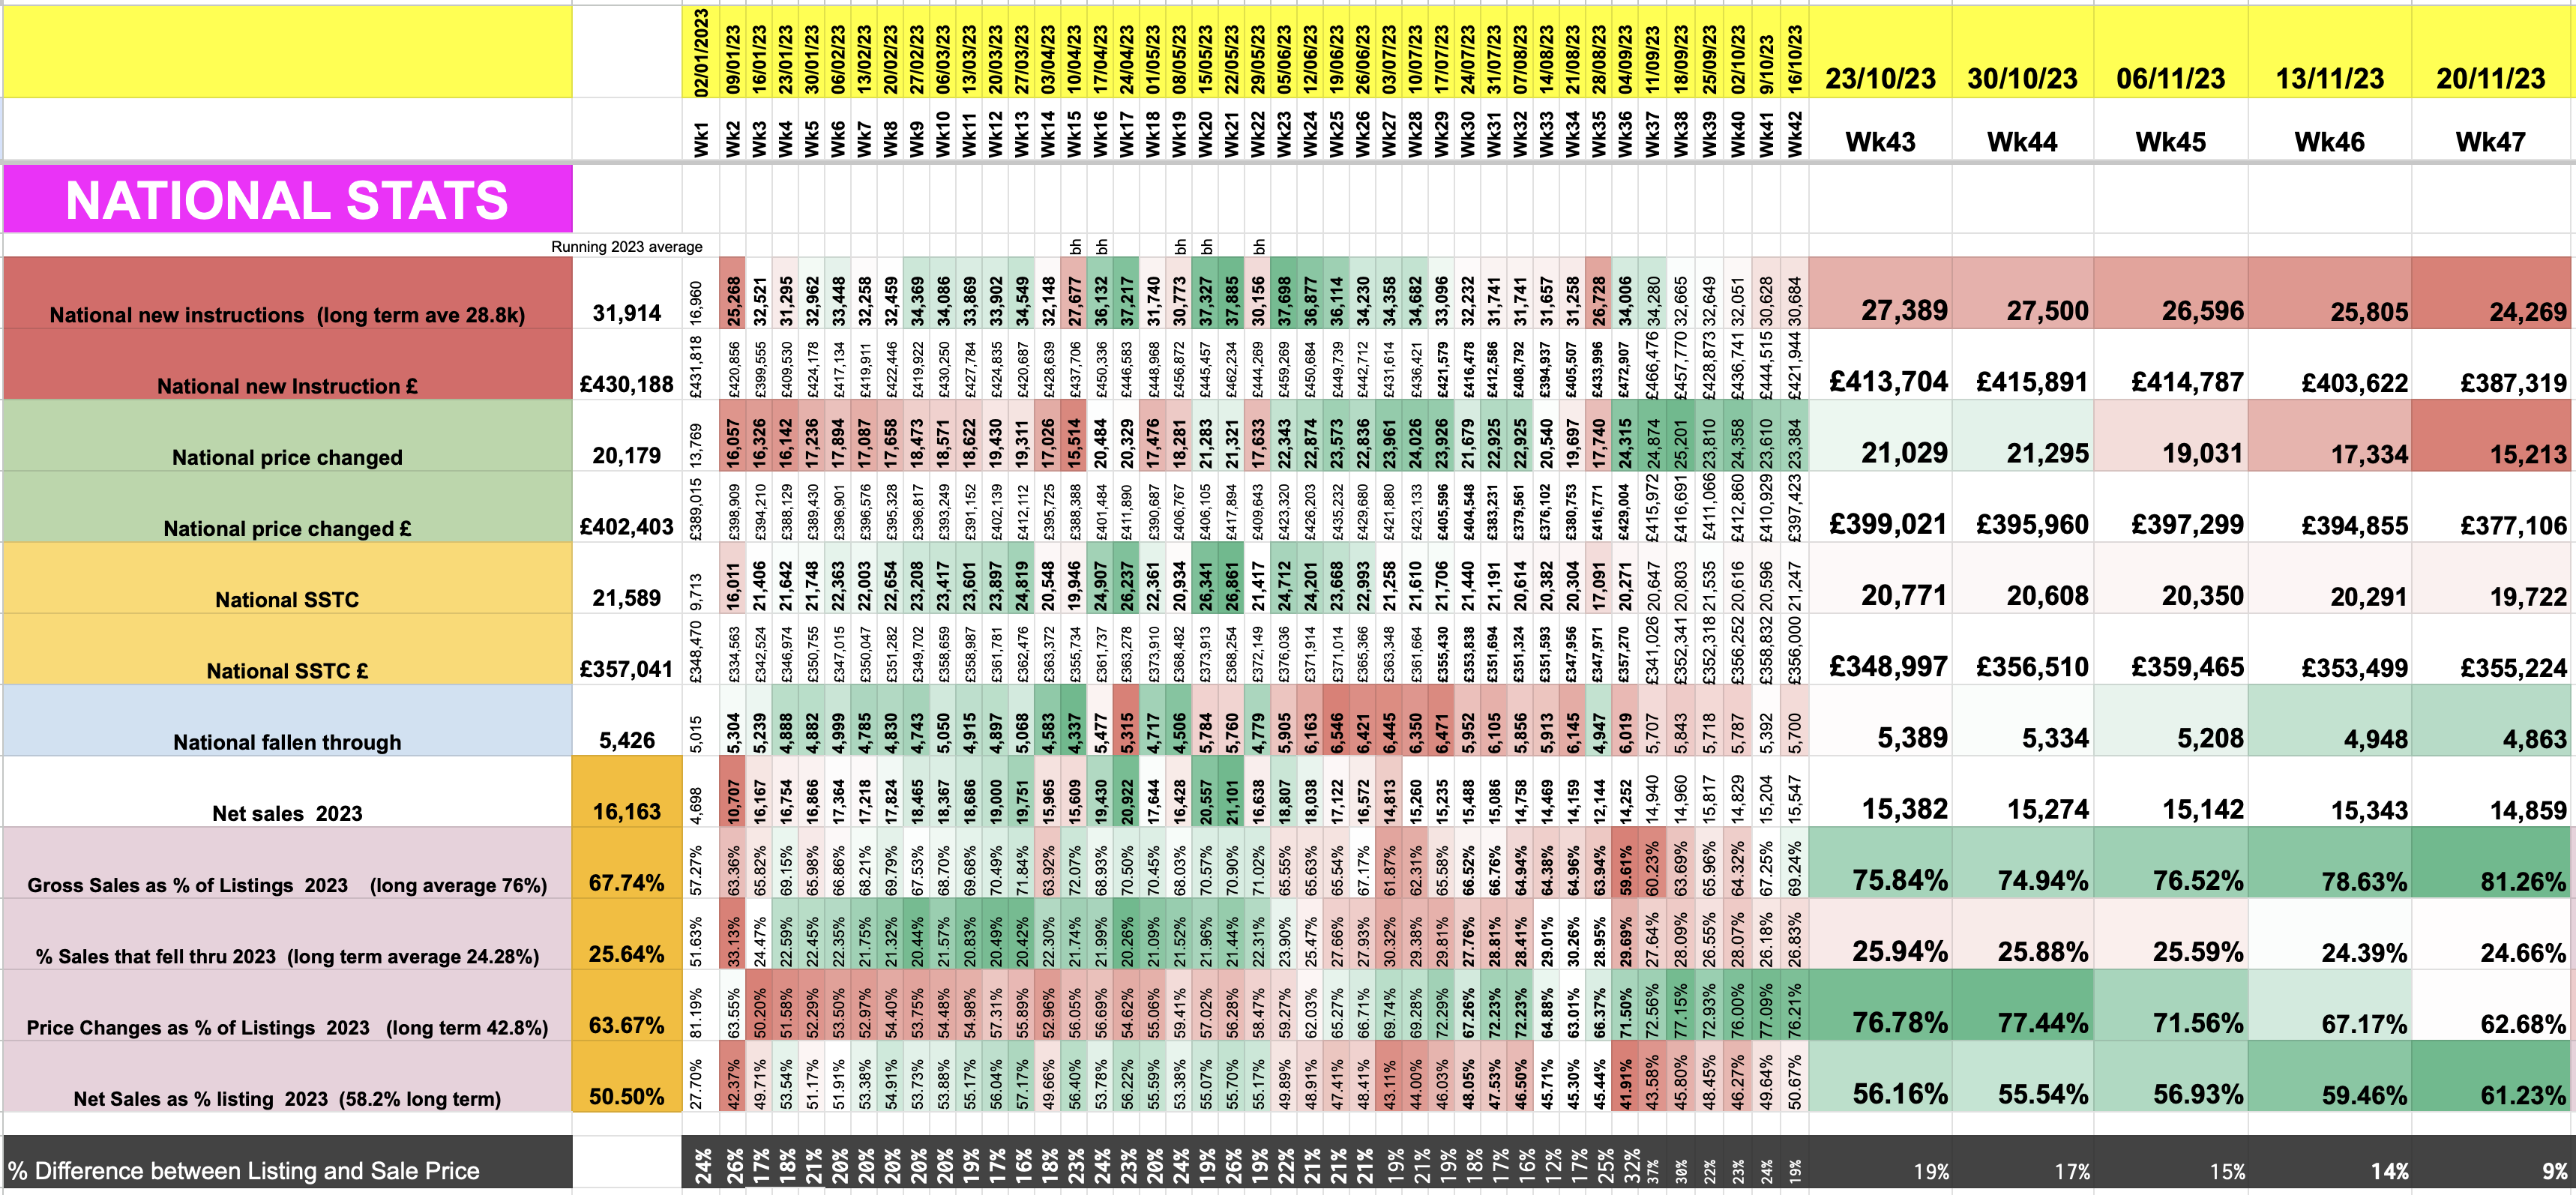
+ New Properties to the Market (listings): The number of listings last week was 26,269 (average for the last four weeks 26,043). The 2023 YTD running weekly average stands strong at 31,914.
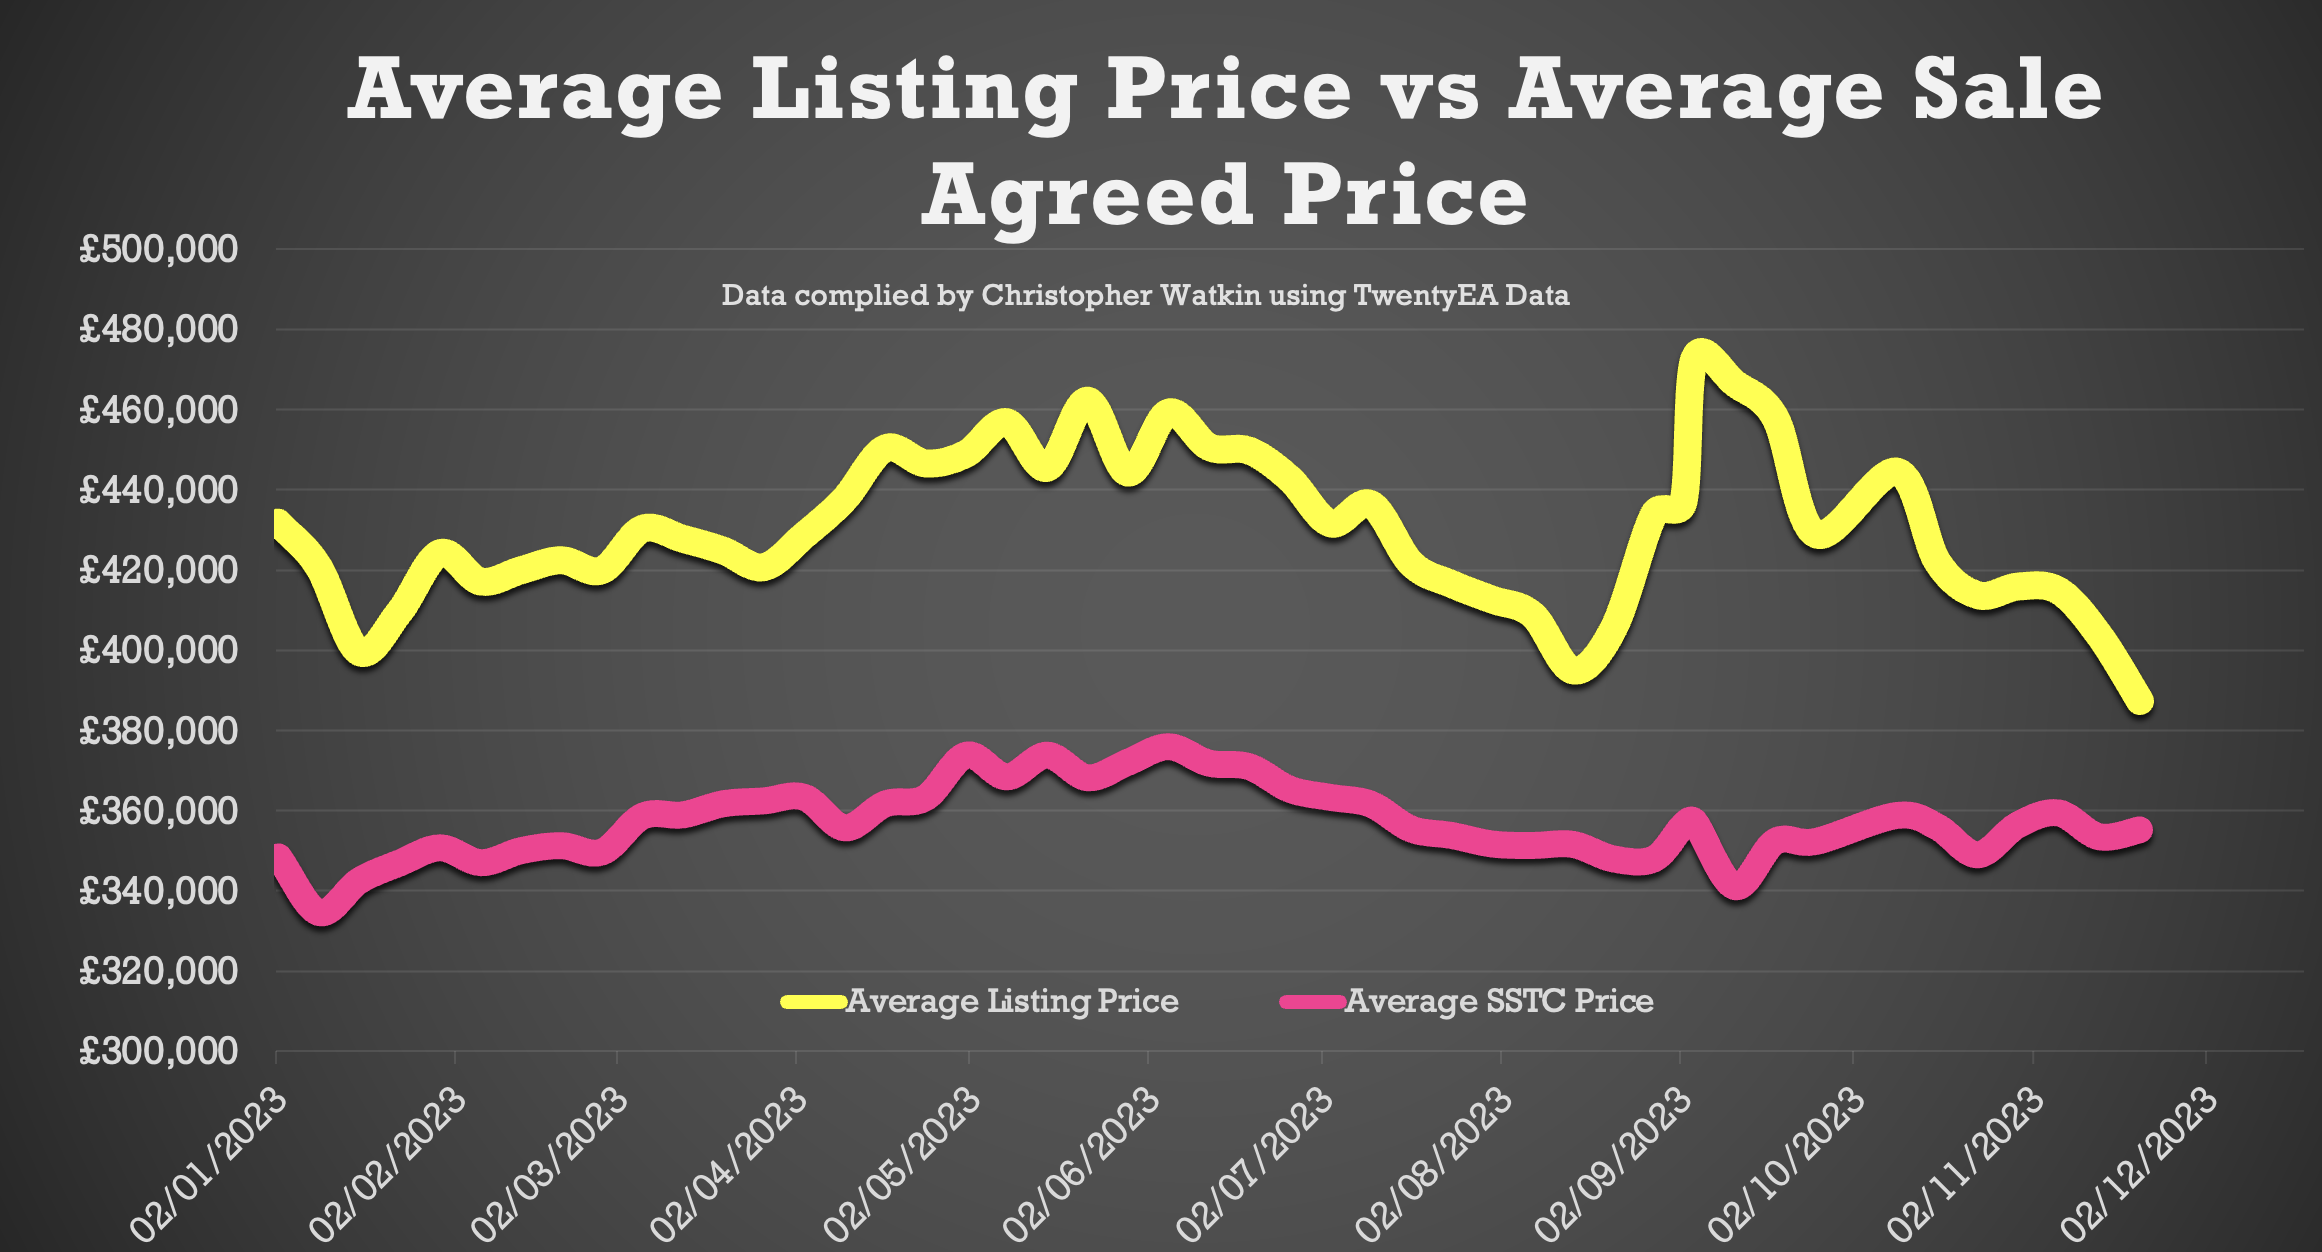
+ Average Listing Price: The average listing price has remained stable in the last few weeks. Average Listing price this week £387,319, a considerable drop from the early £400k’s a few weeks ago. The 2023 running weekly average of £430,188.
+ Price Reductions: 15,213 price reductions were seen last week which is a significant drop over the last few weeks. The 2023 running weekly average is 20,179 per week.
+ Average Asking Price of Properties being reduced: This week’s average asking price of reduced properties £377,106 (a decent drop from last week). The 2023 running weekly average of £402,403.
+ Number of Properties Sold (Gross Sales): Gross sales are holding up well. Total number of gross sales in the UK last week was 19,722 (not bad for the last week in November). For comparison, the last Quarter running average is 20,564 per week. The 2023 running weekly average is 21,589weekly sales (stc).
+ Average Asking Price of Properties Sold STC this Week: The average asking price of the properties selling last week was £355,224, (very similar for the last few weeks). The 2023 running weekly average of £357,041.
+ Percentage difference between listing and sale agreed prices: This week has dropped to 9%. 2023 YTD average 20.49% and long-term seven year average 17%.
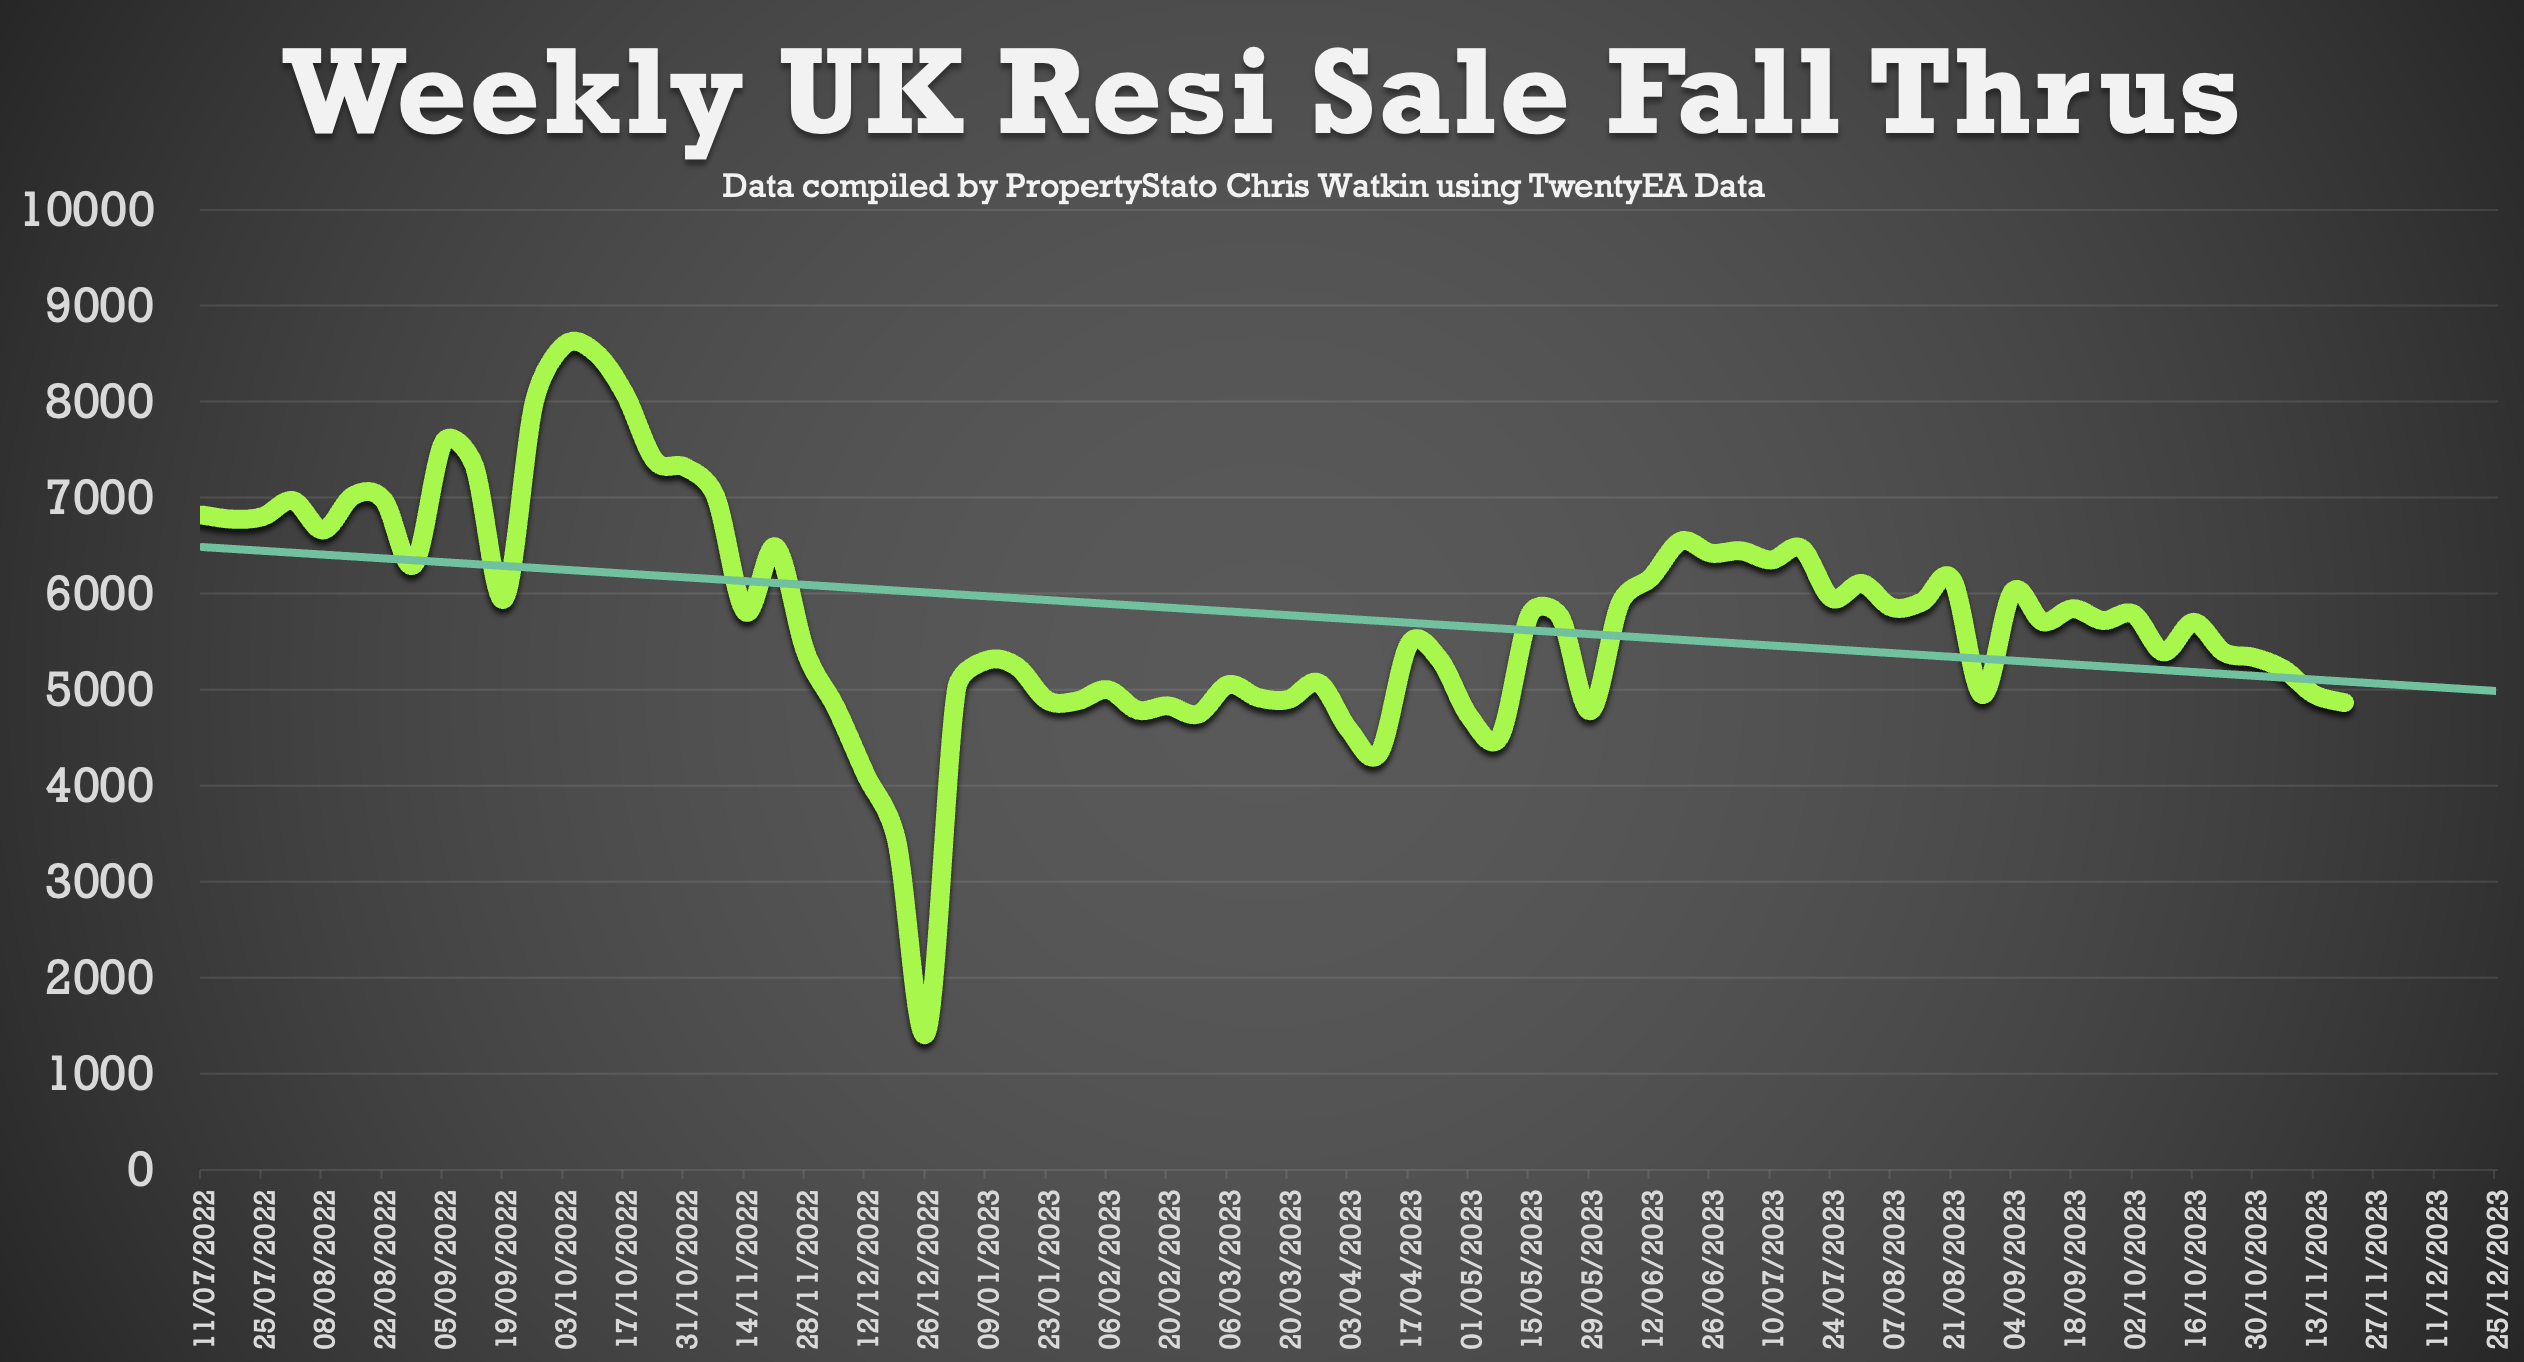
+ Sale fall throughs (units): there were 4,863 Sale Fall Throughs, which is lower to last week’s at 4,948. The running four-week average for Sale Fall Thrus is 5,163 and the YTD figure average of 5,426.
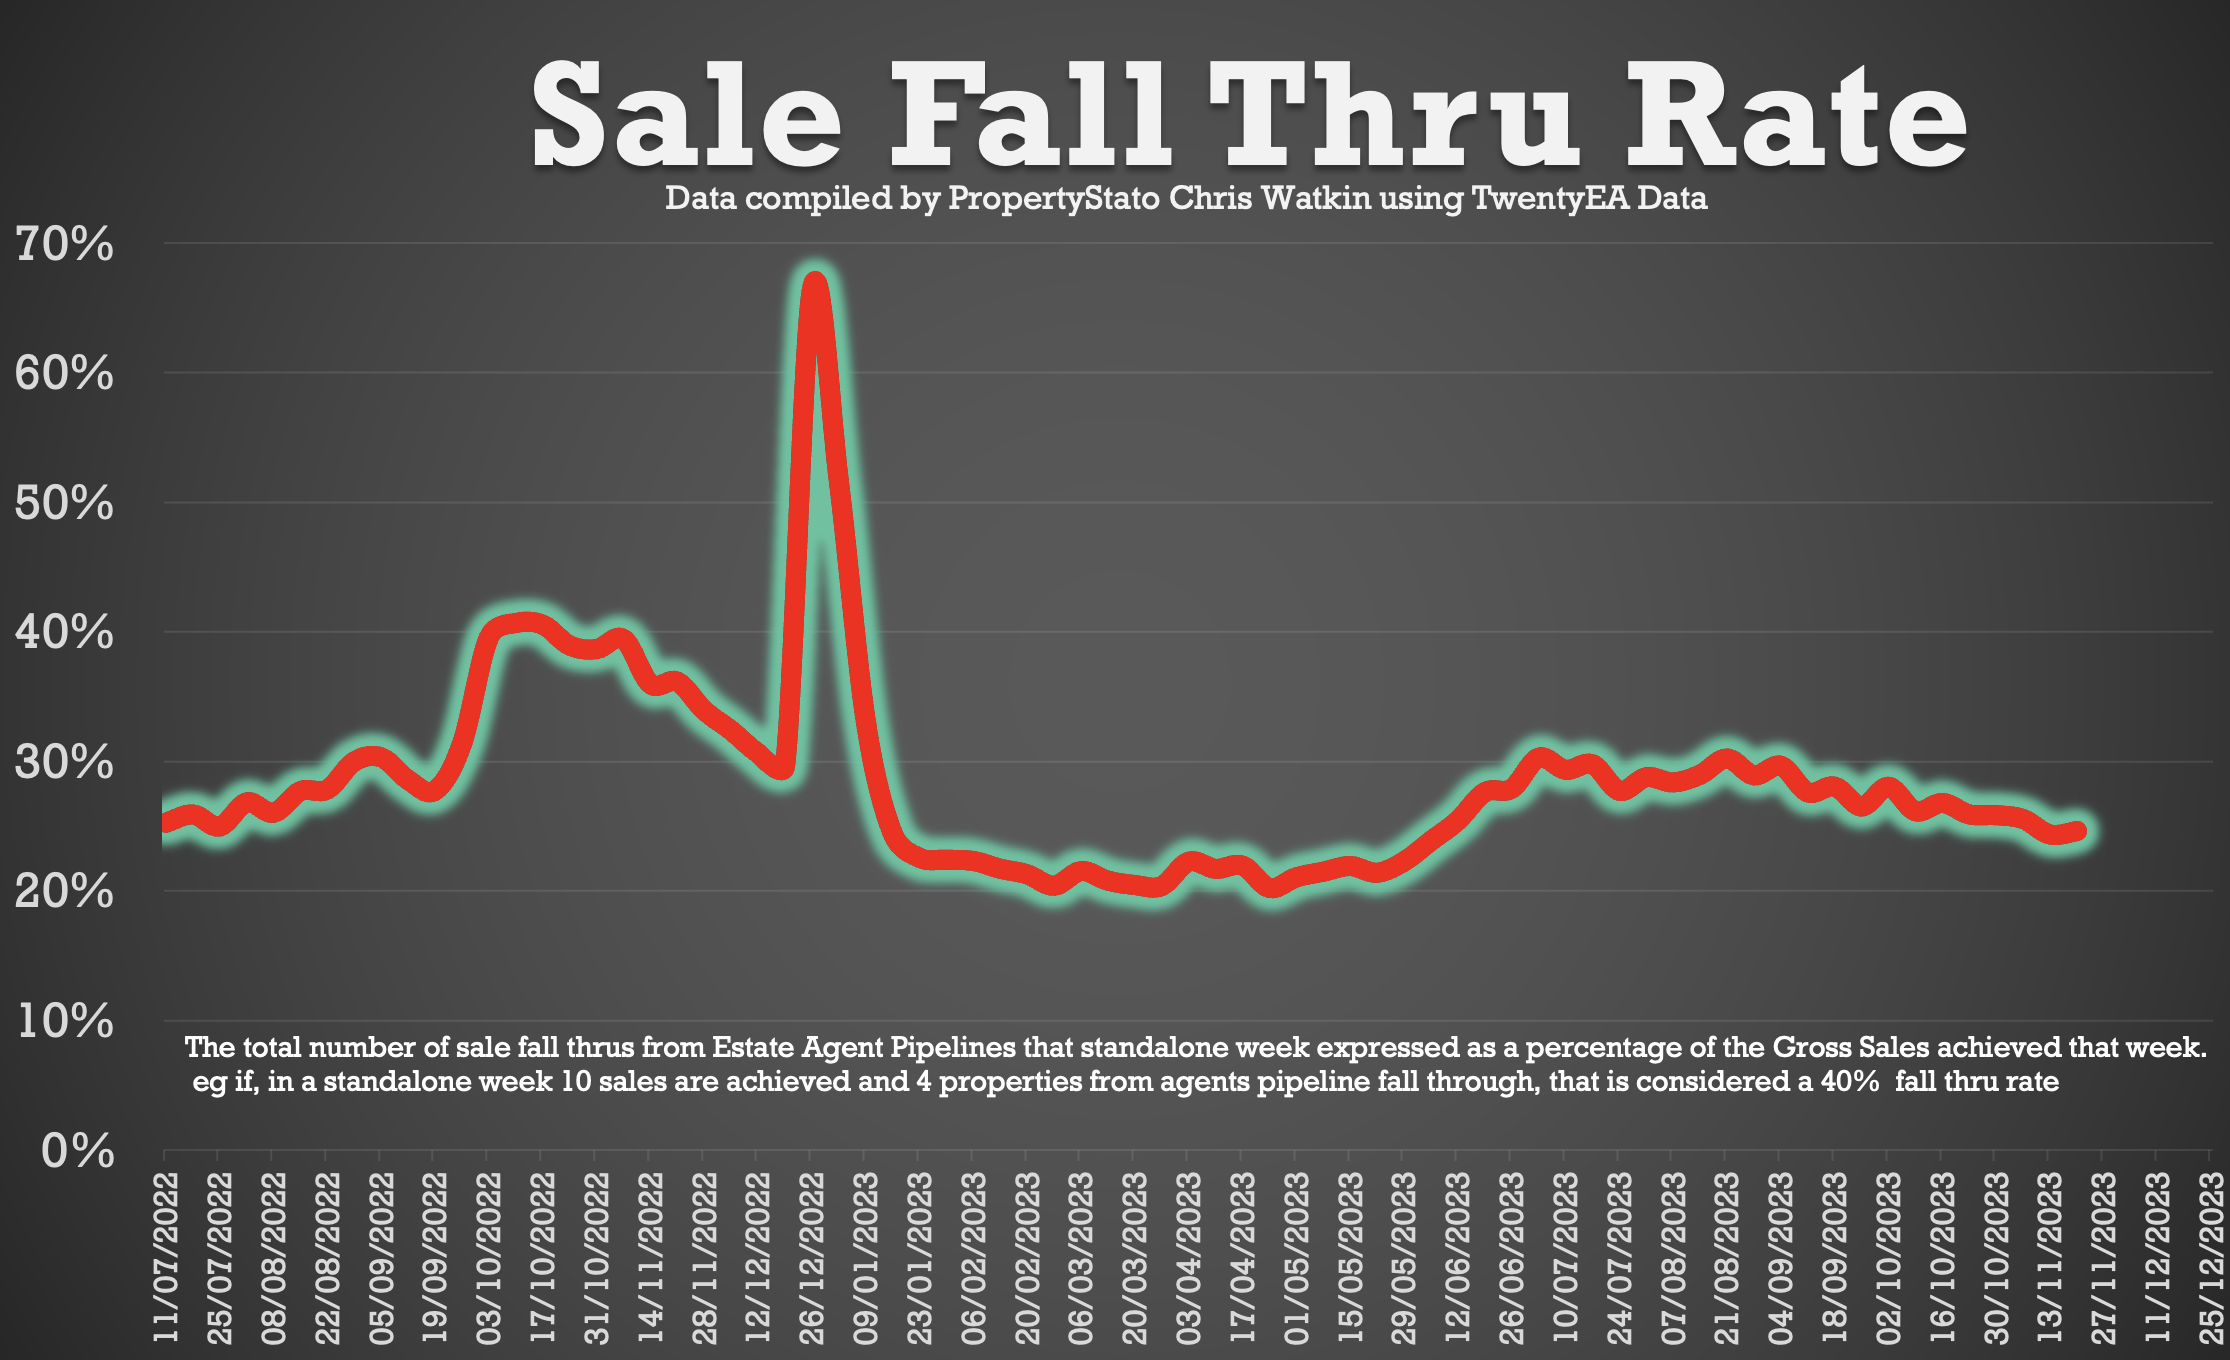
+ Sale fall throughs (Percentage): The Sale fall Thru Rate % is the number of ‘sales fall thrus’ for the week expressed as a percentage of Gross Sales for the week). This week it was at 24.66%. This is a continuation of drop that started in early August 2023 when it was in the early 30%’s. The 2023 running weekly average is 25.64%. Let us not forget, in the same week of 2022, it was 36.18%). The seven-year long-term average is 24.3%.
+ Net Sales This Week: Net Sales increased to 14,859, excellent when compared to the running month average to 15,155. YTD running weekly average is 16,163. For comparison, there were 11,440 in net sales for the same week last year.
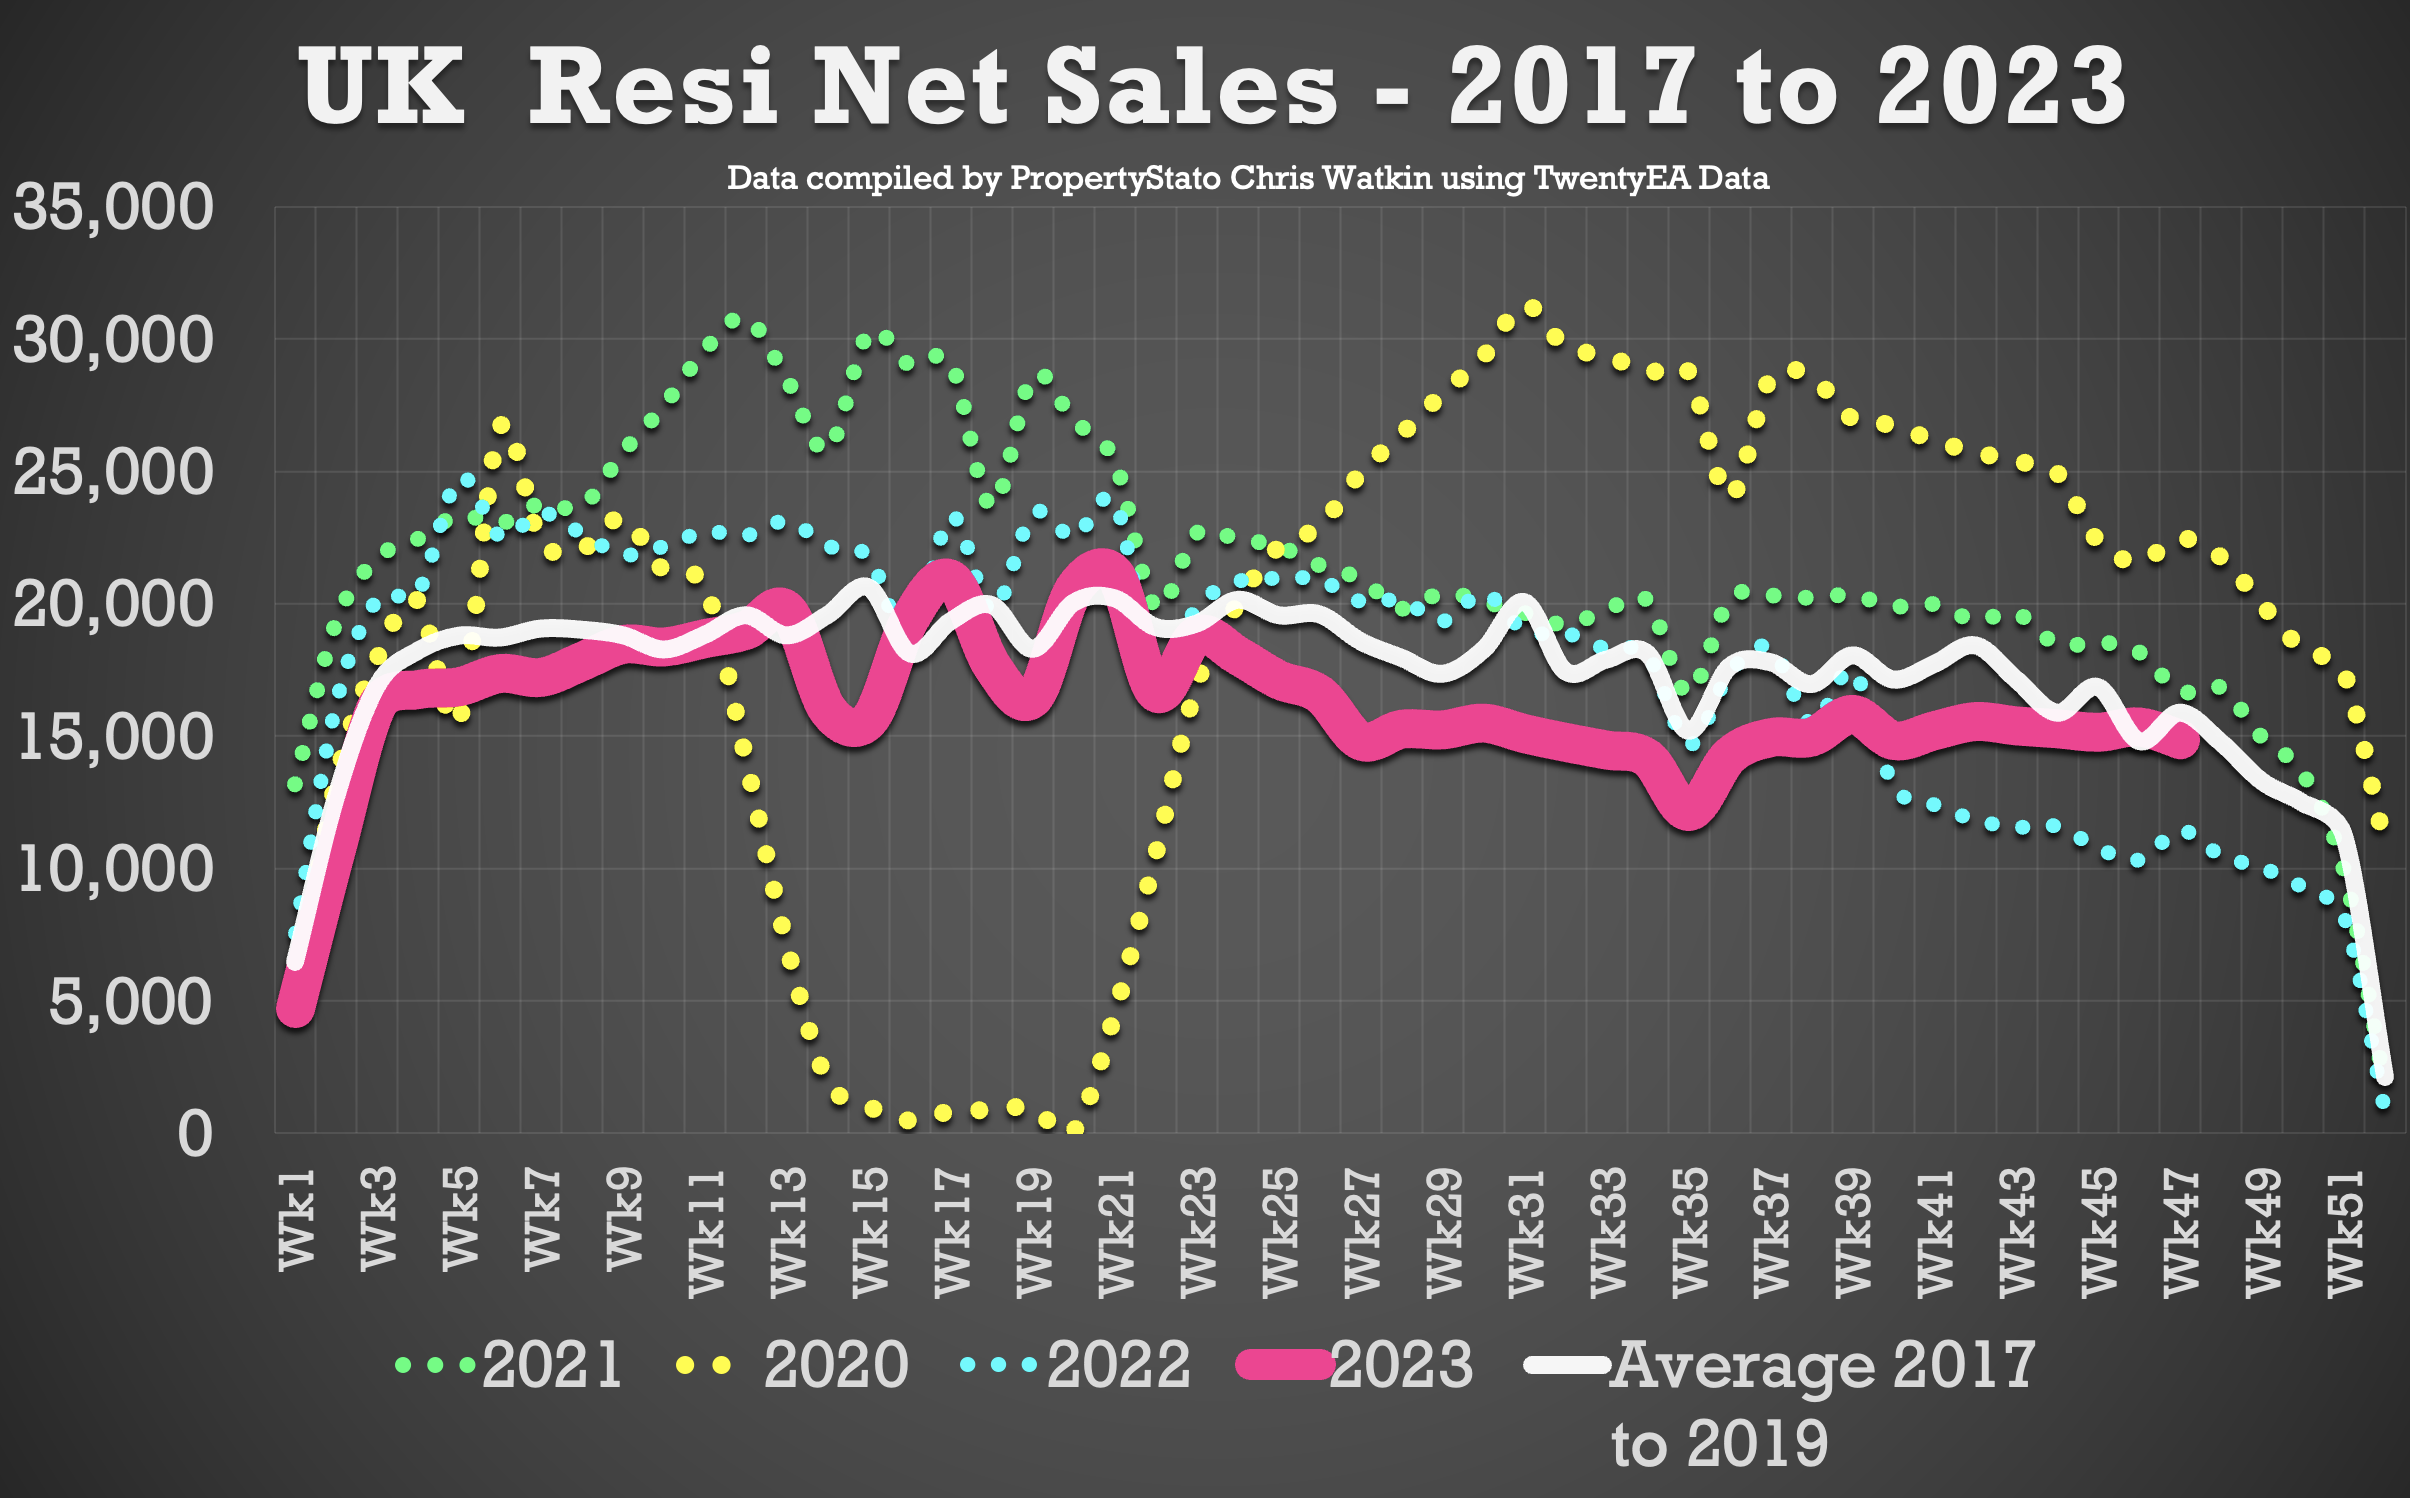
+ Net Sales Year-to-Date: Despite the challenges, the year-to-date net sales of 759k showcase despite the challenging economic news, the market is 8.6% behind the 2017/8/9 average YTD for net sales.
Overall, the UK property market is holding its own, despite the doom mongers. Graph 8
In the last 20 minutes of the show, there is the usual local focus, and this week it is on Mansfield in Nottinghamshire.