
Christopher Watkin is this week joined by special guest Ben Madden to talk about the current state of play in the UK property market for the week ending Sunday, 12 November 2023 (week 45).
Year to date (YTD) headlines:
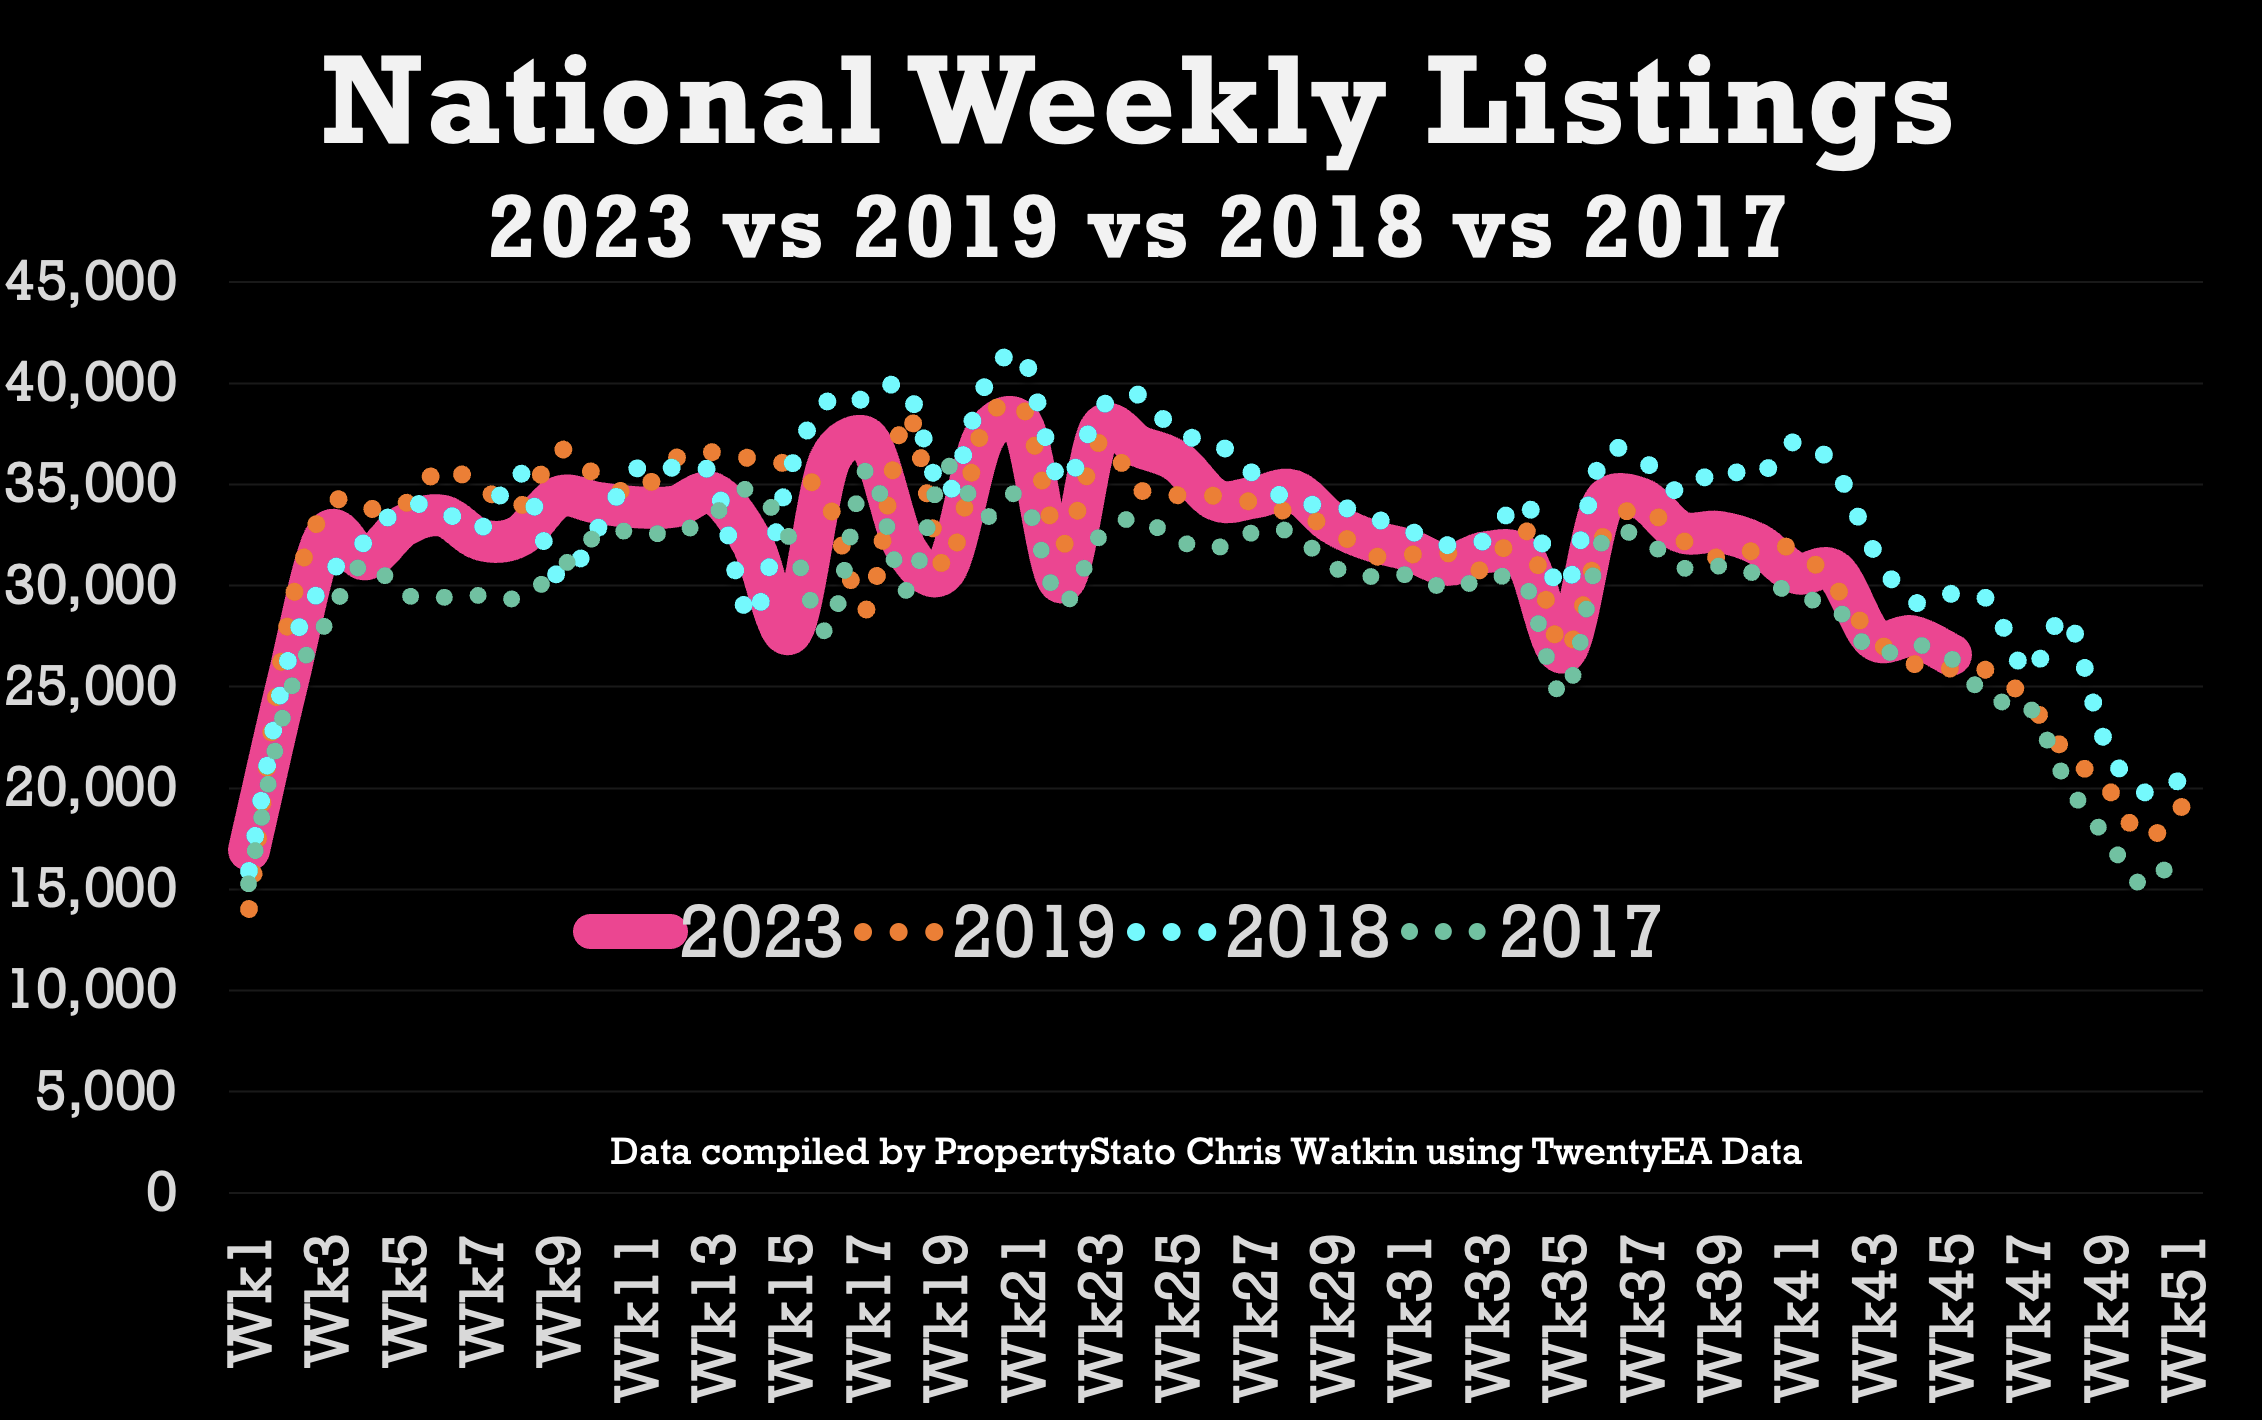
Listings YTD 2023 are 99.4% of the 2017/8/9 YTD average (last week 99.4%)
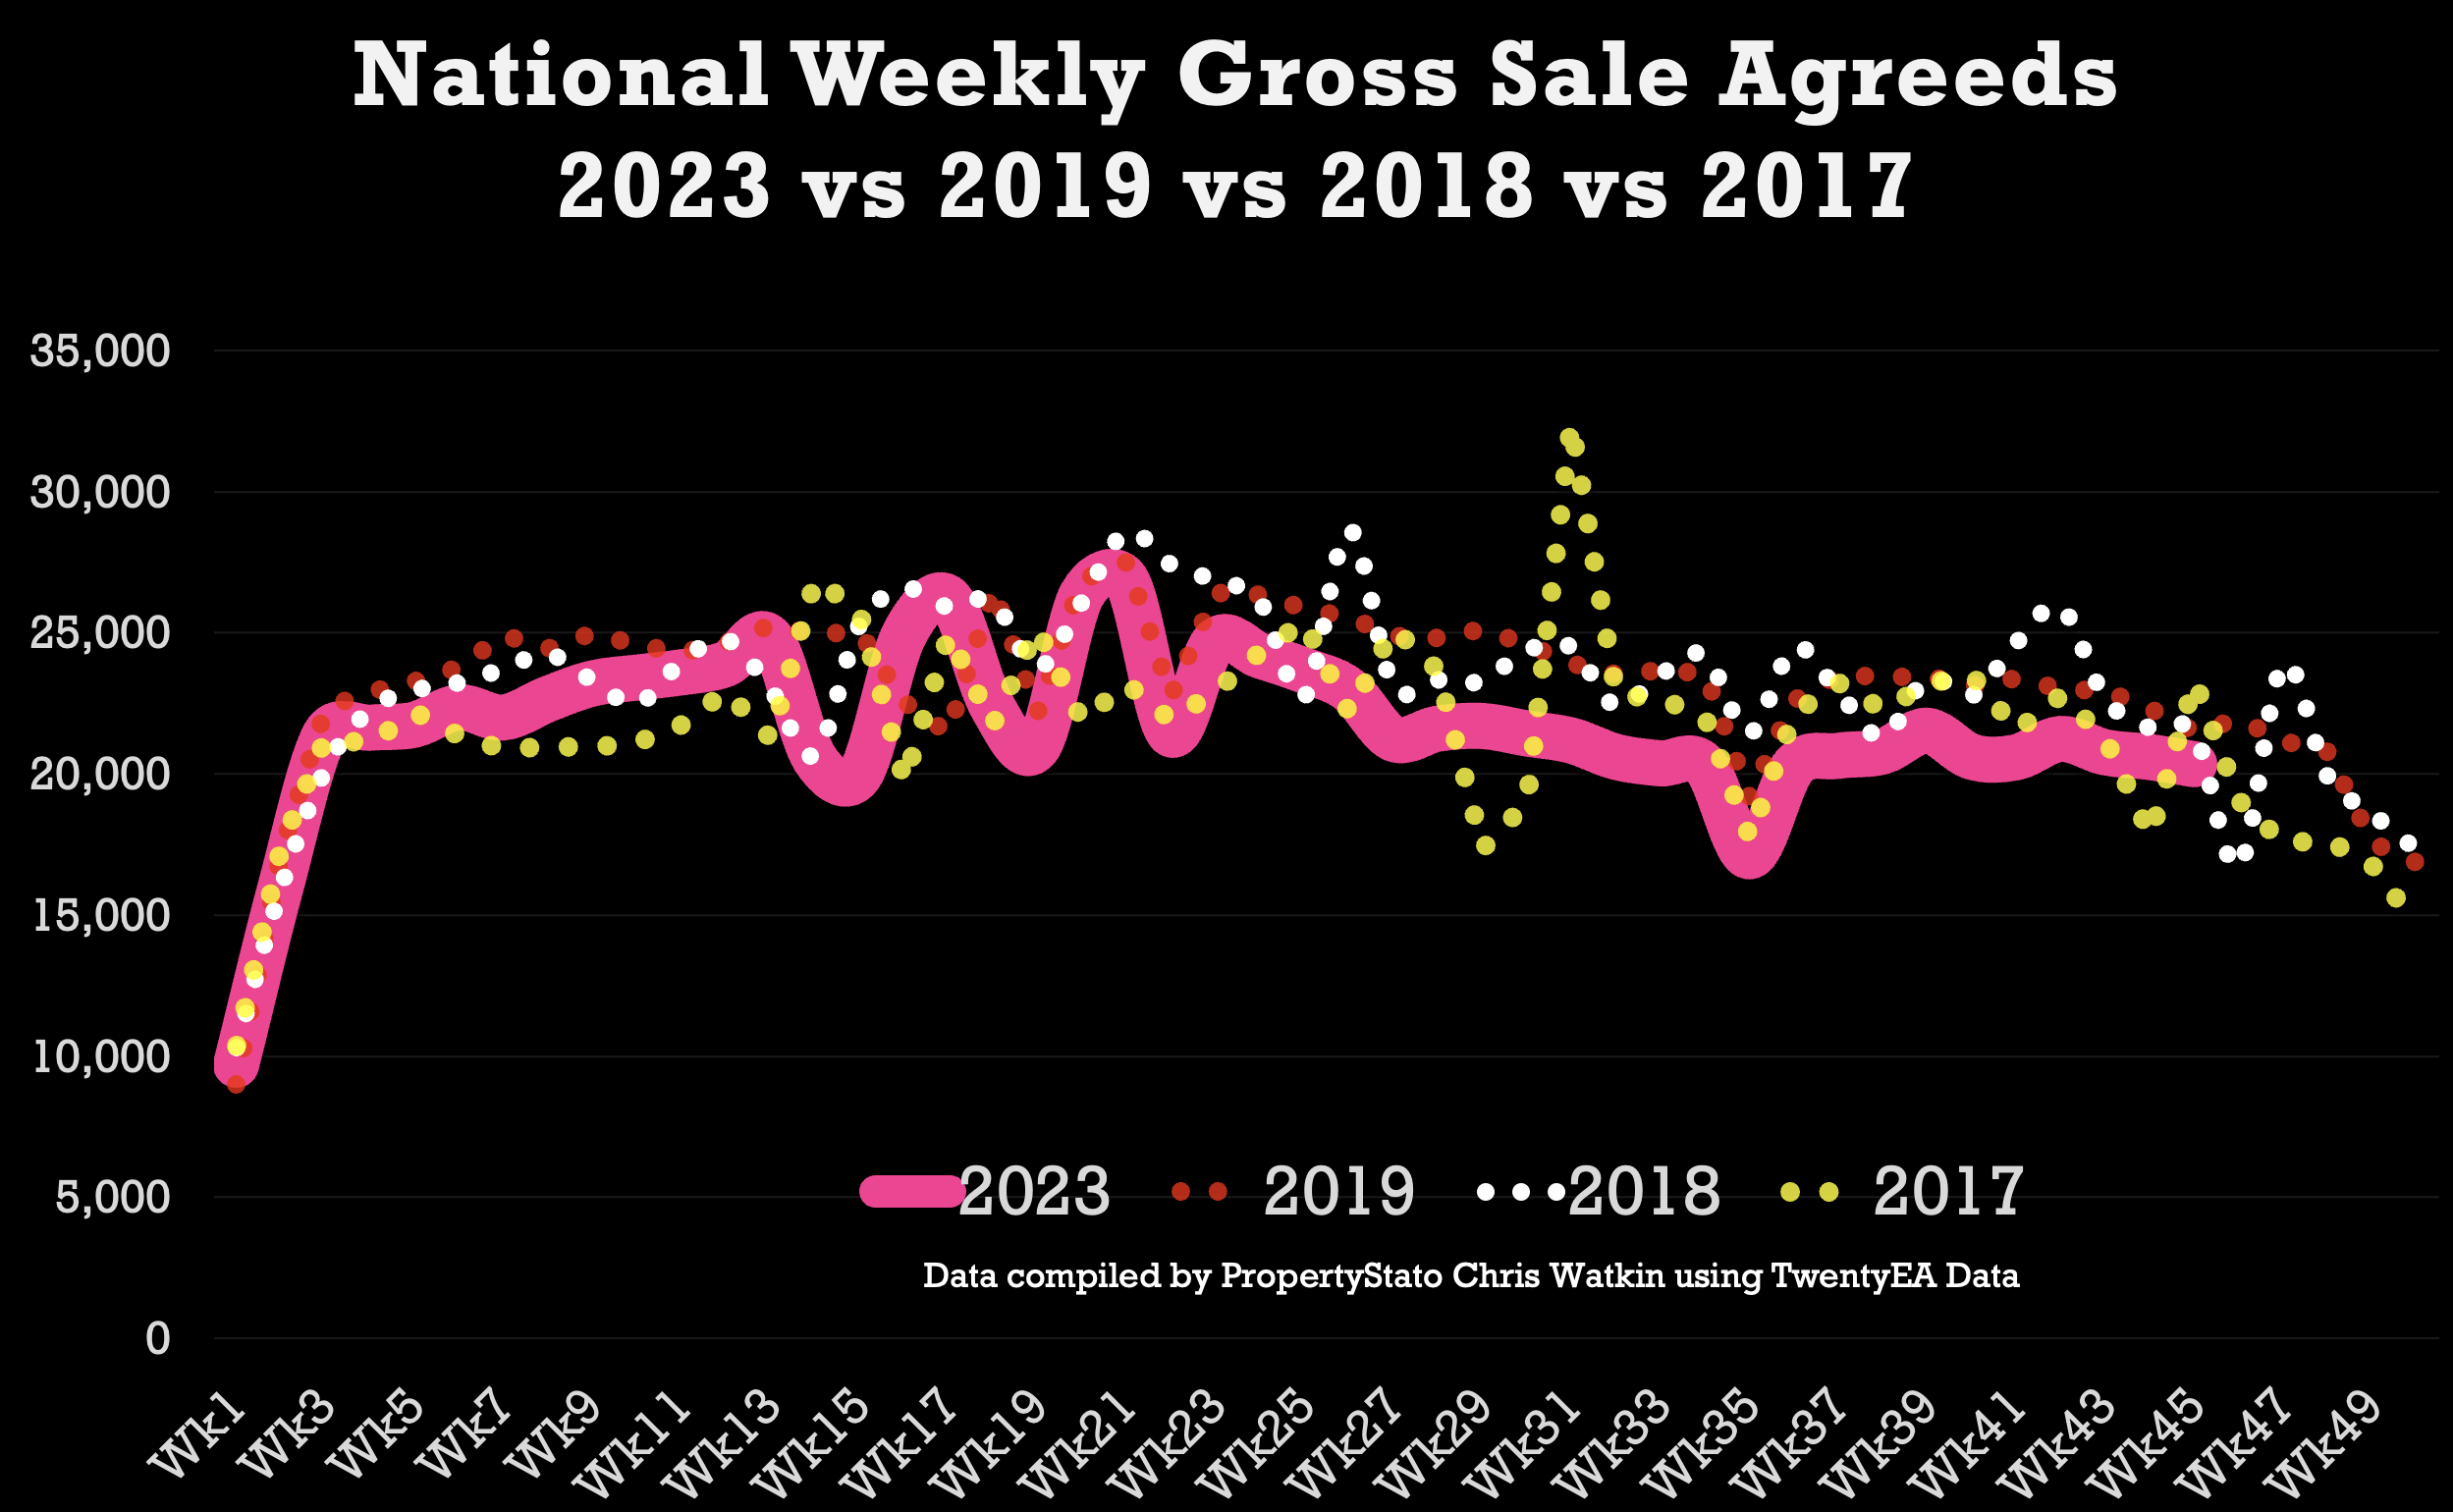
Gross Sales YTD 2023 are 94.1% of the 2017/8/9 YTD average (last week 94.1%)
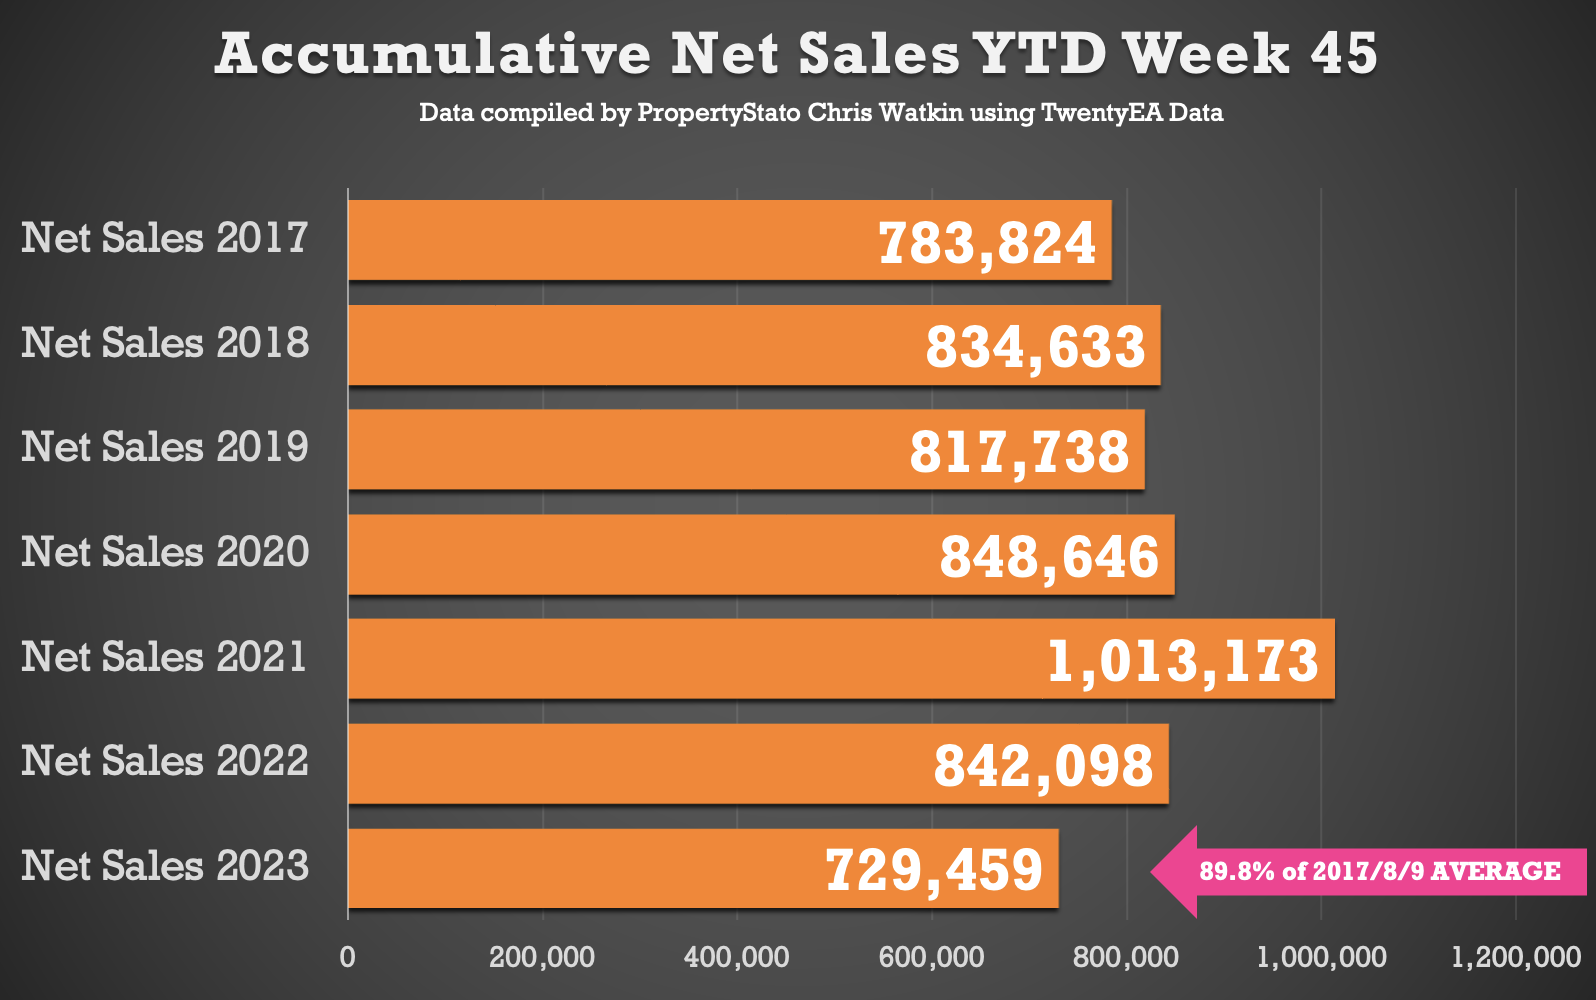
Net Sales YTD 2023 are 89.8% of the 2017/8/9 YTD average (last week 89.8%)
Looking at key statistics in more detail.
- New Properties to the Market (Listings): The number of listings last week was 26,596 (Average for the last four weeks 28,042). The 2023 YTD running weekly average stands strong at 32,219. Graph 1
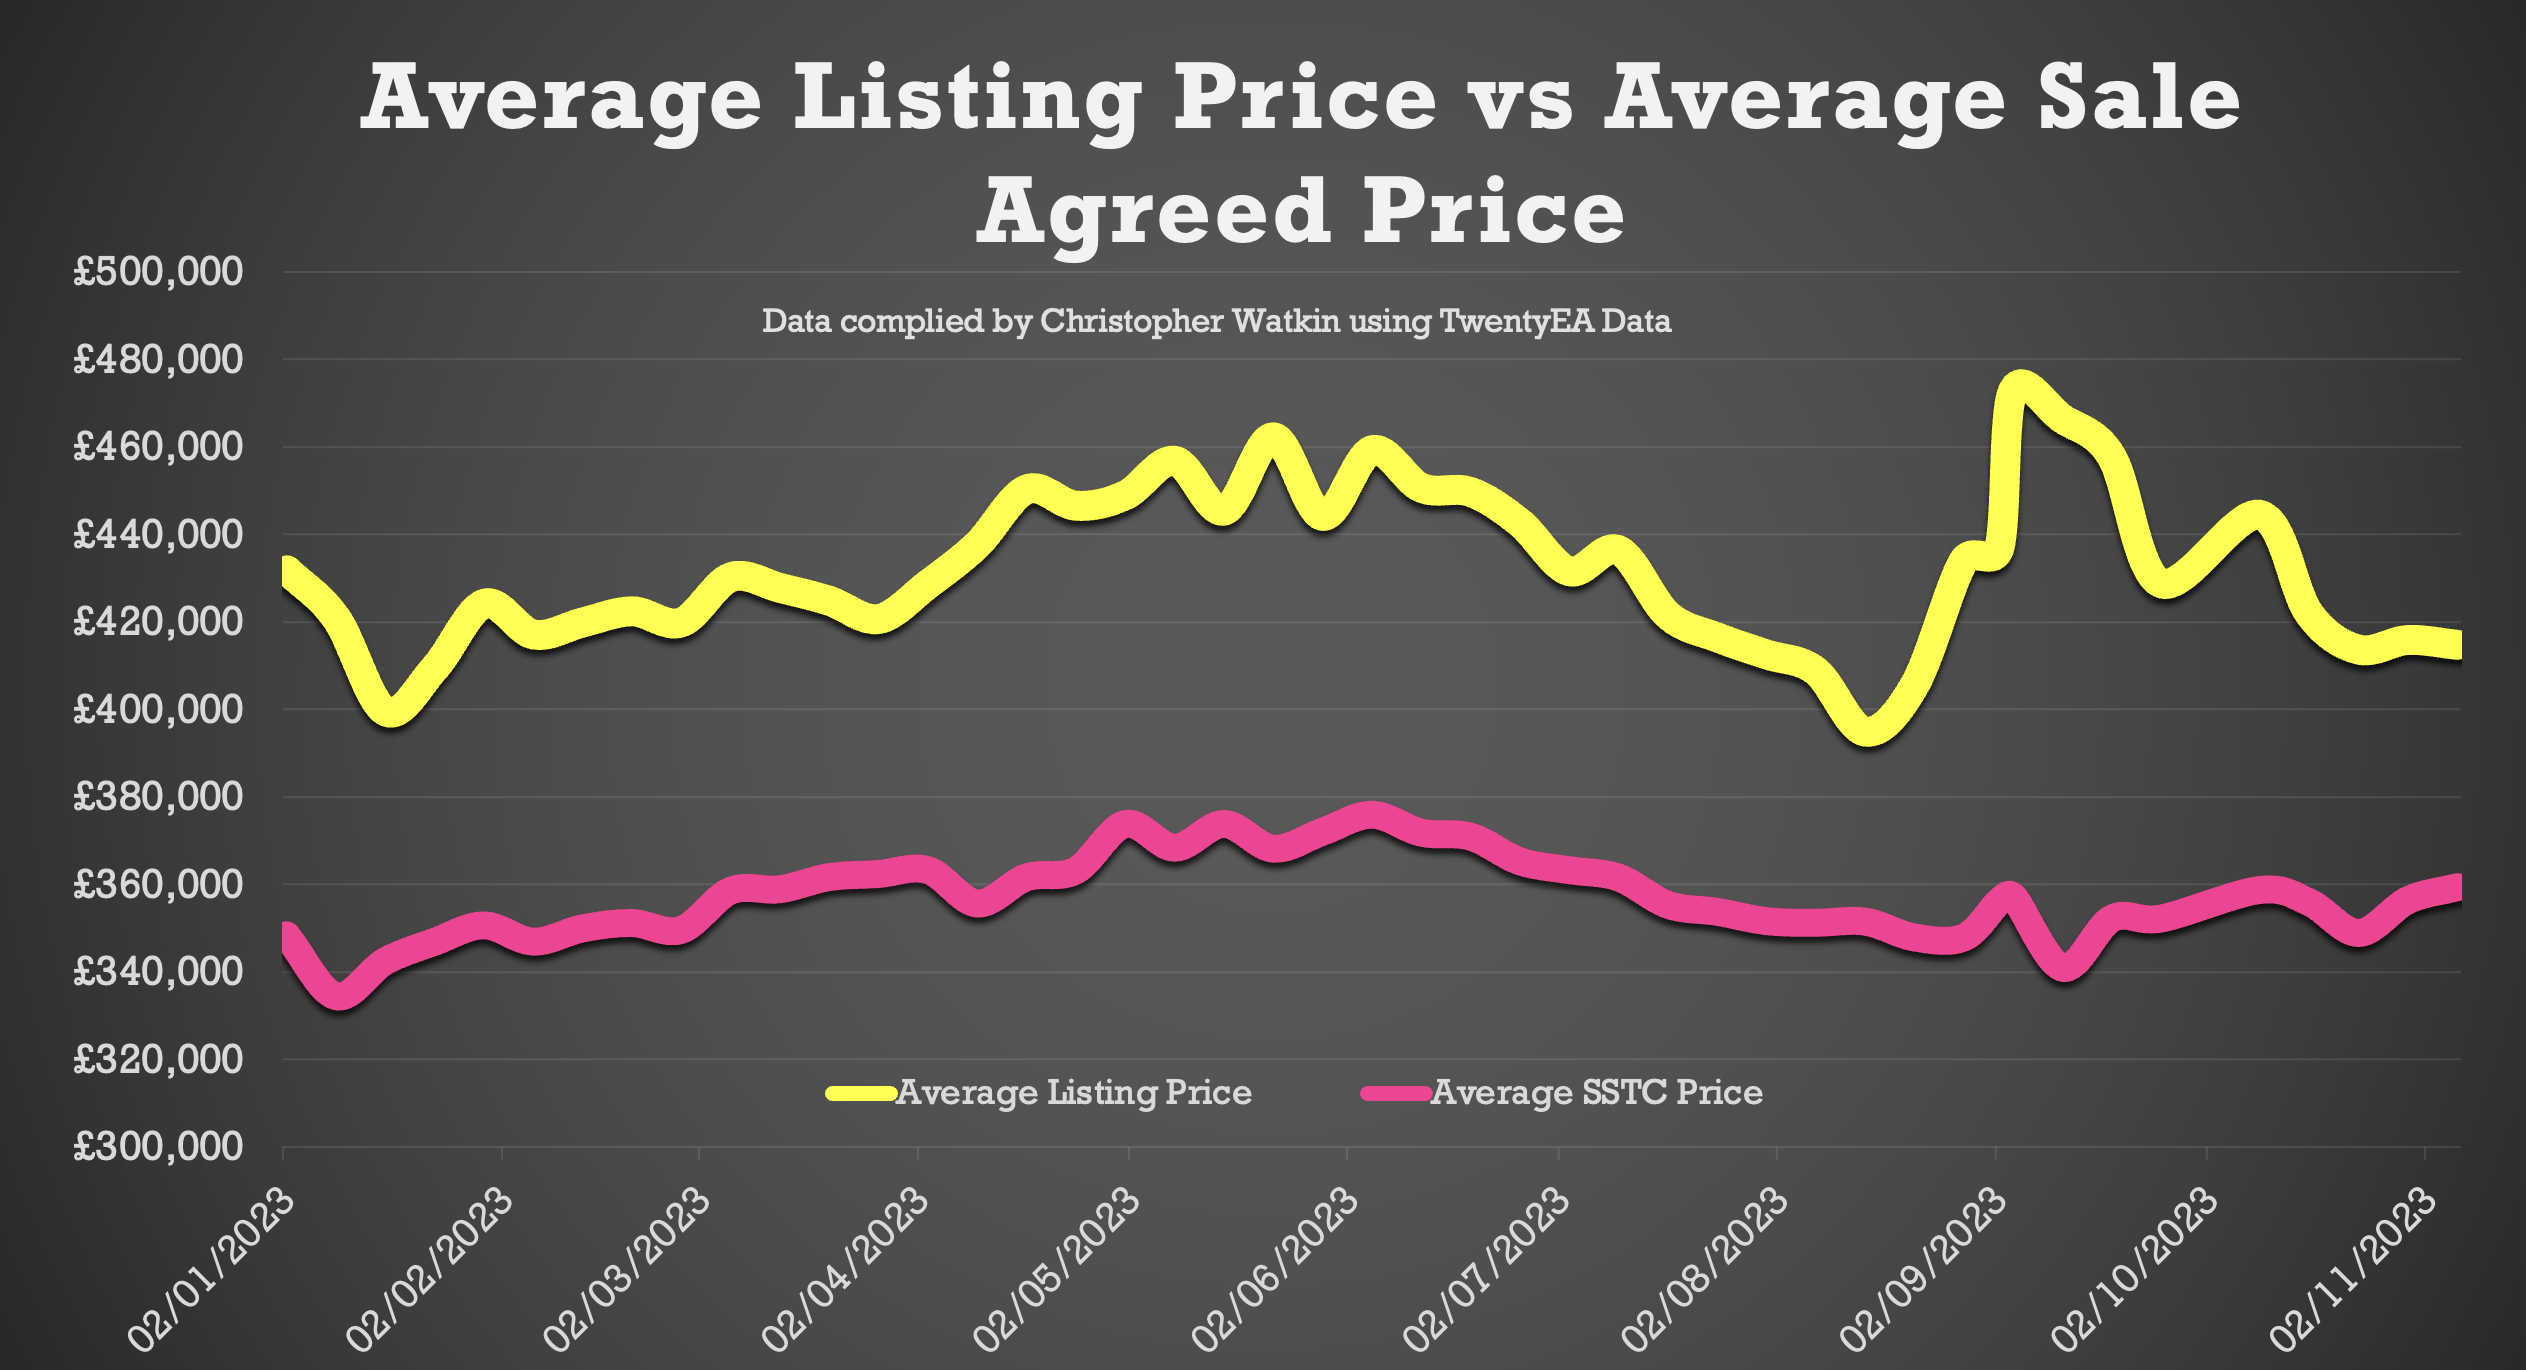
- Average Listing Price: The average listing price has remained stable in the last few weeks. Average Listing price this week £414,787. The 2023 running weekly average is £431,731.
- % Difference between Listing and Sale Agreed Prices: This week this has dropped to 15% (good news), which means it continues to be below the important 20% barrier and better for the property market. 2023 YTD average is 20.89% and long term seven-year average 17%.
- Price Reductions: 19,031 price reductions were seen last week, which is a slight drop from the last few weeks. The 2023 running weekly average is 20,353 per week. This means approximately 14.1% of resi stock is being reduced per month (just under one in seven).
- Average Asking Price of Properties Being Reduced: This week’s average asking price of reduced properties is £397,299 (similar to last week). The 2023 running weekly average is £403,150.
- Number of Properties Sold (Gross Sales): Gross sales are similar to last week. Total number of gross sales in the UK last week was 20,350. For comparison, the 2023 running weekly average is 21,659 weekly sales (STC).
- Average Asking Price of Properties Sold STC this Week: The average asking price of the properties selling last week was £359,465 (very similar for the last few weeks). The 2023 running weekly average is £357,161. Graph 3
- Sale Fall Throughs (Units): There are 5,208 sale fall throughs, which is similar to last week’s at 5,334. The running four-week average for sale fall throughs is 5,474 and the YTD figure average is 5,449.
- Sale Fall Throughs (Percentage): This week it is 25.59%. This is a continuation of a drop that started in early August 2023 when it was in the early 30%’s. The 2023 running weekly average is 25.69%. Let us not forget, in the same week of 2022 (Week 44), it was 39.47%. The seven-year long-term average is 24.3%.
- Net Sales This Week: Net Sales increased to 15,142, excellent when compared to the running month average of 15,336. YTD running weekly average is 16,210. For comparison, there were 10,763 in net sales for the same week last year (week 45 in 2022).
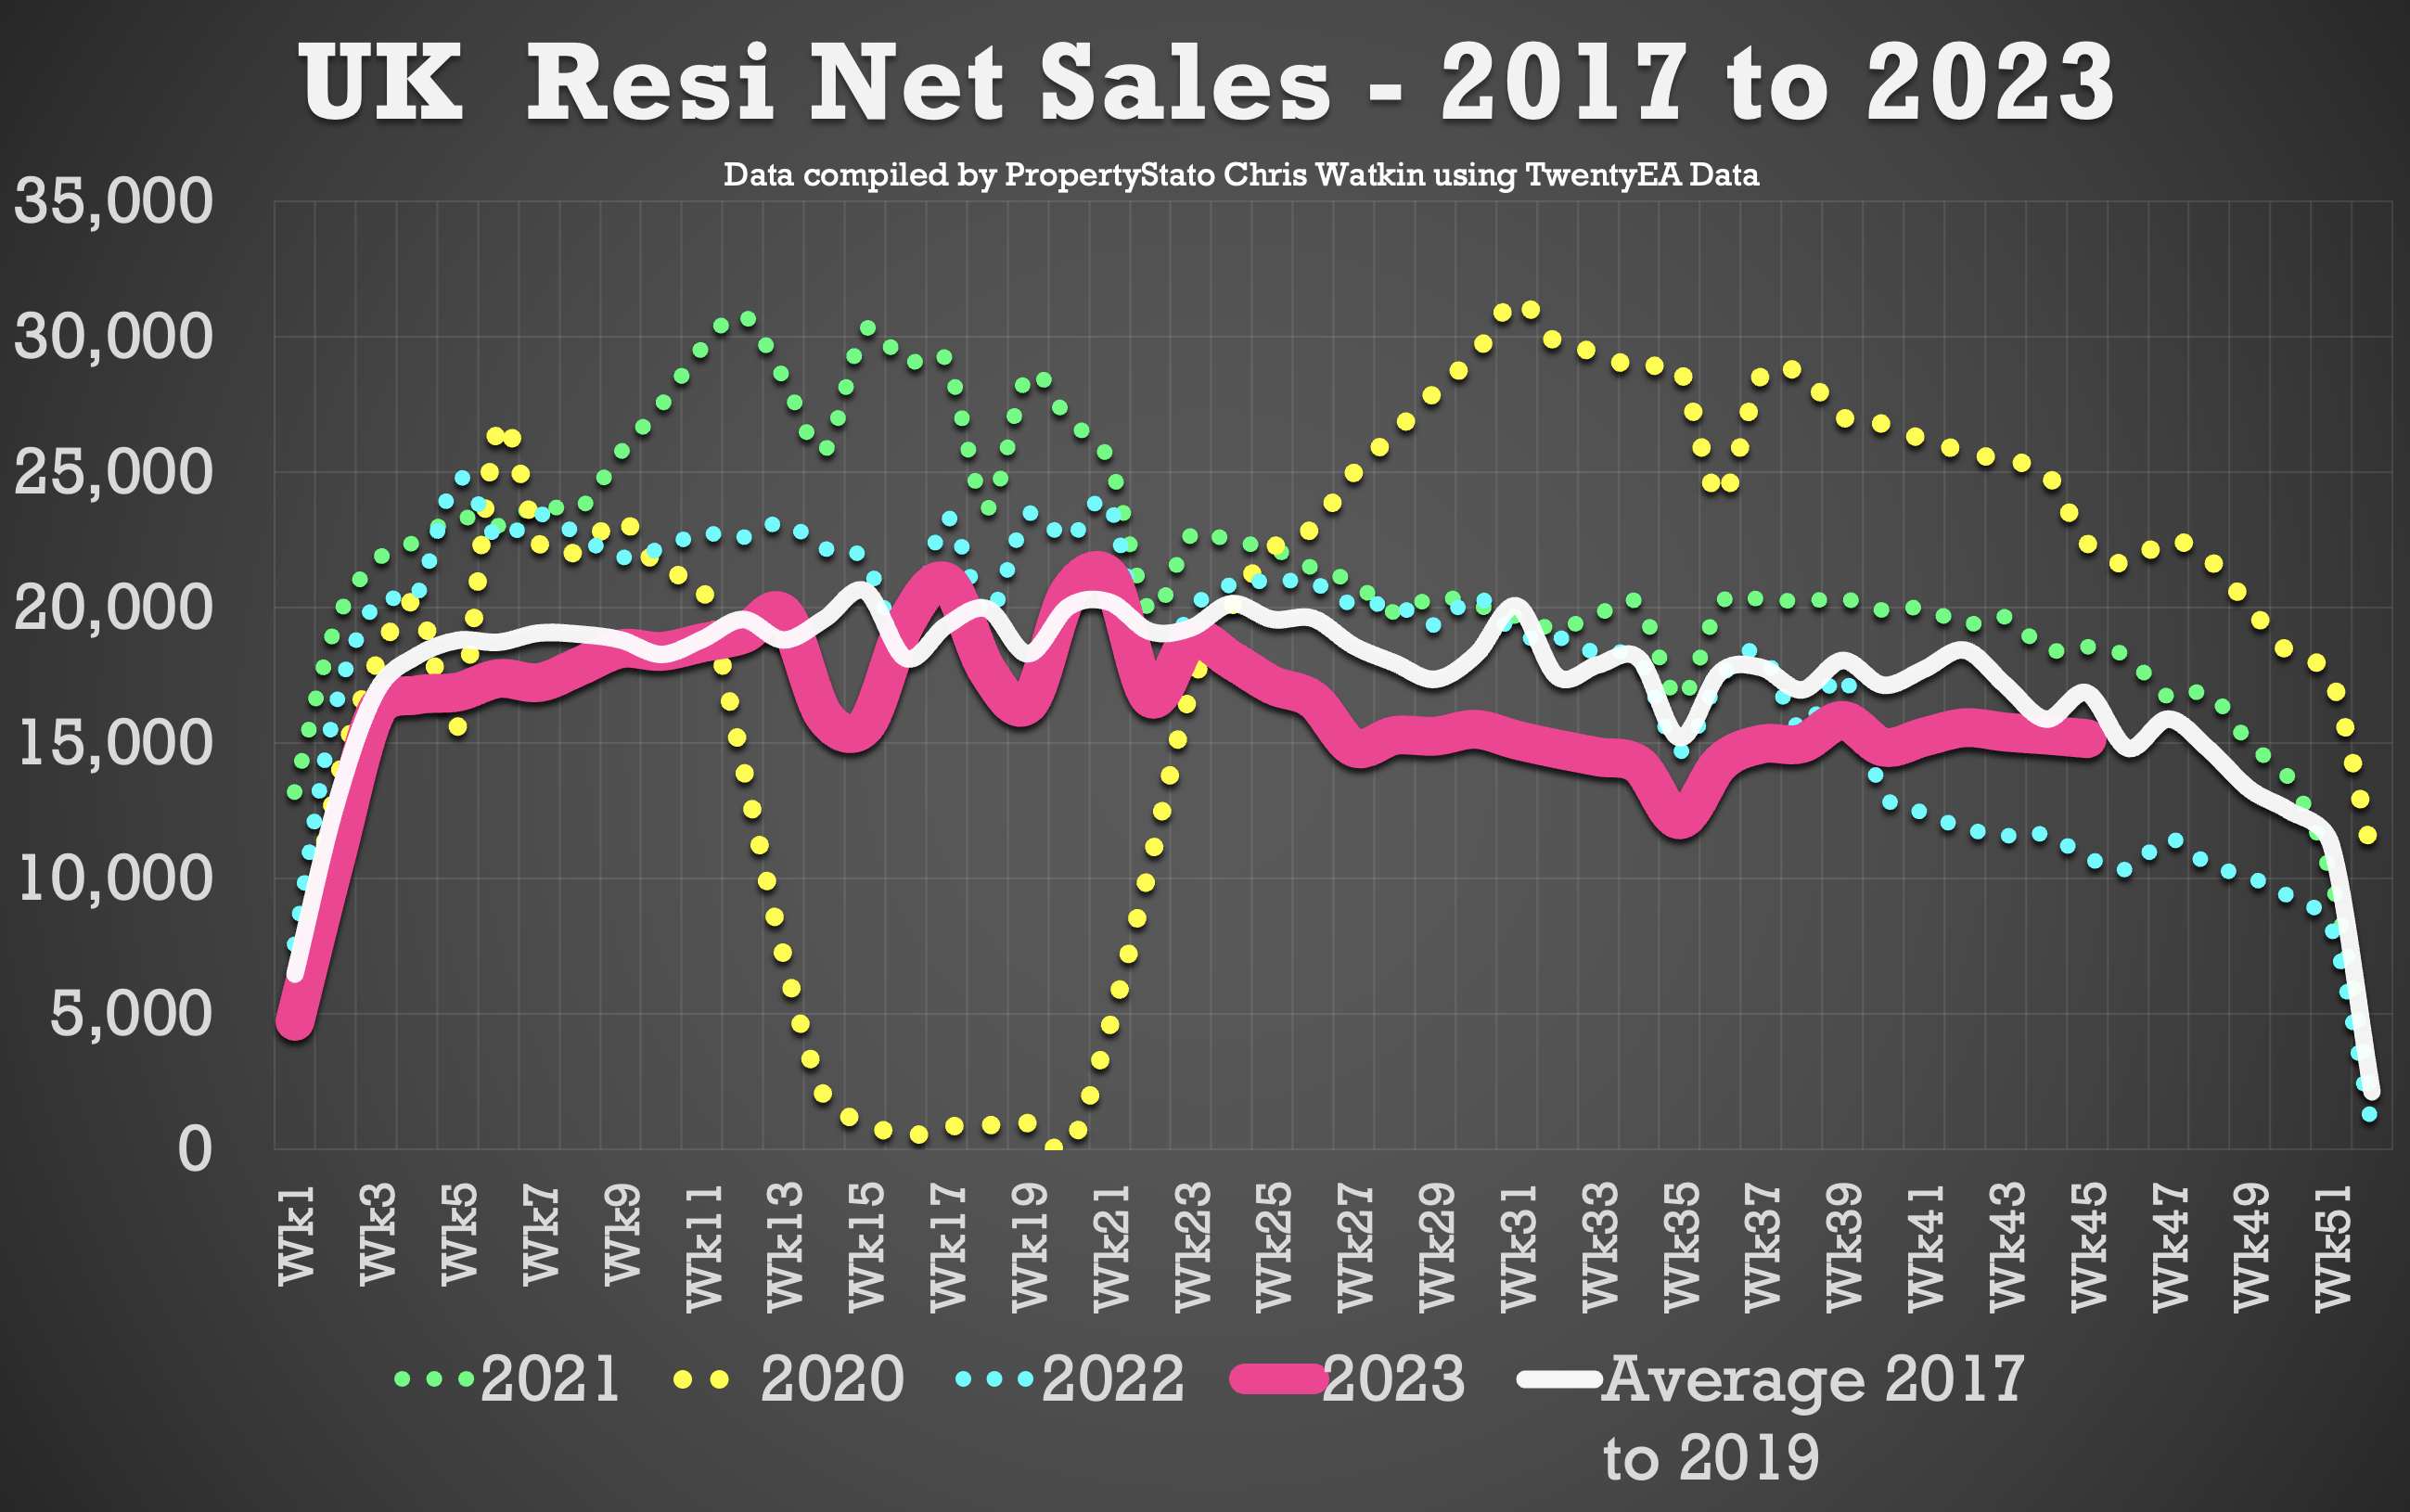
- Net Sales Year-to-Date: Despite the challenges, the year-to-date net sales of 729k showcase, despite the challenging economic news, the market is 10.1% behind the 2017/8/9 average YTD for net sales. Graph 5
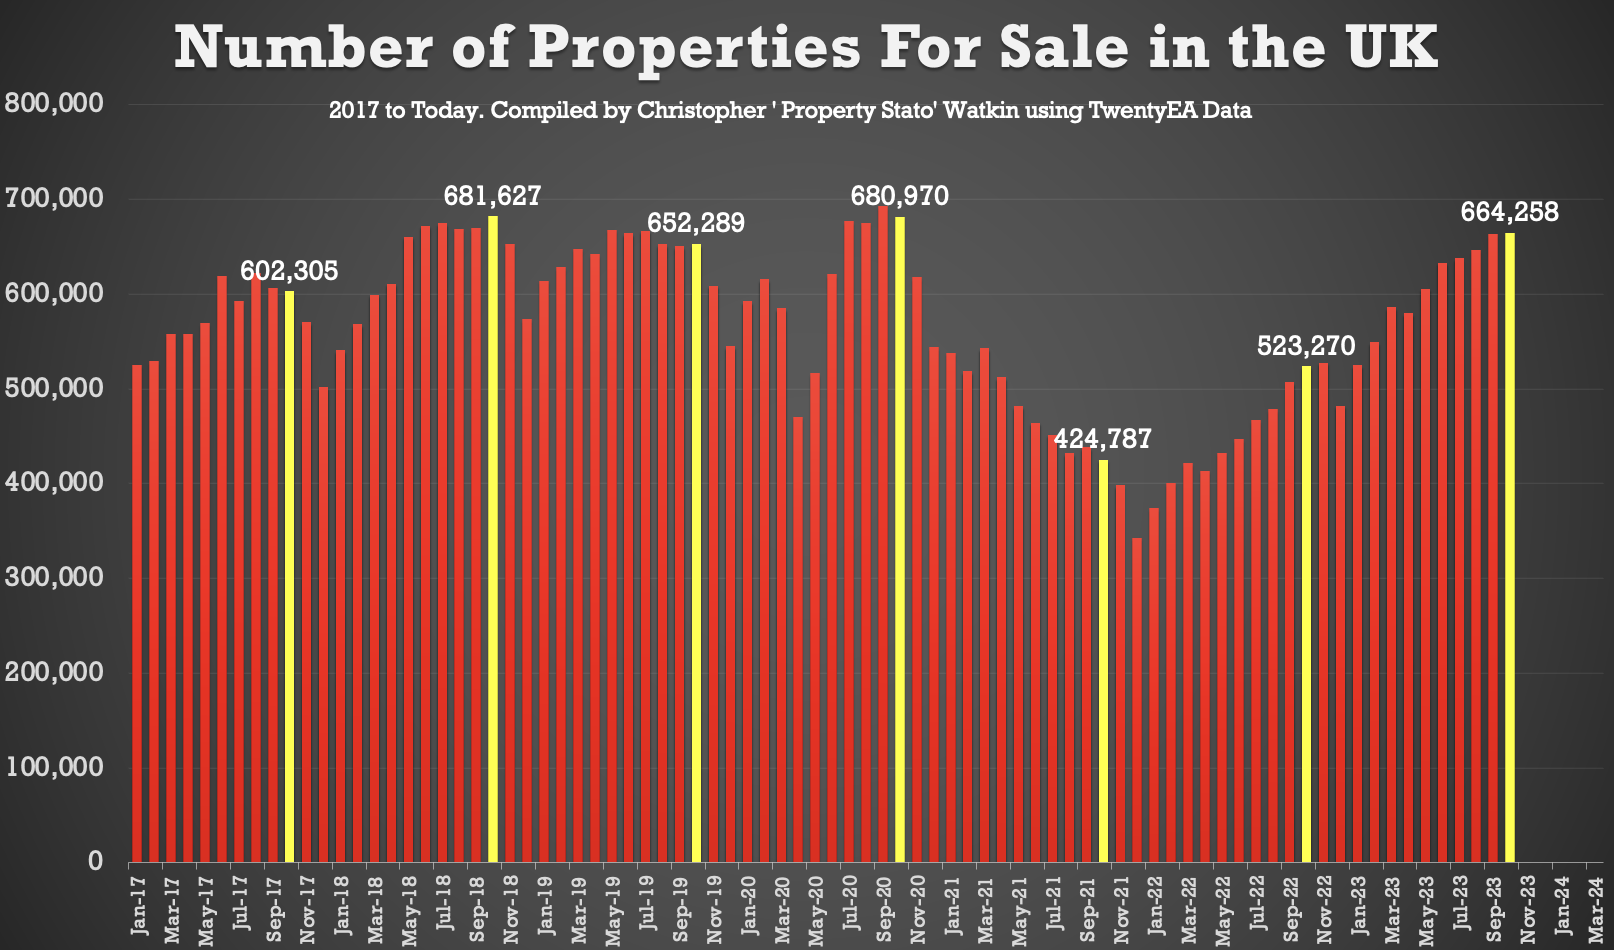
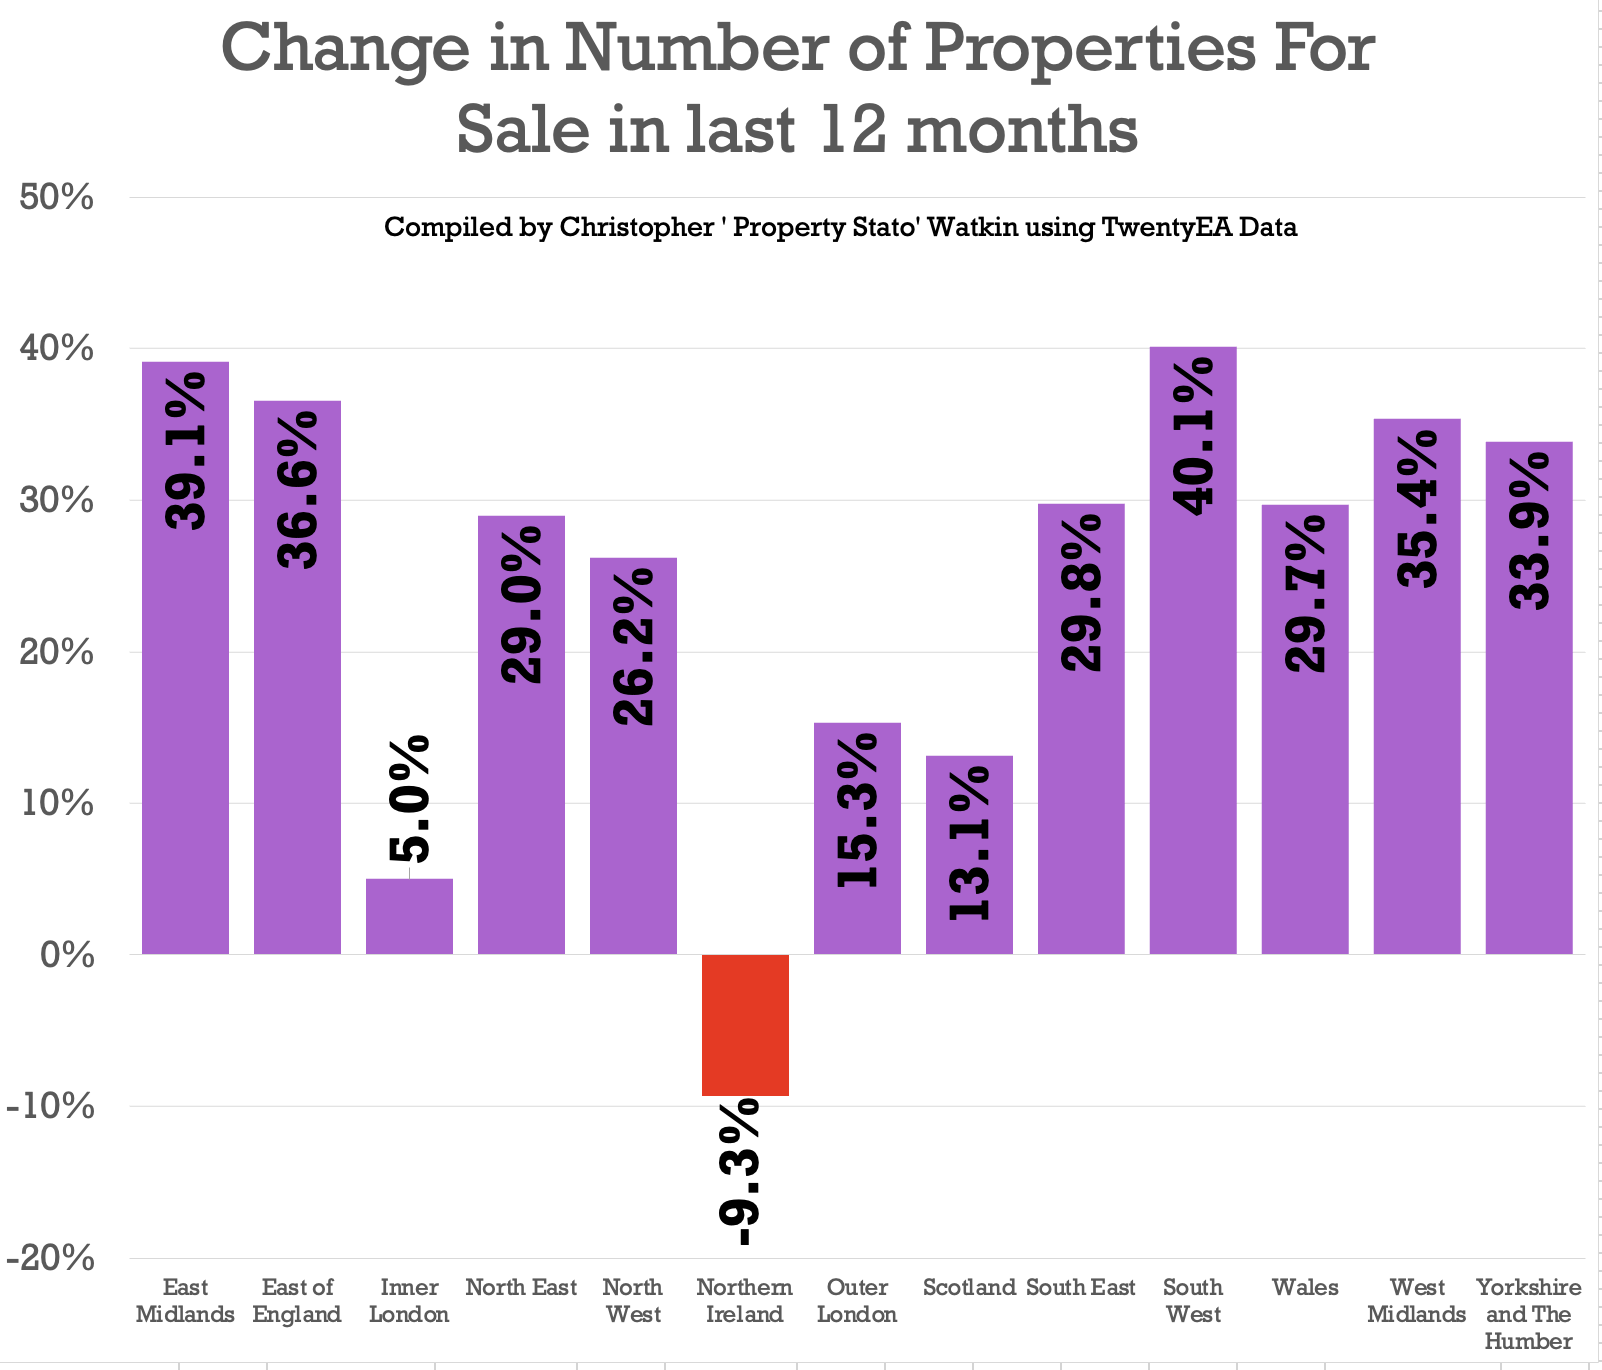
- Number of Properties For Sale: There are 664,258 properties for sale, compared to 523,270 a year ago. Noticeable growth in number of properties for sale include the South West with growth of 40.1%, East Midlands at +39.1% and the East of England at +36.6%, yet in London, only 5% growth and Northern Ireland -9.3%.
In the last 20 minutes of the show, there is the usual local focus, and this week it is on Loughborough Estate & Letting Agents.


Comments (4)
Growth in Available Rental Stock between Sept 23 and Oct 23
National Average 10.13%
Regional breakdown
Inner London -4.18%
Outer London -0.48%
South East +10.31%
East of England +2.26%
South West +21.92%
East Midlands +27.44%
West Midlands +19.41%
North West +18.99%
North East +40.07%
Yorkshire and The Humber +33.70%
Northern Ireland -2.11%
Wales +36.43%
Scotland +0.56%
Net Sales as % listing
National – This week – 56.9% compared to 2023 YTD average of 50.1%
Regional Breakdown …
INNER LONDON – This week – 38.5% compared to 2023 YTD average of 33.9%
OUTER LONDON – This week – 50.2% compared to 2023 YTD average of 42.4%
SOUTH EAST – This week – 55.7% compared to 2023 YTD average of 46.2%
SOUTH WEST – This week – 52.2% compared to 2023 YTD average of 49.7%
EAST OF ENGLAND – This week – 54.7% compared to 2023 YTD average of 44.8%
EAST MIDLANDS – This week – 54.7% compared to 2023 YTD average of 48.3%
WEST MIDLANDS – This week – 60.7% compared to 2023 YTD average of 51.8%
YORKSHIRE & HUMBER – This week – 58.8% compared to 2023 YTD average of 55.6%
NORTH EAST – This week – 57.0% compared to 2023 YTD average of 55.3%
NORTH WEST – This week – 60.2% compared to 2023 YTD average of 53.1%
WALES – This week – 60.7% compared to 2023 YTD average of 51.8%
SCOTLAND – This week – 84.2% compared to 2023 YTD average of 76.4%
% Sales that fell thru
National – This week – 25.6% compared to 2023 YTD average of 25.7%
Regional Breakdown
INNER LONDON – This week – 26.8% compared to 2023 YTD average of 27.3%
OUTER LONDON – This week – 28.8% compared to 2023 YTD average of 29.4%
SOUTH EAST – This week – 27.6% compared to 2023 YTD average of 28.1%
SOUTH WEST – This week – 26.9% compared to 2023 YTD average of 27.4%
EAST OF ENGLAND – This week – 25.2% compared to 2023 YTD average of 27.9%
EAST MIDLANDS – This week – 25.7% compared to 2023 YTD average of 25.5%
WEST MIDLANDS – This week – 24.4% compared to 2023 YTD average of 26.5%
YORKSHIRE & HUMBER – This week – 23.9% compared to 2023 YTD average of 23.7%
NORTH EAST – This week – 26.3% compared to 2023 YTD average of 23.6%
NORTH WEST – This week – 28.4% compared to 2023 YTD average of 27.6%
WALES – This week – 28.3% compared to 2023 YTD average of 26.9%
SCOTLAND – This week – 14.0% compared to 2023 YTD average of 13.3%
Gross Sales as % of Listings
National – This week – 76.5% compared to 2023 YTD average of 67.2%
Regional Breakdown ..
INNER LONDON – This week – 52.6% compared to 2023 YTD average of 46.3%
OUTER LONDON – This week – 70.6% compared to 2023 YTD average of 59.8%
SOUTH EAST – This week – 77.0% compared to 2023 YTD average of 64.0%
SOUTH WEST – This week – 71.5% compared to 2023 YTD average of 68.1%
EAST OF ENGLAND – This week – 73.1% compared to 2023 YTD average of 61.9%
EAST MIDLANDS – This week – 73.6% compared to 2023 YTD average of 64.3%
WEST MIDLANDS – This week – 80.2% compared to 2023 YTD average of 70.3%
YORKSHIRE & HUMBER – This week – 77.3% compared to 2023 YTD average of 72.7%
NORTH EAST – This week – 77.3% compared to 2023 YTD average of 72.3%
NORTH WEST – This week – 84.1% compared to 2023 YTD average of 73.2%
WALES – This week – 88.5% compared to 2023 YTD average of 73.9%
SCOTLAND – This week – 97.9% compared to 2023 YTD average of 88.1%