
 Welcome to the 22nd UK Property Market Stats Show of 2025, your go to weekly ‘TV show’ on the UK Property Market.
This week, I’m joined by Rob Smith, boss man of Hunters, Whitegates & Northwoods, as we delve into the key property market headlines for the week ending on 8th June 2025.
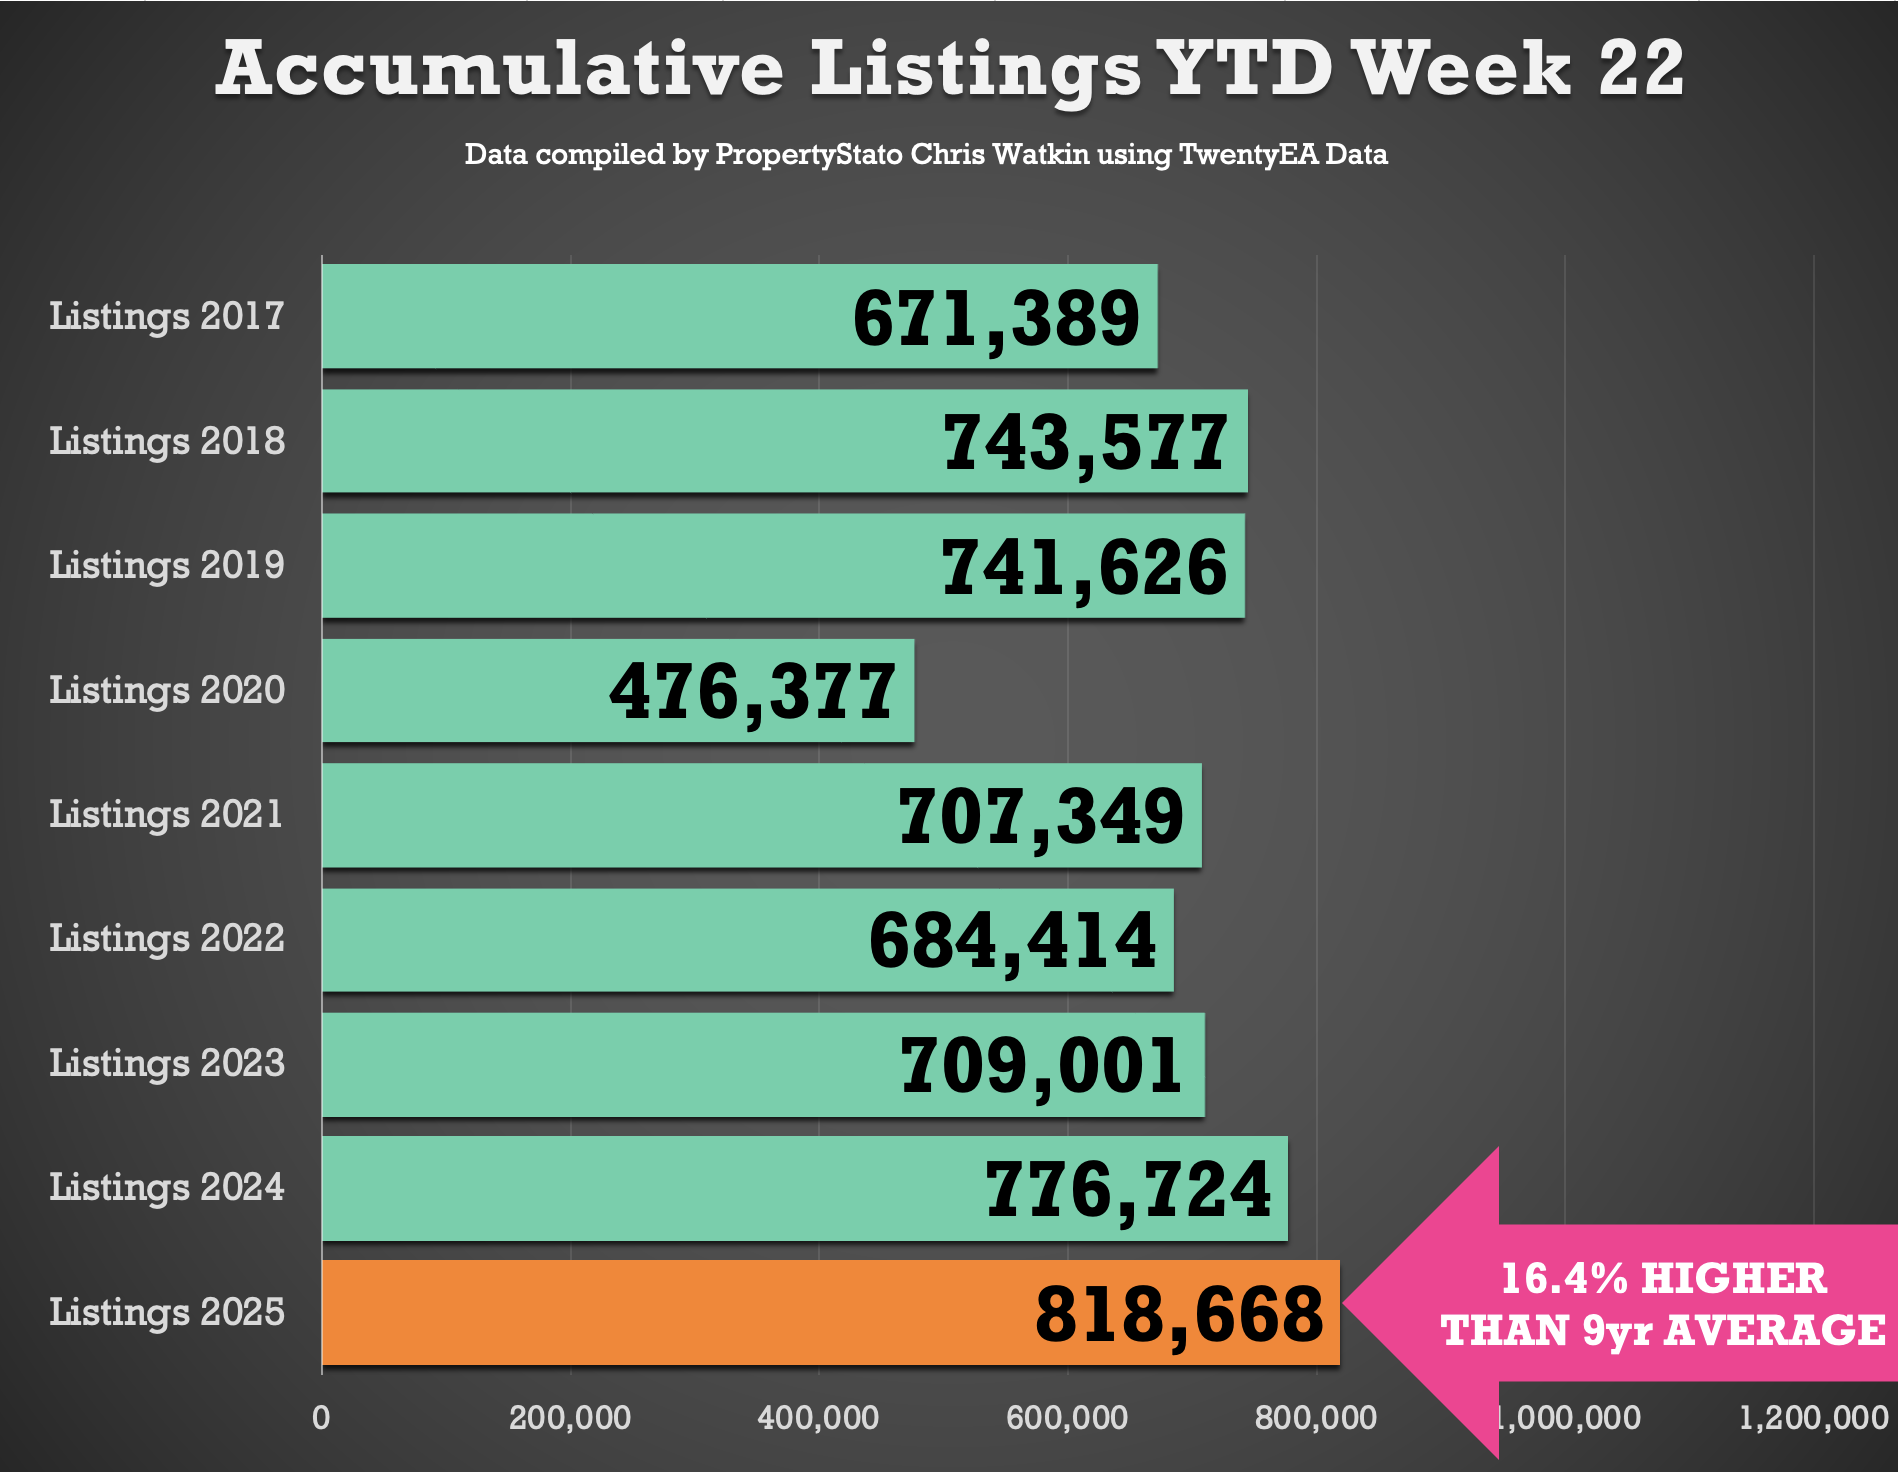
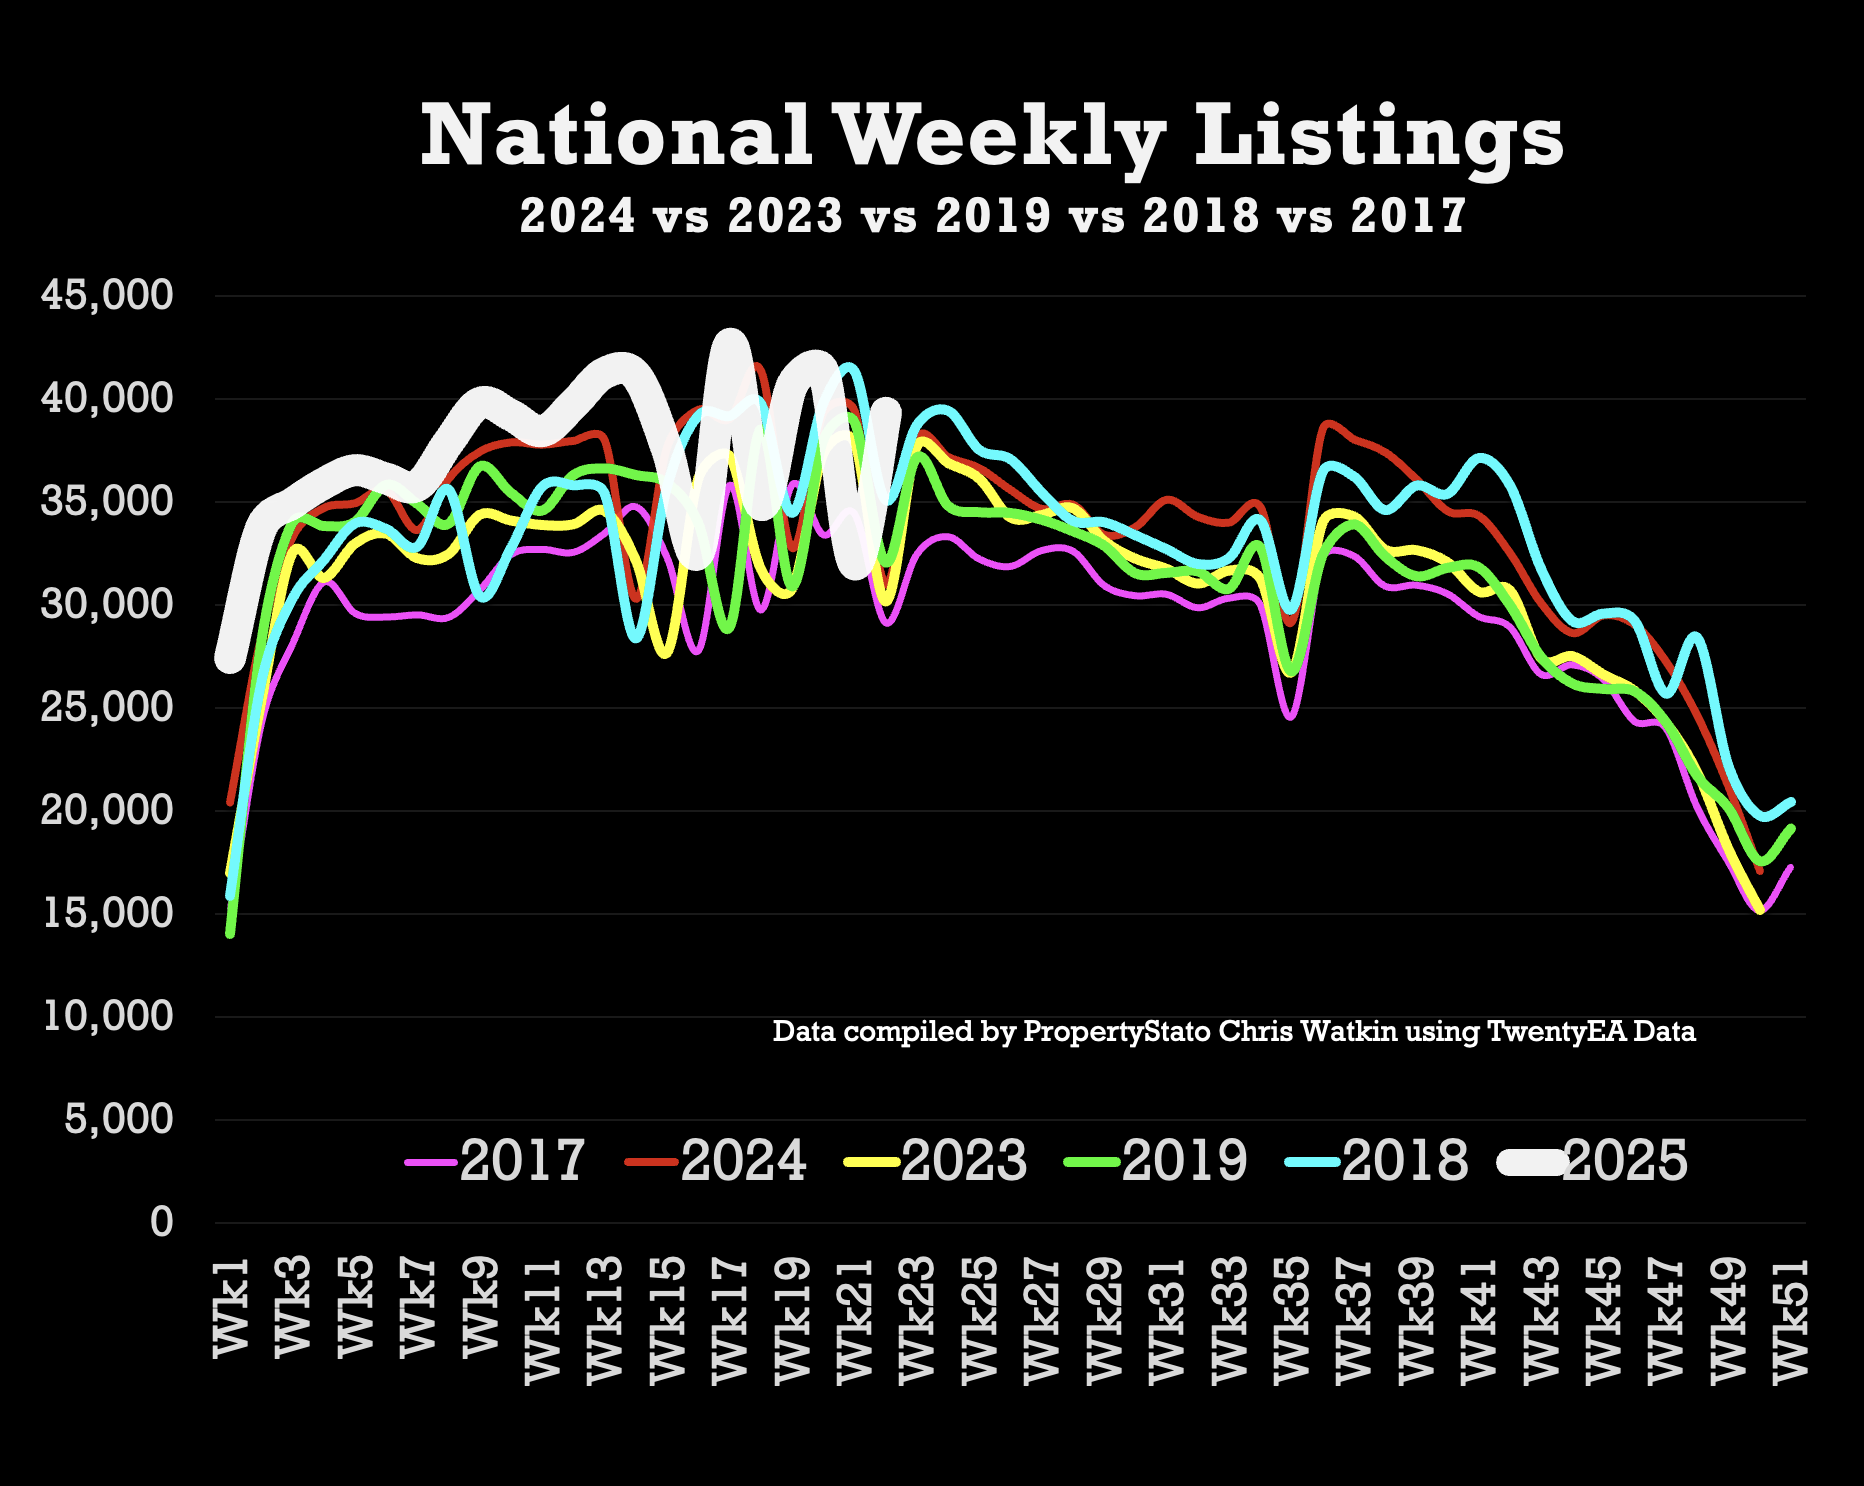
✅ Listings (New Properties on the Market)
39.3k new listings this week (last week 31.9k – which was a Bank Holiday)
YTD 6% higher than Week 22 of 2024 YTD and 8% higher YTD compared to 2017/18/19.
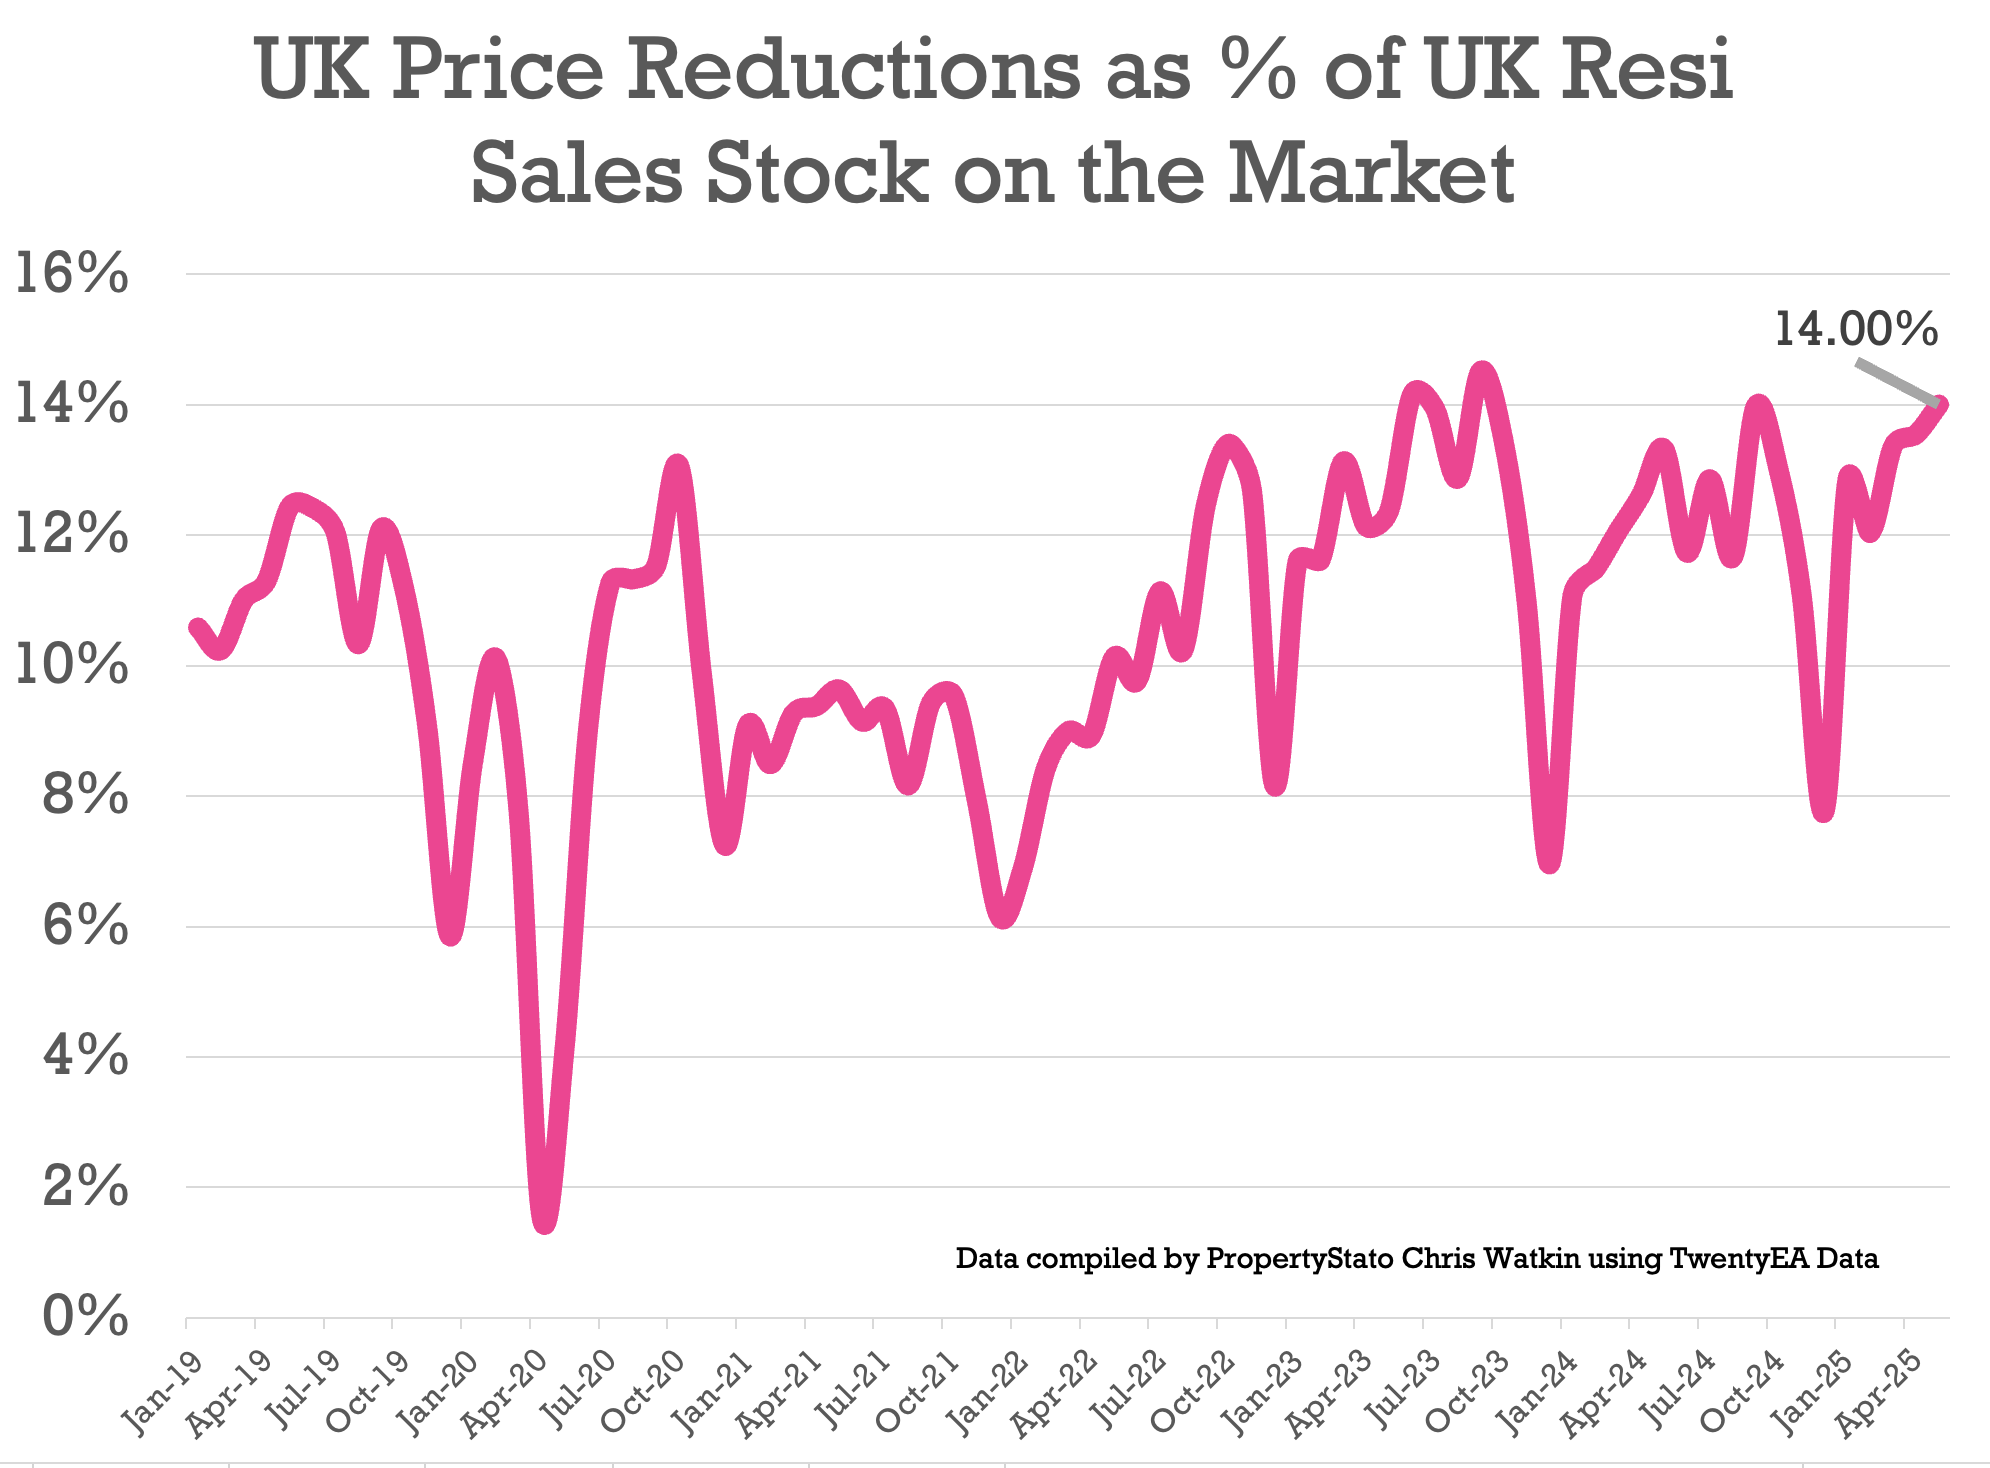
✅ Price Reductions (% of Resi Stock)
27.9k Price Reductions this week (last week 21.9k – again Bank Holiday the week before)
Monthly Run Rate in reductions – 1 in 7.1 of Resi Sales stock per month is being reduced (which represents 14%) …13.4% the month before
For comparison, 12.1% average in 2024, though the long-term 5-year average is 10.6%.
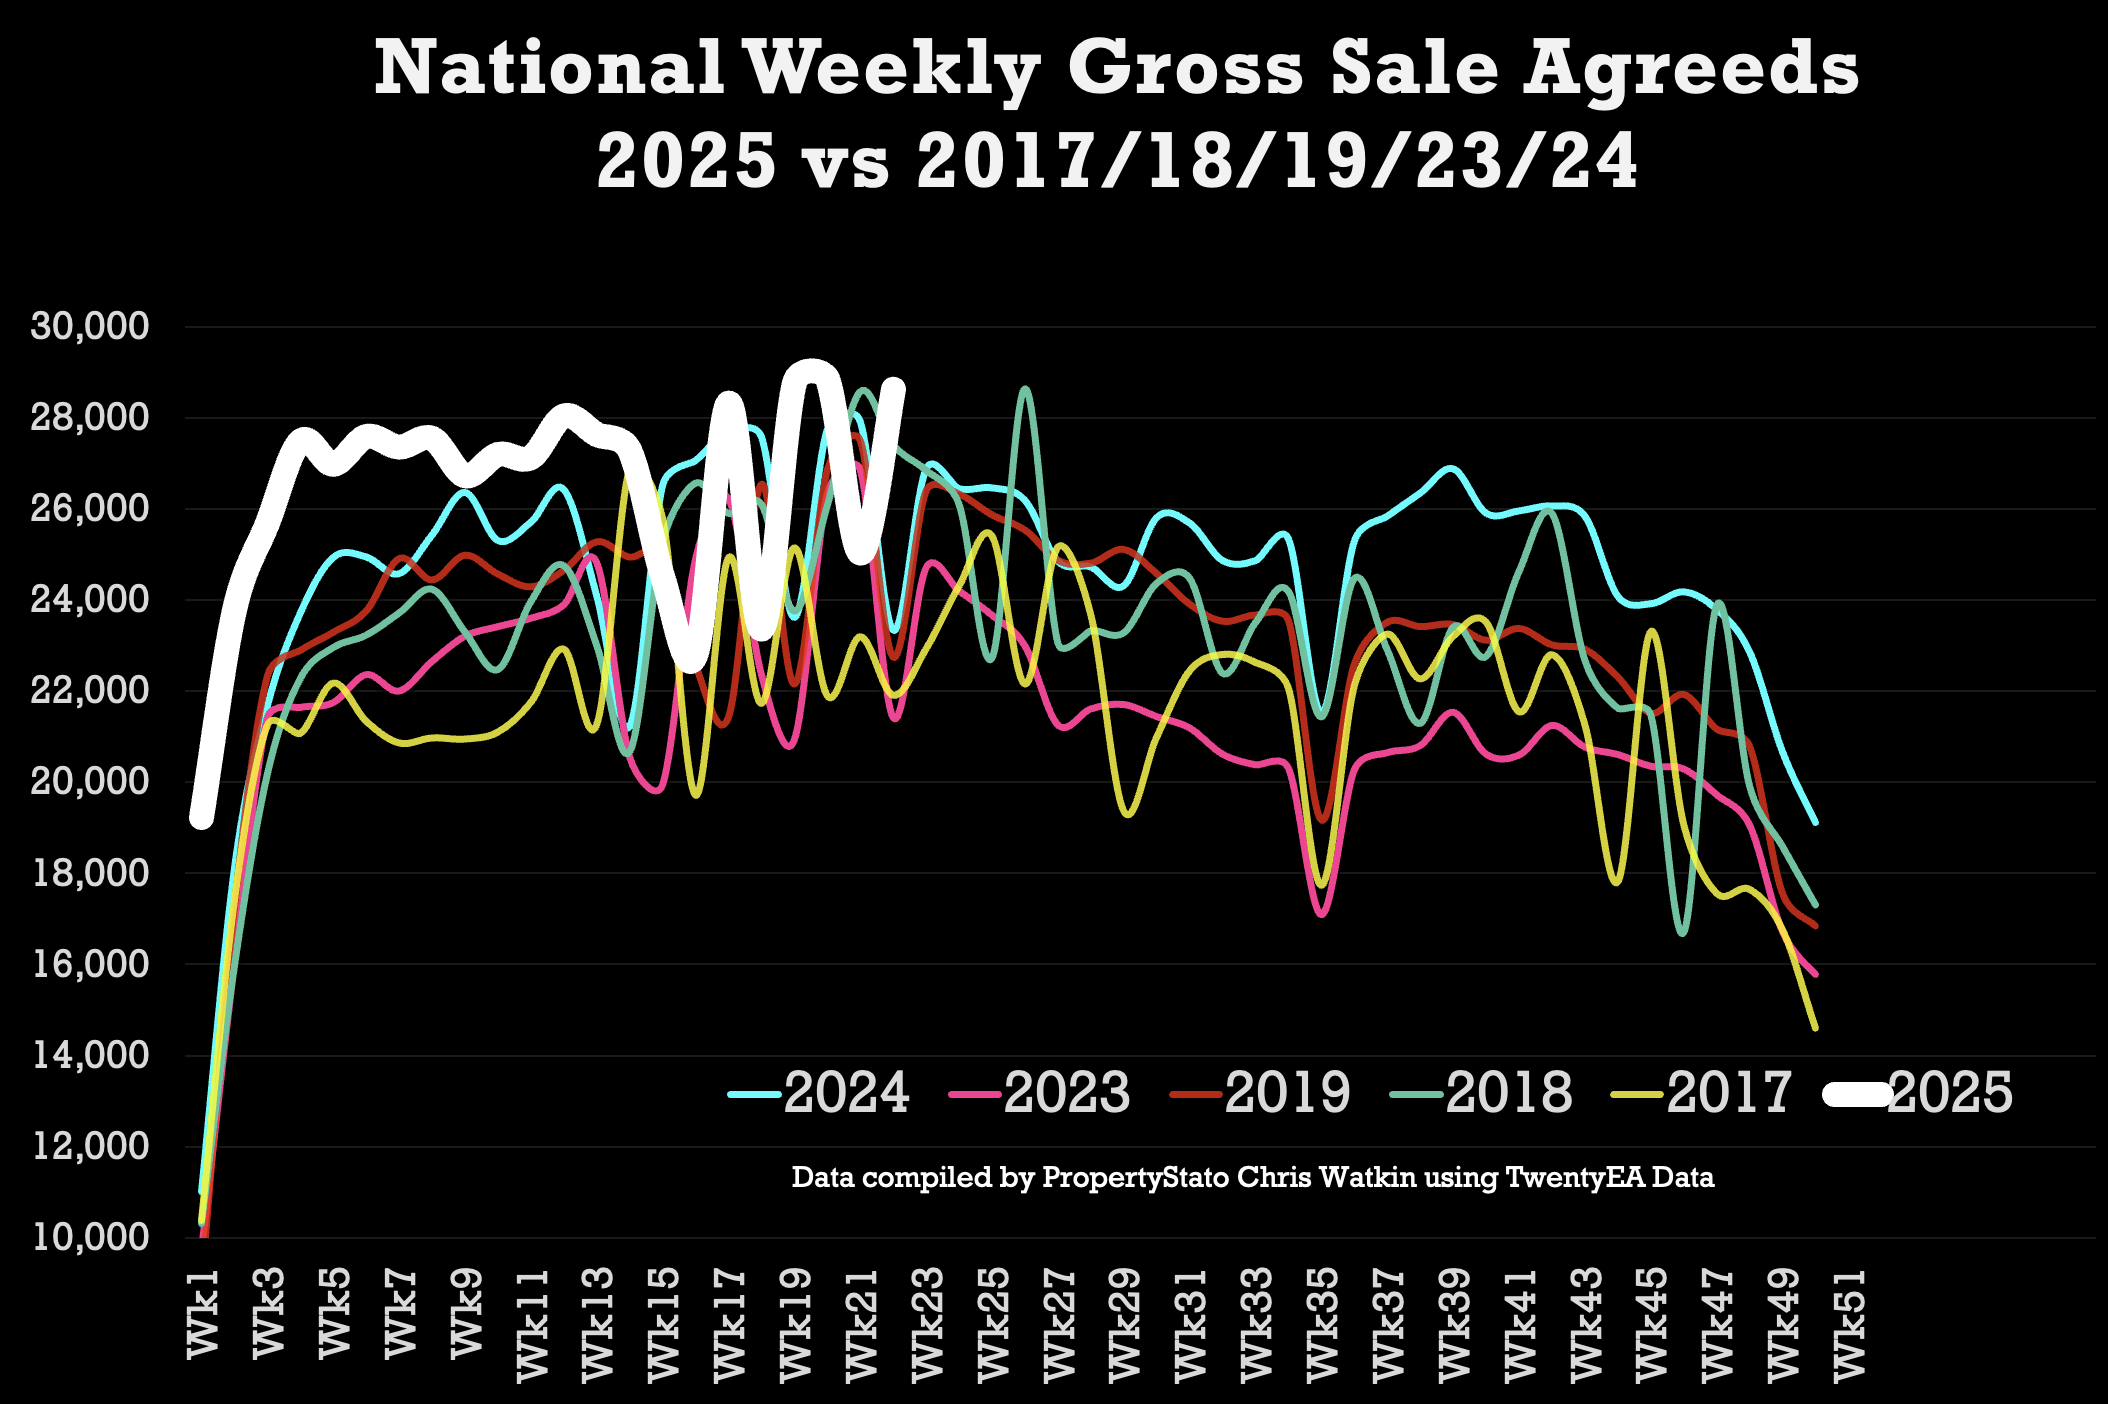
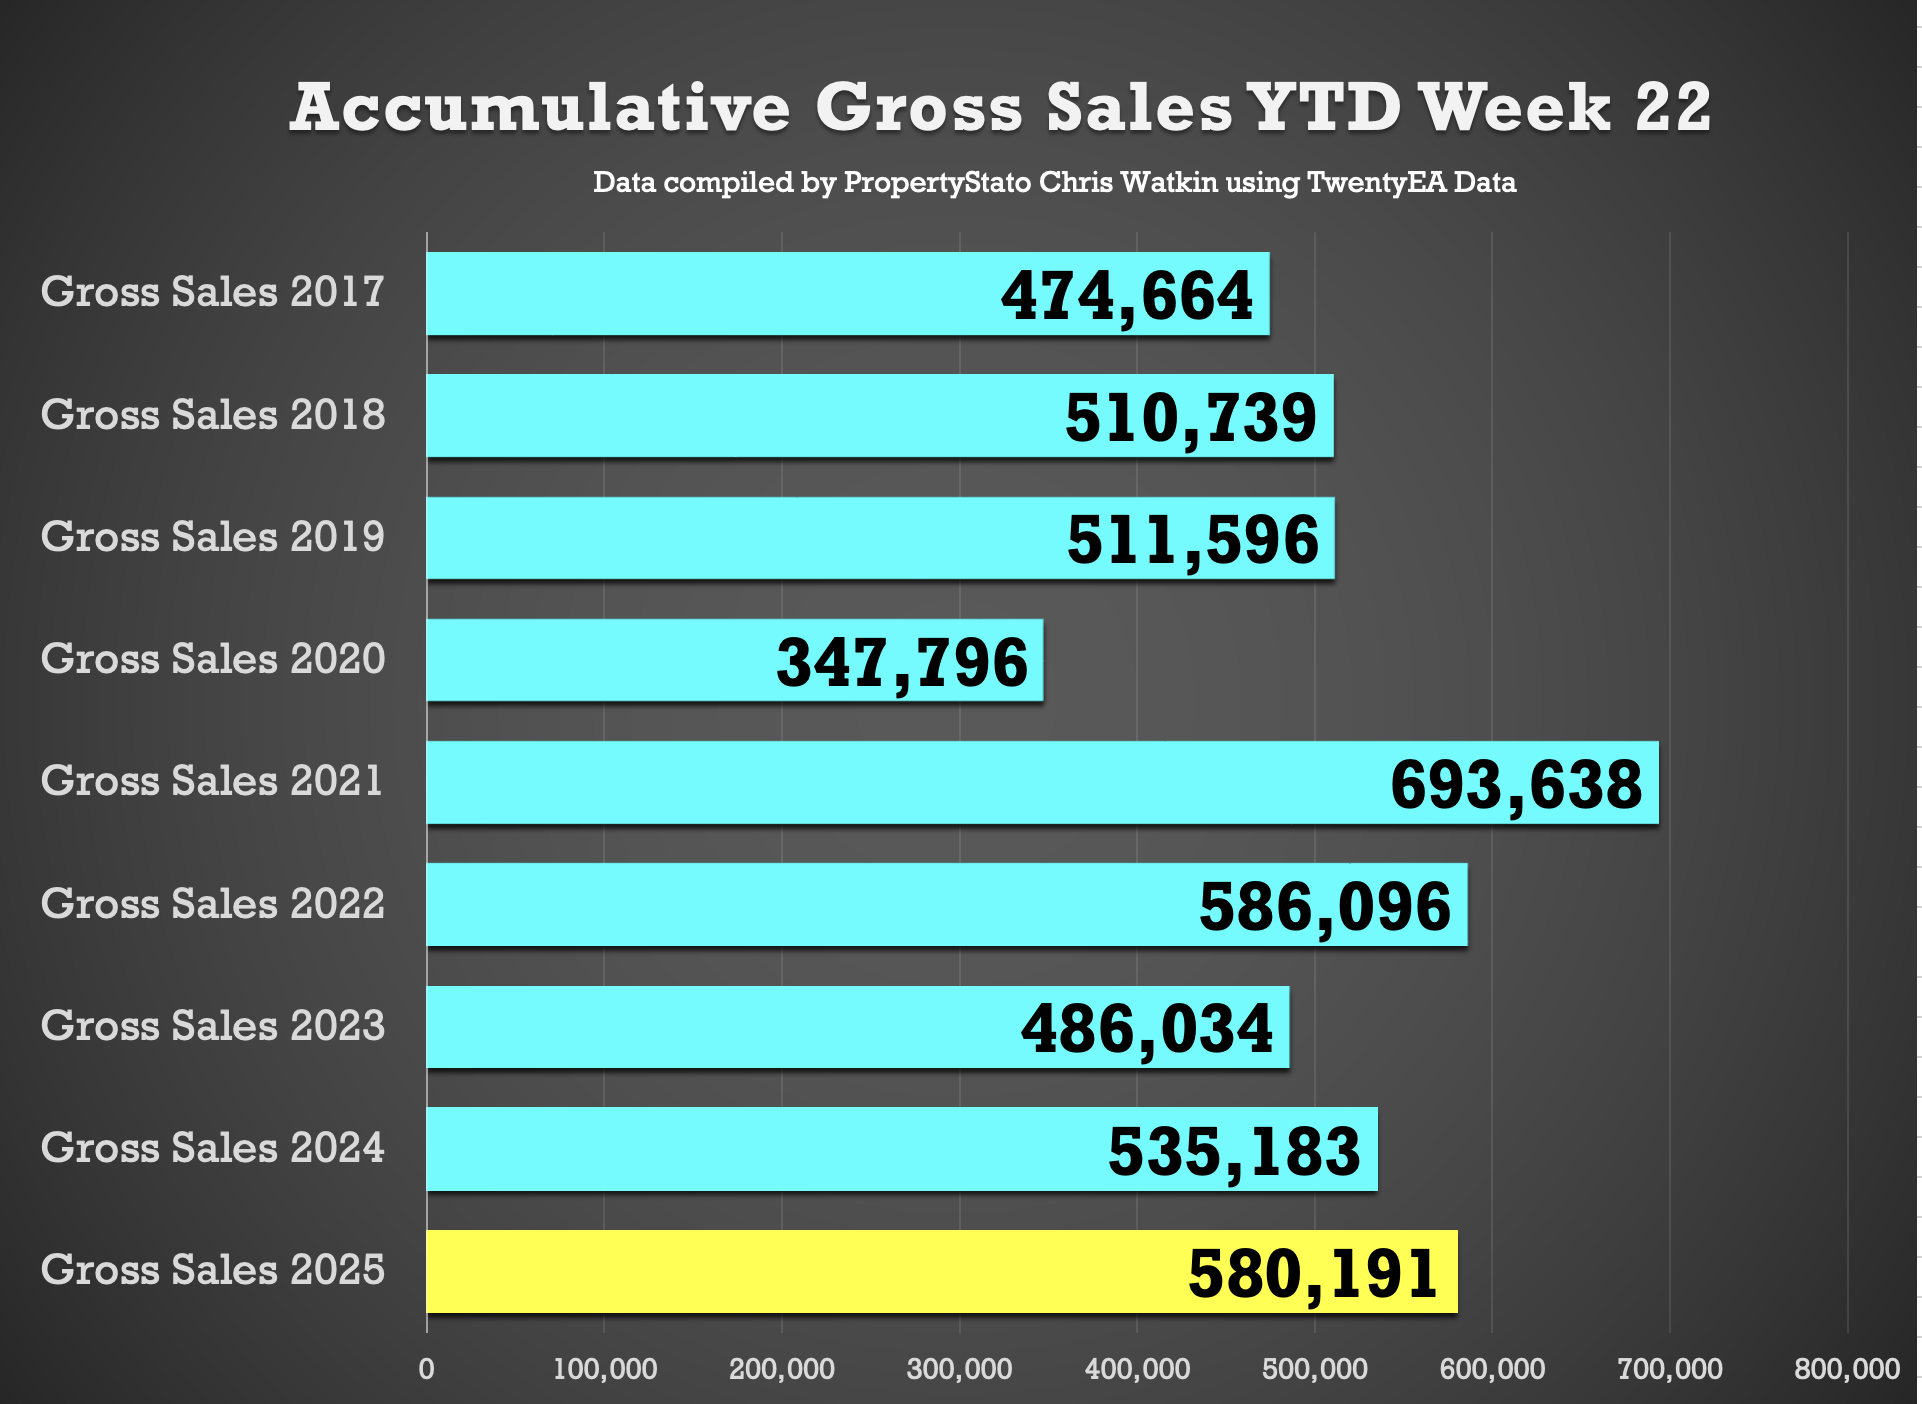
✅ Total Gross Sales (Agreed Sales)
28.6k UK homes sold STC this week (last week 25k)
YTD – The number of Sold STC Resi homes are 8% higher compared to 2024 (581k Sales agreed YTD 2025 vs 535k YTD 2024) and 16% higher than 2017/18/19 YTD levels (499k).
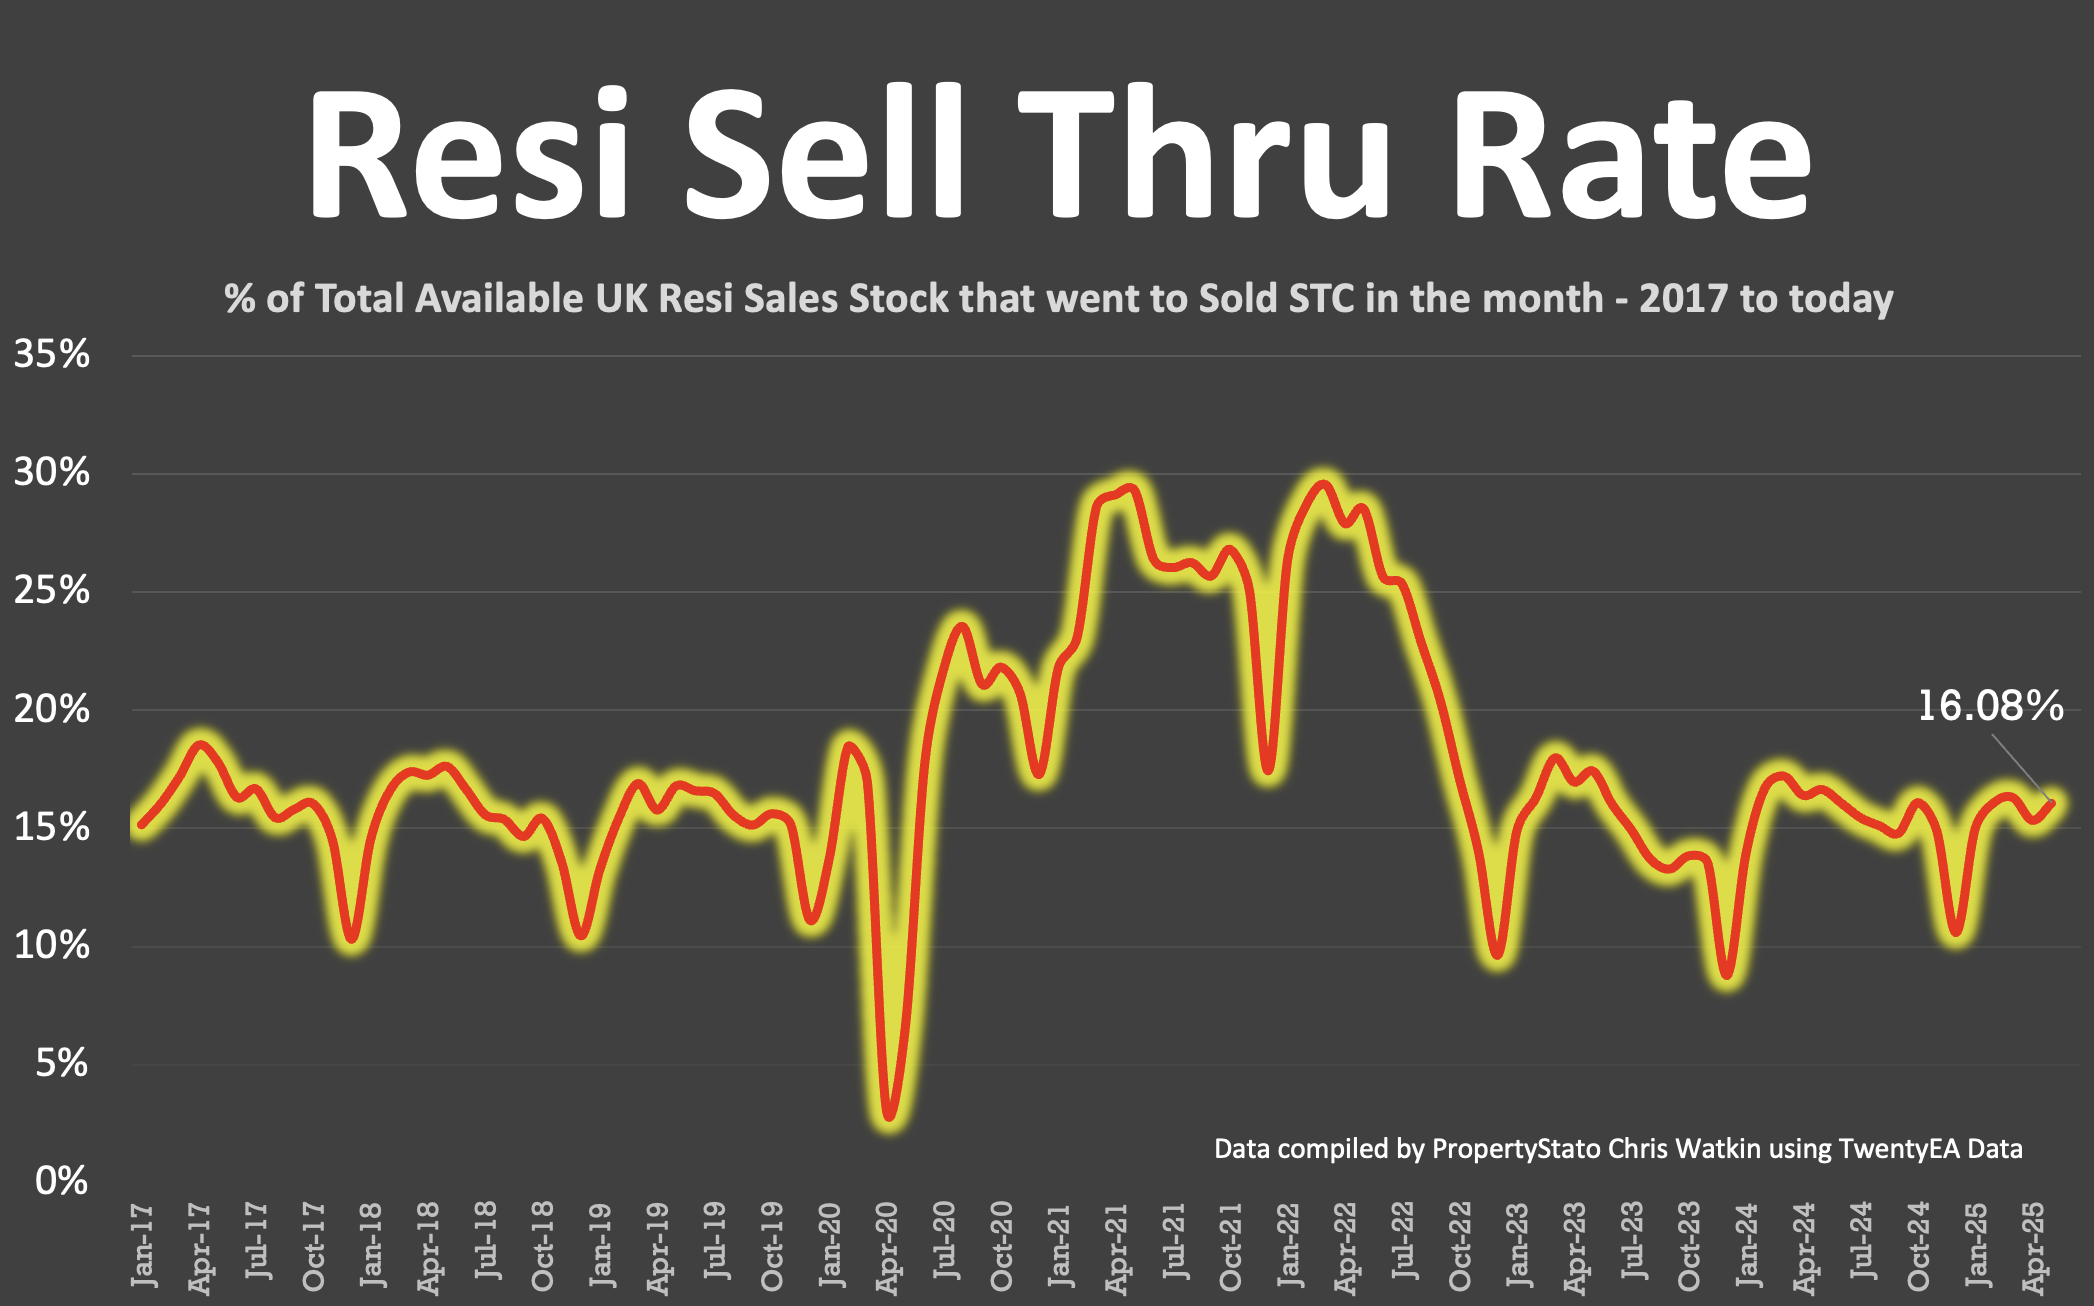
✅ Sell-Through Rate (Monthly in Arrears)
May’s sale run rate of 16.08 of Resi stock sold stc (ie 16.08% of Estate Agents properties on the market went sale agreed). 15.36% last month
2024 monthly average: 15.3%. Long term 8 yr average: 17.9%.
✅ Sale Fall-Throughs
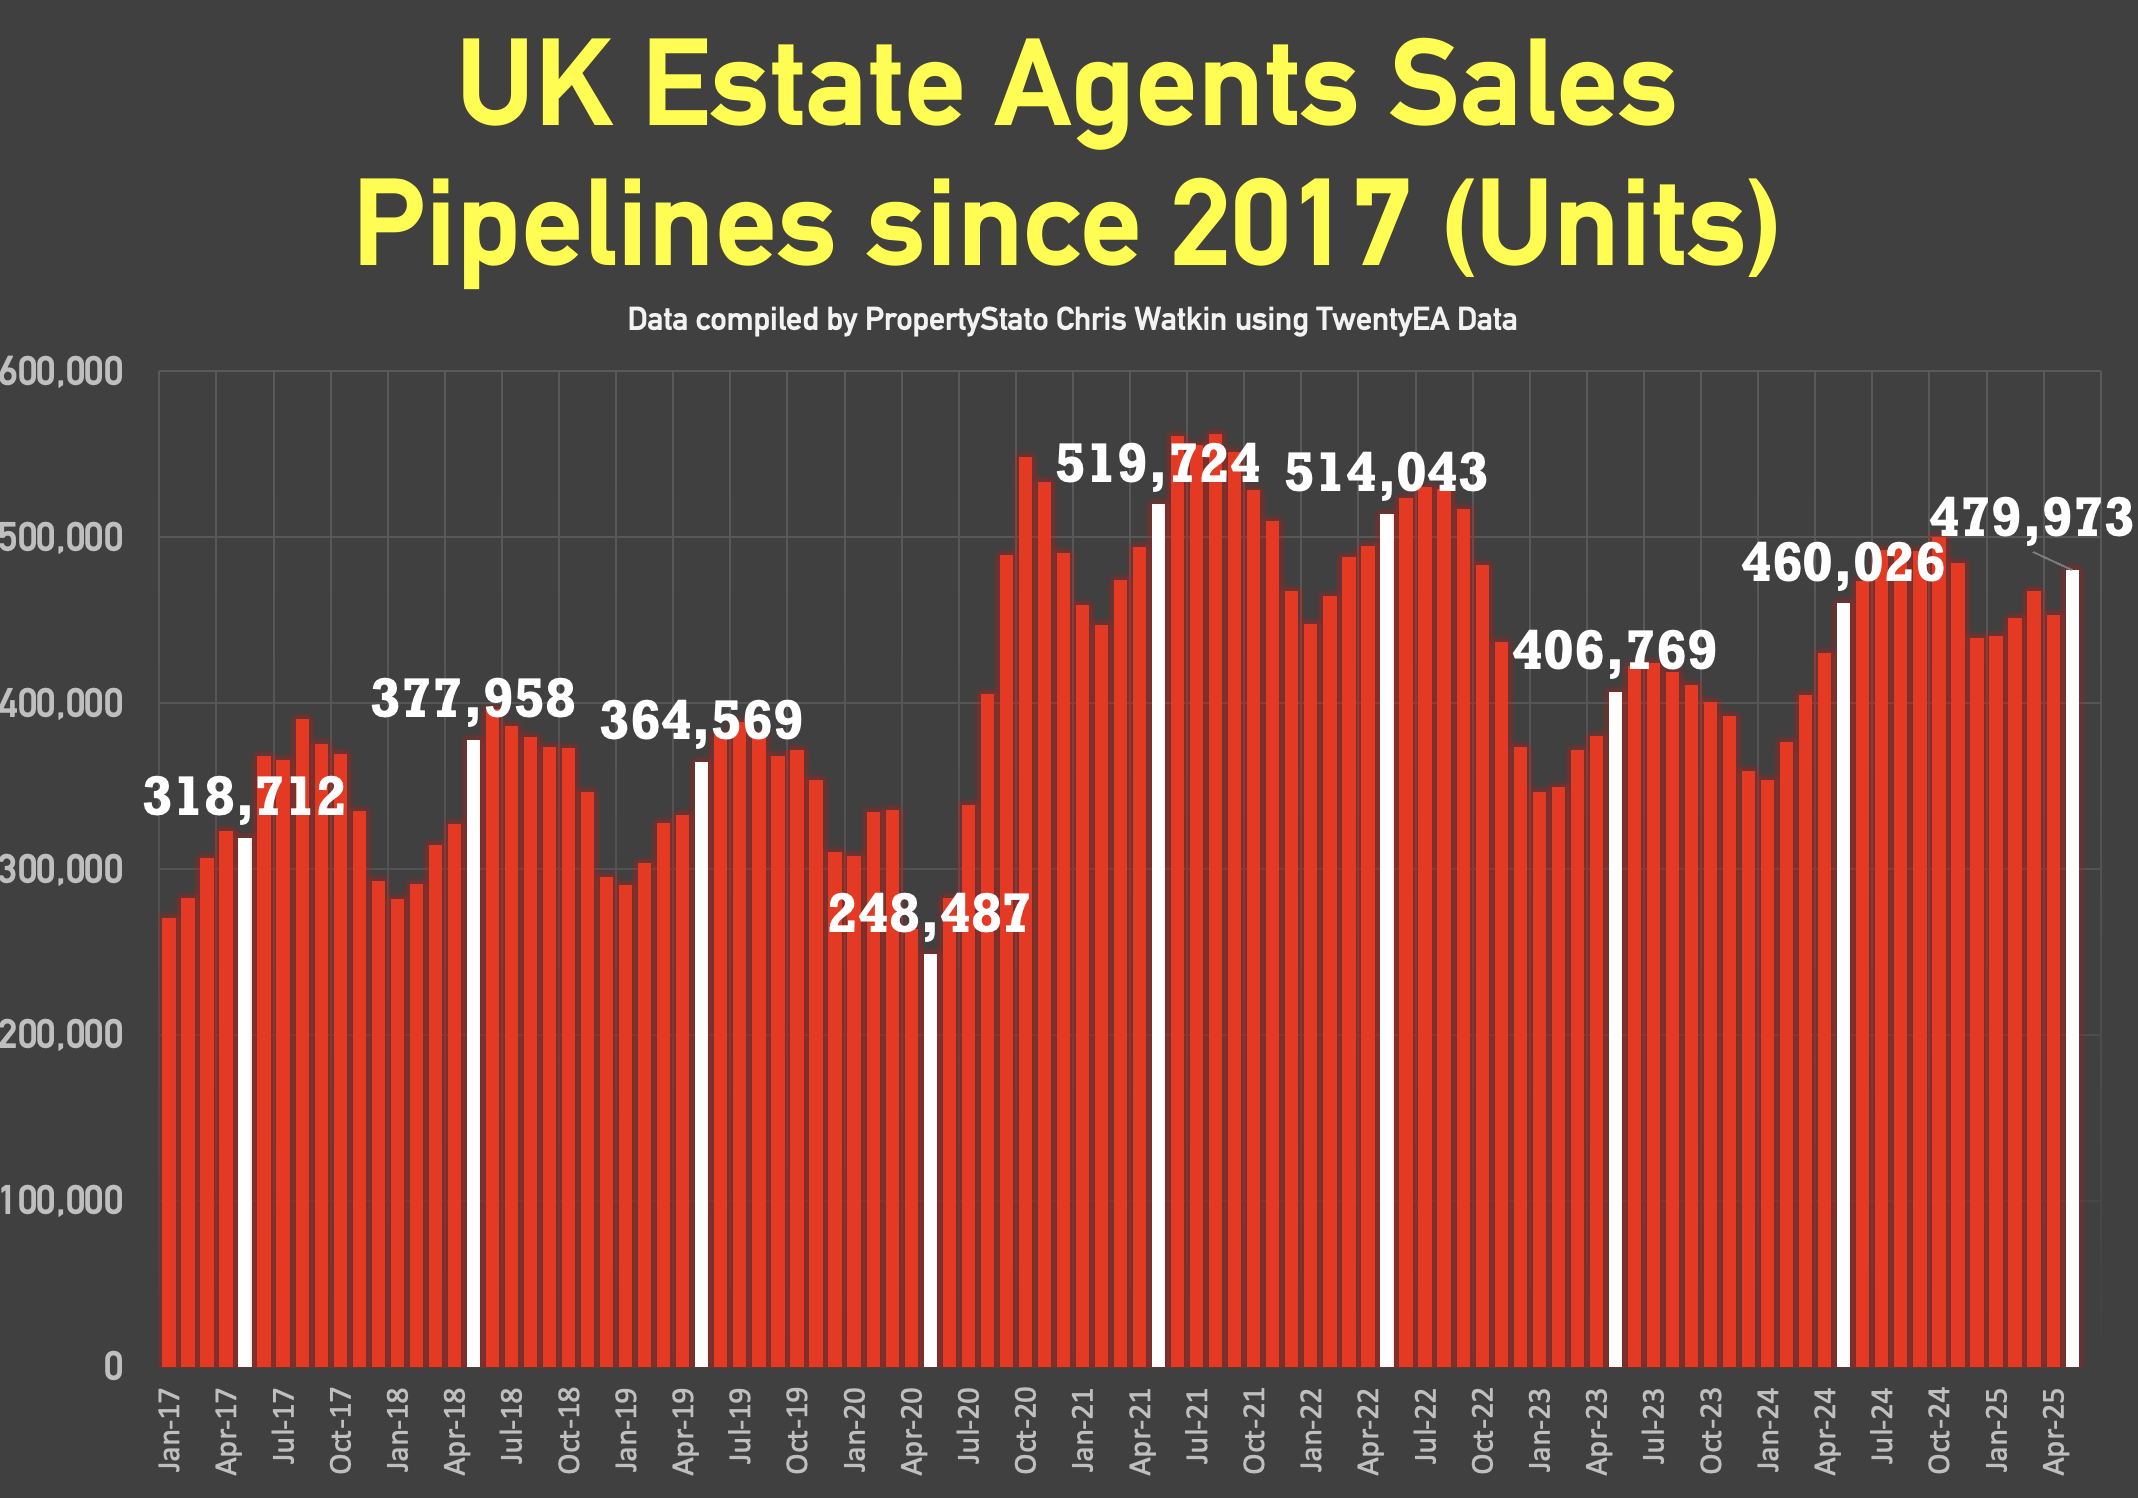
6,713 Sale fall-thrus last week from Resi Sale Sales Pipeline of 479k UK homes sale agreed (sold stc).
Another method is that week’s sale fall thrus as a % of gross sales that week. This week, that is 23.5% (last week 21.7%). That is below the 7-year average of 24.2%, and well below the 40%+ levels post-Truss Budget (Autumn 2022).
May’s figure 5.84% of sales in the UK agents pipelines fell thru. For comparison, April ’25 – 5.51%. 2024 average: 5.36%.
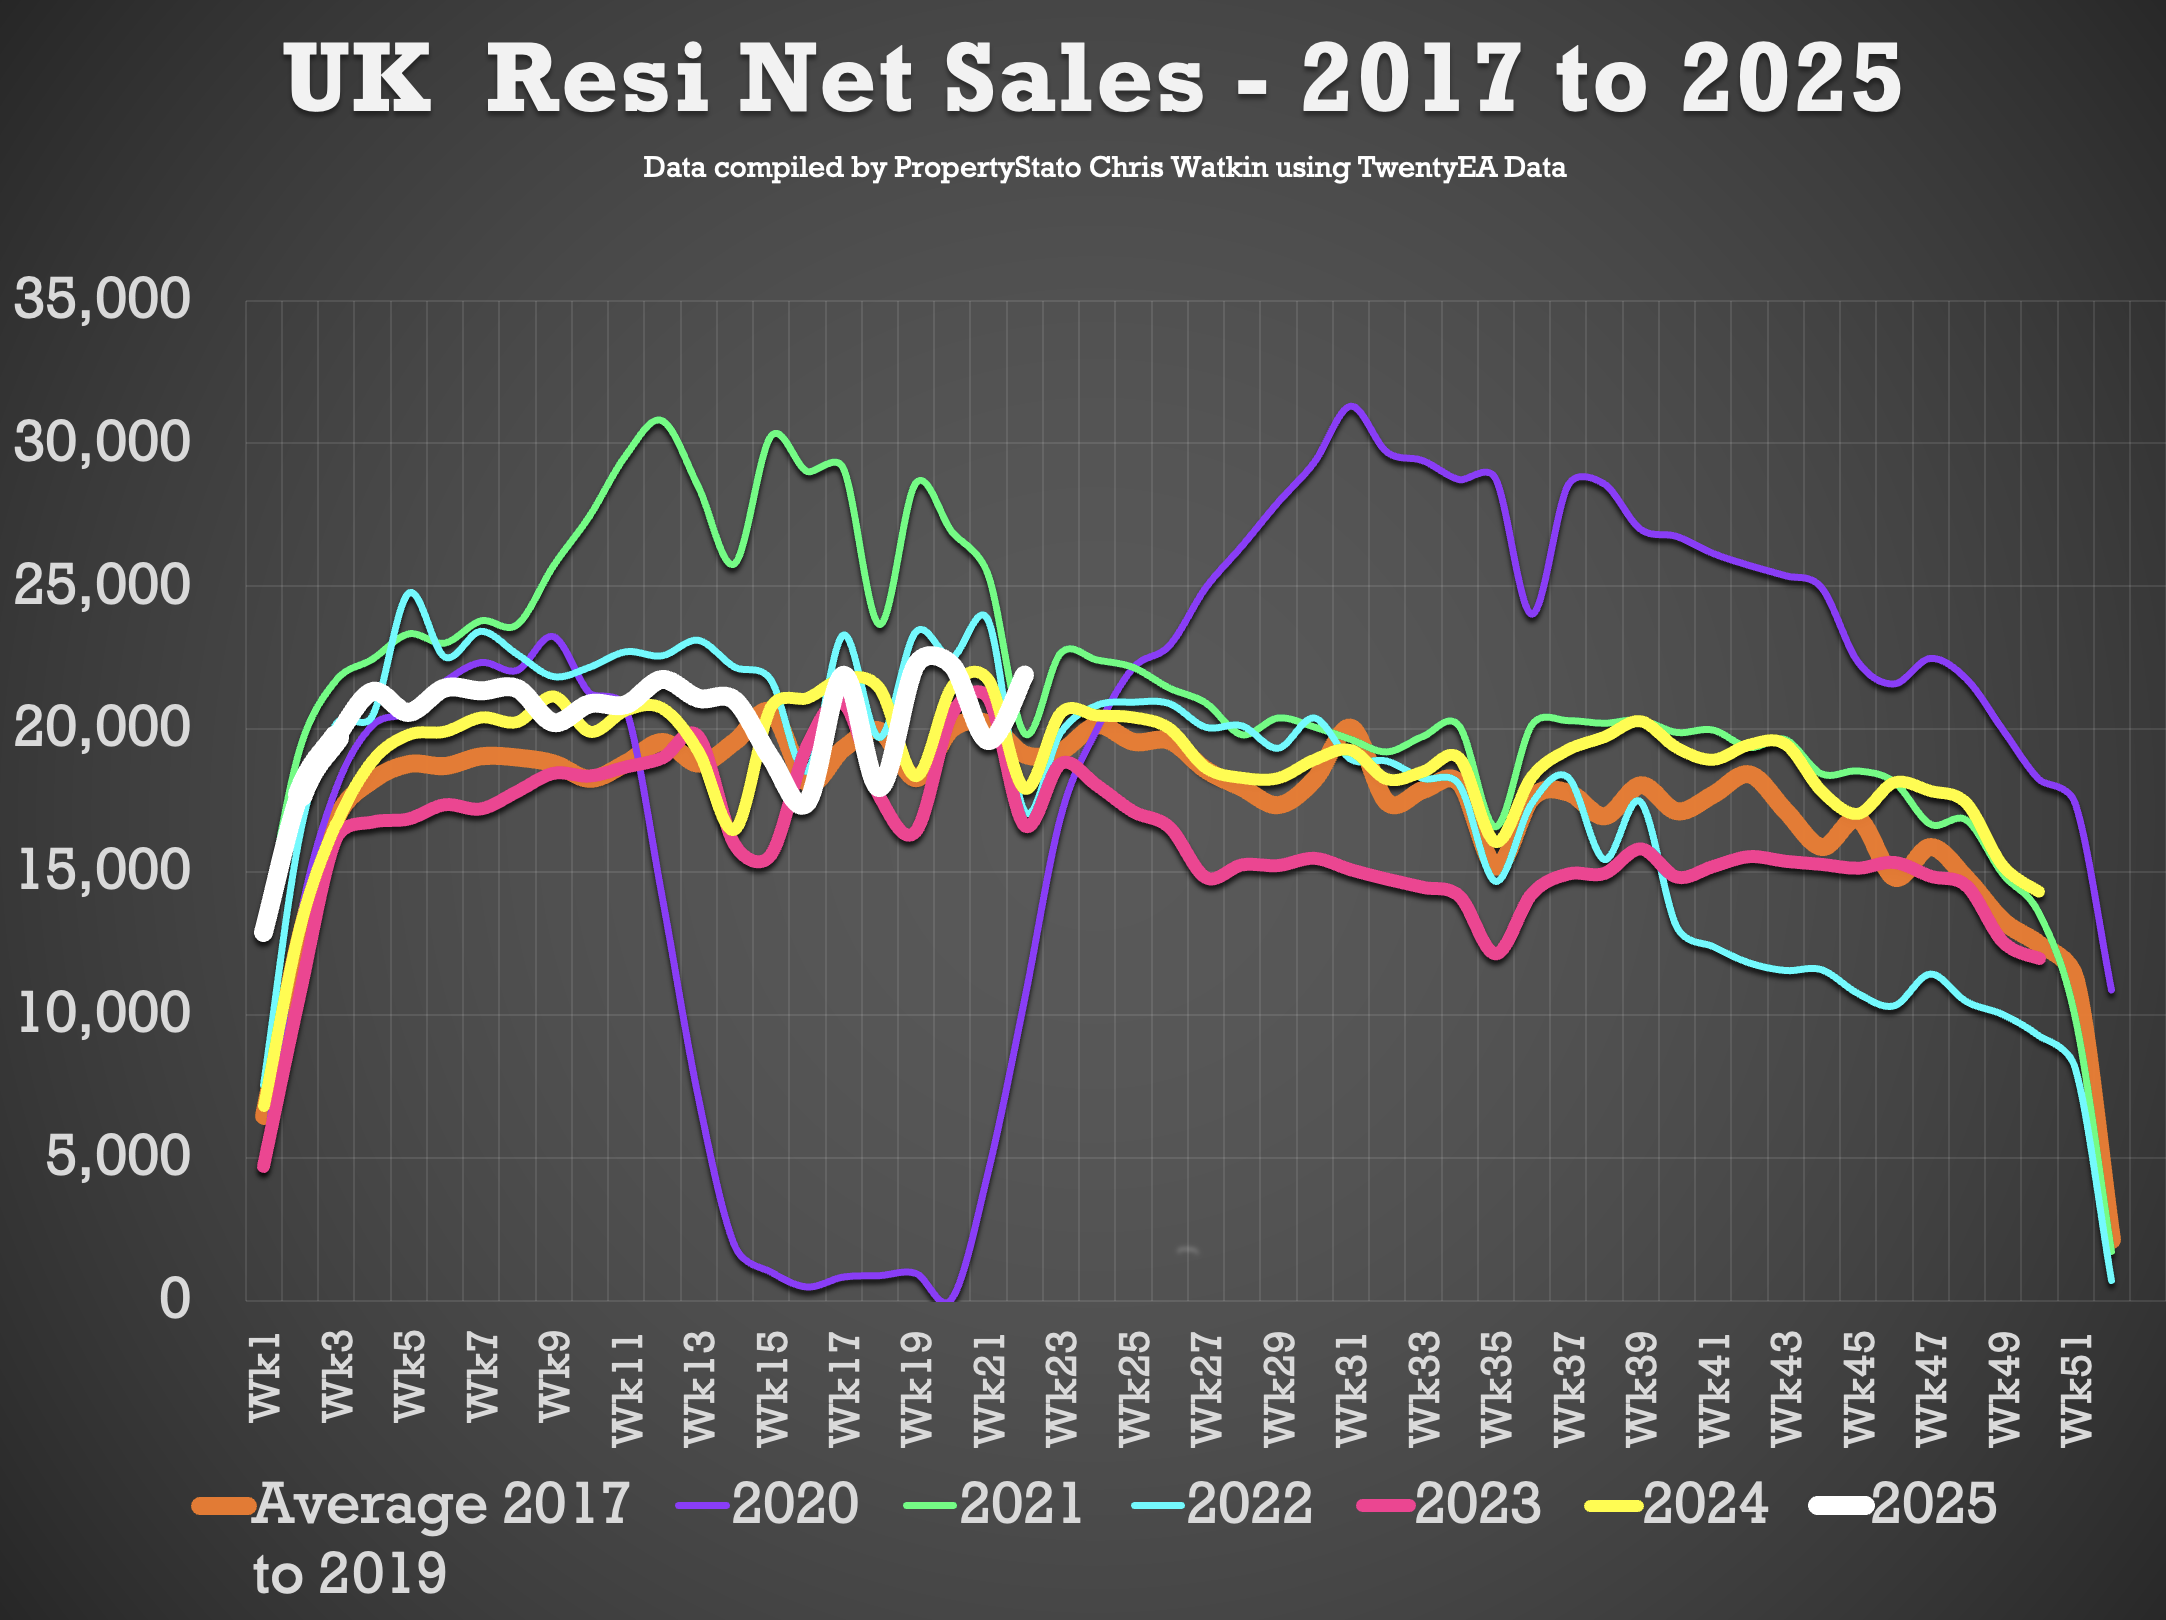
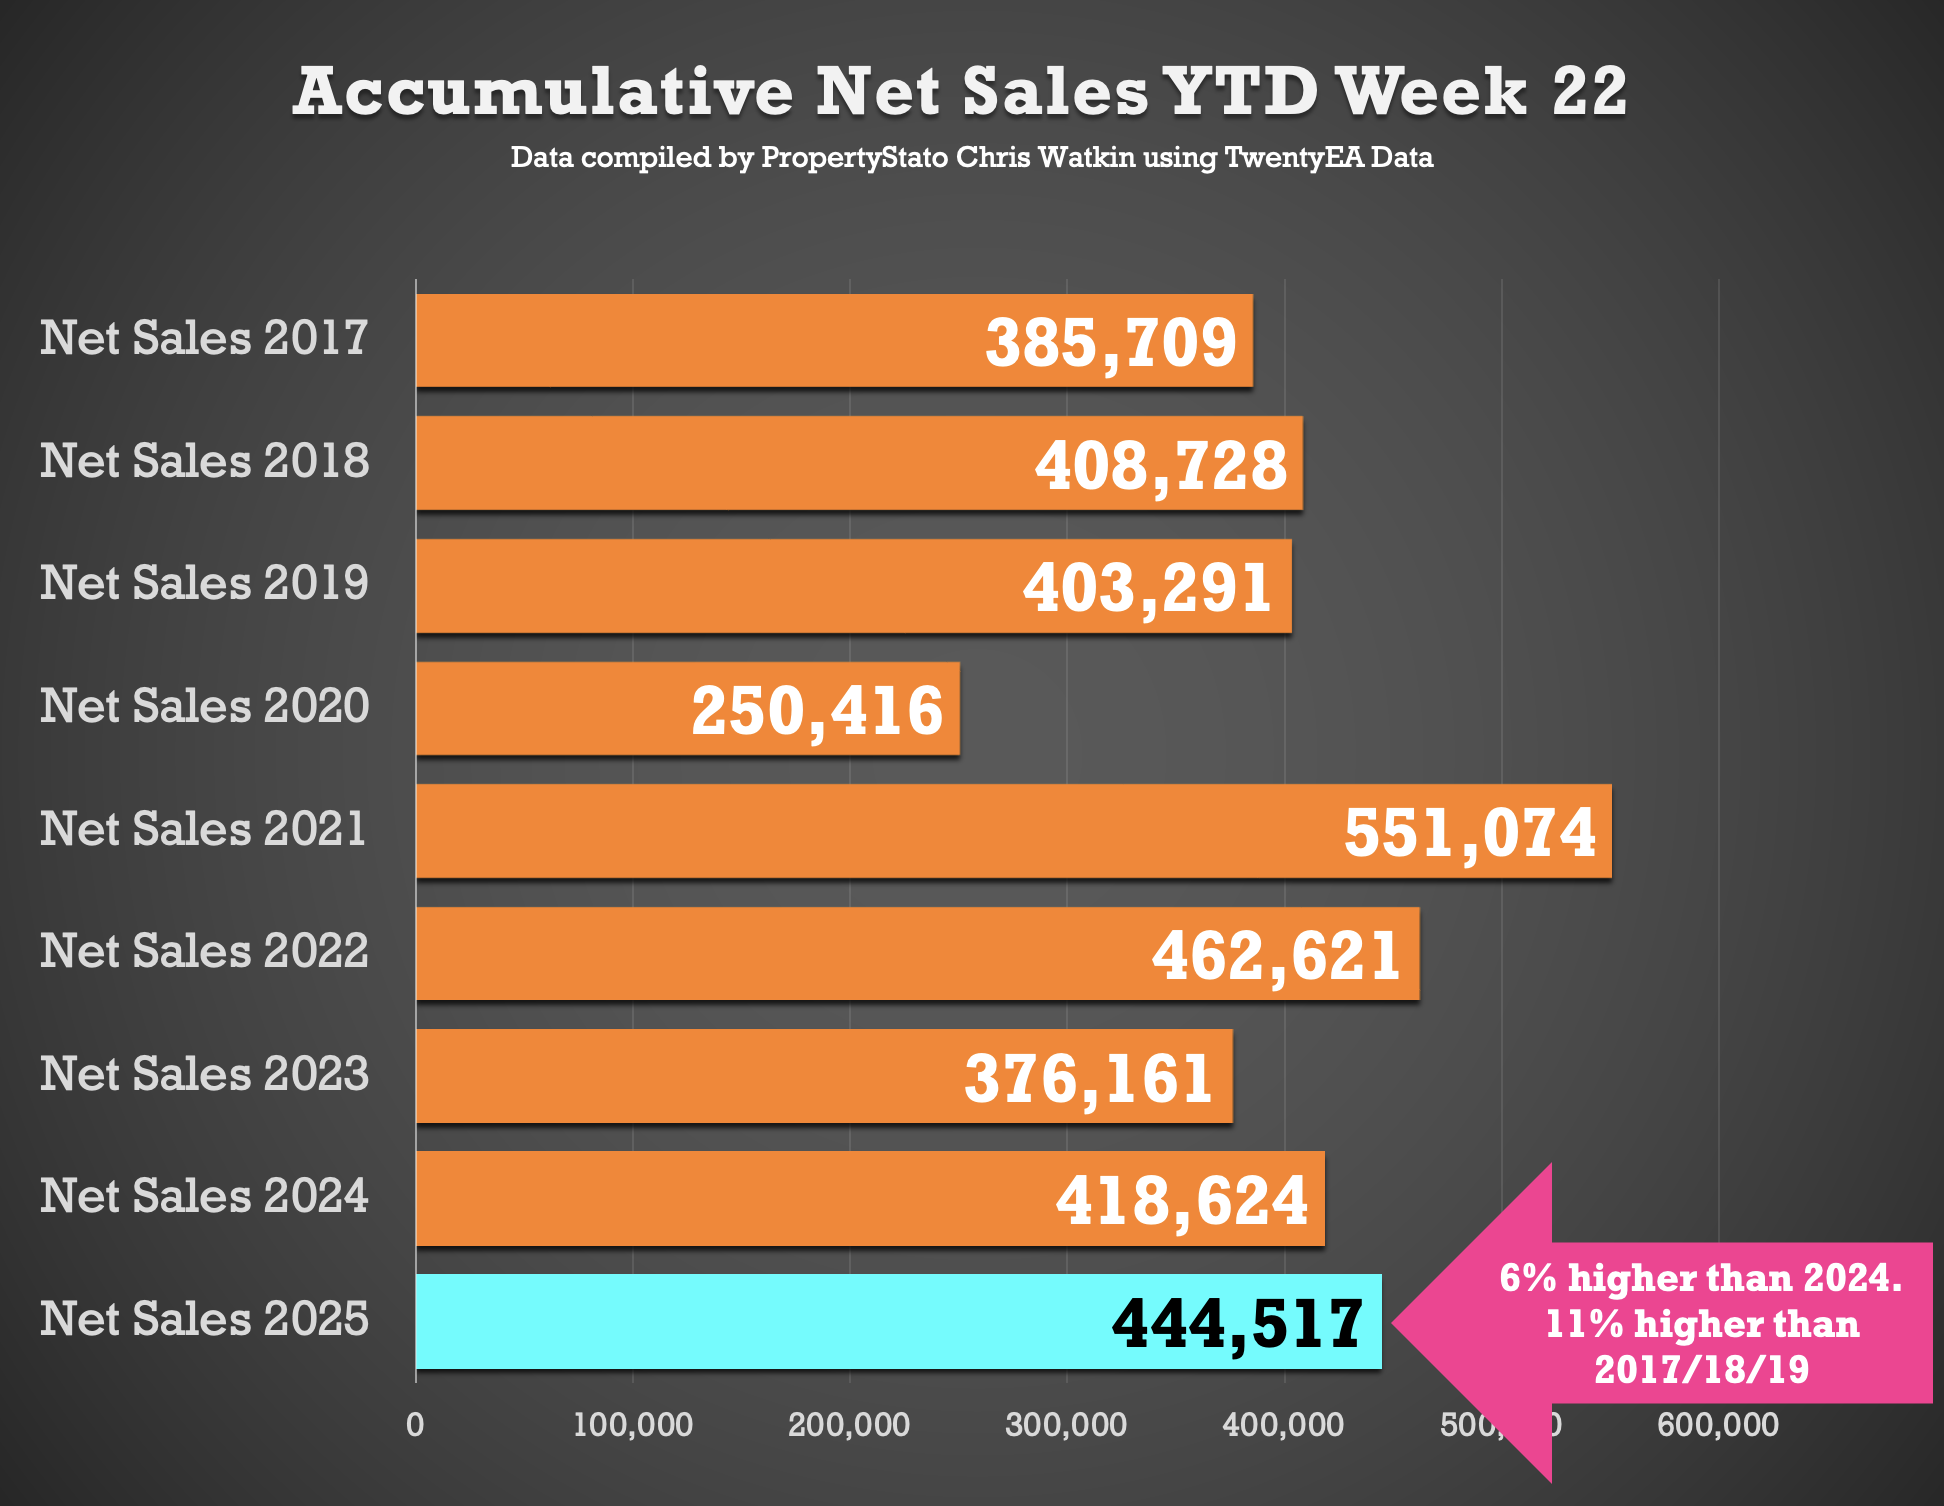
✅ Net Sales (Gross sales for the week less Sale Fall Thrus for the week)
21.9k net sales this week (19.6k last week), compared 2025 weekly average of 20k.
2025 YTD is 6% higher than compared to 2024 YTD and 11.2% higher than YTD 2017/18/19.
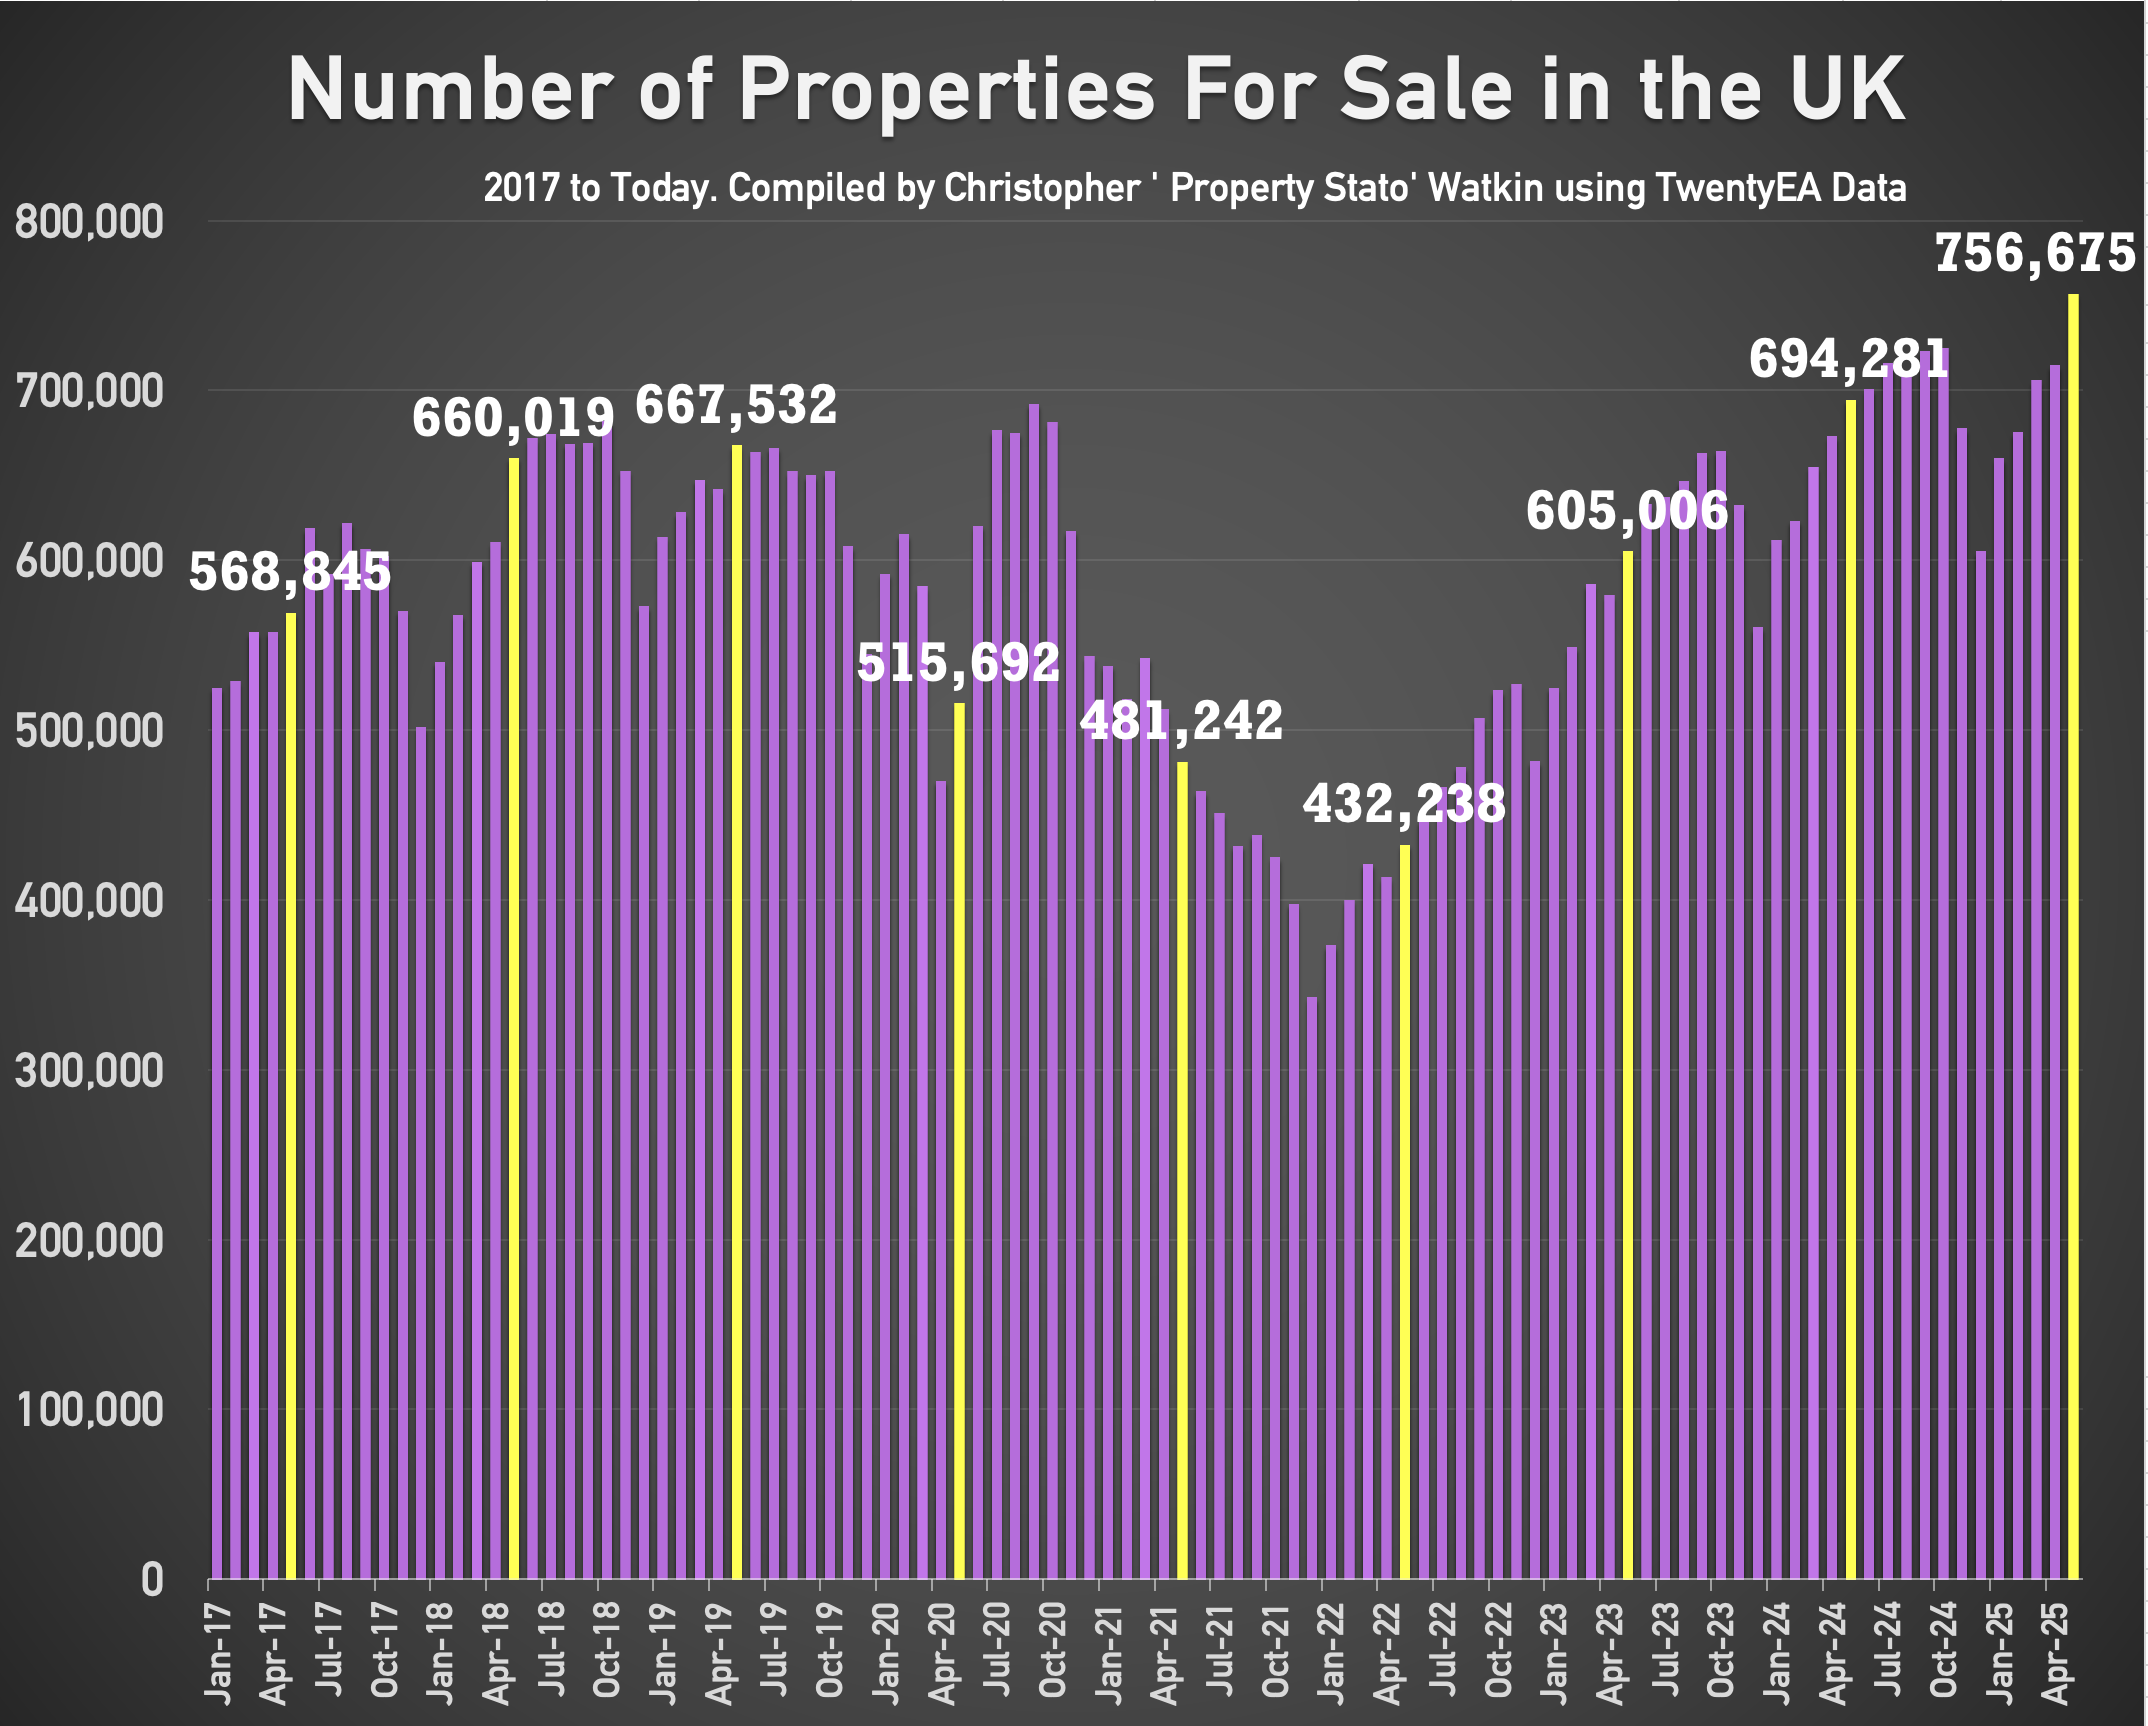
✅ Resi stock levels and sales pipeline StatsResi
As of 31st May 2025
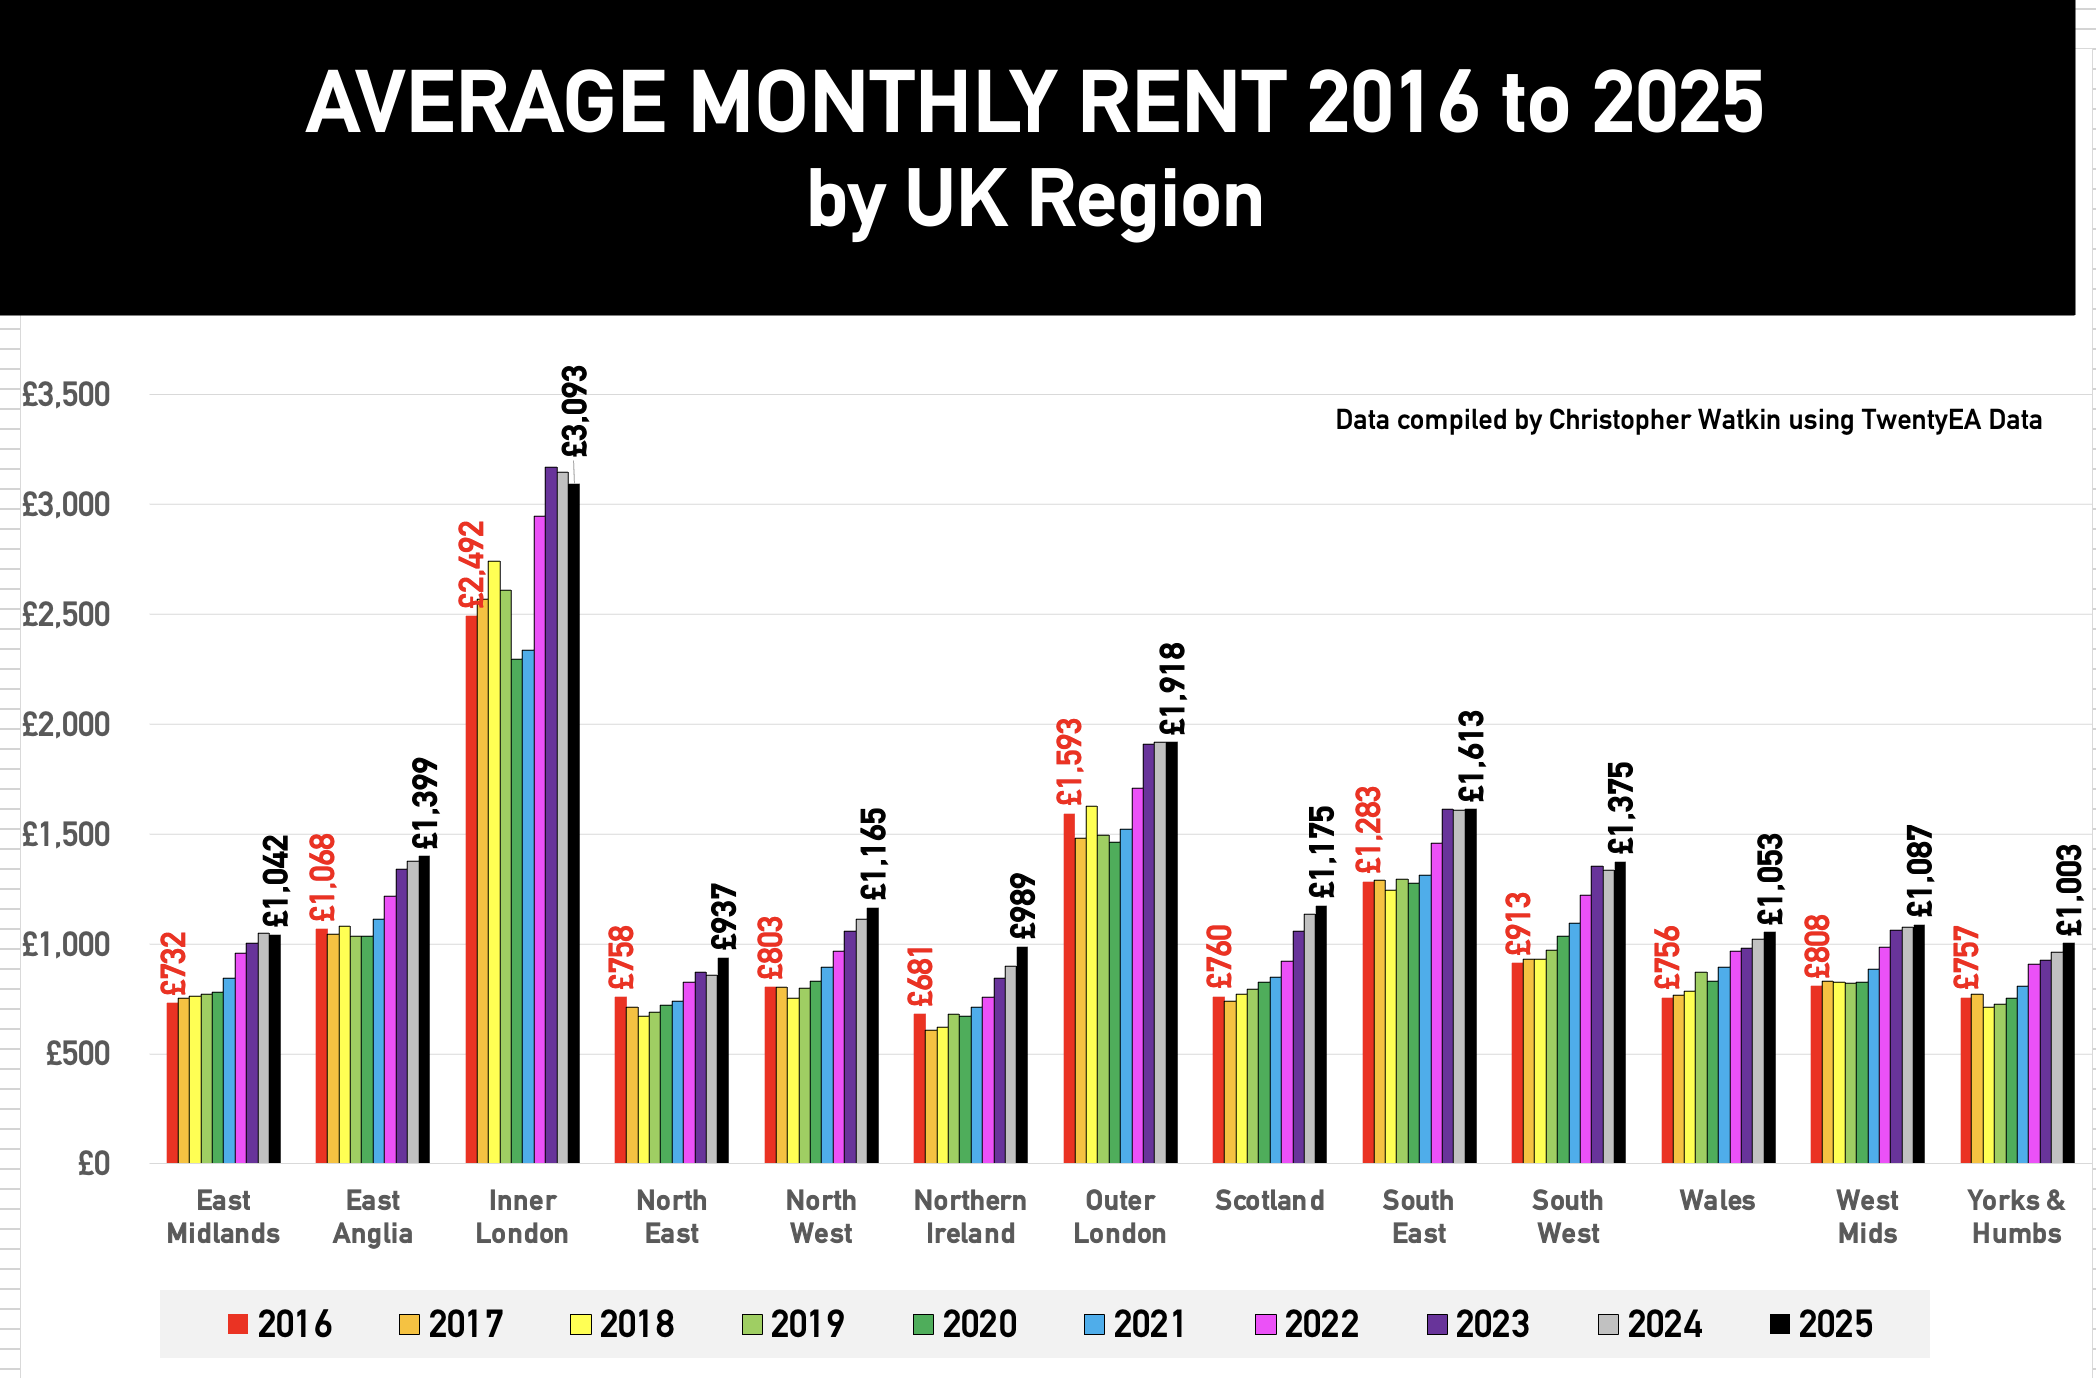
✅ Average rents by UK region since 2016
Local Focus this week
Stockport


Comments (4)
Perhaps of more interest is that current YTD net sales are 9.2% above the average of the previous 8 years.
Exp reports that the number of estate agency businesses has increased by 25% since 2017. In that time, HPI (all properties, England only) has gone from £218,655 to £295,654 which is an increase of 35%.
From 2017, the Land Registry reports the following sales numbers (units completed):
2017 – 876,469 2018 – 844,931
2019 – 815,924 2020 – 686,155
2021 – 1,053,532 2022 – 869,182
2023 – 630,549 2024 – 617,578
From 2017 the average is 799,290 per year with 2023 and 2024 being decidedly sub-par. The Land registry has been slow in registering new sales so perhaps we’ll see the 2024 number revised upwards a bit. However, we are now in June so it won’t be by much.
So the long term trend in completed transactions appears to be downward.
I just did a quick check, I won’t list them all because it’s dull, but from 1995 to 2007, 9 of the 13 years were well over 1 million transactions. The average from 1995 to the Credit Crunch (end of 2007) was 1,085,648.
The average number of transactions from 2008 – 2024 is 760,183. That’s a huge reduction in the number of units paying commission every year!!!
Given the costs of moving and real-terms static wages for the last 15 or so years, this is no real surprise.
I would anticipate that the number of completed transactions in 2025 is going to be no better than 2023, even though HUGE numbers of properties are on the market.
That’s an awful lot of running around for not very much money.
More agencies competing for business tends to depress commission rates.
More agents means that (on average) everyone gets a smaller piece of the pie.
And at the same time, the pie is shrinking.
Ahh! I remember the good old days before Rightmove came along. Me, an analogue telephone and a box of client cards. I used to love that 🙂
Have a lovely weekend!
Interesting reading.
Down in the South East the market seems to be faltering. Very price sensitive. More stock vs 2024, less buyers and FTB are nervous.
Knife edge I’d say this market.
That certainly tallies with what I can see (former estate agent gone to the dark side as a surveyor).
I’ve visited 5 agents to collect keys across the south coats in the last 2 weeks and have been told exactly that.
SE London. I concur exactly. 35 years experience.