
 Special guest Bryan Mansell joins me to talk about the current state of play in the UK property market for the week ending Sunday, 3rd December 2023.
In a nutshell, considering its the first week of December, the UK property market still holding up very well. Here are the headlines:
Sales agreed £/Sqft rose in Nov ‘23 to £331.19/sq.ft (up from £329.63/sq.ft in October ’23).
Listings YTD 2023 are 99.3% of the 2017/8/9 YTD average.
Gross Sales YTD 2023 are 94.6% of the 2017/8/9 YTD average.
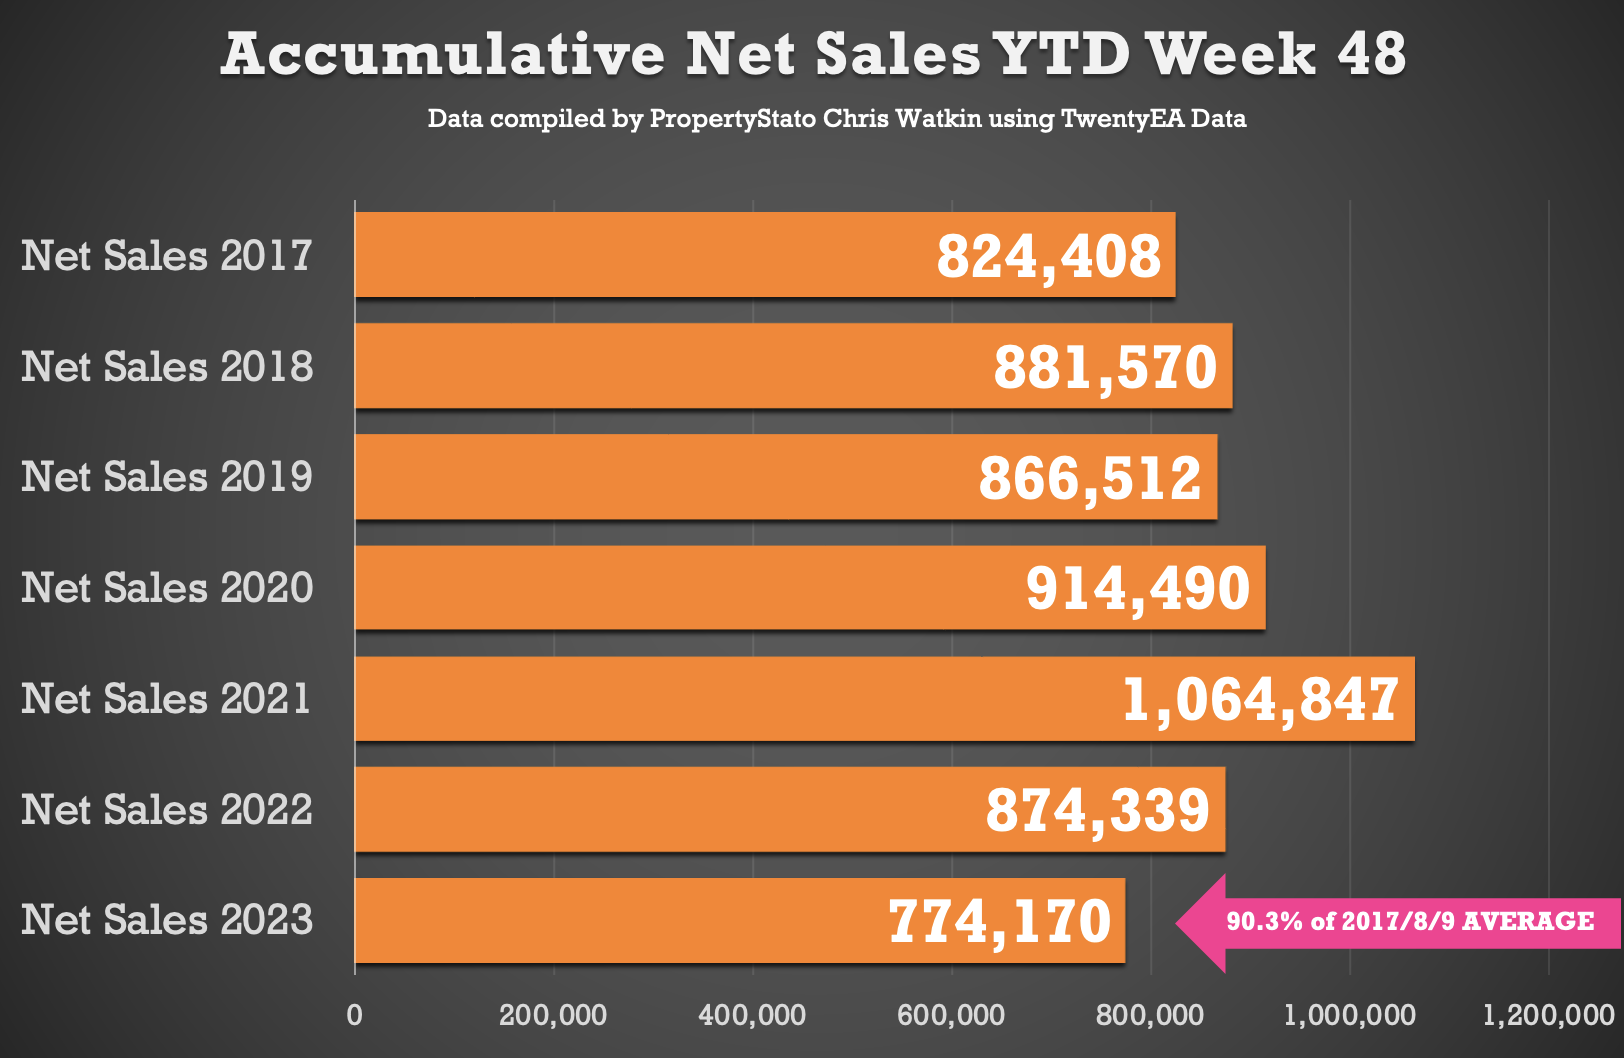
Net Sales YTD 2023 are 90.13 of the 2017/8/9 YTD average.
Stock Levels for UK Resi sales properties drop from 664k in Oct ’23 to Nov ’23 634k.
Sales Agreed (Units) in Estate Agents pipelines at end of Nov ’23 – 393k properties (down from 402k at end of Oct ’23). Nov ’23 vs Nov ’22 – 9.5% lower. Nov ‘23 vs Nov ’19 – 11.1% higher.
Key statistics in more details:
+ New properties to the market (listings): New listings last week was 21,824 (Average for the last 4 weeks 26,624). The 2023 YTD running weekly average stands at 31,703.

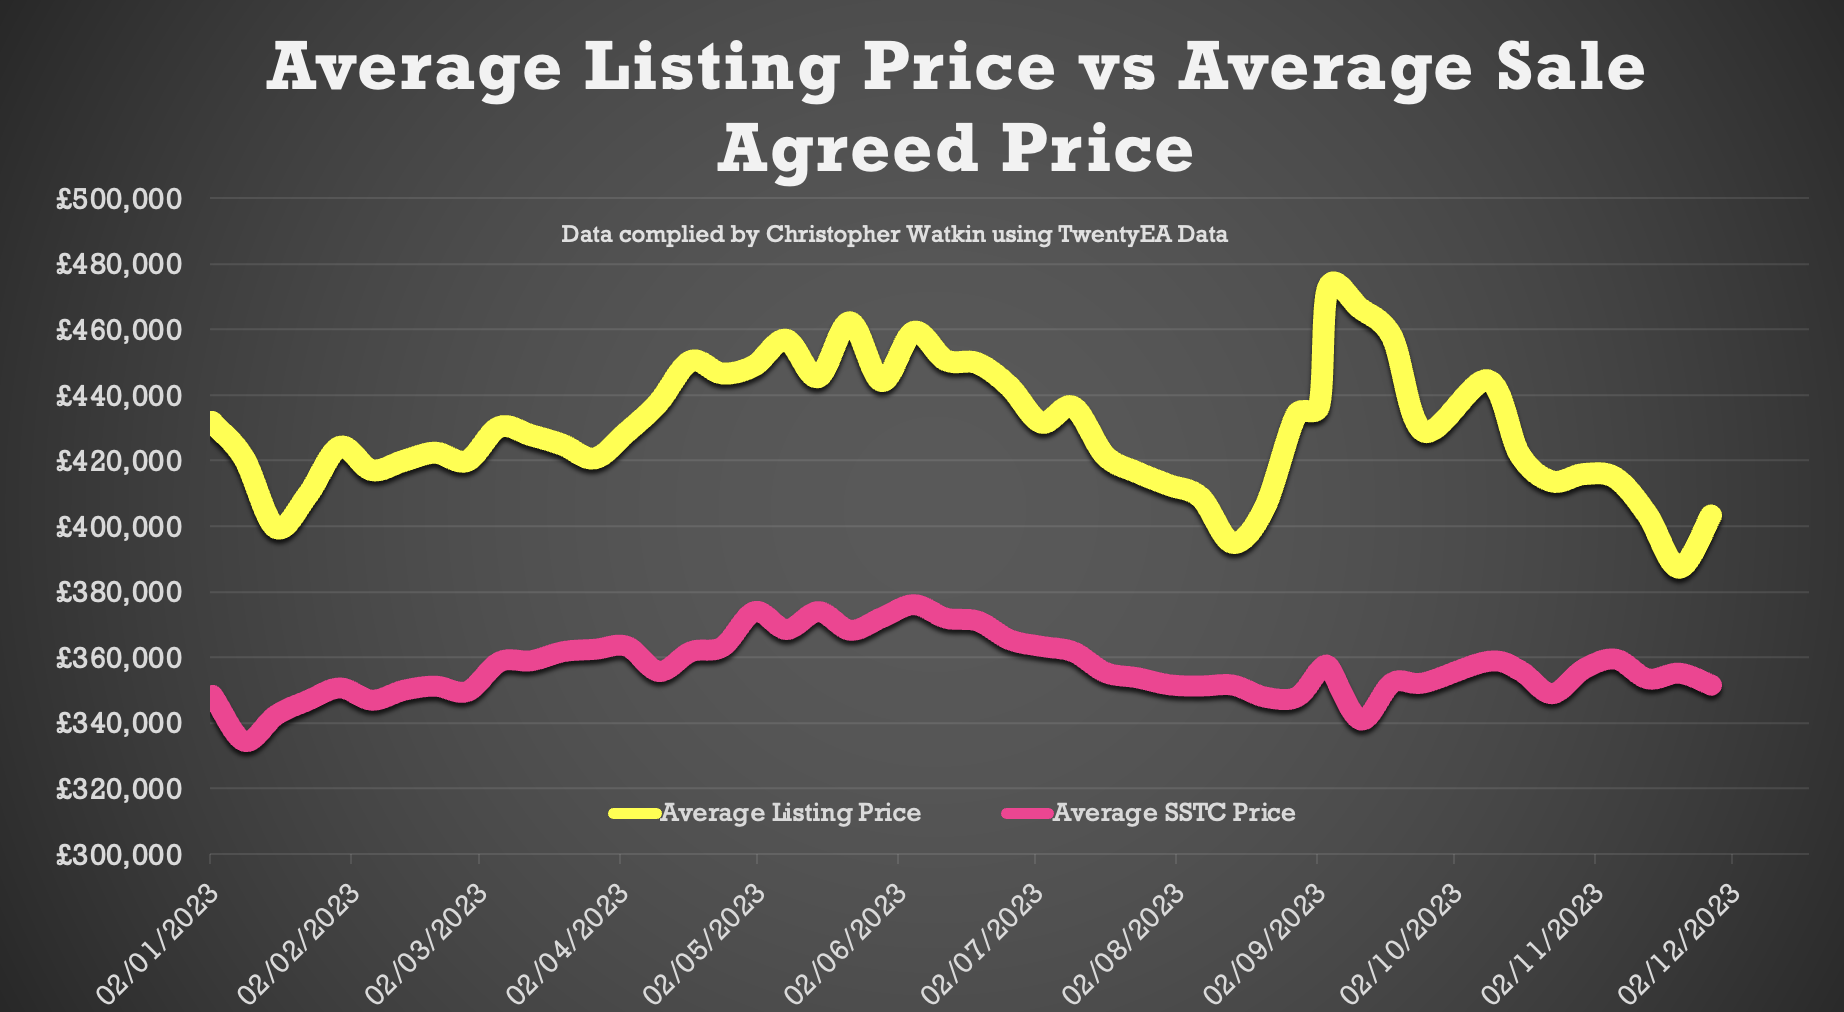
+ Average listing price: The average listing price has remained stable in the last few weeks. Average Listing price this week £403,269. The 2023 running weekly average of £429,627.
+ Percentage difference between listing and sale agreed prices: This week has increased slightly to 15%. Yet, nothing to worry about as it’s still below the long term 7 year average 17%. 2023 YTD average 20.3%
+ Price reductions: 12,244 price reductions were seen last week which continues the significant drop over the last few weeks. The 2023 running weekly average is 20,014 per week
+ Average asking price of properties being reduced: This week’s average asking price of reduced properties £363,998. The 2023 running weekly average of £401,586.
+ Number of properties sold (gross sales): Gross sales are holding up well. Total number of gross sales in the UK last week was 19,057 (not bad for the first week in Dec). For comparison, the last Q running average is 20,479/wk. The 2023 running weekly average is 21,536 weekly sales (stc)
+ Average asking price of properties sold STC this week: The average asking price of the properties selling last week was £351,568, (very similar for the last few weeks). The 2023 running weekly average of £356,927.
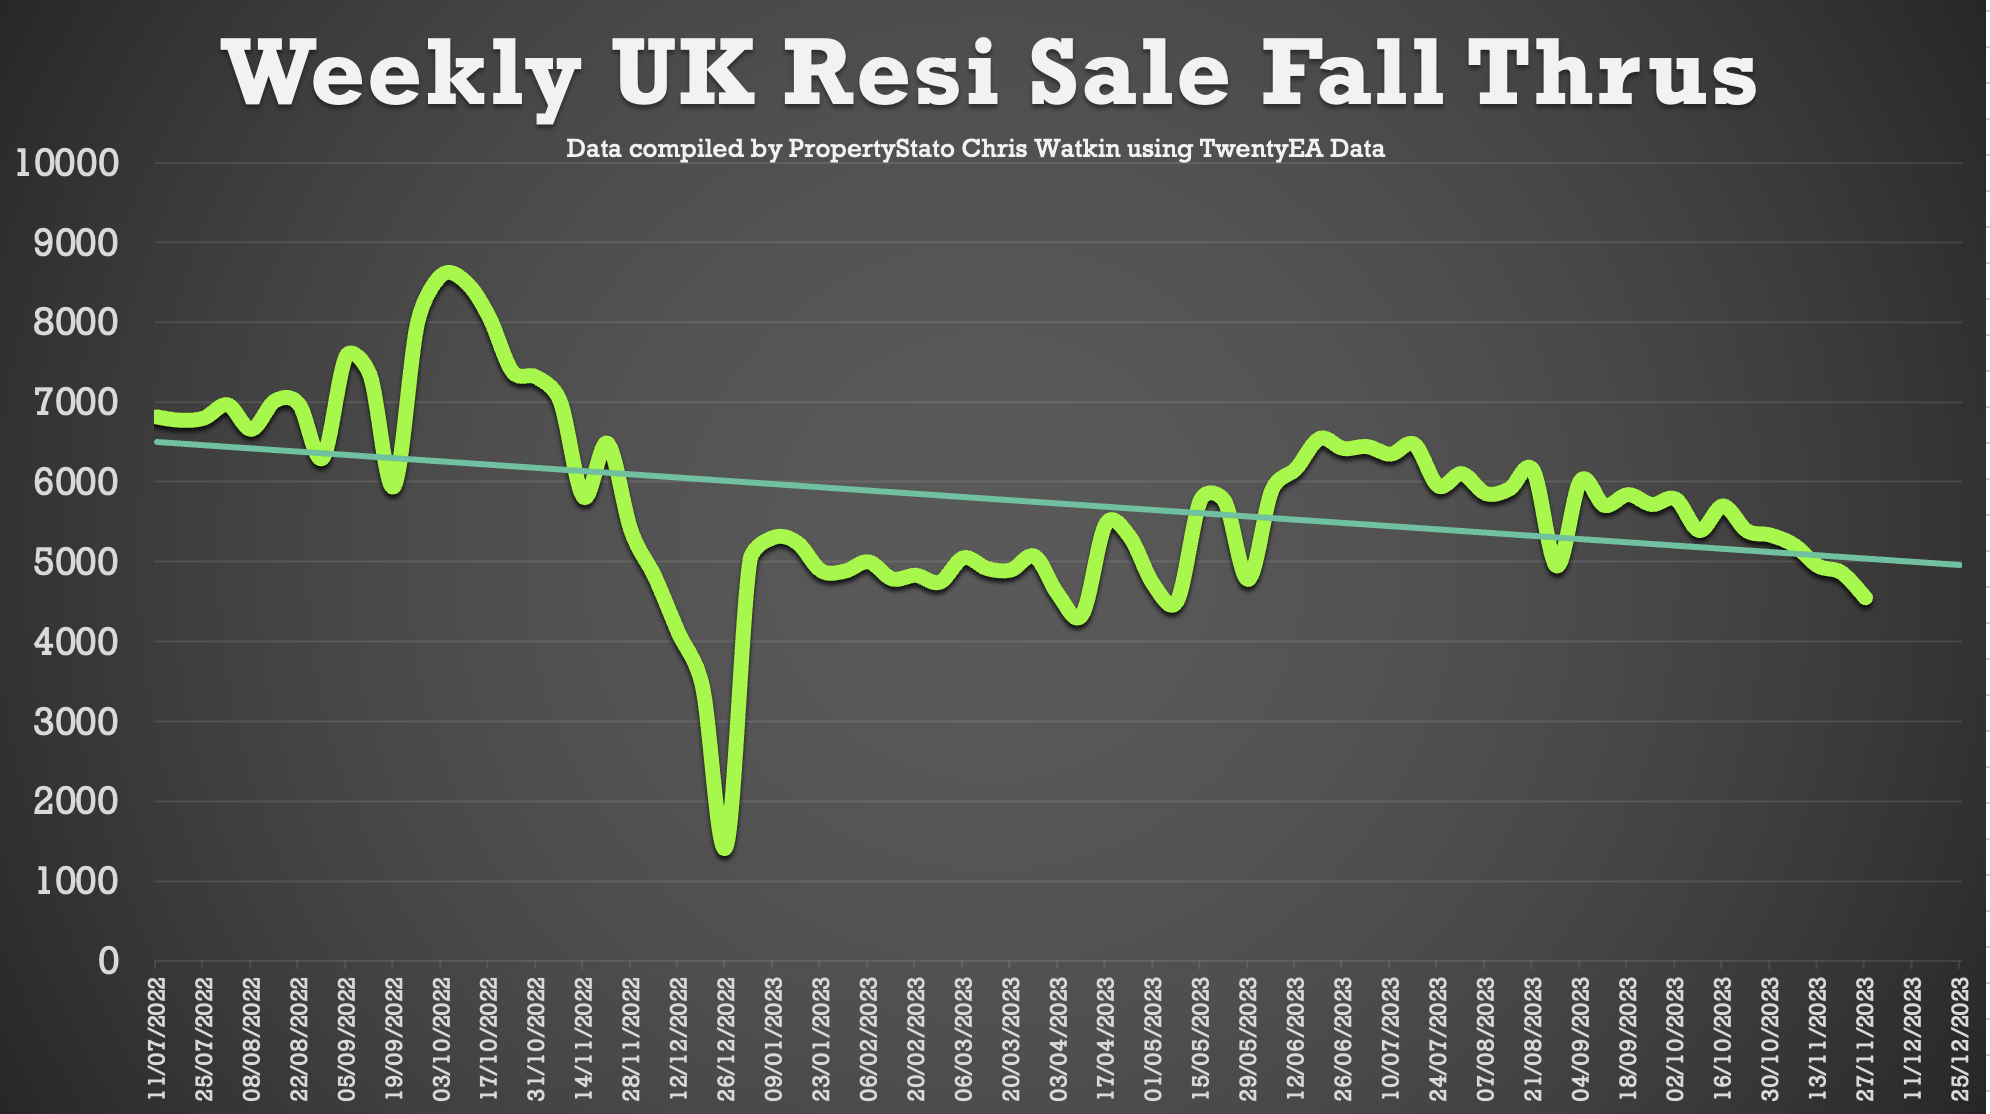
+ Sale fall throughs (Units): there were 4,548 Sale Fall Throughs, which is lower to last week’s at 4,863. The running 4-week average for Sale Fall Thrus is 4,892 and the YTD figure average of 5,407
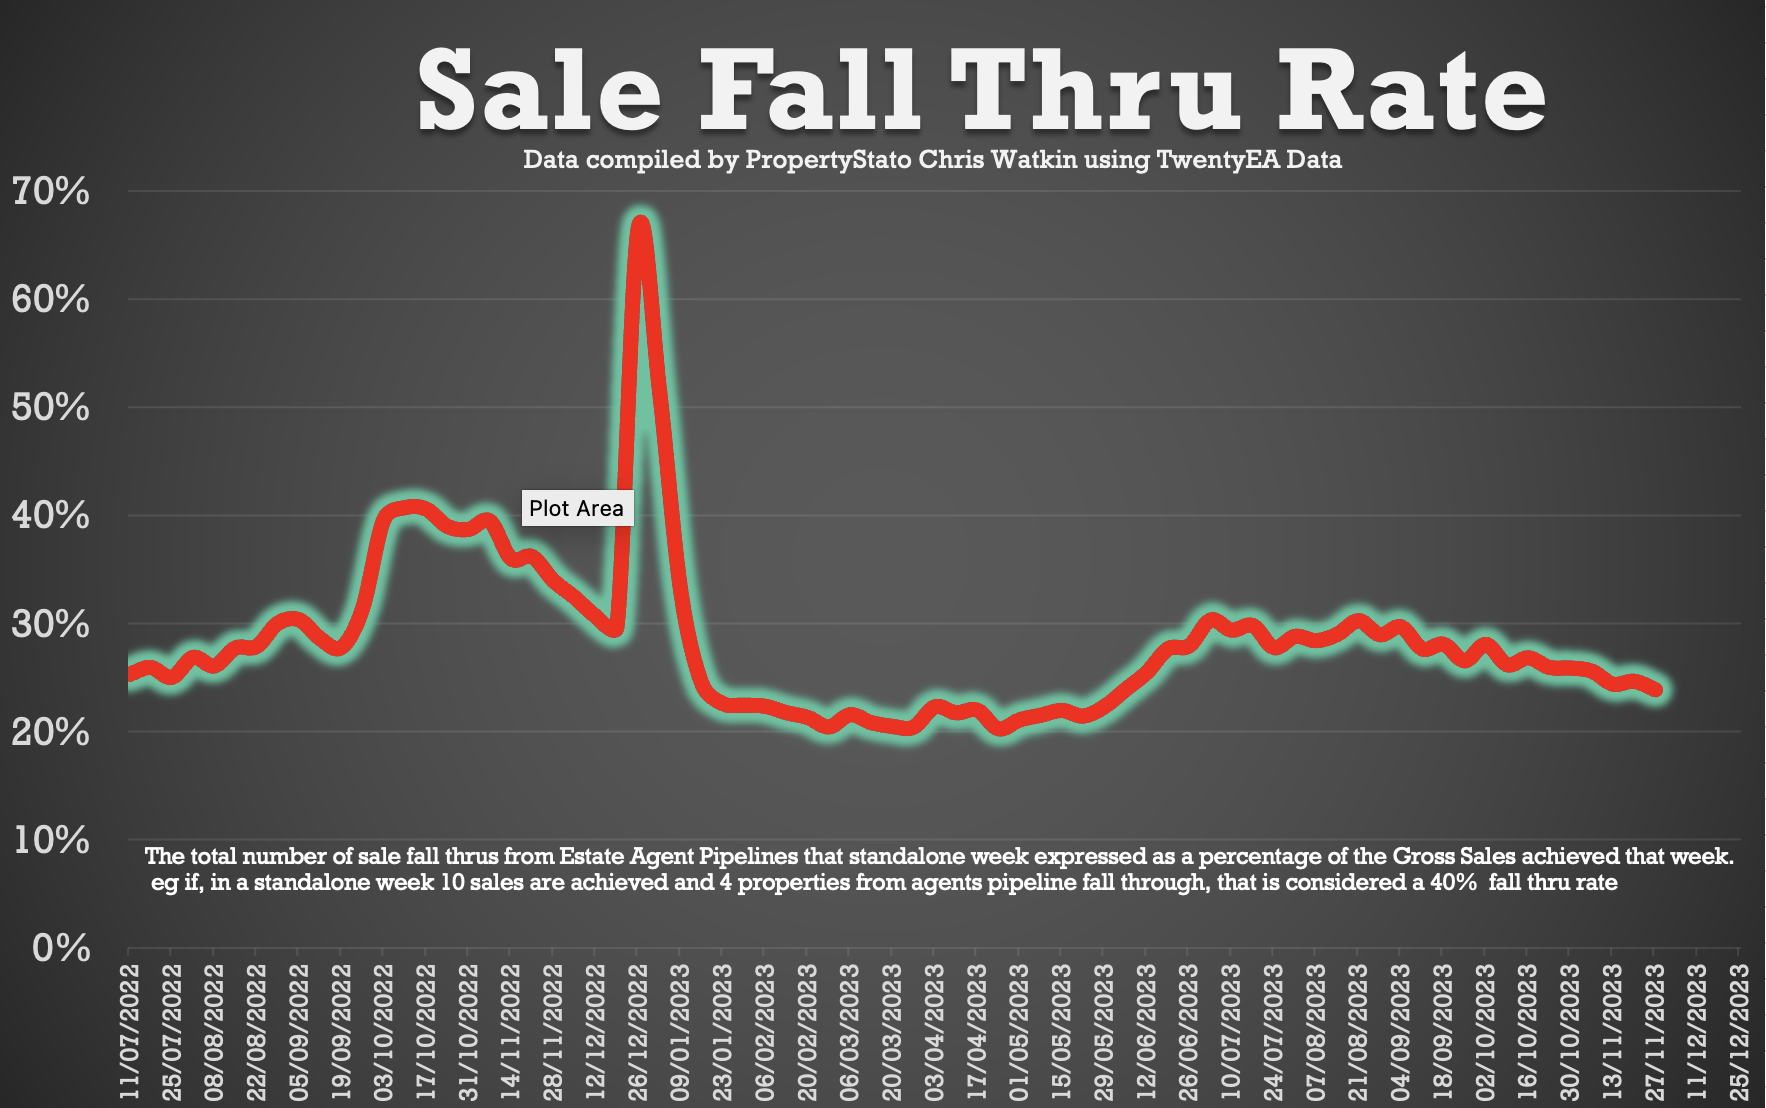
· Sale Fall Through’s (%): The Sale fall Through Rate % is the number of ‘sales fall throughs’ for the week expressed as a percentage of Gross Sales for the week). This week it was at 23.87%. This is a continuation of drop that started in early August 2023 when it was in the early 30%’s. The 2023 running weekly average is 25.61%. Let us not forget, in the same week of 2022, it was 33.96%). The seven-year long-term average is 24.3%.

· Net Sales This Week: Net Sales remained roughly the same as last week at 14,509, excellent when compared to the running two month average to 15,158. YTD running weekly average is 16,129. For comparison, there were 10,473 in net sales for the same week in 2022.
In the last 20 minutes of the show, there is the usual local focus, and this week it is on Cleethorpes & Grimsby in NE Lincolnshire


Comments (3)
Net Sales as % listing
INNER LONDON Net Sales as % listing 50.48% (compared to Running YTD average of 34.60% )
OUTER LONDON Net Sales as % listing 59.46% (compared to Running YTD average of 43.40% )
SOUTH EAST Net Sales as % listing 64.26% (compared to Running YTD average of 47.10% )
SOUTH WEST Net Sales as % listing 69.25% (compared to Running YTD average of 50.60% )
EAST OF ENGLAND Net Sales as % listing 67.99% (compared to Running YTD average of 45.80% )
EAST MIDLANDS Net Sales as % listing 59.76% (compared to Running YTD average of 48.90% )
WEST MIDLANDS Net Sales as % listing 72.03% (compared to Running YTD average of 52.60% )
YORKSHIRE & HUMBER Net Sales as % listing 69.63% (compared to Running YTD average of 56.30% )
NORTH EAST Net Sales as % listing 62.86% (compared to Running YTD average of 55.60% )
NORTH WEST Net Sales as % listing 61.63% (compared to Running YTD average of 53.50% )
WALES Net Sales as % listing 72.03% (compared to Running YTD average of 52.60% )
SCOTLAND Net Sales as % listing 97.74% (compared to Running YTD average of 77.40% )
% Sales that fell thru
INNER LONDON % Sales that fell thru 20.03% (compared to Running YTD average of 27.00% )
OUTER LONDON % Sales that fell thru 27.80% (compared to Running YTD average of 29.20% )
SOUTH EAST % Sales that fell thru 25.90% (compared to Running YTD average of 28.00% )
SOUTH WEST % Sales that fell thru 24.85% (compared to Running YTD average of 27.20% )
EAST OF ENGLAND % Sales that fell thru 24.13% (compared to Running YTD average of 27.80% )
EAST MIDLANDS % Sales that fell thru 23.38% (compared to Running YTD average of 25.40% )
WEST MIDLANDS % Sales that fell thru 22.74% (compared to Running YTD average of 26.40% )
YORKSHIRE & HUMBER % Sales that fell thru 22.98% (compared to Running YTD average of 23.60% )
NORTH EAST % Sales that fell thru 23.45% (compared to Running YTD average of 23.60% )
NORTH WEST % Sales that fell thru 28.10% (compared to Running YTD average of 27.60% )
WALES % Sales that fell thru 29.81% (compared to Running YTD average of 27.00% )
SCOTLAND % Sales that fell thru 12.38% (compared to Running YTD average of 13.30% )
Gross Sales as % of Listings –
INNER LONDON Gross Sales as % of Listings – 63.12% (compared to Running YTD average of 47.05% )
OUTER LONDON Gross Sales as % of Listings – 82.36% (compared to Running YTD average of 61.05% )
SOUTH EAST Gross Sales as % of Listings – 86.72% (compared to Running YTD average of 65.13% )
SOUTH WEST Gross Sales as % of Listings – 92.15% (compared to Running YTD average of 69.19% )
EAST OF ENGLAND Gross Sales as % of Listings – 89.62% (compared to Running YTD average of 63.06% )
EAST MIDLANDS Gross Sales as % of Listings – 77.99% (compared to Running YTD average of 65.07% )
WEST MIDLANDS Gross Sales as % of Listings – 93.23% (compared to Running YTD average of 71.28% )
YORKSHIRE & HUMBER Gross Sales as % of Listings – 90.40% (compared to Running YTD average of 73.49% )
NORTH EAST Gross Sales as % of Listings – 82.12% (compared to Running YTD average of 72.71% )
NORTH WEST Gross Sales as % of Listings – 85.73% (compared to Running YTD average of 73.82% )
WALES Gross Sales as % of Listings – 87.12% (compared to Running YTD average of 74.52% )
SCOTLAND Gross Sales as % of Listings – 111.54% (compared to Running YTD average of 89.34% )