
 A significant drop in prime London rental stock is placing upward pressure on rents, new data shows.
The number of properties available to rent across prime London in September was down 67.8% in September compared with the same month last year and 37.6% lower than September 2019.
Rents over the corresponding period were 11.7% higher than a year ago. This is the highest annual change in achieved rents in prime London for more than 10 years. The previous high of 11.8% was recorded in January 2011.
This also means that achieved rents are now back to their pre-lockdown peak, with values across prime London 0.4% higher in September 2021 than the February 2020 peak.
It also represents a significant turnaround in fortunes for the prime rental market which just over six months ago was reporting annual falls in achieved rents of 19%.
While stock levels are down across the whole of prime London some areas have been particularly hard hit. In Battersea, Clapham and Wandsworth the number of properties available to rent was down by almost two-thirds – 66.5% – compared to September 2019 and 66.6% on 2020 figures.
North of the river in Pimlico, Westminster and Victoria, annual stock levels were down 65.2% on September 2019 and by 71% on 2020.
Properties new to the market and which add to the overall rental stock, have fallen too. So far this year there have been 15% fewer new listings compared with 2020 and 27% fewer than the five-year – 2015-2019 – January to September average.
Against this backdrop, tenants have looked to renew their lease rather than move. This in turn has led to a fall in the number of properties let. The number of properties let in Q3 2021 was down 6% on the same three months in 2020 and 13% lower than 2019.
Increased competition from tenants chasing fewer properties, means that rent discounts have fallen too. In September an average of 2.4% was negotiated off initial asking rents, this in contrast to March when average discounts were running at 10%.
Looking ahead we expect low stock levels to result in further increases in achieved rents over the coming months. And with rental growth outpacing increases in sales prices, rental yields could rise further too.
Table 1 – Stock on the market to let by area
| Change vs. 2019 | Change vs. 2020 | |
| Battersea, Clapham & Wandsworth | -66.5% | -66.6% |
| Bayswater & Maida Vale | -9.8% | -63.4% |
| Chelsea | -21.9% | -67.7% |
| Fulham & Earls Court | -46.5% | -54.1% |
| Hammersmith & Chiswick | -51.7% | -65.3% |
| Hampstead | -45.7% | -65.1% |
| Kensington, Notting Hill & Holland Park | -28.2% | -58.9% |
| Knightsbridge & Belgravia | -11.5% | -56.8% |
| Marylebone & Fitzrovia | -1.5% | -76.8% |
| Mayfair & St James’s | -41.3% | -66.4% |
| Pimlico, Westminster & Victoria | -65.2% | -71.0% |
| South Kensington | -29.1% | -65.2% |
| St Johns Wood, Regents Park & Primrose Hill | -48.8% | -74.6% |
| Vauxhall, Nine Elms, Borough & Kennington | -50.3% | -72.7% |
| All Prime London | -37.6% | -67.8% |
Source: LonRes
In terms of the prime London property sales market, 2021 has been a busy year for transactions across prime London. The number of properties sold between January and September reached its highest level since 2014, 66% higher than the same period in 2020 and 32% up on the five-year (2015 to 2019) average. Indeed, the number of properties sold in the first nine months of 2021 was 11% higher than the total sales recorded for the whole of 2020 and just 3% lower than the whole of 2019.
This said sales have been skewed to the first half of the year. As the stamp duty holiday came to an end (30 June) so the number of properties sold fell back – sales in Q3 2021 were down by 8% on Q3 2020 and 13% lower than the 2015 to 2019 Q3 average (chart2 ).
Yet the upper end of the market remained busy. Over Q3 2021, there were 15% more sales between £2 million and £5 million and 39% more at £5 million + compared with the Q3 five-year (2015 to 2019) average (chart 2). Indeed, Q3 2021 was the busiest third quarter for £5 million+ sales since 2013.
In September achieved prices rose by 1.0% for flats and 4.6% for houses compared with the same month in 2020. Properties across the board rose by an average of 2.1% (table 2).
The number of new properties reaching the market over the last three months was 3% higher than the Q3 five-year average but stock on the market fell 7.4% compared with the same point a year ago.
Improving market conditions have meant that buyers were unable to negotiate significant discounts on asking prices. Over Q3 2021 the average discount achieved off initial asking price fell to 6.9%, down from 7.2% in Q2 2021 and the lowest since Q4 2015.
Looking ahead under offer data, a lead indicator, suggests activity could rise again as we move into the autumn and winter. The number of properties put under offer has been higher than the five-year (2015 to 2019) average every month bar July this year. With the number of properties under offer up 12% in August and 11% in September compared with 2020 levels.
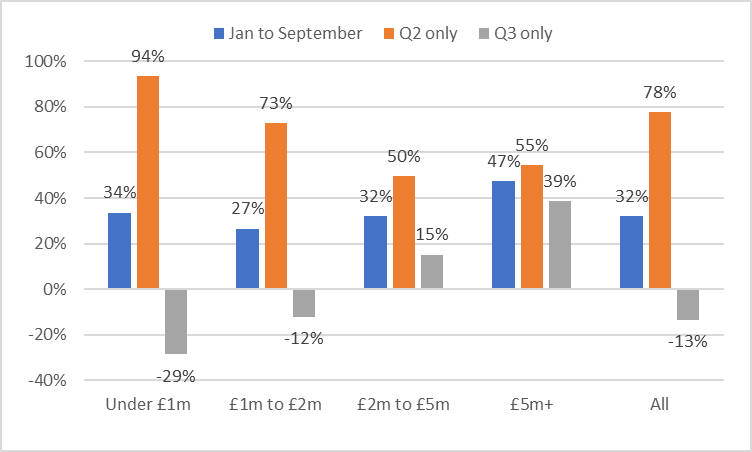
Table 2 – Annual change in achieved prices
| Flats | Houses | All | |
| Q1 21 | -3.6% | -3.3% | -4.5% |
| Q2 21 | -5.3% | 1.0% | -4.3% |
| Q3 21 | 4.2% | 8.9% | 5.9% |
| Sep-21 | 1.0% | 4.6% | 2.1% |
Source: LonRes


