

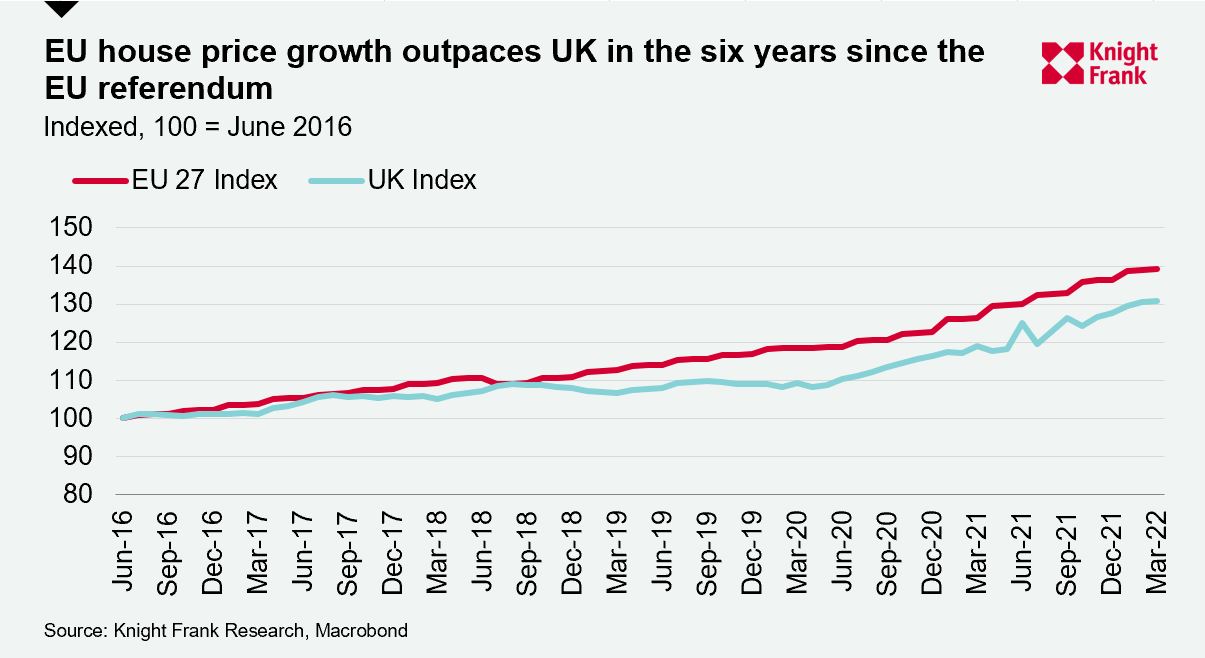
Today marks the sixth anniversary of the Brexit referendum, and so have the UK and Europe’s housing markets fared since the Leave campaign won 52% of the vote?
Fresh research by Knight Frank reveals that house prices are up 39.3% across the EU-27 with almost half the rate of growth occurring in the last two years during the pandemic. The UK’s rate of growth is not far behind with prices up 30.8% over the six-year period.
Based on the data provided, 12 of the 27 markets have witnessed price growth in excess of 50% since 2016, with Germany, Ireland and Portugal amongst them.
A prolonged period of low interest rates, significant fiscal stimulus across the region during the Covid-19 crisis which led to accumulated savings and limited new supply, exacerbated by the pandemic has seen prices climb.
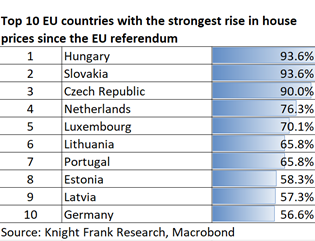 A look at the top-performing countries since the Brexit vote in June 2016 reveals Central Europe is on top with Hungary, Slovakia and the Czech Republic each registering price growth above 90%.
As monetary policy tightens, the rate of growth across the UK and the EU is expected to slow.
Italy, Spain and Greece have recorded some of the lowest rates of price growth in the last six years and the higher cost of finance may see price growth in these markets fall into negative territory.
With the EU expected to be slower to increase interest rates – the first hike slated to be in July – and the US and UK amongst the fastest there may be a currency play for some overseas buyers looking to take advantage of a weaker euro, according to Knight Frank.

This graph is manipulated to start both the EU and UK at the same start point in 2016, which makes the graph misleading.
The EU have always had faster growth in nominal terms, because they print more money than the UK. More money printing means more inflation. More inflation means higher house prices.
This graph should also compare the price of some other goods, like food and clothes, to be a point of reference. Also, take the graph back to 2000 and re-run it. Then we can better see if the time after 2016 was special or different than normal.
It’s almost like this graph is not trying to get to the truth, but push forward a point of view toward those willing to hear it without questioning it.
You must be logged in to like or dislike this comments.
Click to login
Don't have an account? Click here to register
Who cares? Why would Brexit have affected house prices? ……………. it clearly hasn’t!
You must be logged in to like or dislike this comments.
Click to login
Don't have an account? Click here to register