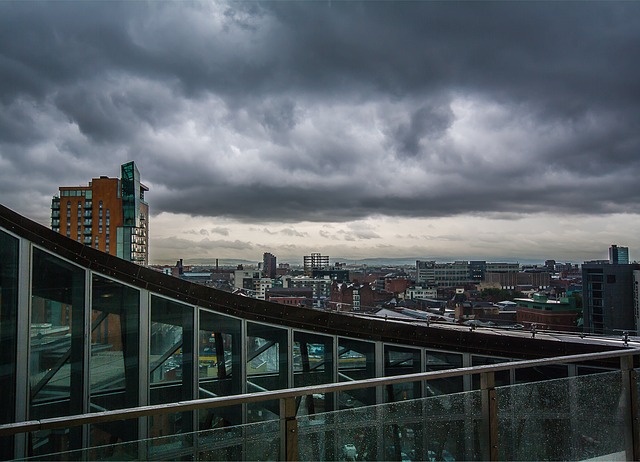
Manchester has recorded the strongest house price growth of any major British city over the past decade, while London has seen the weakest increase, according to new analysis from Rightmove.
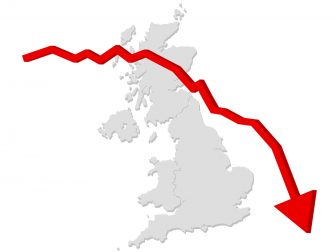
The property portal found that average asking prices in Manchester have risen by 63% over the last 10 years, climbing from £160,422 to £261,891. By comparison, average asking prices in London have increased by just 7% over the same period, from £639,593 to £687,080.
Rightmove’s analysis of millions of property listings, enquiries and pricing records also highlights a widening north-south divide in housing market performance. None of the top 10 fastest-growing cities for house prices are located in southern England, while five of the 10 slowest-growing cities are in the South.
The study found that the four local areas with the strongest price growth over the past decade are all in Greater Manchester. Asking prices in Levenshulme, Atherton, Droylsden and Failsworth have each risen by around 80% since 2016.
Outside Manchester, Wolverhampton, Newport and Nottingham were among the cities recording the largest price increases. Rightmove said affordability continues to play a significant role in driving demand, with buyers increasingly looking beyond higher-priced urban centres in search of better value.
The data also points to a “spillover” effect from major cities into neighbouring locations. Areas such as Salford, Wolverhampton, Wakefield and Bradford have benefited from their proximity to larger employment centres while offering more affordable housing options.
According to Rightmove, long-term changes in working patterns, including the growth of hybrid and remote working, have also influenced where buyers choose to live, reducing the need for some workers to remain close to traditional employment hubs such as London.
Rightmove’s Colleen Babcock said: “Manchester is a big winner of the past decade, with strong price growth underlining its growing popularity among buyers. By contrast, London has seen much slower growth over the same period, reflecting how higher prices in the capital have limited how much further buyers can stretch.
“Looking at the bigger picture, affordability has been a central theme shaping these trends. Areas with lower starting price points have had more room for growth, which has contributed to a widening north-south divide in price growth trends over the last ten years.
“Some of the shifts behind this are continuing to play out, particularly changes in working patterns. Greater flexibility through hybrid and remote working is still influencing where people choose to live, supporting demand in cities that offer better value and a different lifestyle balance.”
Cities with the fastest 10-year price growth
| City | Average price 2026 | 10-year price change |
| Manchester | £261,891 | +63% |
| Wolverhampton | £229,094 | +63% |
| Newport | £235,275 | +57% |
| Nottingham | £210,238 | +53% |
| Wakefield | £231,581 | +52% |
| Salford | £226,559 | +52% |
| Bradford | £171,282 | +51% |
| Stoke-On-Trent | £174,850 | +49% |
| Doncaster | £186,378 | +49% |
| Swansea | £215,866 | +48% |
Source: Rightmove