In Week 27 of the UK property market, I am joined by Rob Smith, the managing director of Hunters, Northwood and Whitegates at The Property Franchise Group, to take a forensic look at what is really happening beneath the UK Property market headlines.
Discussed at length in this week’s show, we analyse the market itself. Sales remain remarkably steady, better than 2023, yet below 2024/5 levels for the time of year. Buyers are still buying, sales are still being agreed and the market is functioning. Yet there is a huge difference between a functioning market and a forgiving one.
The biggest problem is not a lack of buyers, it is the continued overvaluing of homes by agents who are more frightened of losing the instruction than they are of telling the vendor the truth. Too many properties are coming to market at prices based on aspiration, ego or what the seller needs, rather than what today’s buyers are actually prepared to pay.
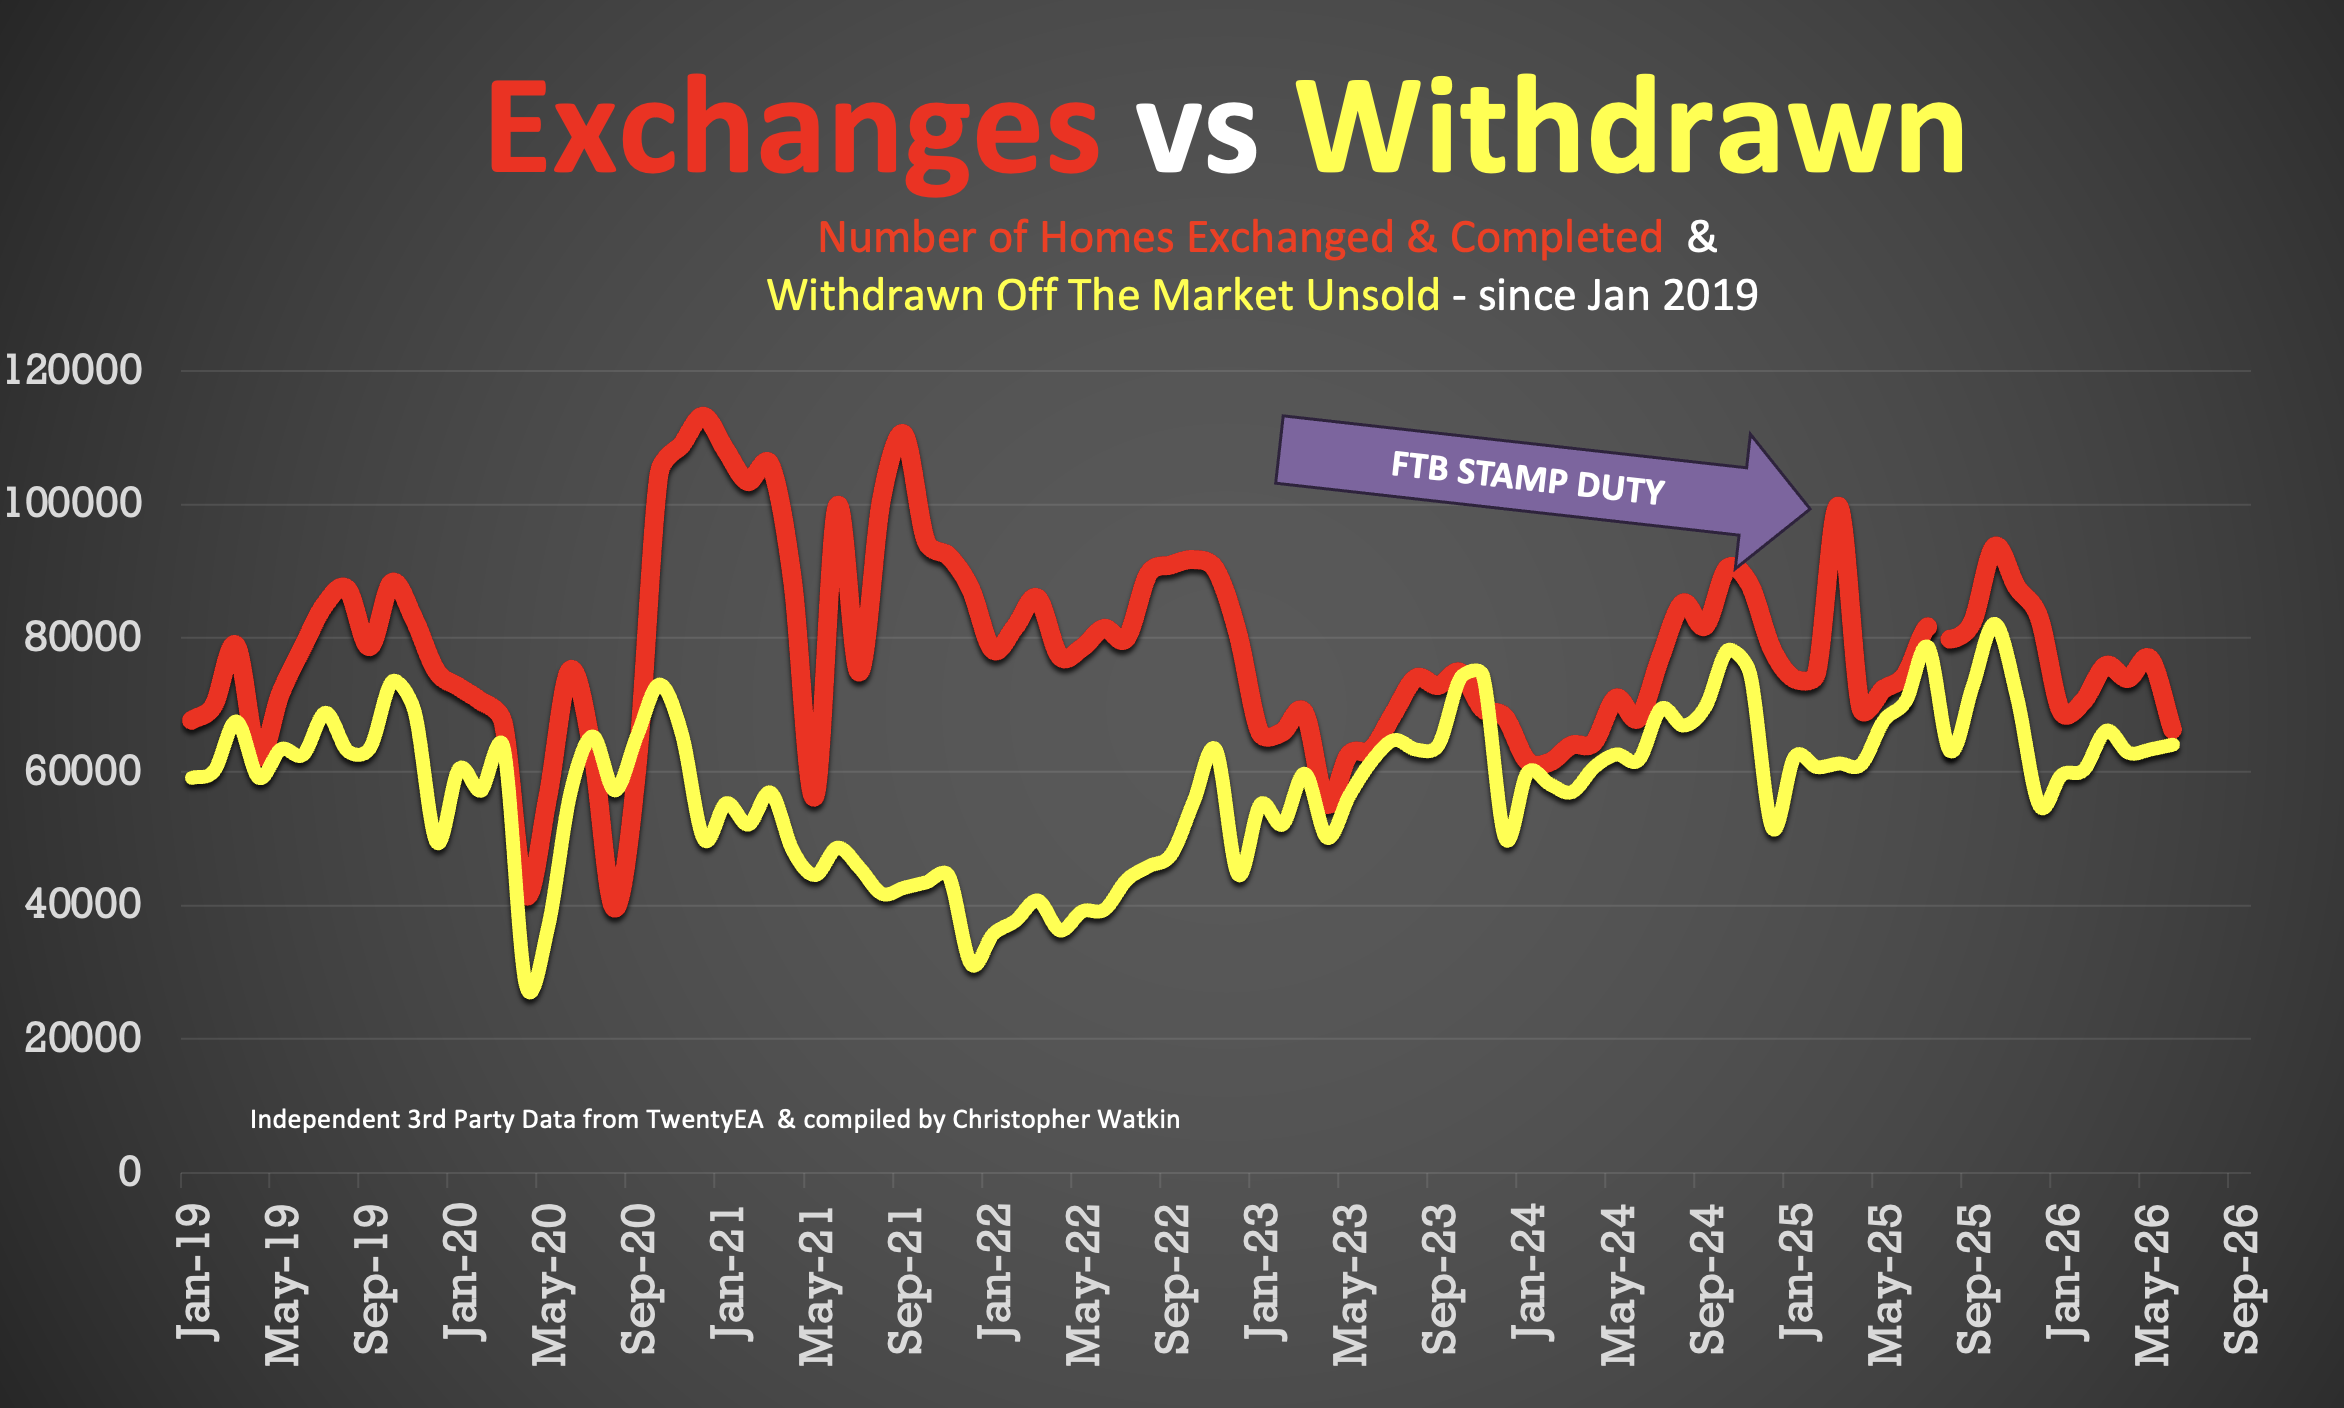
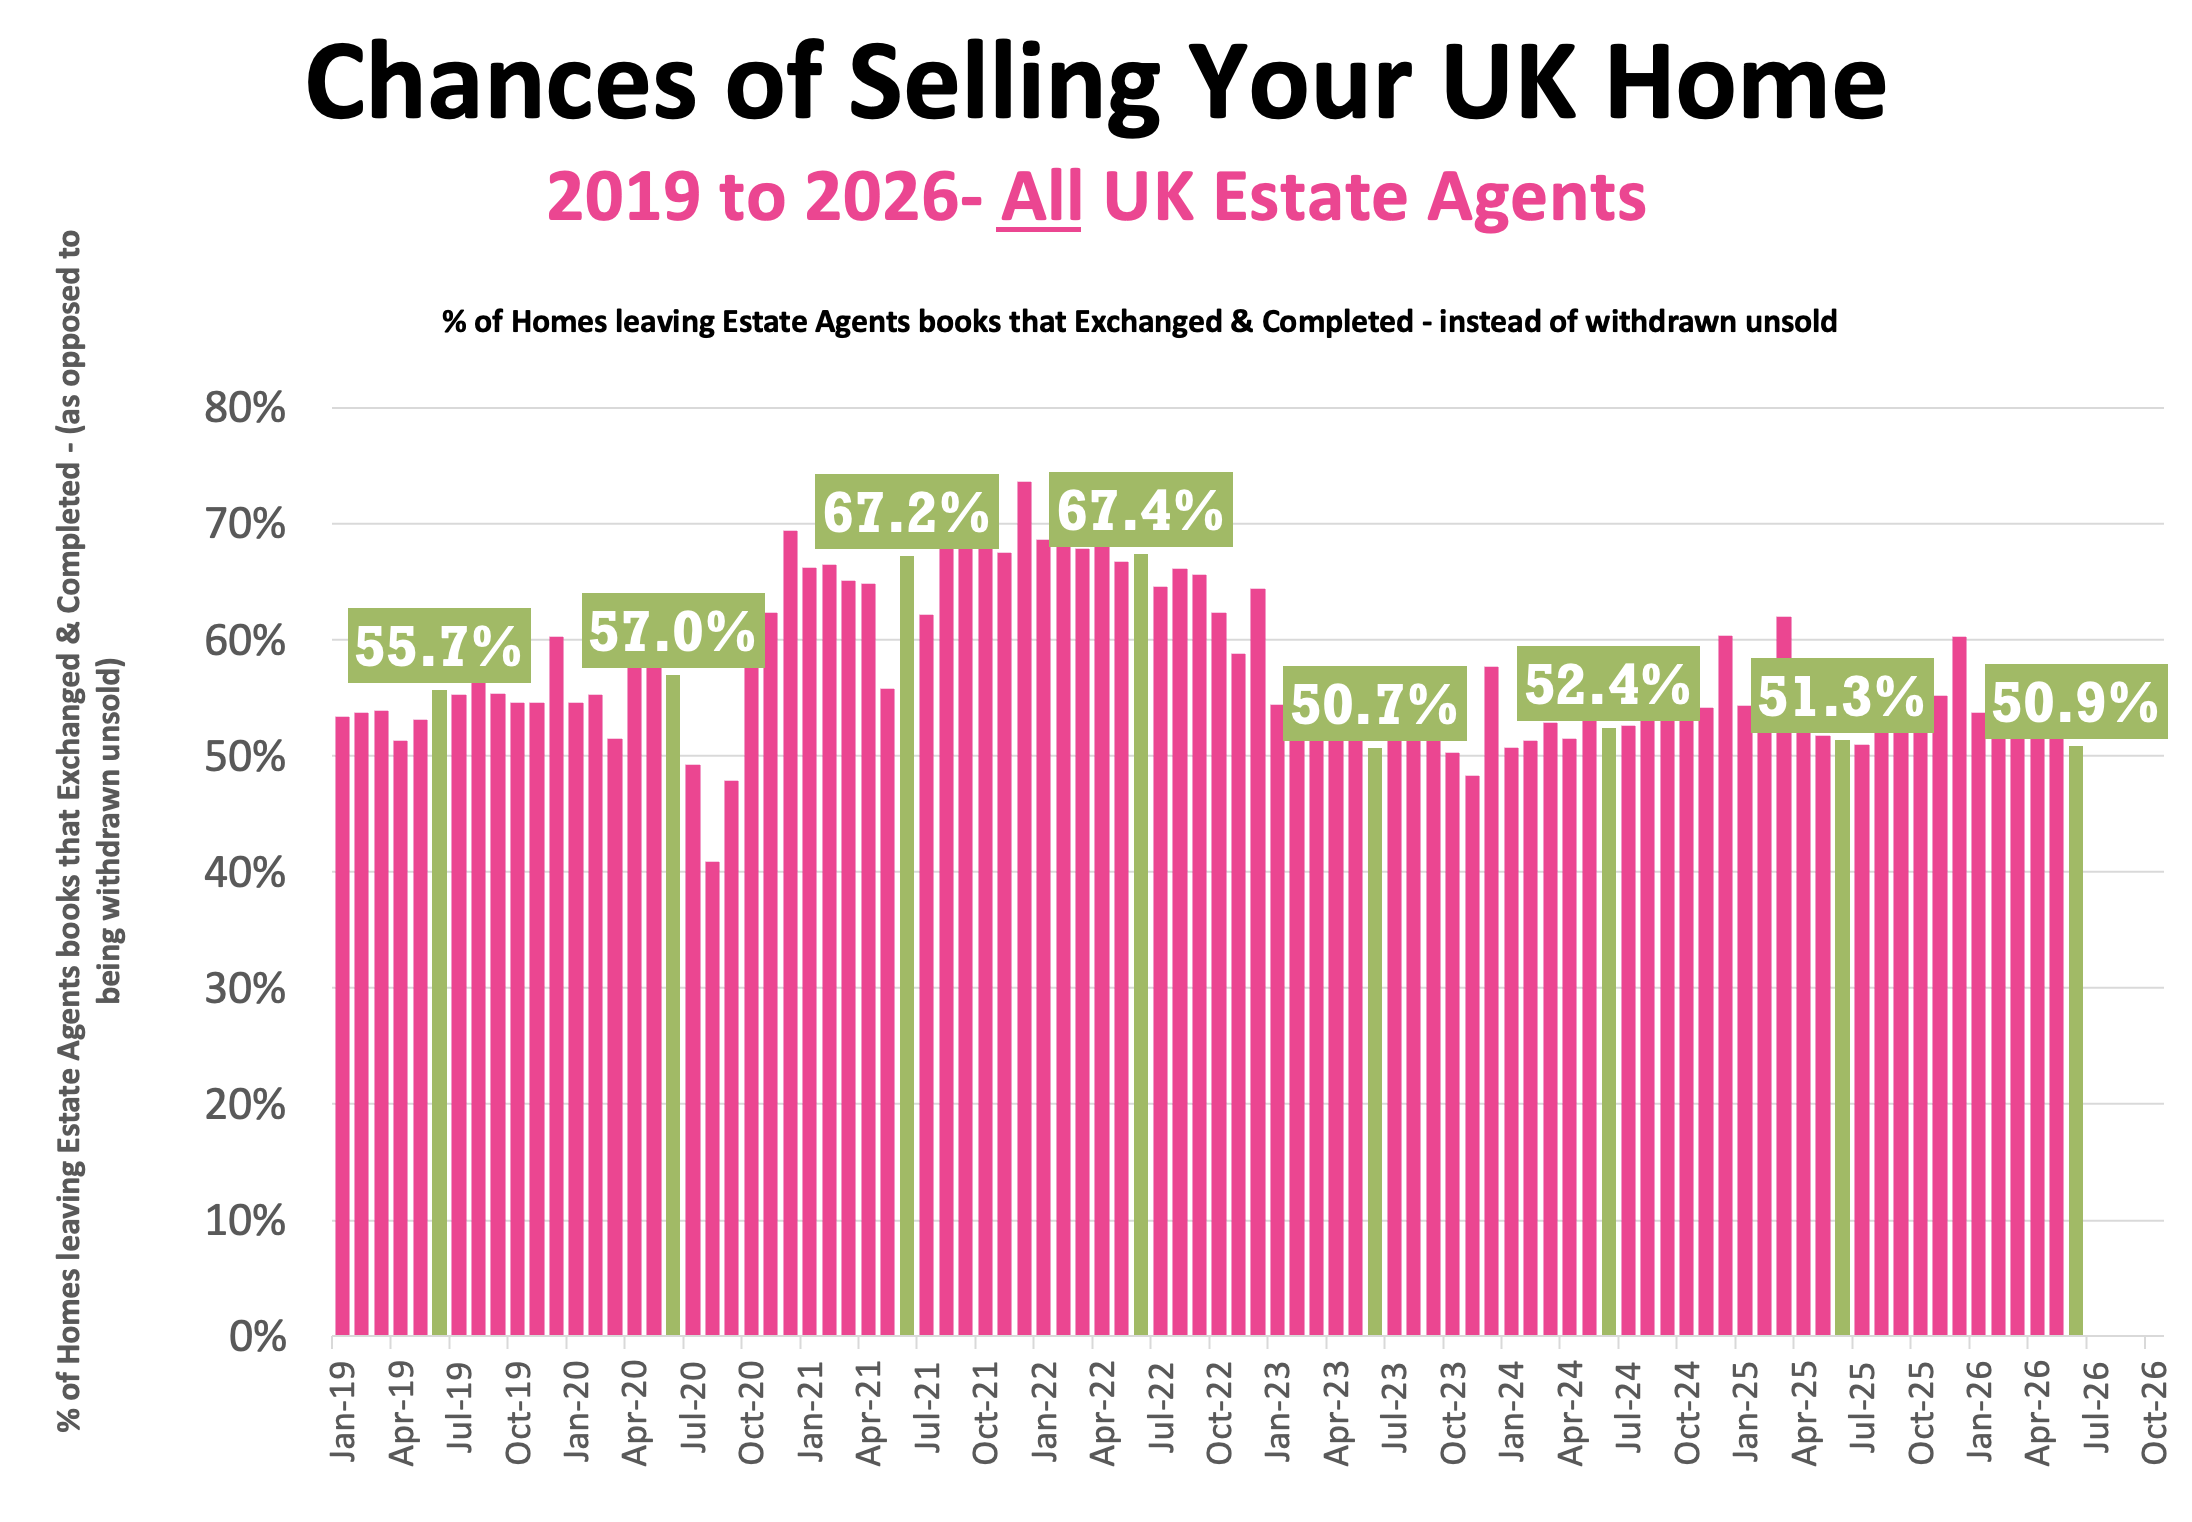
That matters because only around 50% of homes that leave estate agents’ books go on to exchange & complete. For the average home seller, putting a home on the market has effectively become a flip of a coin. Heads, they move. Tails, the property is withdrawn, reduced too late or left languishing until the seller loses confidence in both the price and the agent. It is black or red on the roulette table, except selling a home should never be treated as a game of chance.
The uncomfortable truth is that many of these failures are avoidable. Accurate pricing from day one creates urgency, competition and momentum. Let us not forget all the homes that are coming to the market in 20 26th are currently source of the contract, 80.1% of them didn’t have a price reduction. Overpricing destroys all three. In a market with high levels of stock and buyers enjoying more choice, the agents who win will not be those who promise the highest price. They will be the ones with the courage, evidence & skill to recommend the right price.
All discussed in the show with solutions on how to beat overvaluing and cheap fee competitors.
So, here are the property market stats for week 27, week ending 12th July 2026.
🟩 Listings
Week 27 ..
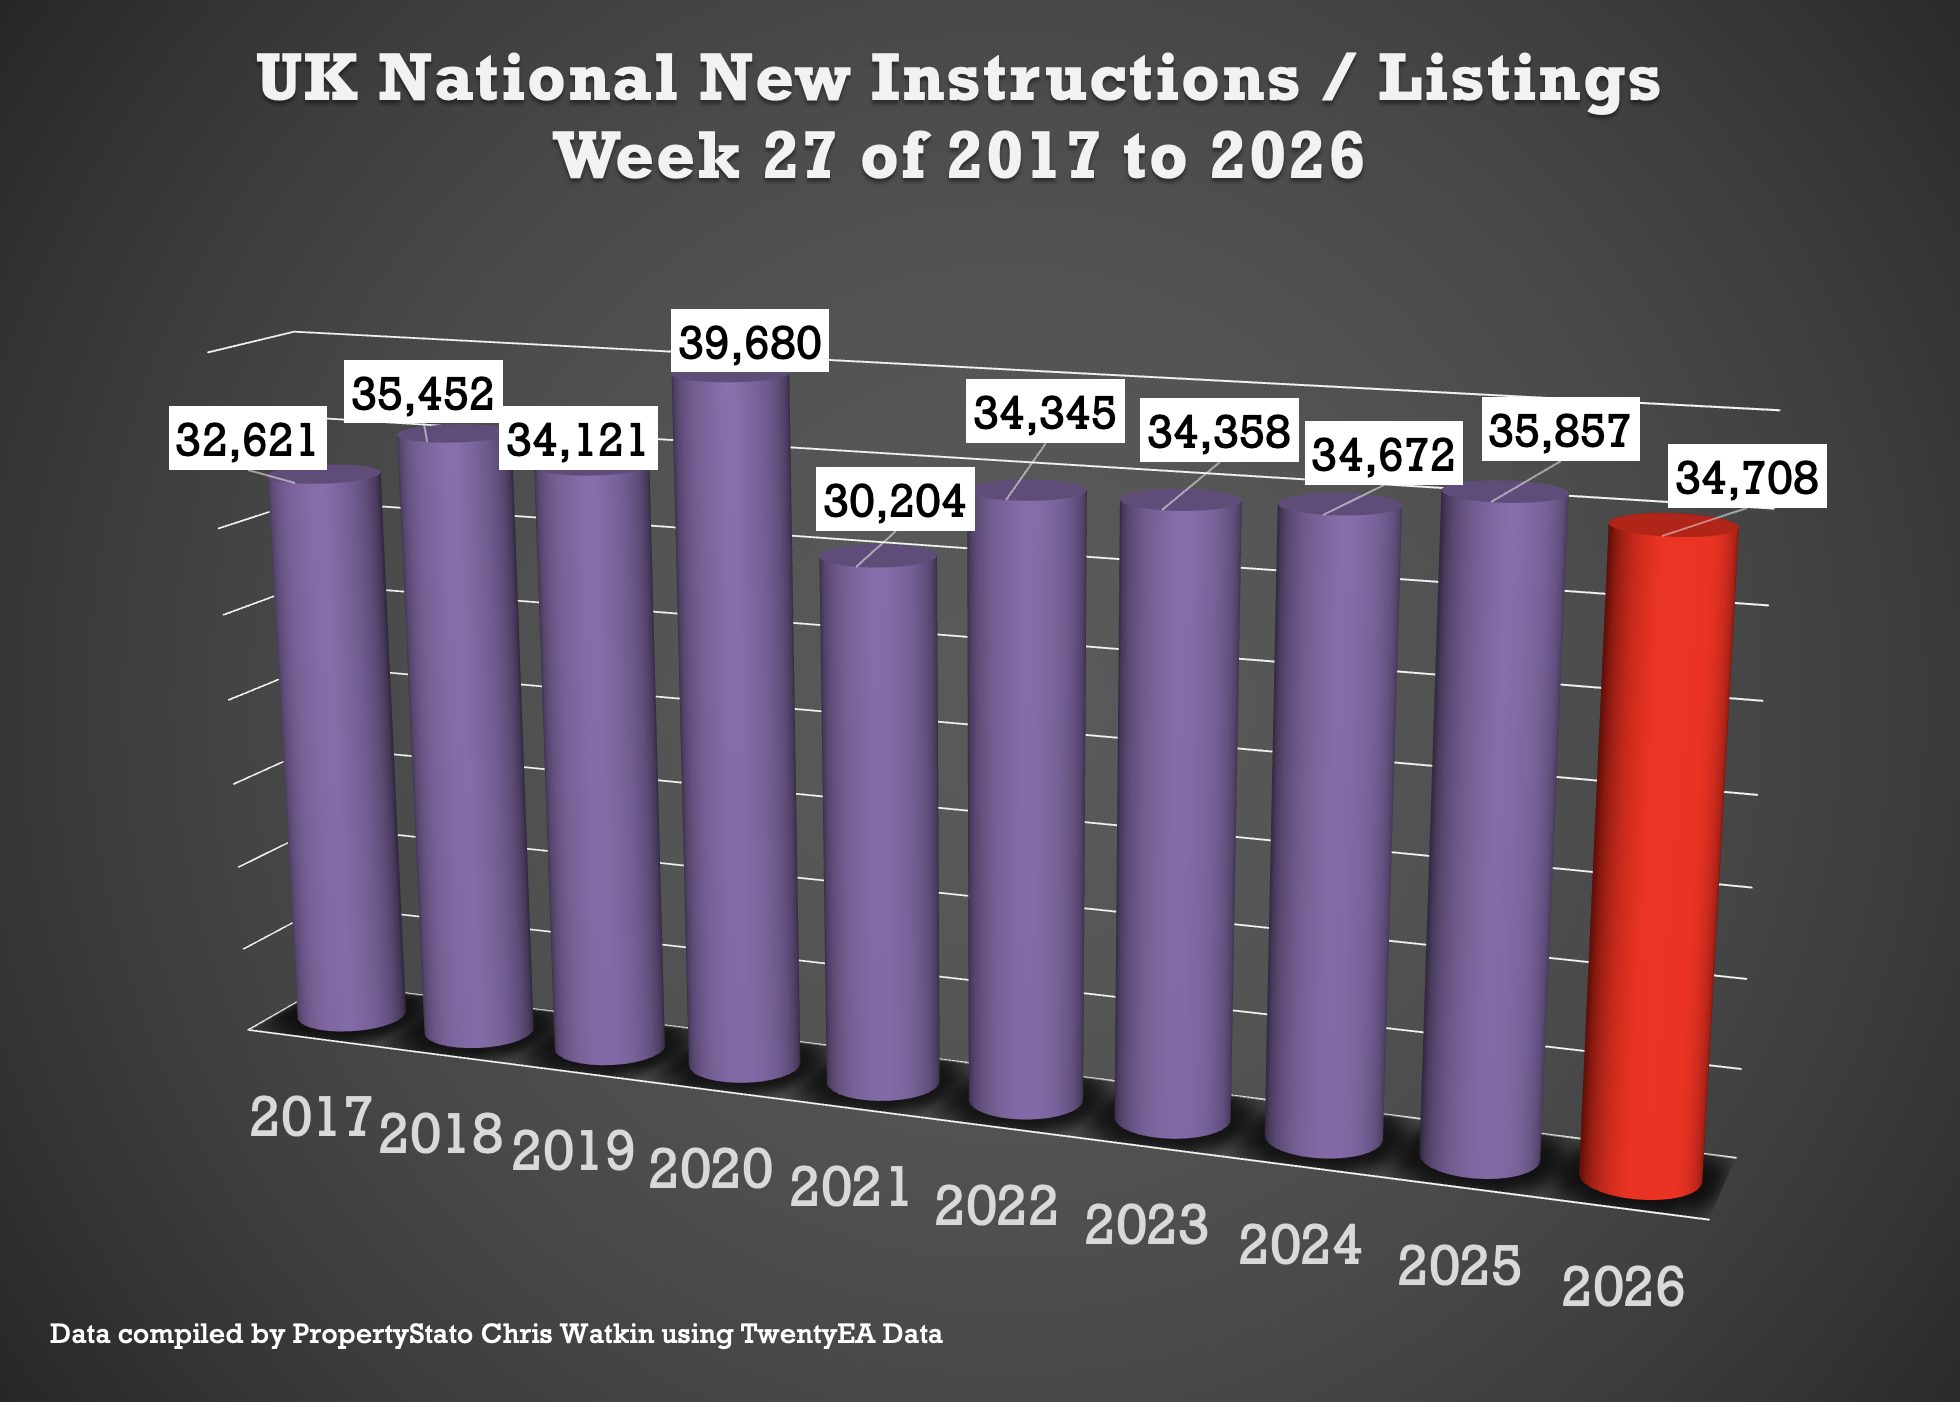
34.7k new listings this week, (36.5k last week).
Weekly 2026 average : 37.1k.
10 year week 27 average : 34.6k
Year to Date
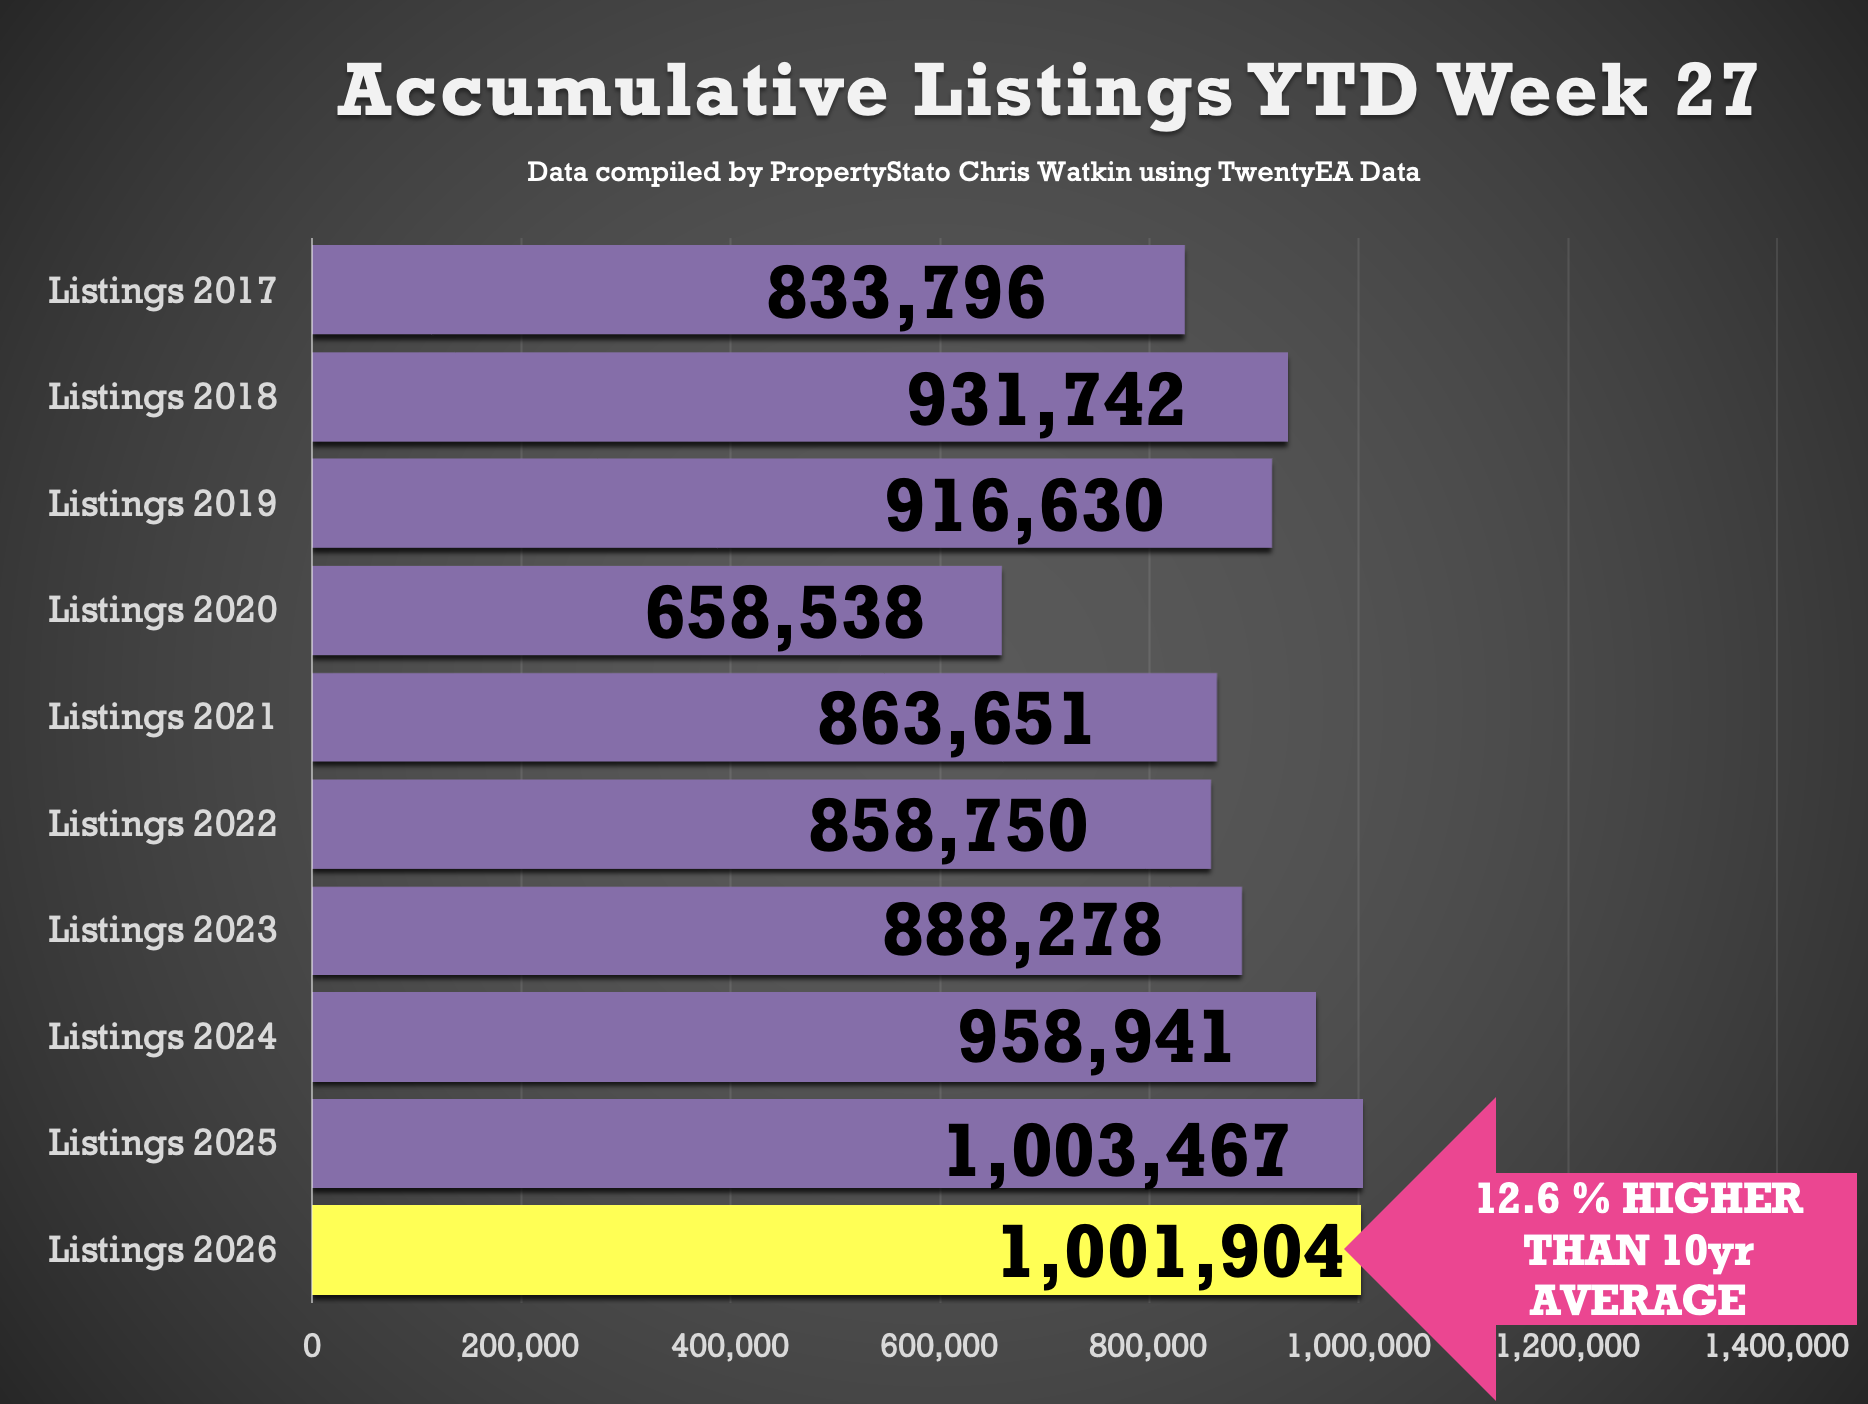
1,001,904 new listings YTD
Identical to 2025 YTD (1,003,467)
4.5% ahead of 2024 YTD (959k)
12.1% higher than the 2017–19 average YTD (894k).
🟩 UK Gross Resi Sales
Week 27 ..
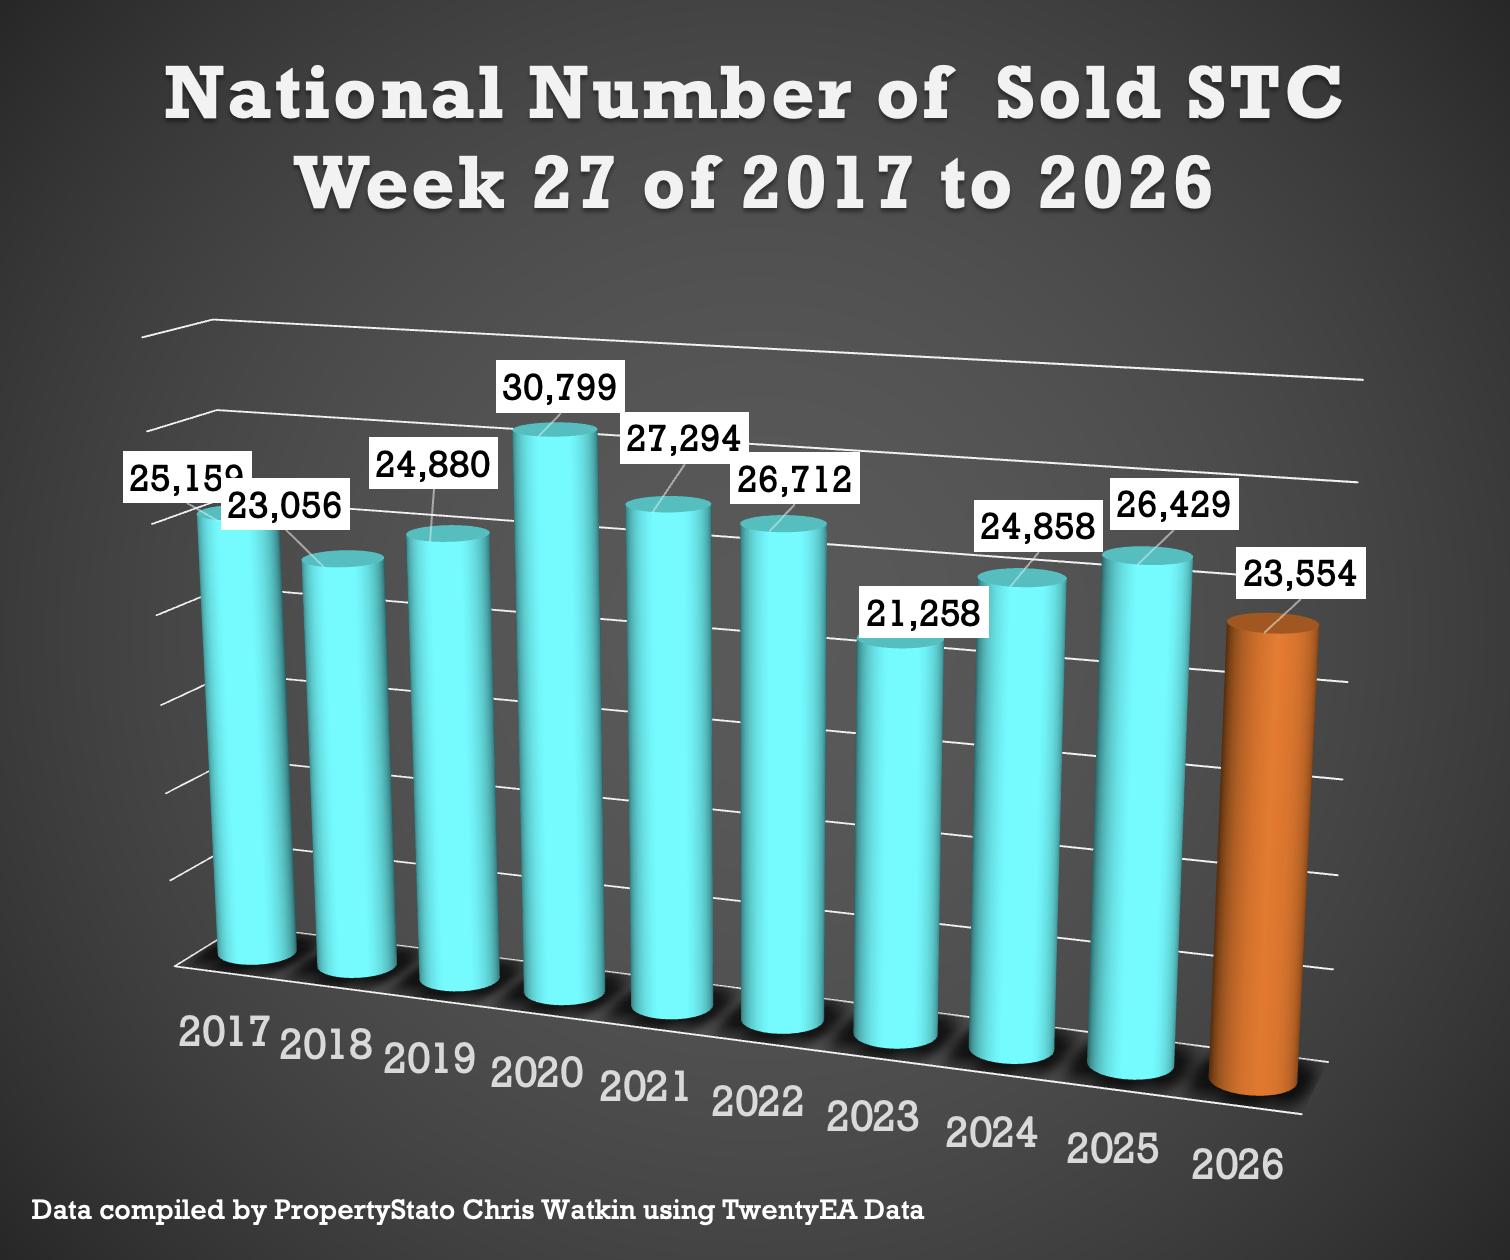
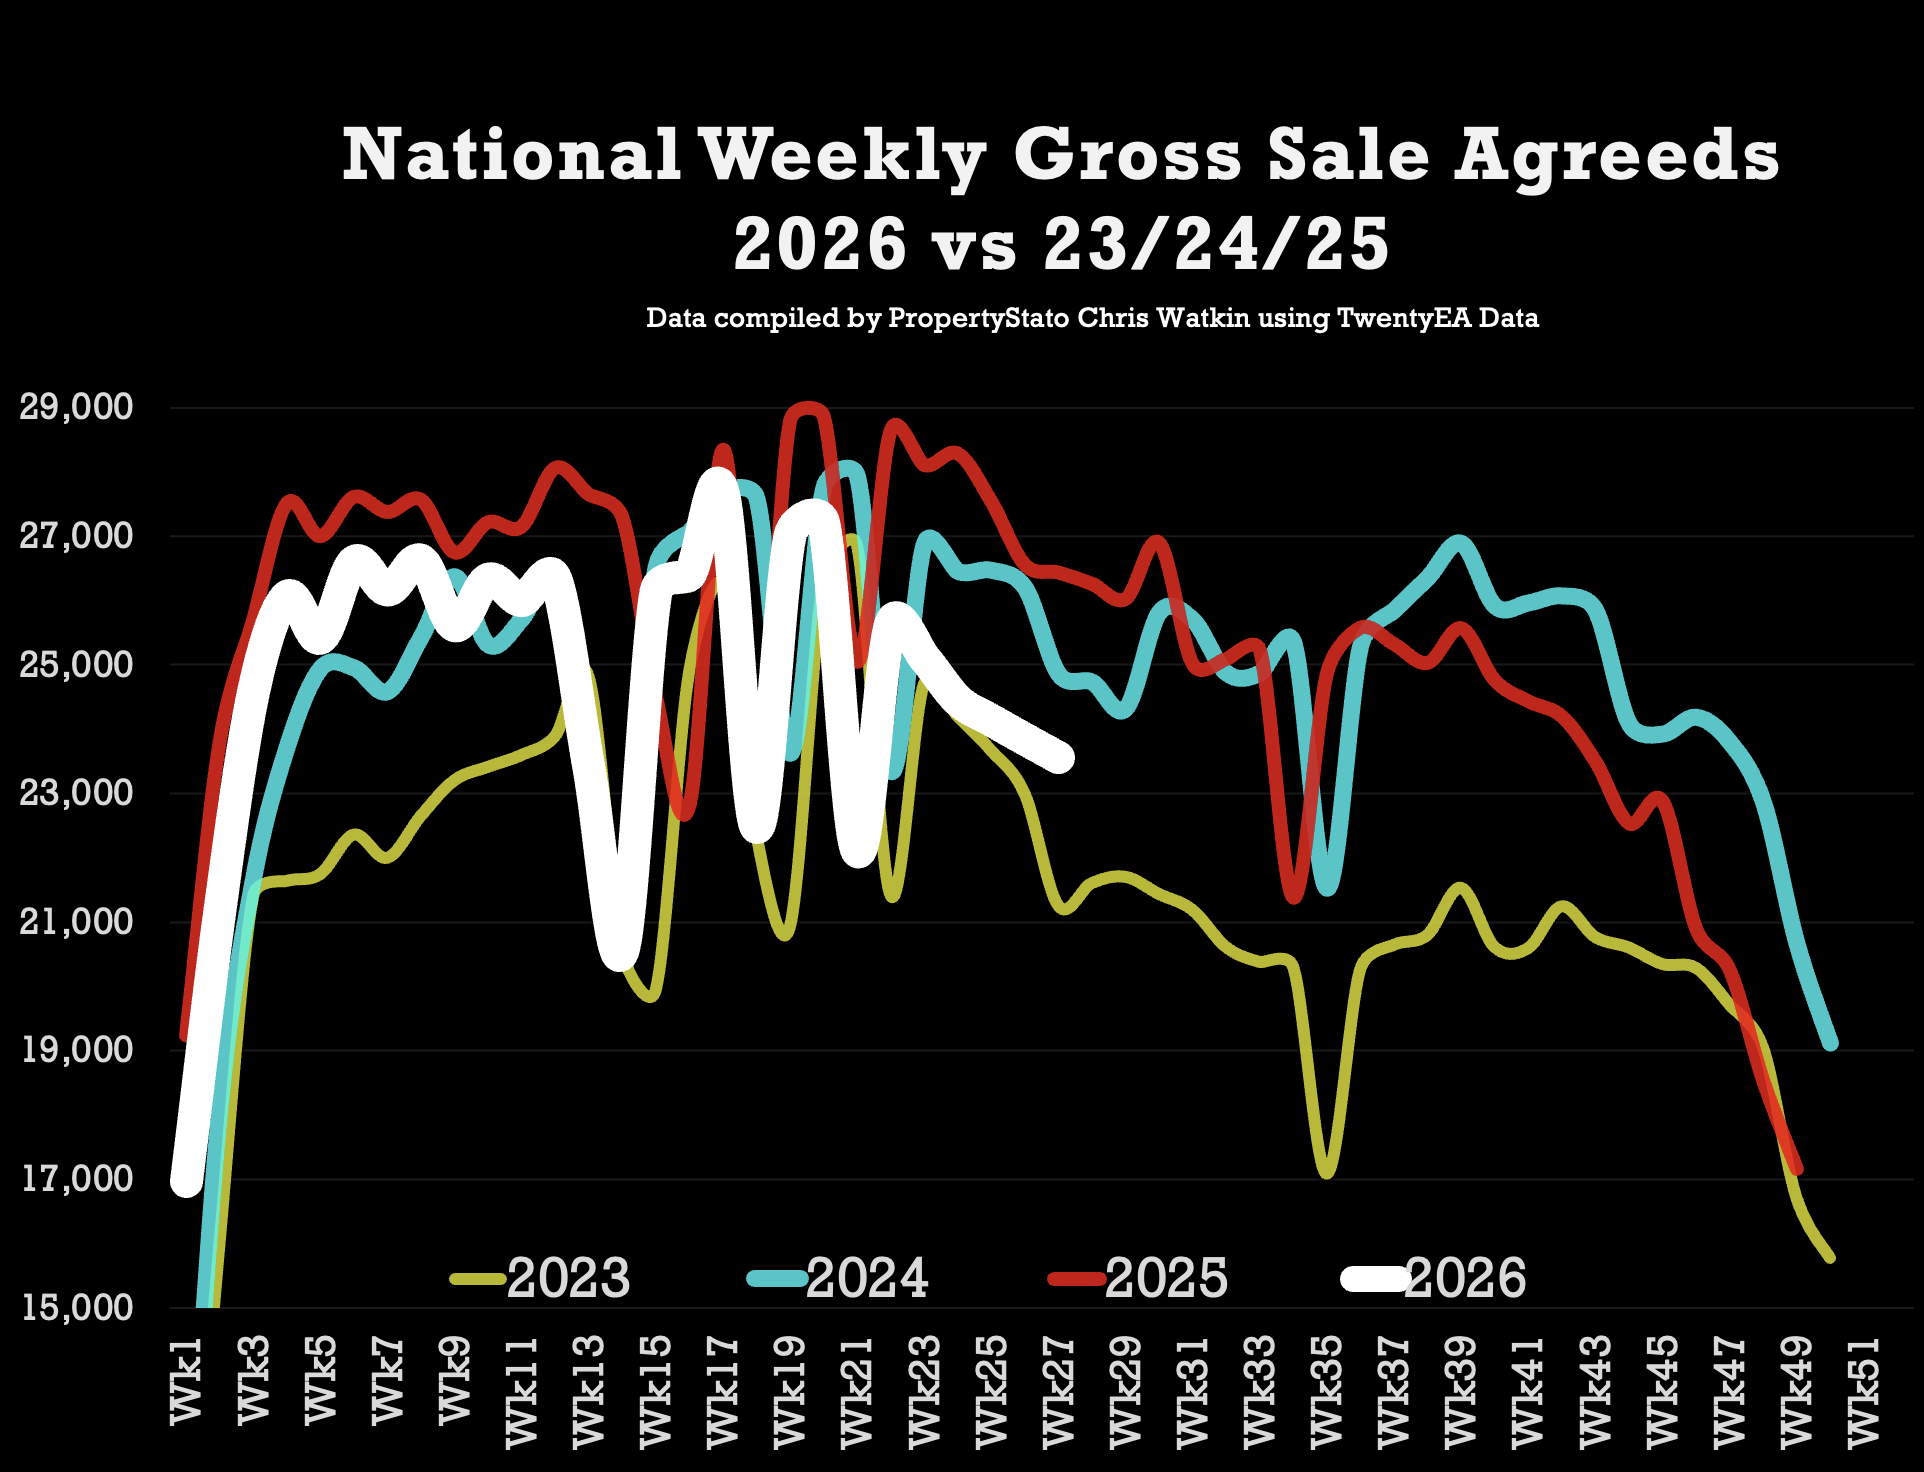
23.5k homes sold stc this week 27 (23.8k last week)
10 year week 26 average : 25.4k
2026 weekly average : 24.7k.
Year to Date for house sales
667k UK homes sold stc YTD
6.9% lower than 2025 YTD (717k)
Yet still Gross Sales are still …
0.2% higher than 2024 YTD (666k)
10.7% higher than 2023 YTD (603k)
6.9% higher above pre Covid 2017-19 years (624k).
🟩 UK Net Resi Sales YTD
(Net Sales being Gross Sales less Sale Fall Thrus).
Week 27
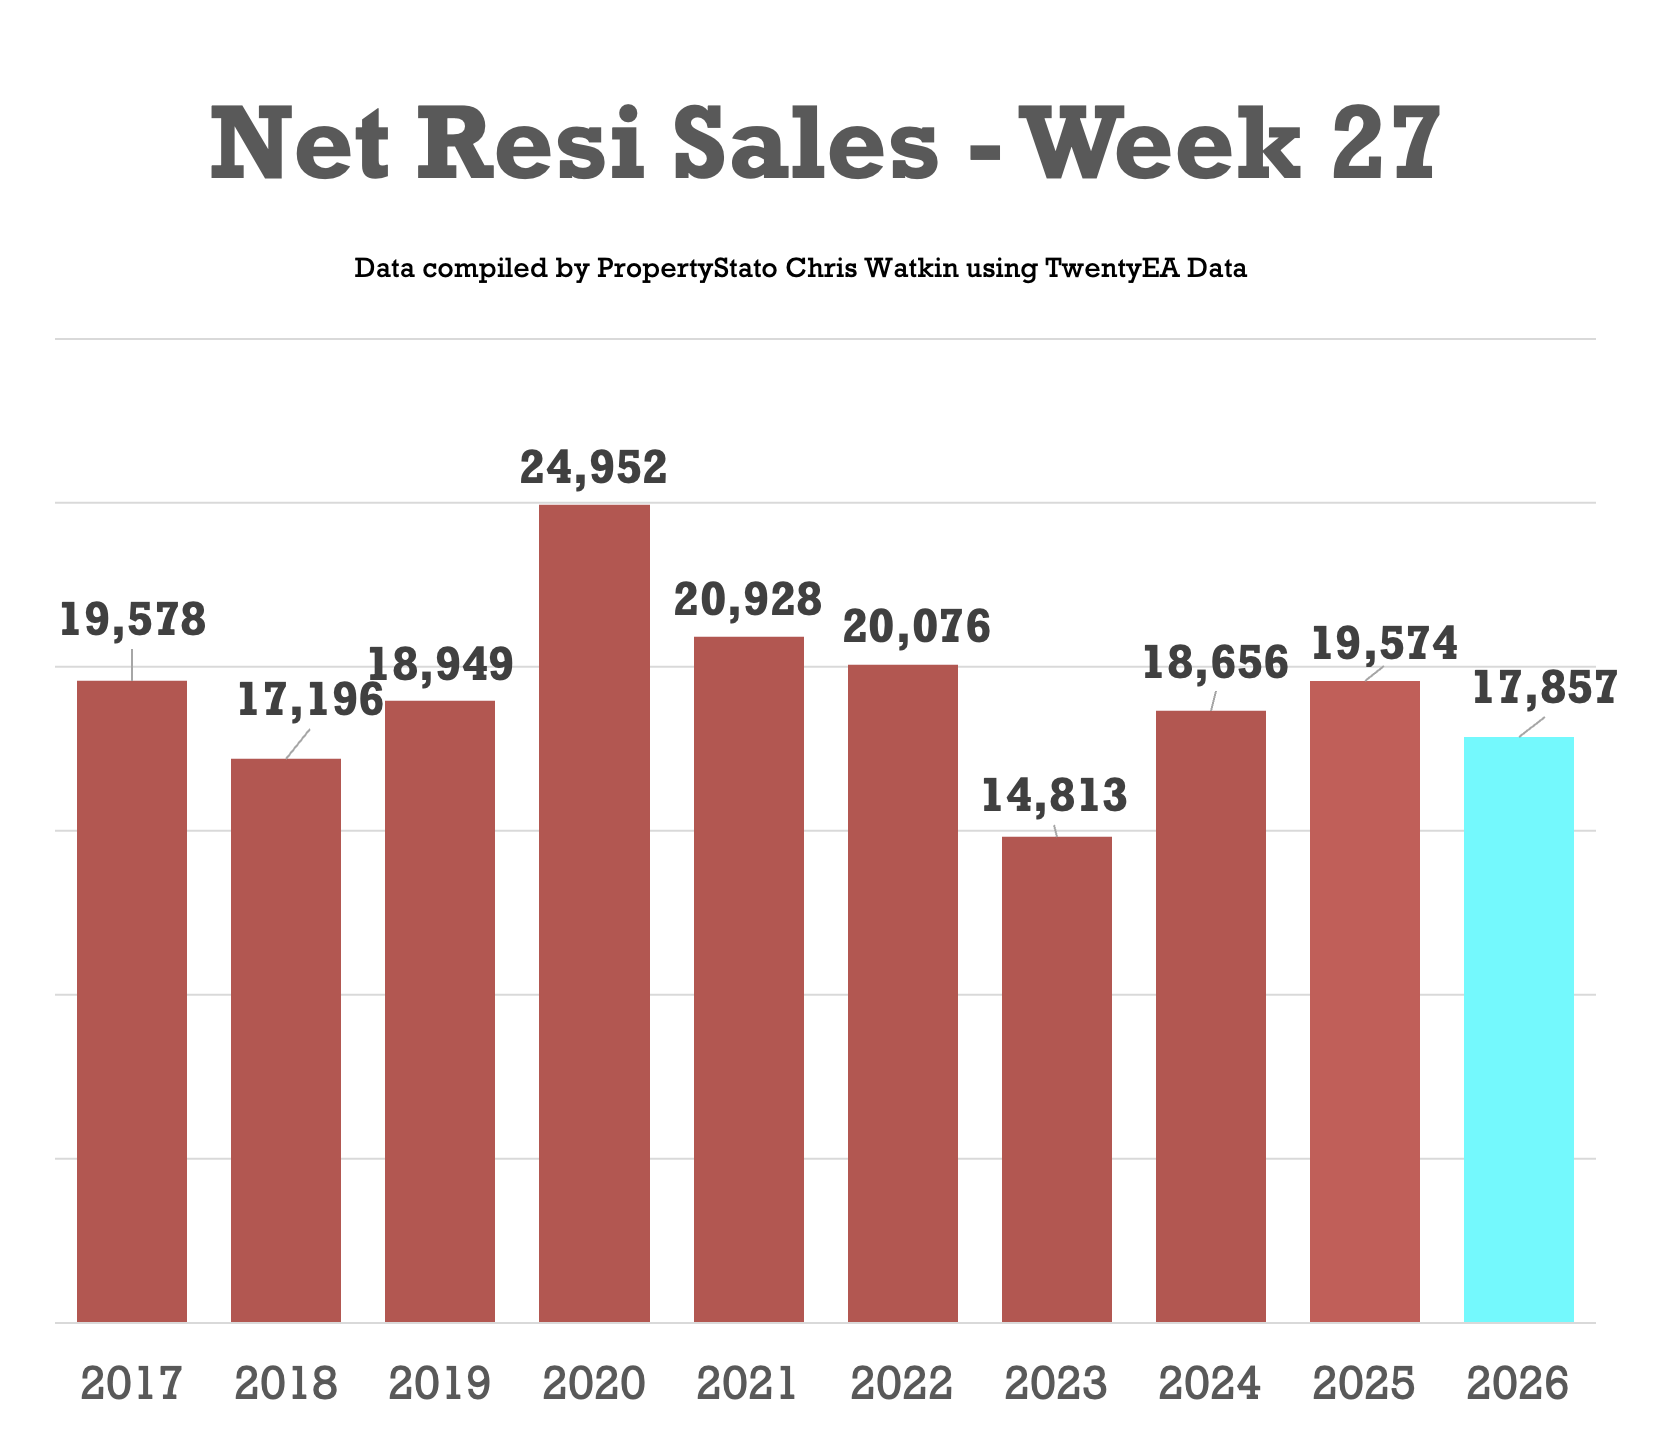
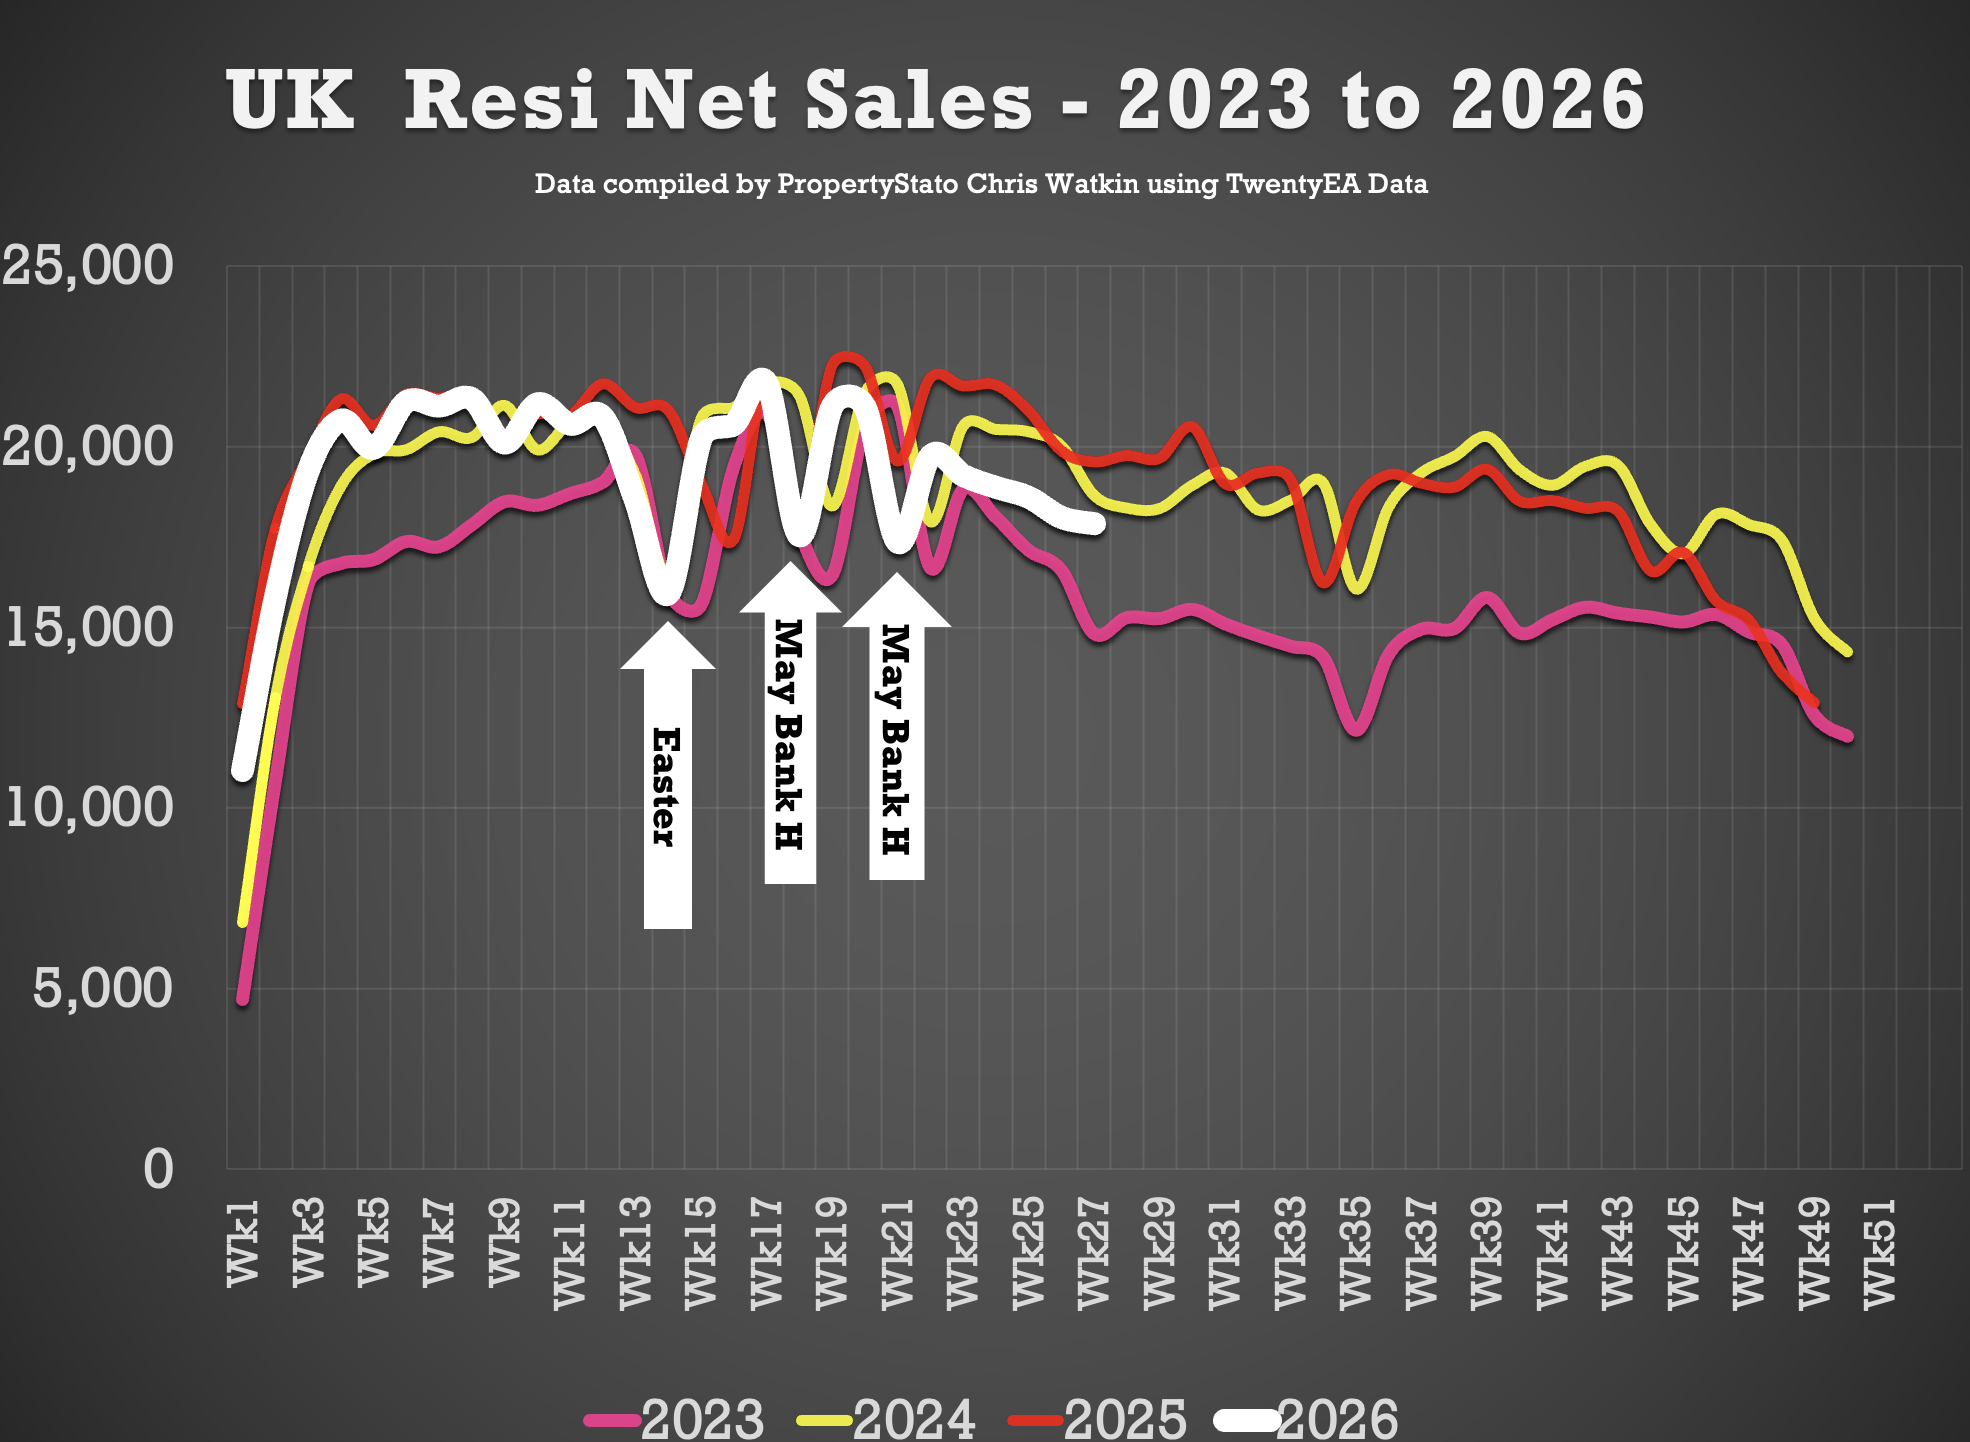
17.9k Net Sales (18k last week)
10 year Week 27 average: 19.3k.
Weekly average for 2026: 19.2k.
Year to Date
519k UK net home sales YTD
5.3% lower than 2025 (548k),
0.1% ahead of 2024 (518k),
12.5% ahead of 2023 (462k)
4.6% above the 2017–19 average (496k).
🟩 Exchanges & Withdrawals
• 66.2k Exchanges in June 2026 (note this figure will rise during July as more exchanges get reported. On past trends, expect that to end on late 70k’s
• 64k Withdrawals in June 2026 – again, this figure will increase as more June withdrawals come thru the system throughout July
• Therefore, in June 2026, only 50.9% of homes that left agents’ books exchanged & completed in June (the rest – 49.1% withdrew, unsold) – basically 50:50, a red or black, heads or tails.
Additional info …
🟥 Price Reductions
• 25.4k reductions this week on a 760k UK homes for sale
• 14.3% of UK homes for sale were reduced in June (up from 13.4% in May)
• 2026 YTD average 12.9%, versus the 6-year long-term average of 10.7%.
🟥 Price Difference between Asking Price of Listings & Asking Price of those Homes that go Sold stc
• 14.4% difference (long term 10 year average is 16% to 17%). (£427k ave Listing Ave Asking price vs £373k Sale Agreed ave Asking price)
🟥 Sell-Through Rate
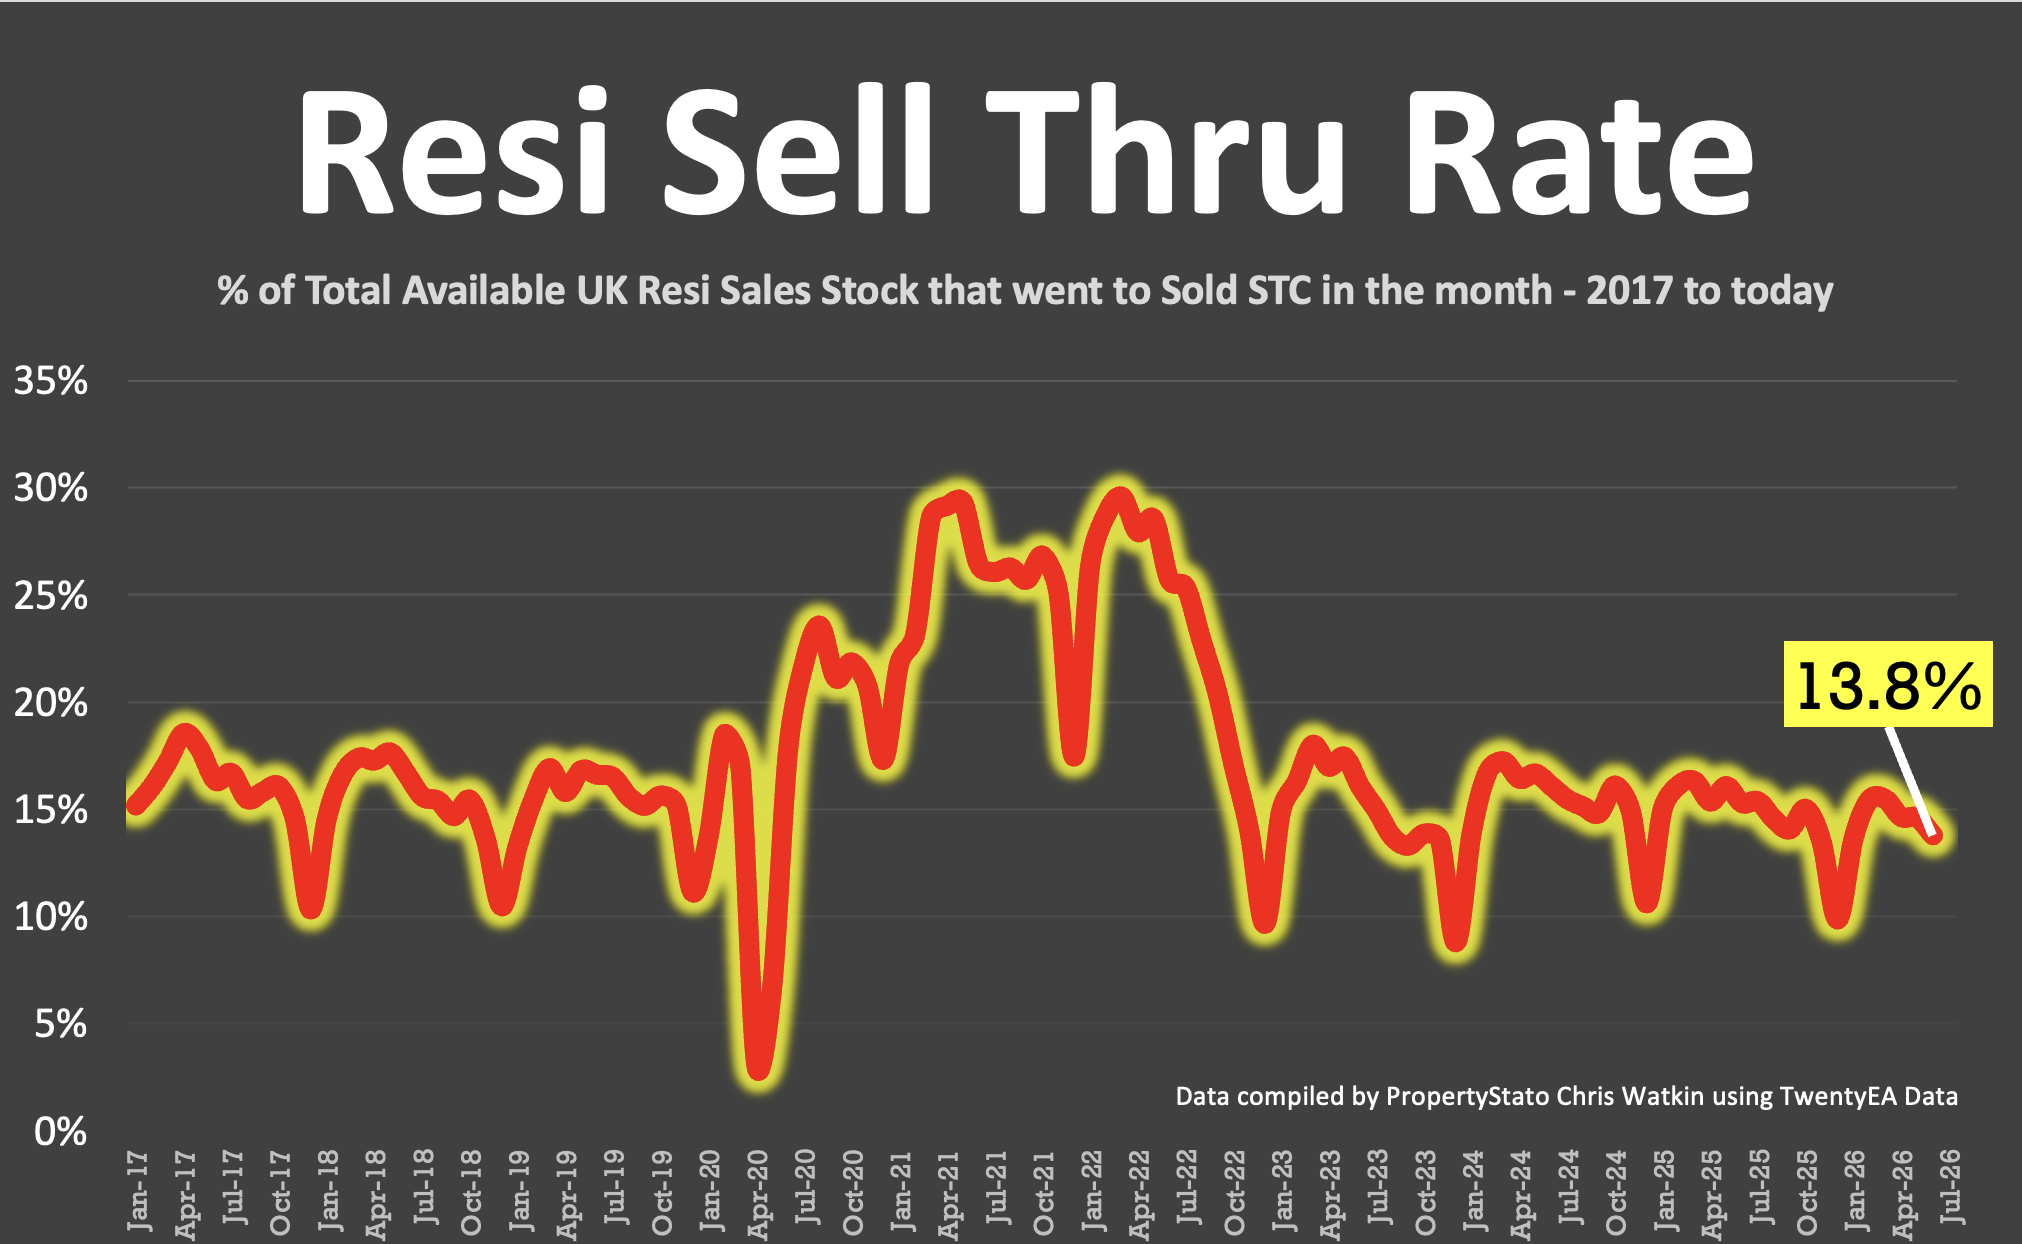
• 13.8% of homes on agents’ books went SSTC in June ’26 (compared to 14.6% in May ’26).
• Pre-Covid average: 15.5%.
🟥 Sale Fall-Thrus
• Fall-thru rate 24.2%
• Decade average: 24.5%
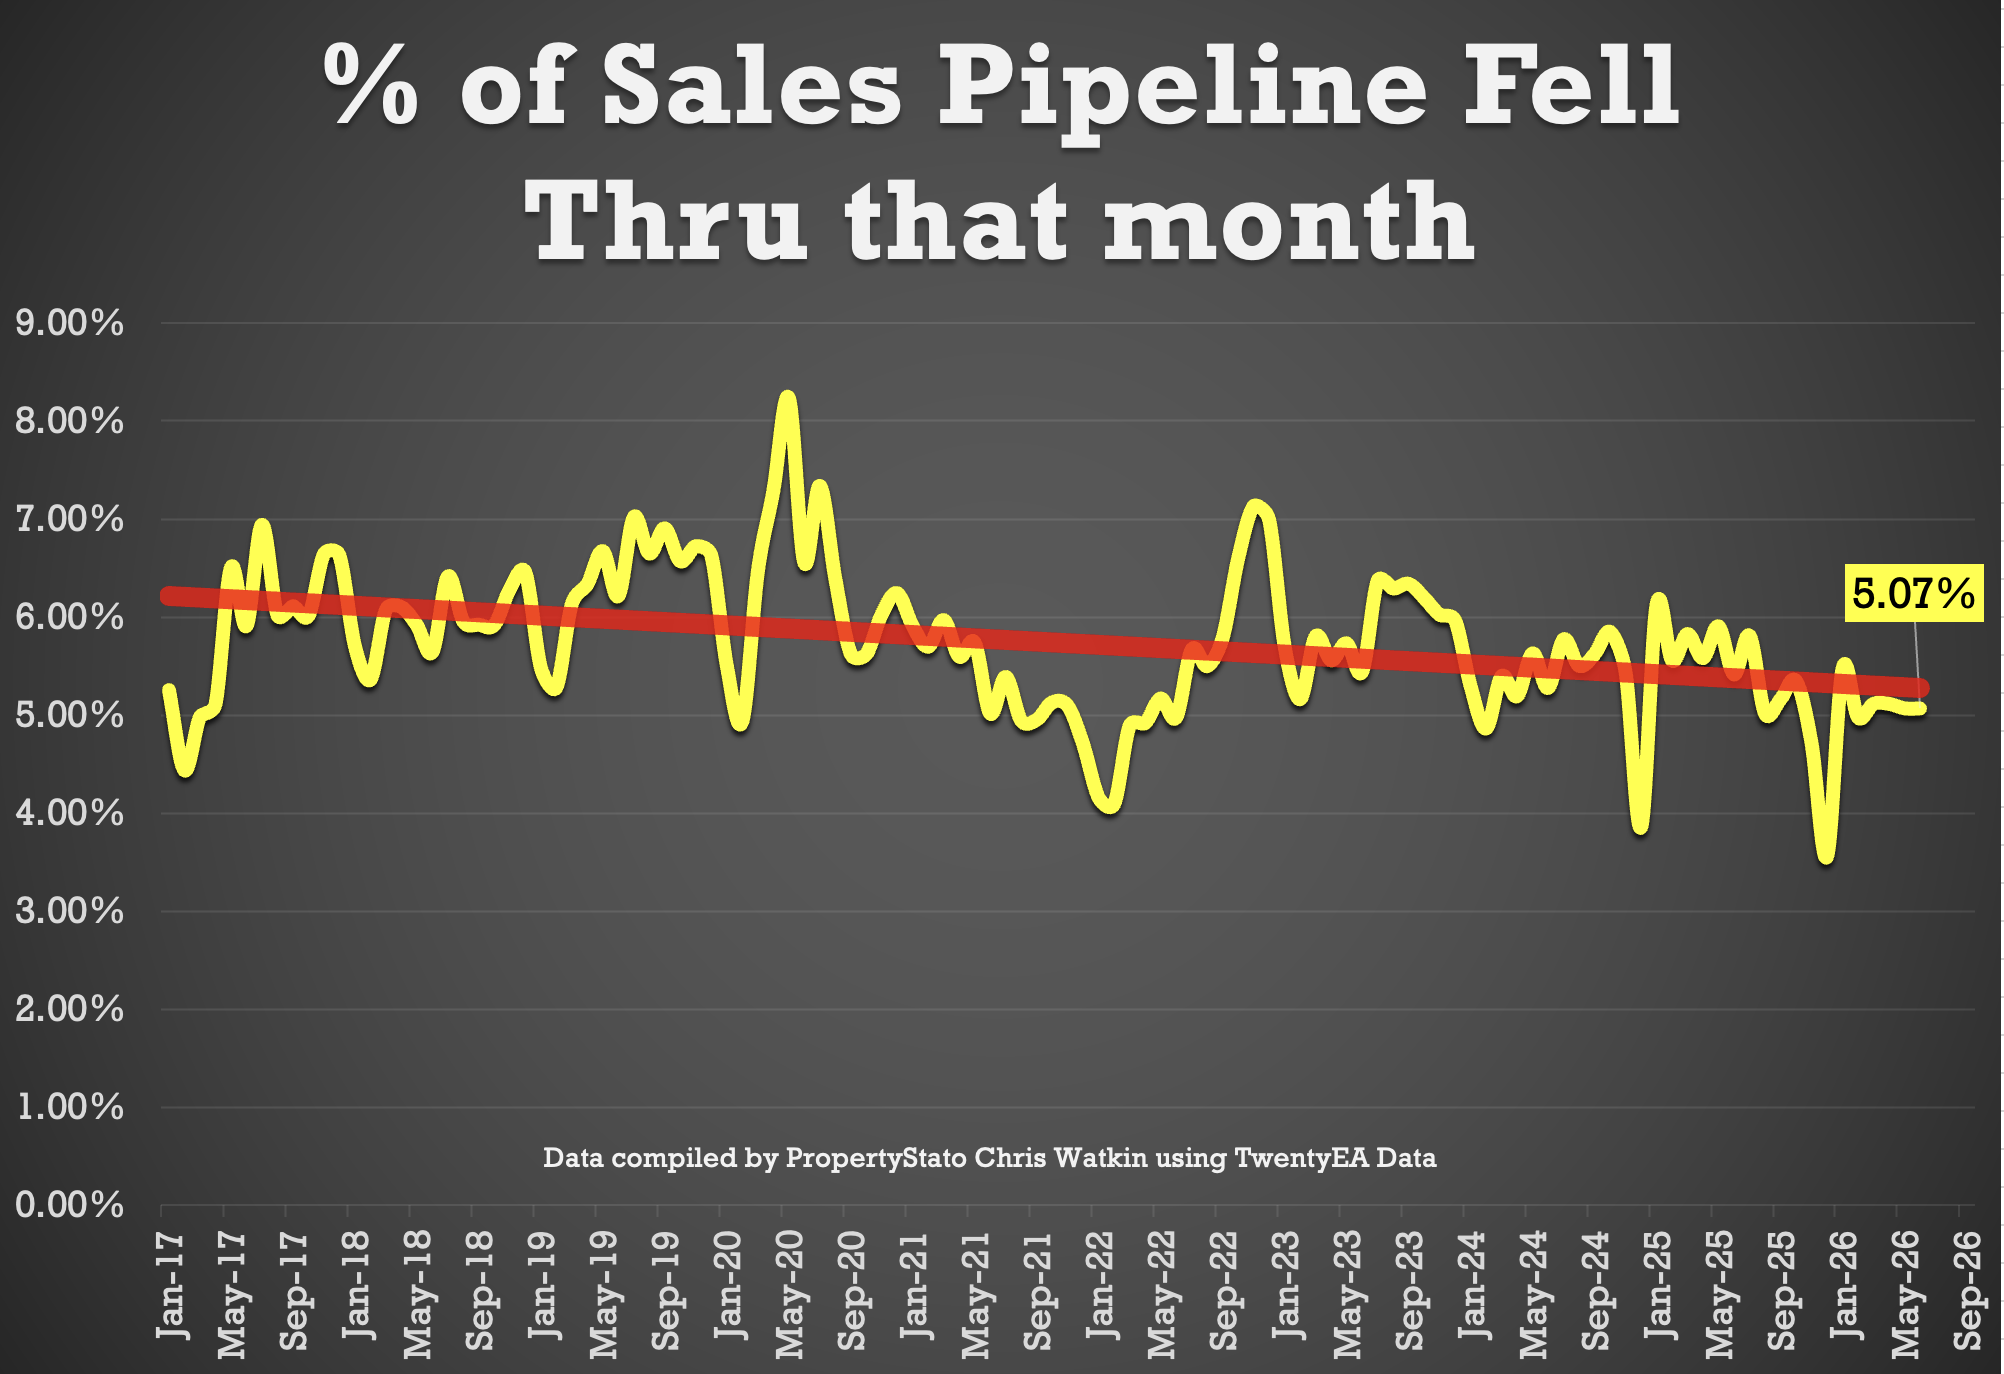
• 5.07% of homes sold STC fell thru in June 2026, below both the 2025 average of 5.3% and the 10 year average of 5.8%.
🟥 Stock Levels
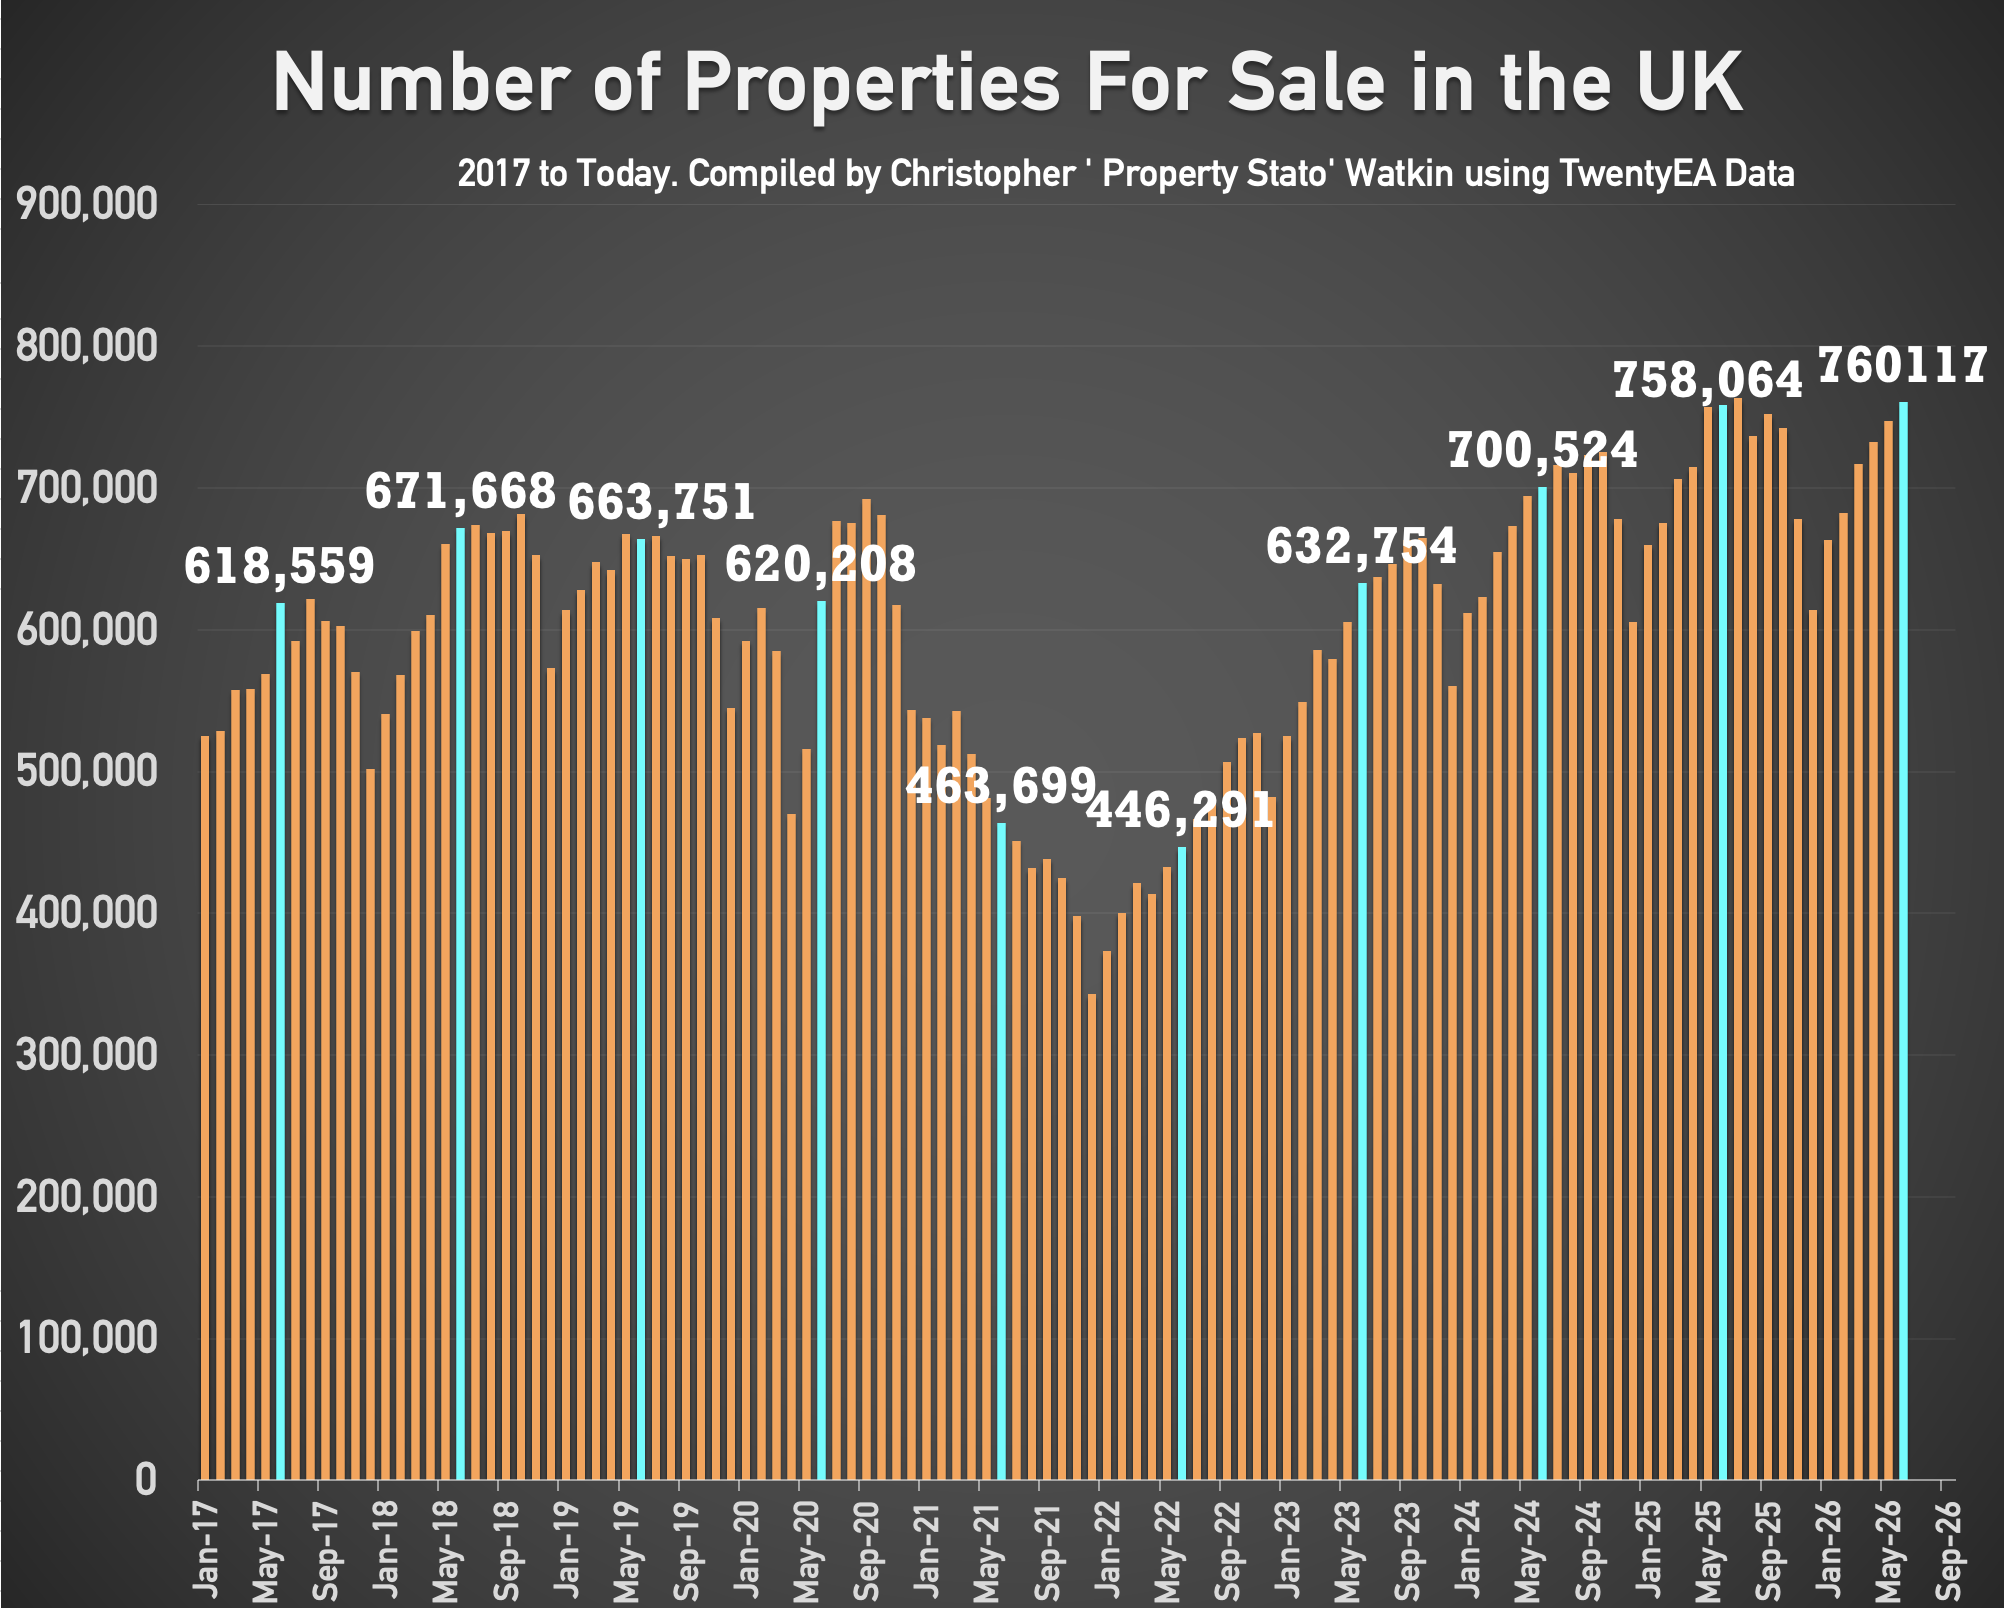
• 760k homes on the market on the 1st of July ’26 (747k the month before and 763k 12 months ago)
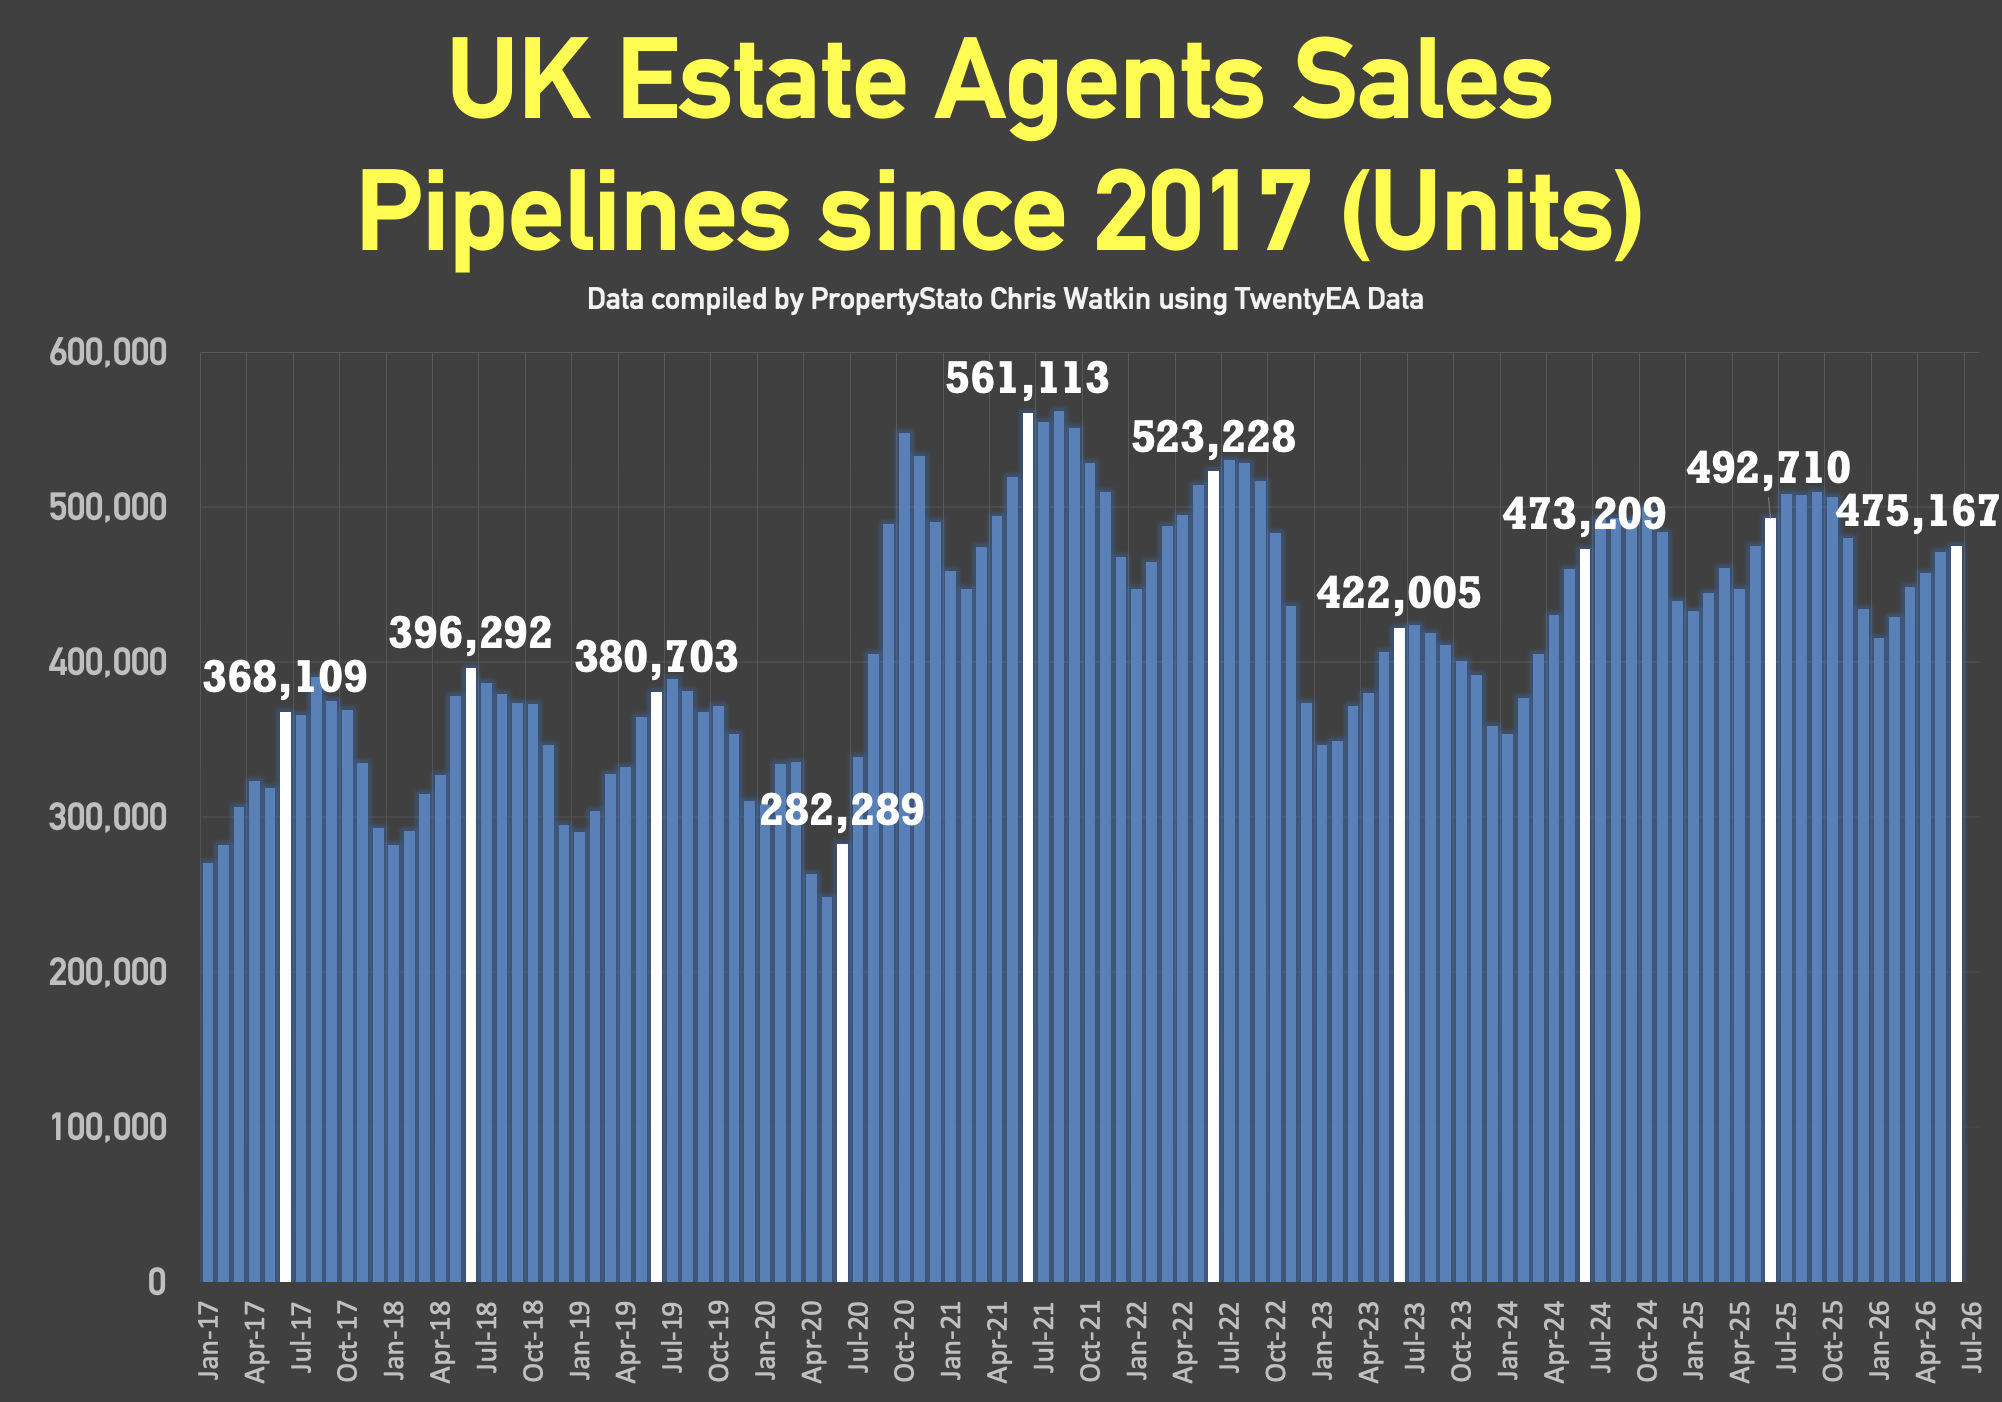
• 475k homes in agent’s sales pipeline on the 1st July 2026, lower than 12 months ago on 1st July ’25 (493k).
🟥 House Prices (£/sq.ft)
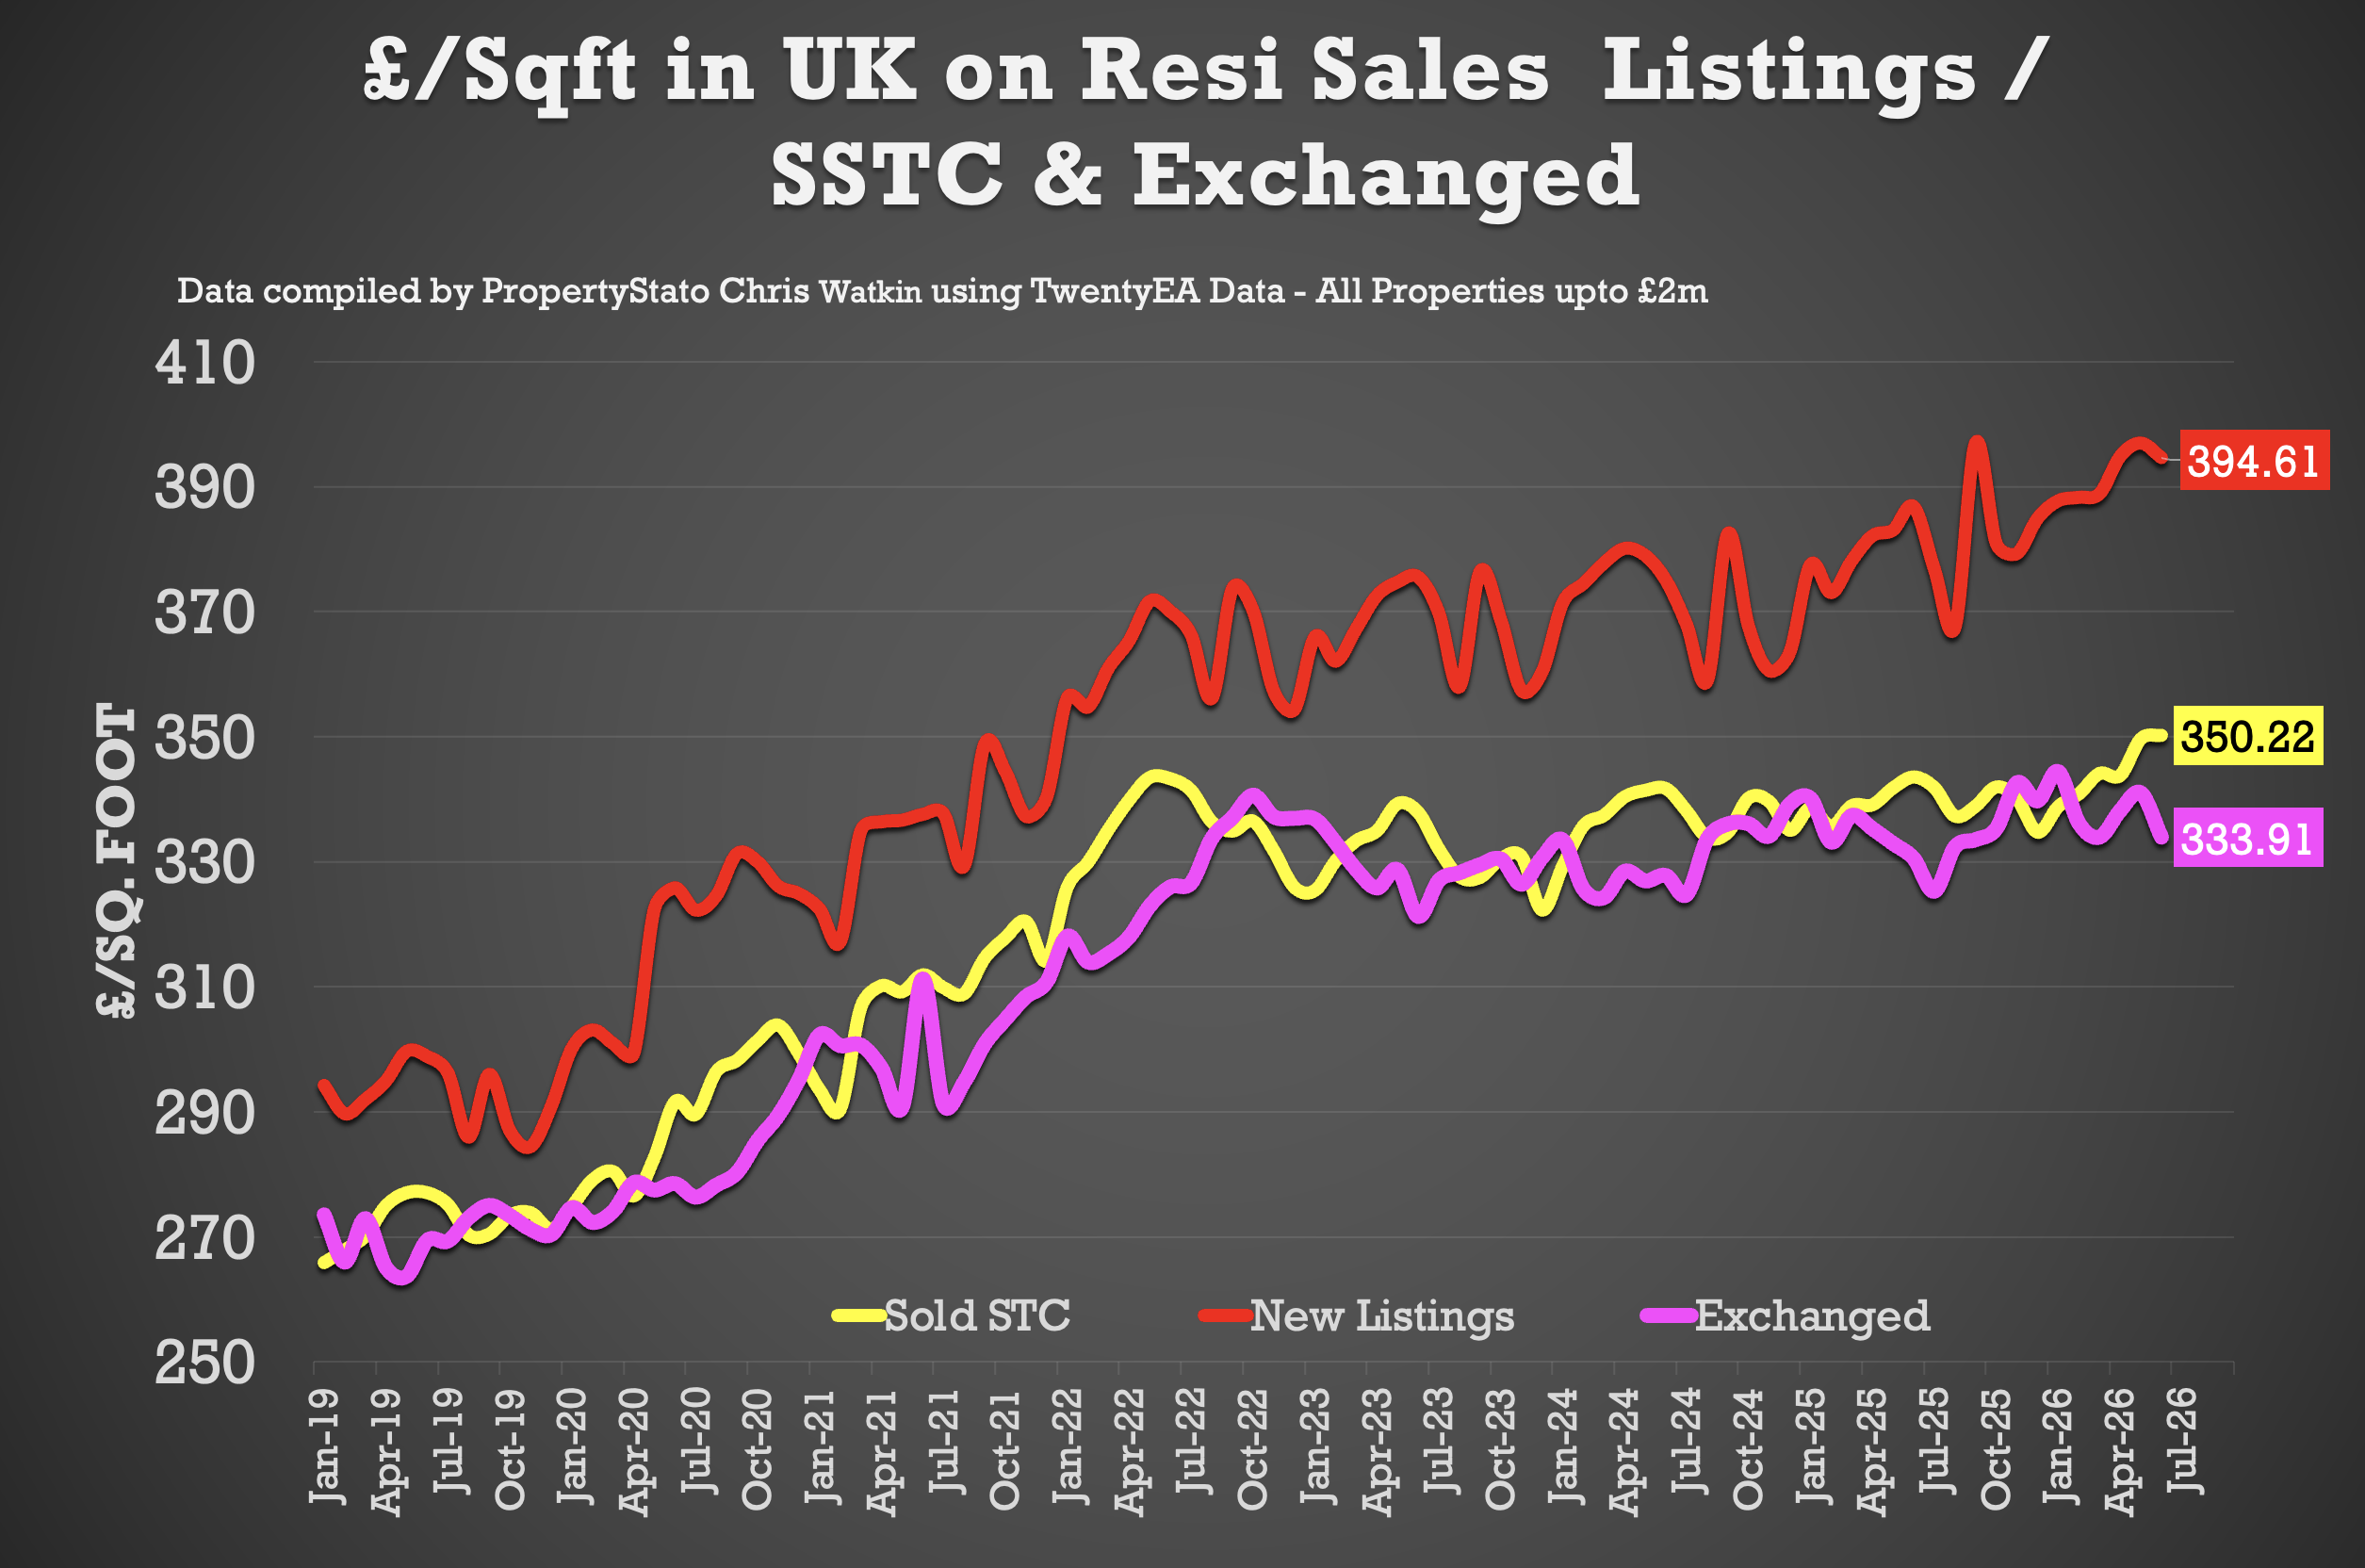
• June ’26 agreed sales averaged £350.22 per sq.ft. 1.94% higher than 12 months ago (£343.54) and 12.3% than 5 years ago (£311.93). The £/sqft at sale agreed matches the HM Land Registry Index with a 98% accuracy, 5 months in advance. That is why it is so important.
🟥 UK Rental Data
• Average Rent in Wk 27 – £1,862 pcm
• Average Rent in July 2026 – £1,843 pcm
• Average Rent in June 2026 – £1,808 pcm (£1,791 in June 25)
• Average Rent in YTD 2026 – £1,758 pcm
• 315k UK Rental Stock available to rent in June 26 (307k in June 2025)
🟥 Local Focus this week in the Show
Northampton