
 Property buyers spent £11.6bn across prime areas of London in 2021, according to new analysis of the prime central London housing market by independent property analysts, LonRes.
The data shows that this is the highest amount raised of any year since LonRes records began in 2000.
Achieved prices rose 7.2% in Q4 2021 compared to the same period a year ago, as high demand continued to push property prices higher.
2021 saw 16% more flats and 57% more houses transact than the average sold annual between 2015 and 2019.
Transactions – exchanges – were down 14% in Q4 2021 compared with Q4 2020 and 5% lower than the average Q4 between 2015 and 2019.
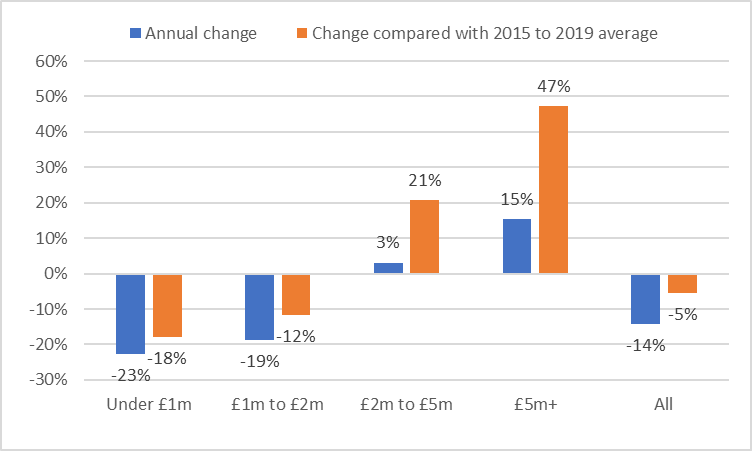
Meanwhile, the market at £5m-plus was the busiest in Q4 2021. The number of sales recorded were up 15% on Q4 2020 and 57% higher than the Q4 average between 2015 and 2019.
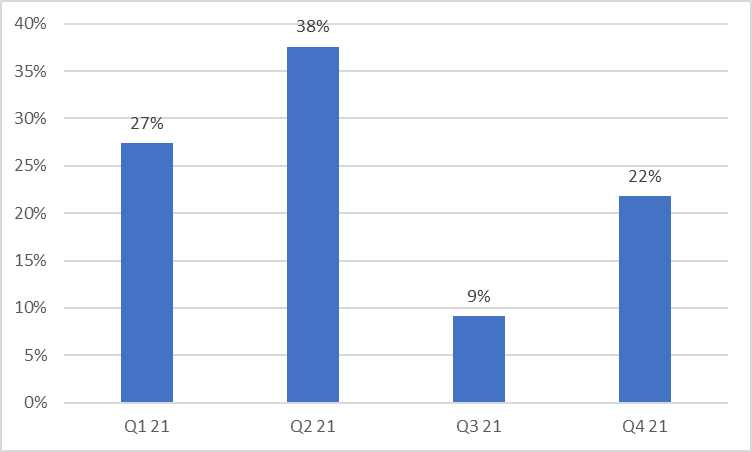
The research also reveals that the number of properties going under offer increased again in Q4 2021. Comparing under offers with the five-year Q4 (2015 to 2019) average shows under offers were up 22%.
New instructions returned to long-run levels in Q4. New instructions in Q4 2021 were 3% higher than the five-year average (2015 to 2019).
There are fewer properties on the market now than there were a year ago, with stock levels down 17% compared with volumes at the end of 2020.
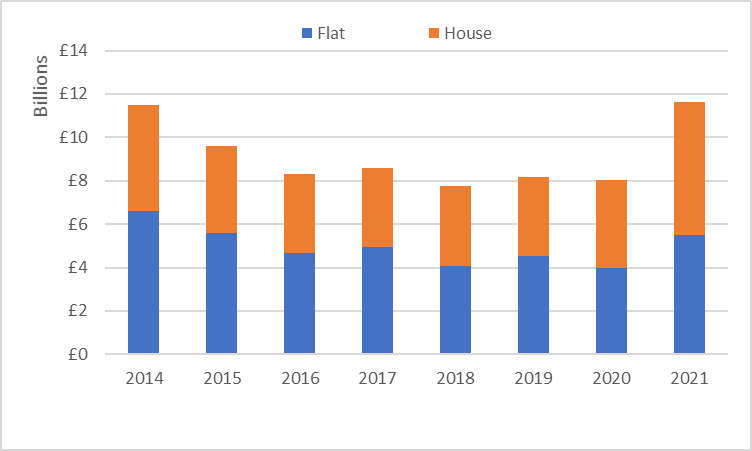
Marcus Dixon, head of research at LonRes, said: “In 2021 buyers bought bigger and spent more. Total property spend exceeded £11.6bn in 2021, the highest annual spend since LonRes records began in 2000. Over half this total went on houses. The value of houses sold topped £6.1bn in 2021, 26% higher than the previous record spend in 2014.
“There was price growth across all LonRes areas* with Prime Central London (PCL) leading the way. Annual prices in PCL rose by 6.5% in 2021.
“The top end of the market, which we define as properties sold for £5m or more, was the busiest in the fourth quarter of the year. Over Q4 2021 the number of homes (houses and flats) sold rose 15% on 2020 and 47% on the previous five-year average.
“Demand, which had been building at the end of the year is likely to spill into Q1 2022 when we would expect to see the volume of sales rise again. The number of properties put under offer was up 22% in Q4 2021 compared with the long-run average and on par with a busy fourth quarter in 2020.”
Total Spend
Buyers spent £11.6bn on prime London property in 2021 – the highest spend of any single year since 2000, which is when LonRes records began. This is up 45% on 2020, 37% higher than the five-year (2015 to 2019) average and 1.2% higher than the previous peak of 2014. 53% (£6.1bn) was spent on houses, a 26% increase on the previous peak spend which was set in in 2014.
Chart 1 – Total spend – All Prime London
Source: LonRes
Prices
An increase in sales of houses and properties (houses and flats) at the top end of the market supported price growth in the final quarter of 2021. Overall prices rose 7.2%. Prime Central London was the strongest performer, up 6.7% on Q4 2020 followed by Prime London (+4.0%) and Prime Fringe (+3.5%).
Table 1 – Annual change in achieved prices
| PCL | Prime London | Prime Fringe | All Prime | |
| Q1 20 | 8.3% | -1.0% | 5.5% | 5.2% |
| Q2 20 | -6.9% | 1.7% | 2.9% | 1.5% |
| Q3 20 | 0.0% | 4.0% | 2.8% | 2.6% |
| Q4 20 | -2.5% | 7.5% | 2.5% | 1.0% |
| Q1 21 | -3.3% | -0.6% | -3.2% | -4.8% |
| Q2 21 | -0.7% | -2.0% | 1.8% | -4.3% |
| Q3 21 | 6.5% | 4.8% | 0.8% | 6.1% |
| Q4 21 | 6.7% | 4.0% | 3.5% | 7.2% |
Source: LonRes
Transactions
2021 was a bumper year for transactions across prime London. Sales rose 43% compared with 2020 and were 26% higher than the previous five-year (2015 to 2019) average.
Activity below £2m slowed in Q4, with 23% fewer sales at under £1m and 19% fewer between £1m and £2m compared with 2020. Above £2m sales increased, with properties sold for £5m or more 15% up on Q4 2020 and 47% higher than the Q4 average between 2015 and 2019.
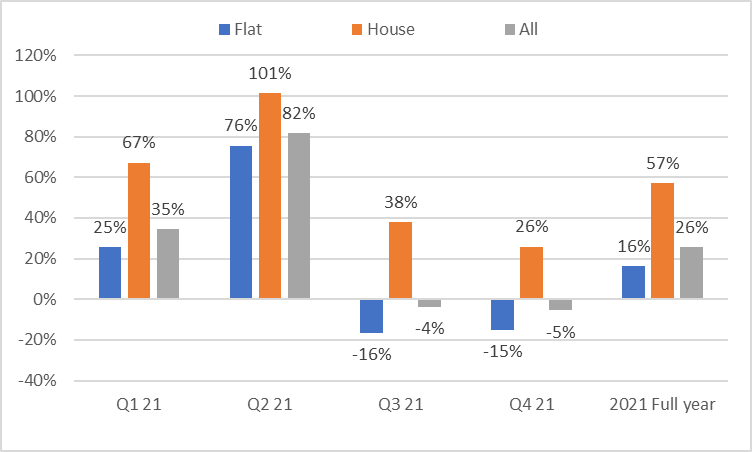
Houses proved popular again in Q4 2021, with 26% more houses sold than over the 2015 to 2019 (five-year) average. In contrast flat sales saw a 15% fall over the same period. This was in part due to higher flat sales earlier in the year. However, taking 2021 in its entirety shows a 16% increase in sales of flats, compared with the 2015 to 2019 (five-year) average. House sales rose 57% over the same period.
Chart 2 – Sales by price band – Q4 2021
Source: LonRes
Chart 3 – Sales by property type – compared with 2015 to 2019 average
Source: LonRes
New instructions and stock levels
2021 saw a similar number of new properties reach the market compared with 2020. New instructions were 0.8% higher in 2021 (full year) compared with 2020. Comparing volumes with the five-year (2015 to 2019) average shows 5% more properties were listed for sale in 2021.
PCL was the busiest of our three prime markets in Q4 2021. Overall we saw a 3% increase in new instructions compared with the long-run 2015 to 2019 average. Both Prime London and Prime Fringe saw small falls in new instructions but PCL saw 17% more new listings compared with the 2015 to 2019 average. A busy sales market meant the year ended with stock levels down on 2020. At the end of December there were 17% fewer properties on the market than at the same point a year earlier.
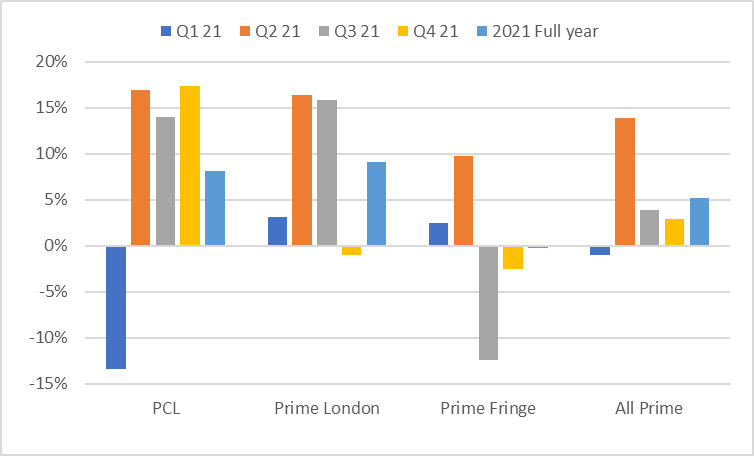
Chart 4 – New instructions compared with 2015 to 2019 average
Source: LonRes
Looking ahead
The number of properties put under offer in the fourth quarter of 2021 was just 0.1% lower than a busy Q4 2020 and 22% higher than the 2015 to 2019 Q4 average. This suggests sales activity could remain busy in the first few months of 2022.
Chart 5 – Under offer – 2021 compared with five-year (2015 to 2019) average
Source: LonRes


