

 Despite the doom-mongers and economic obstacles, the UK property market has built on top of last week’s rebound from its typical August Bank Holiday downturn.
Yet, the fly in the ointment is overvaluing.
Estate agents are still overcooking the suggested asking prices of many new properties coming on the market.
This week’s special guest, Bryan Mansell, appears on the show to discuss how the number of UK properties on the market for sale has increased by 88.5% in the last 20 months (343.3k on 1st January ’22 to 647.2k on 1st September’ 23), yet the number of weekly sales has dropped by 20.1% in the same time frame and what that means for UK estate Agency and the property market as a whole.
These are the key statistics of last week’s (Week ending Sunday, 10th September 2023)
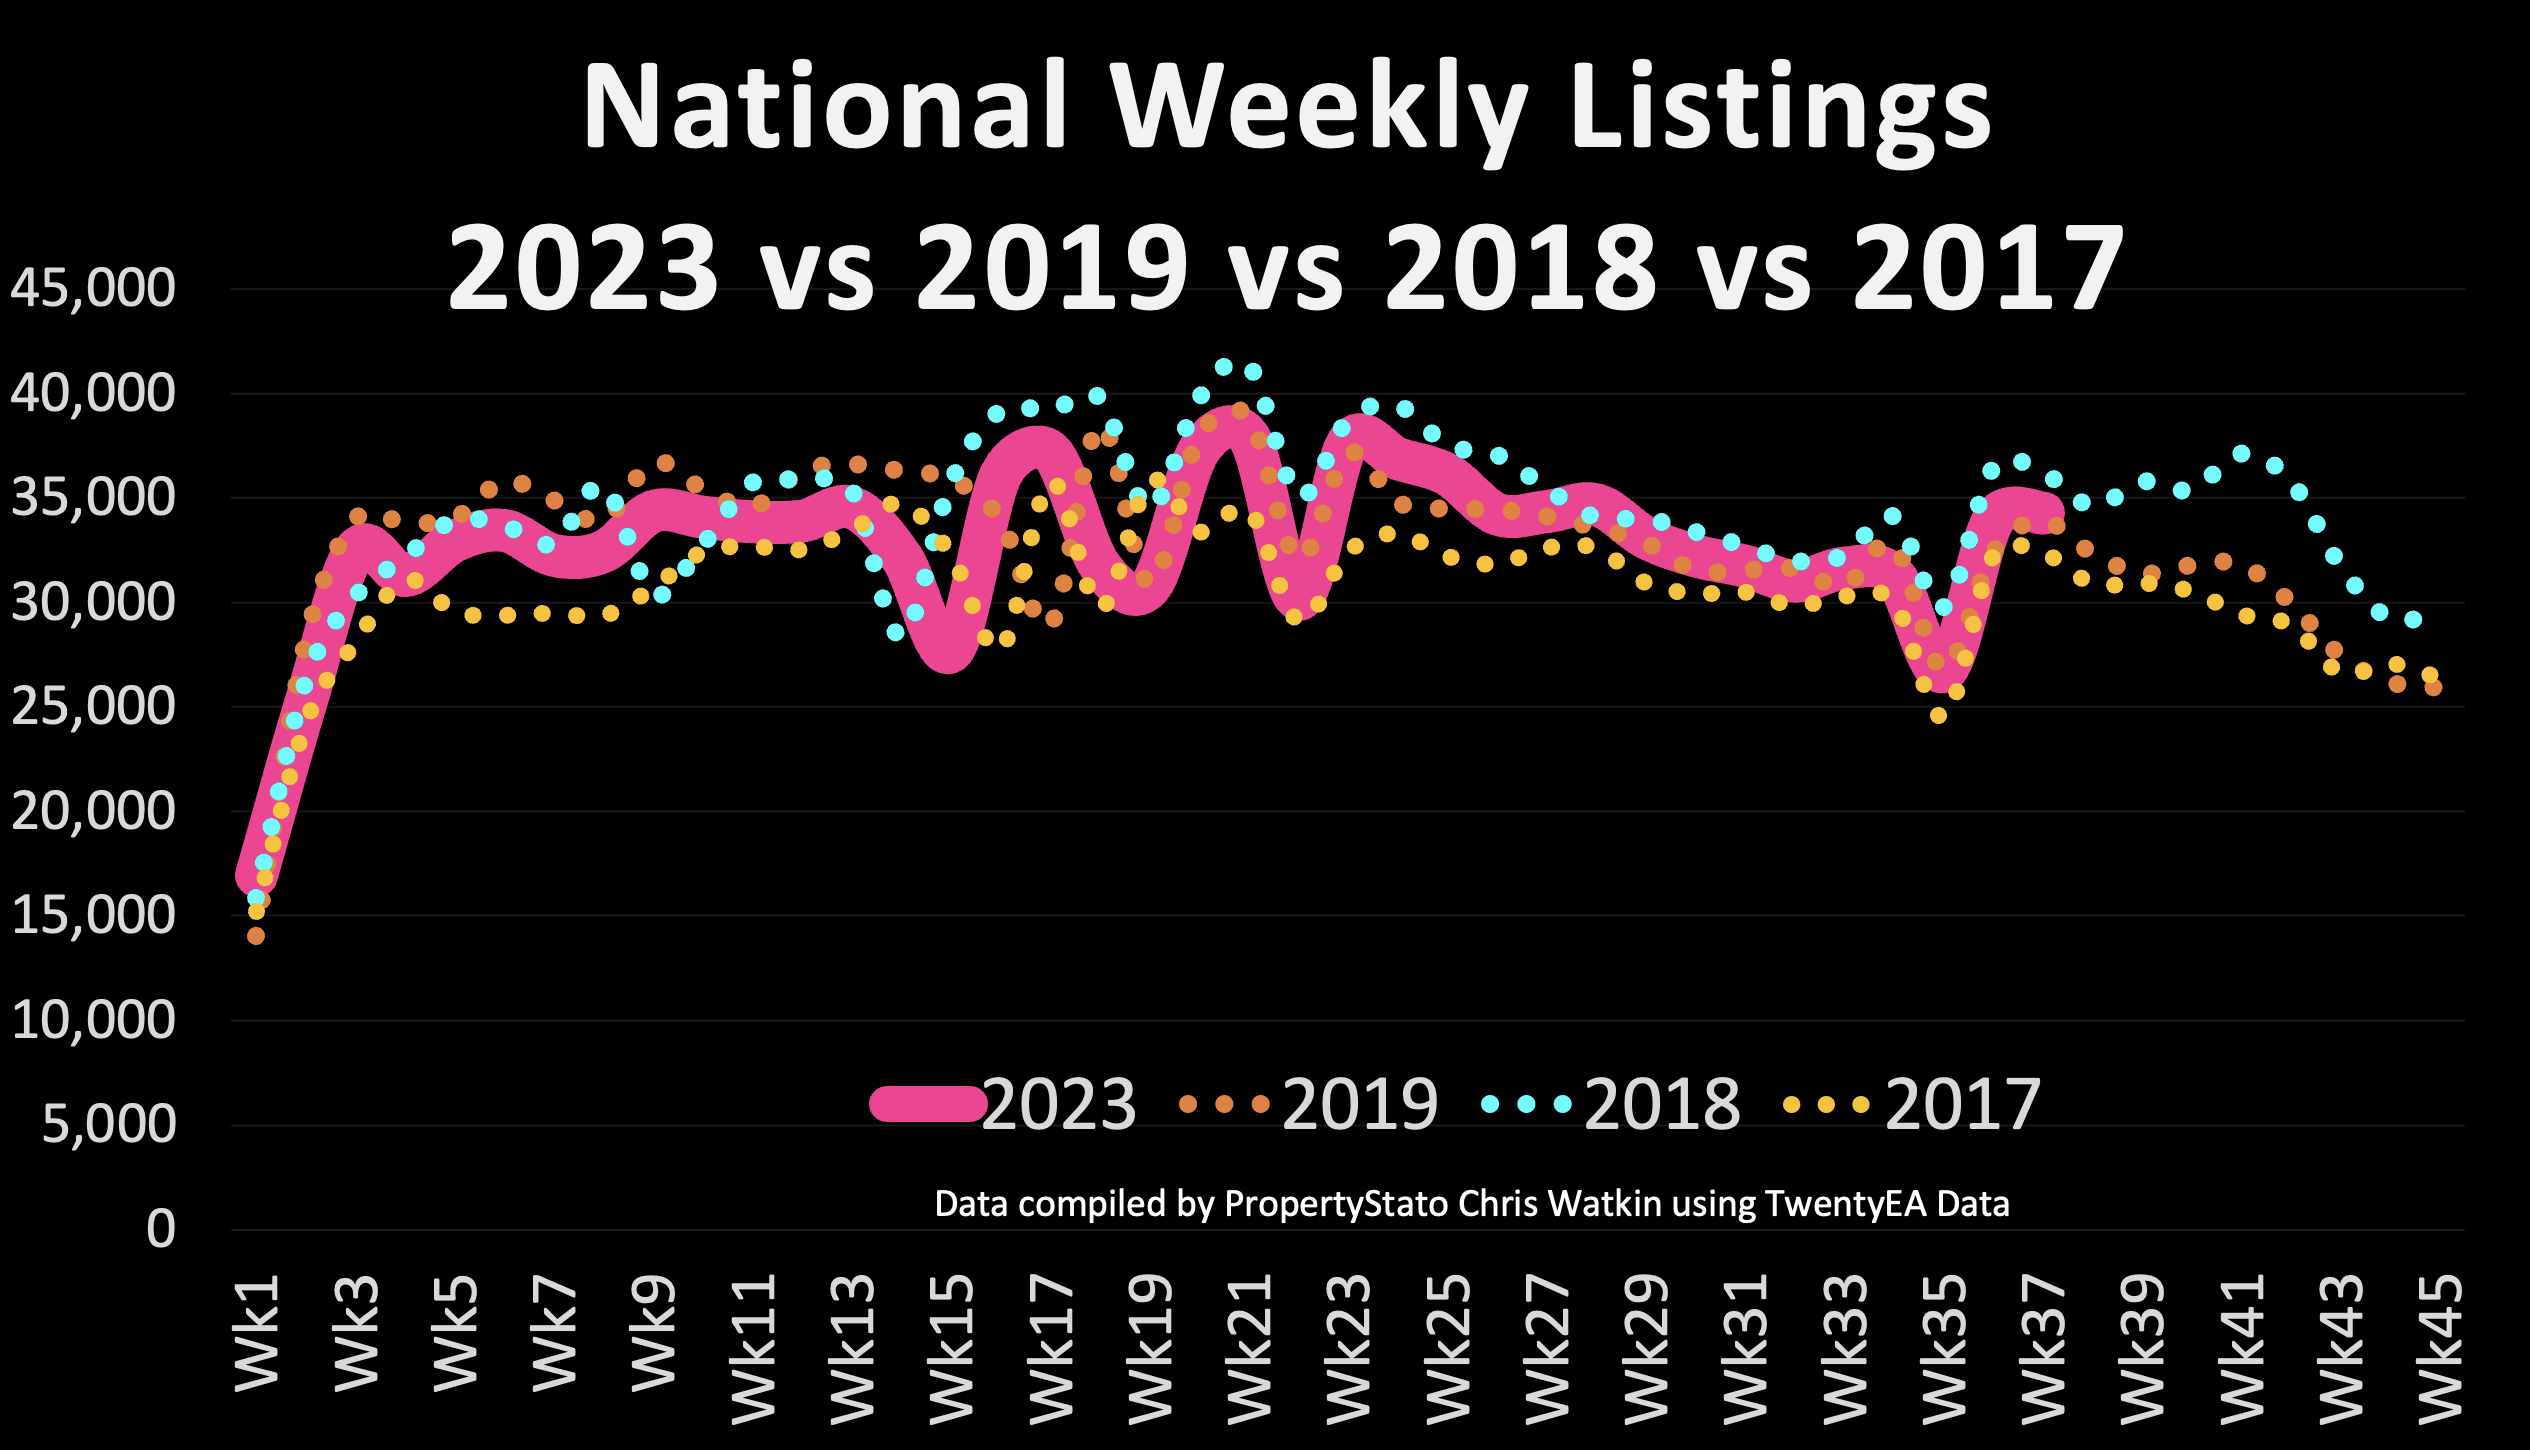
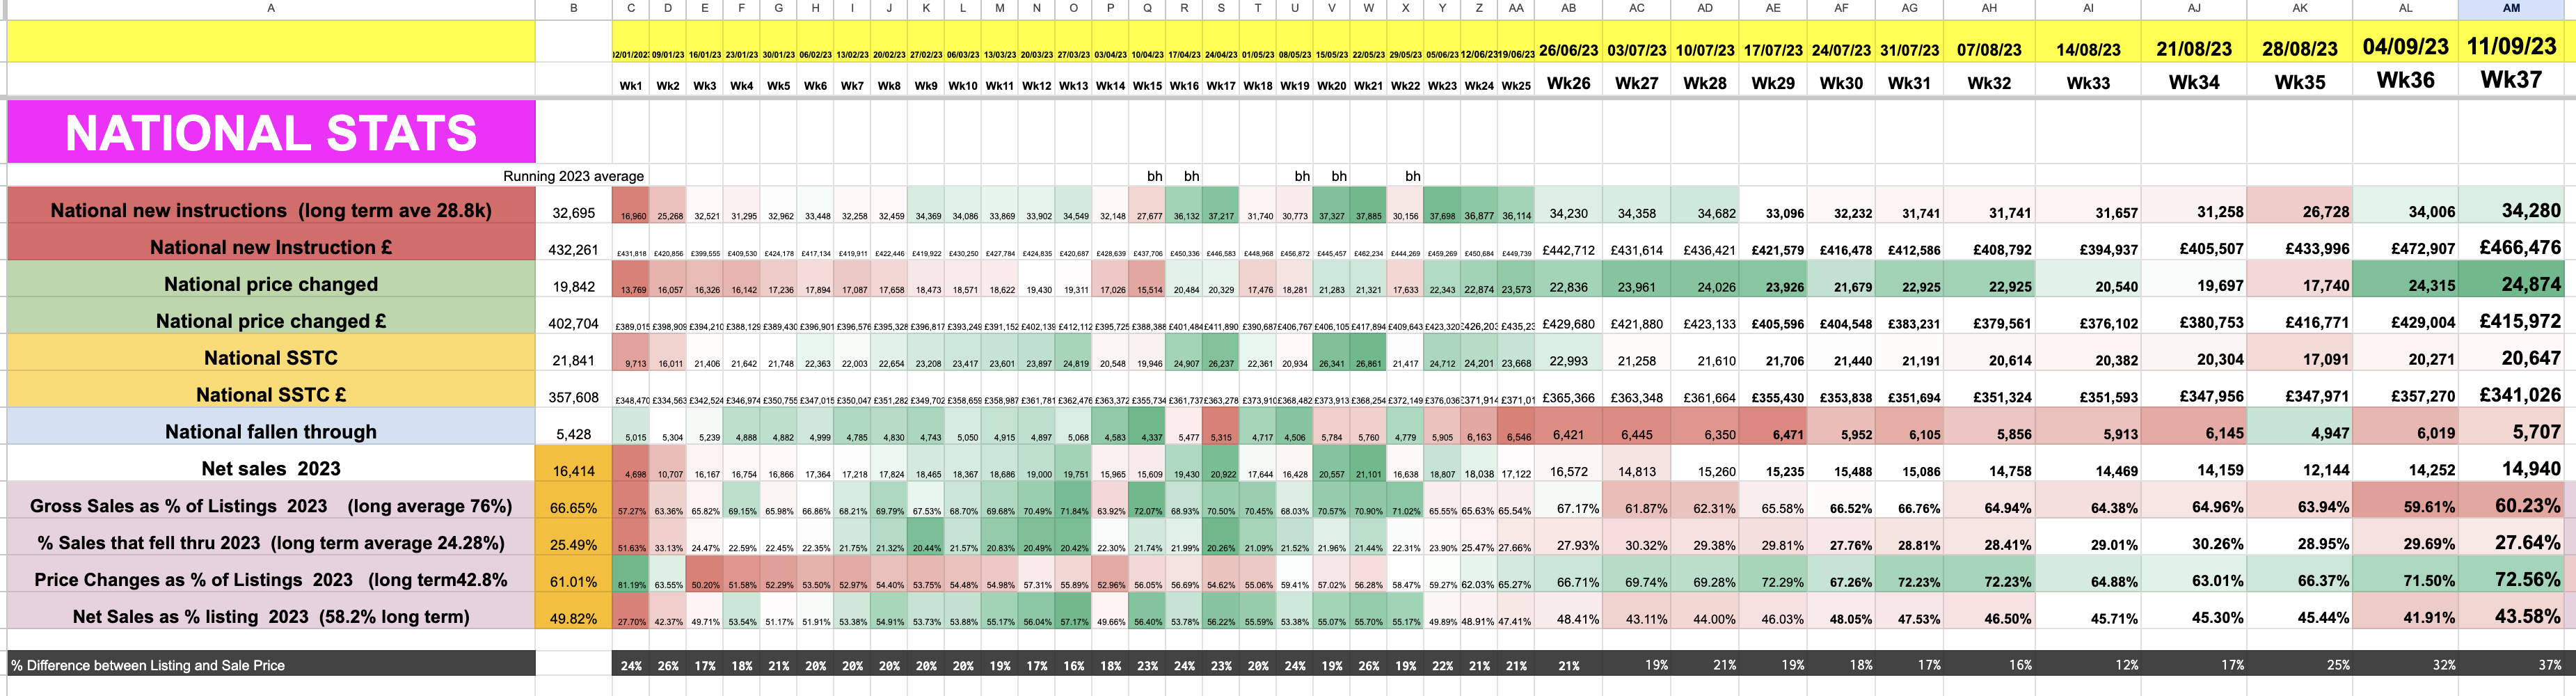
· New Properties to the Market (Listings): The number of listings last week was 34,280. The 2023 YTD running weekly average stands strong at 32,695.
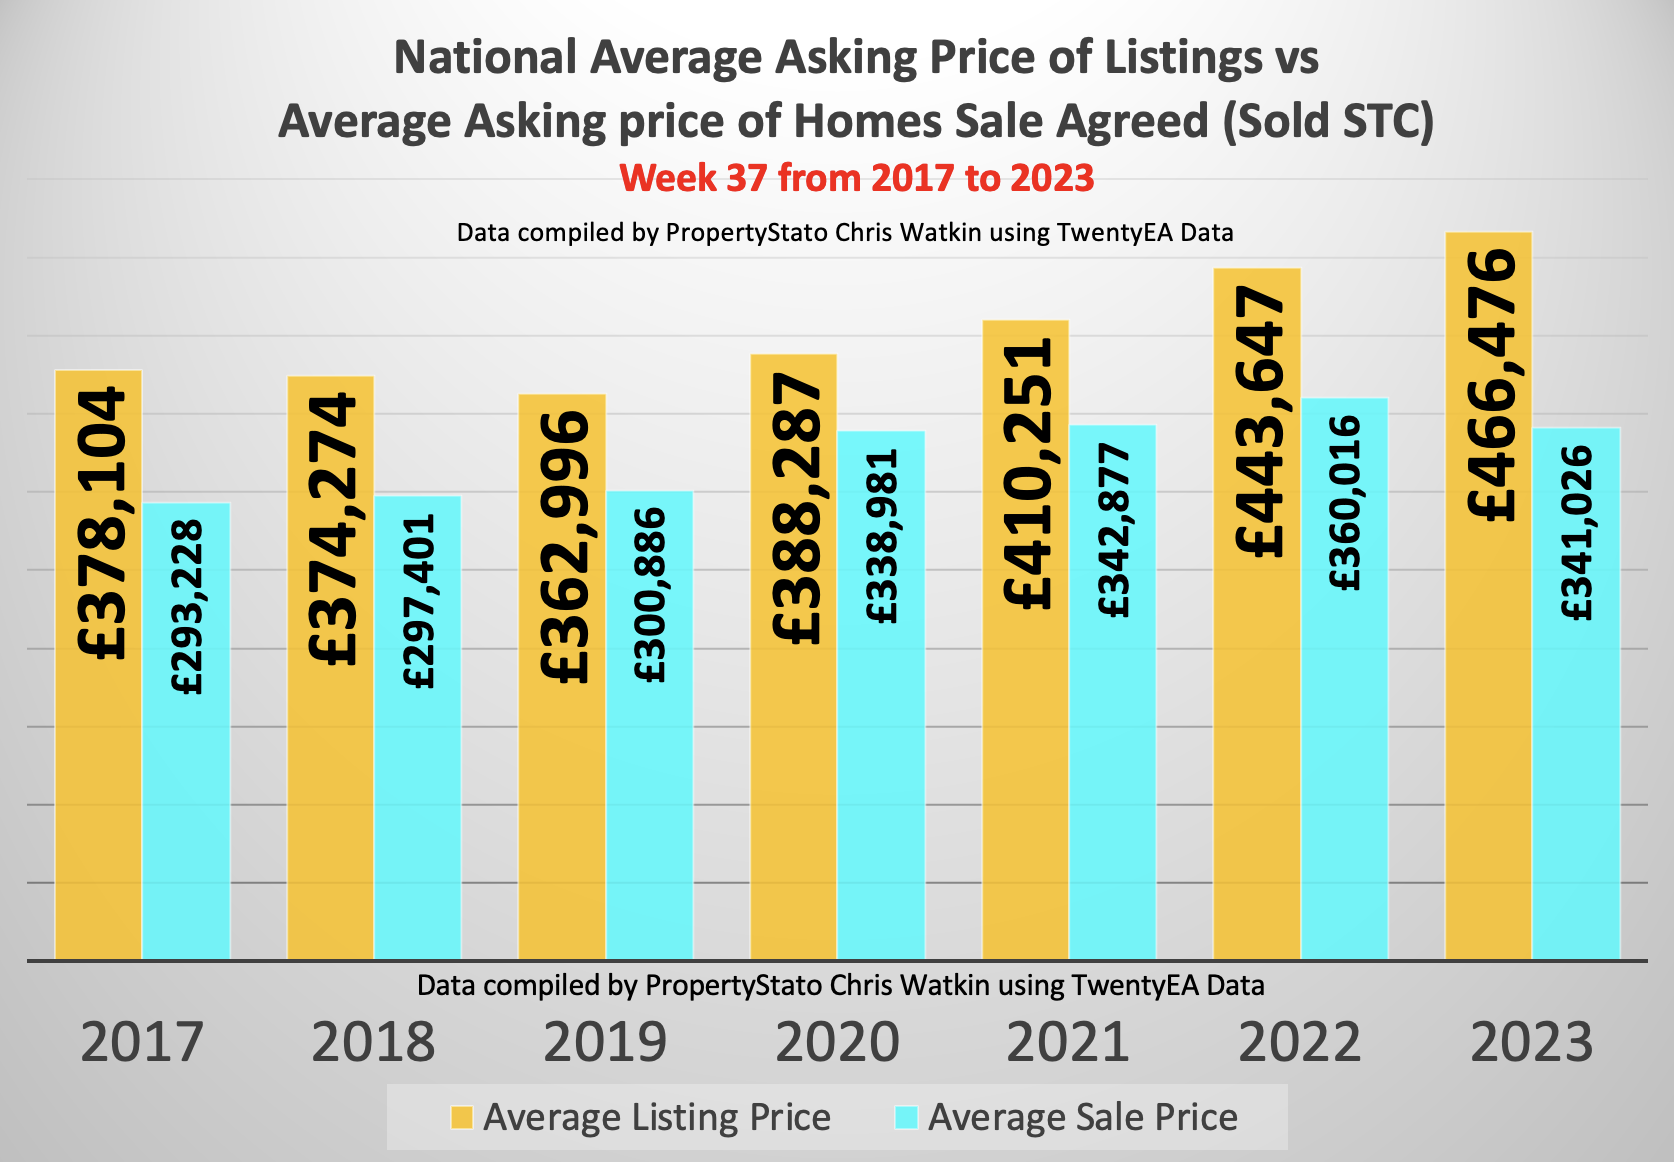
· Average Listing Price: The average listing price was significantly higher for the third week to £466,472. The 2023 running weekly average of £432,261.
· Price Reductions: 24,874 price reductions were seen last week, the highest weekly number since June 2018. The 2023 running weekly average is 19,842.
· Average Asking Price of Properties Being Reduced: This week’s average asking price of reduced properties dropped almost £13k to £415,972. The 2023 running weekly average of £402,704.
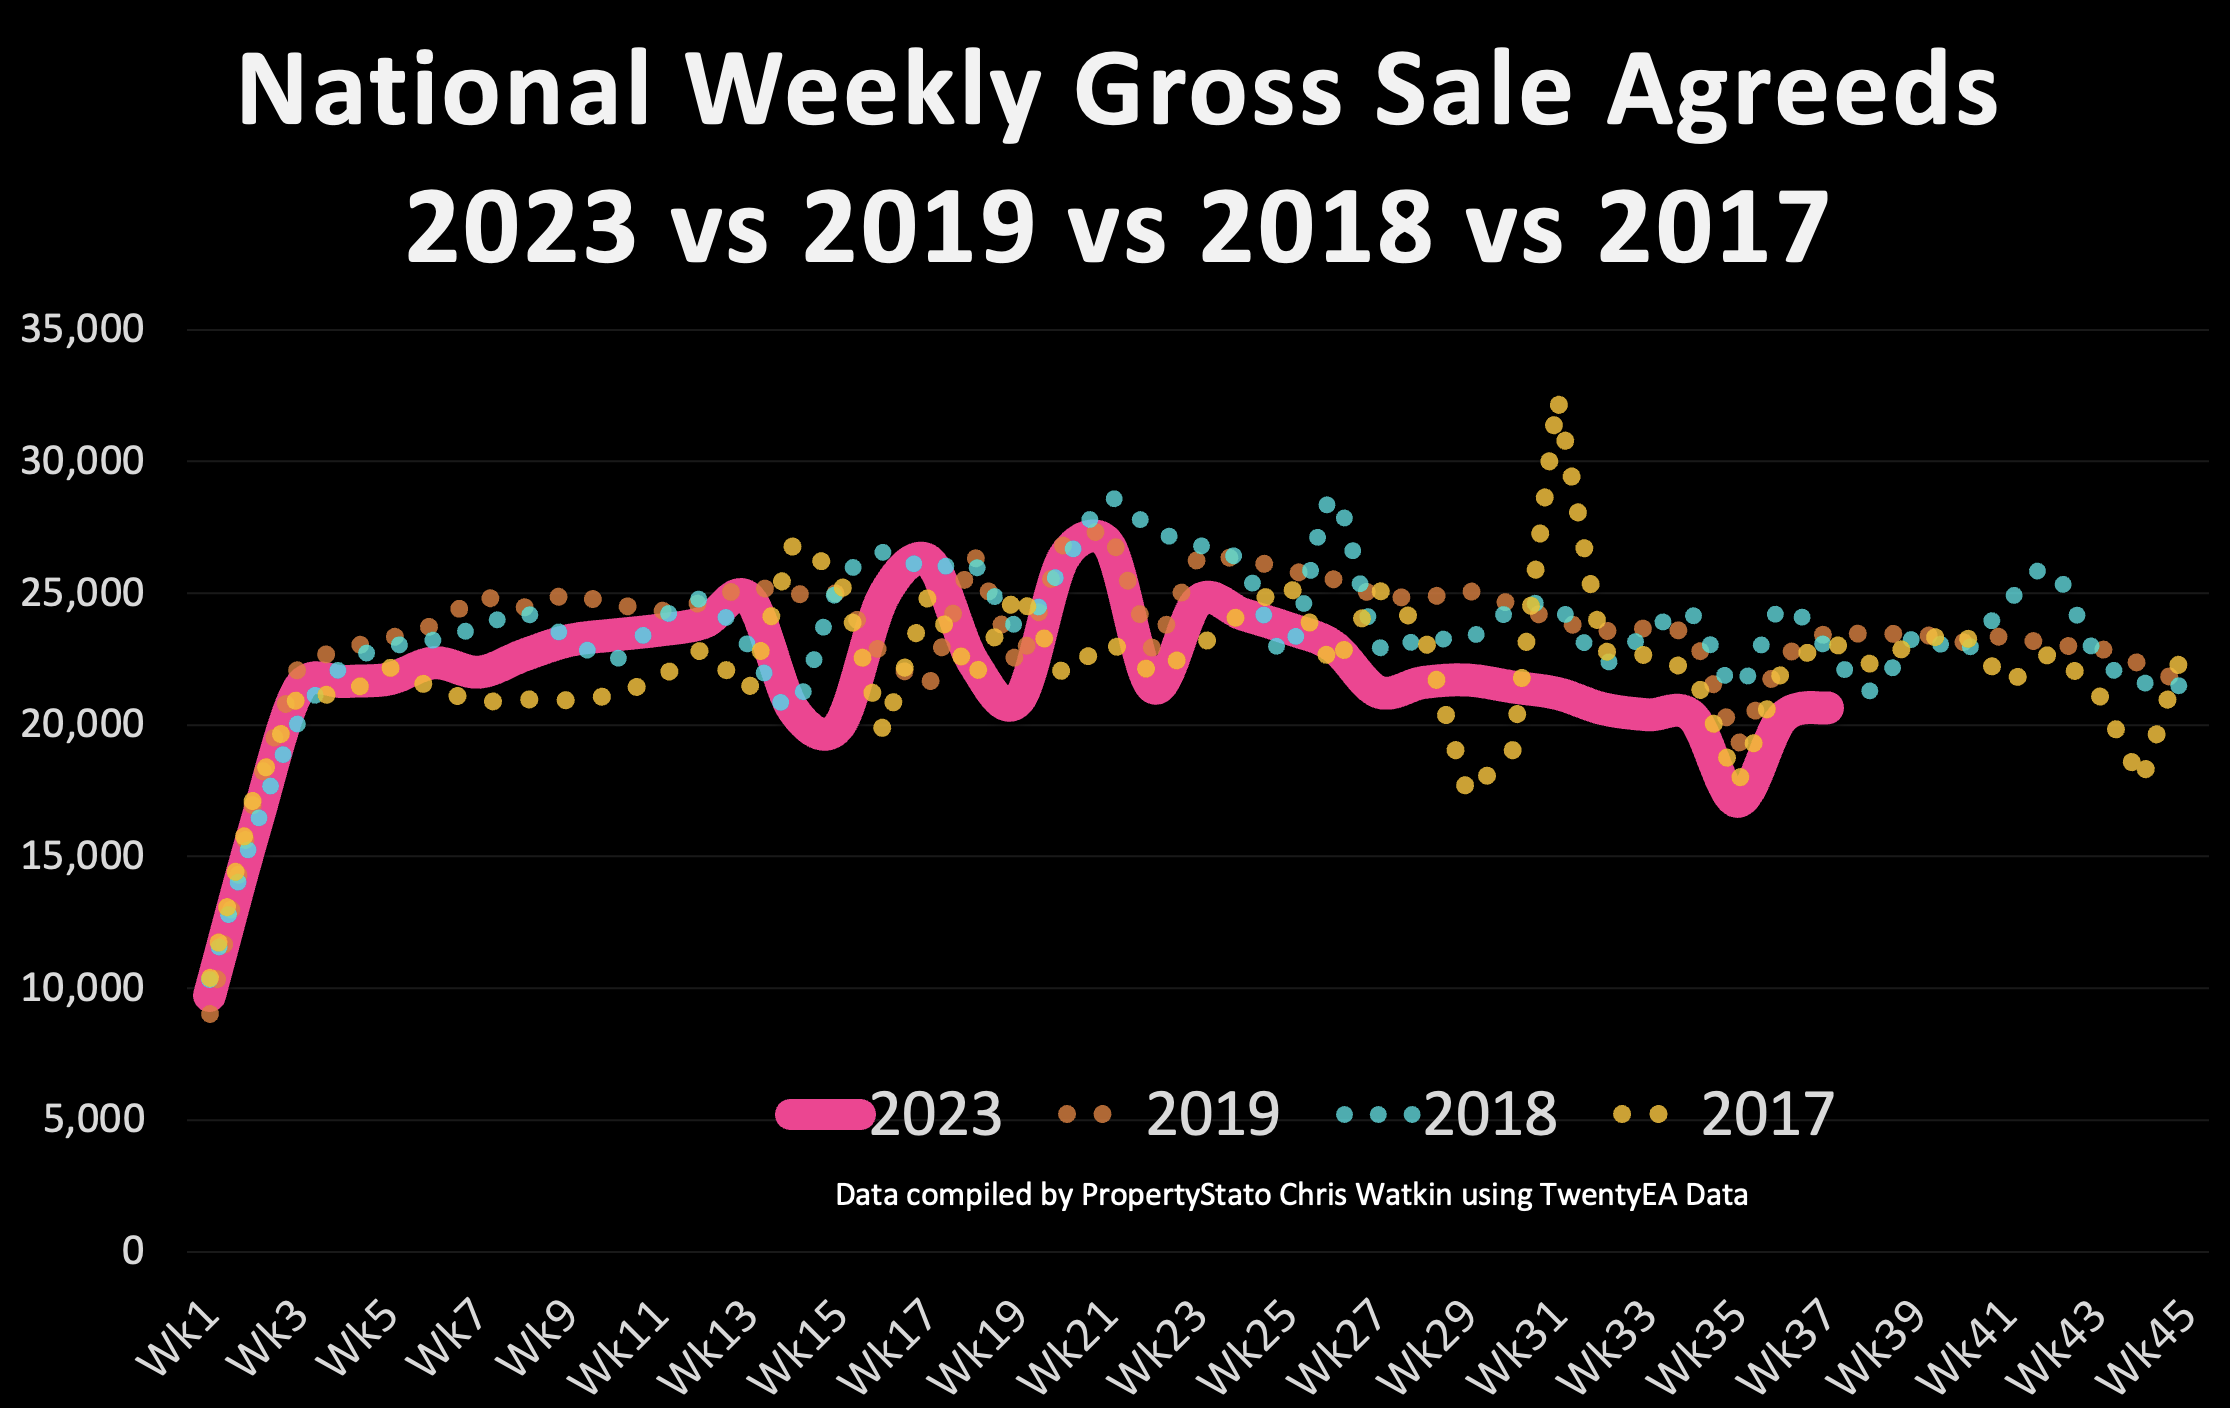
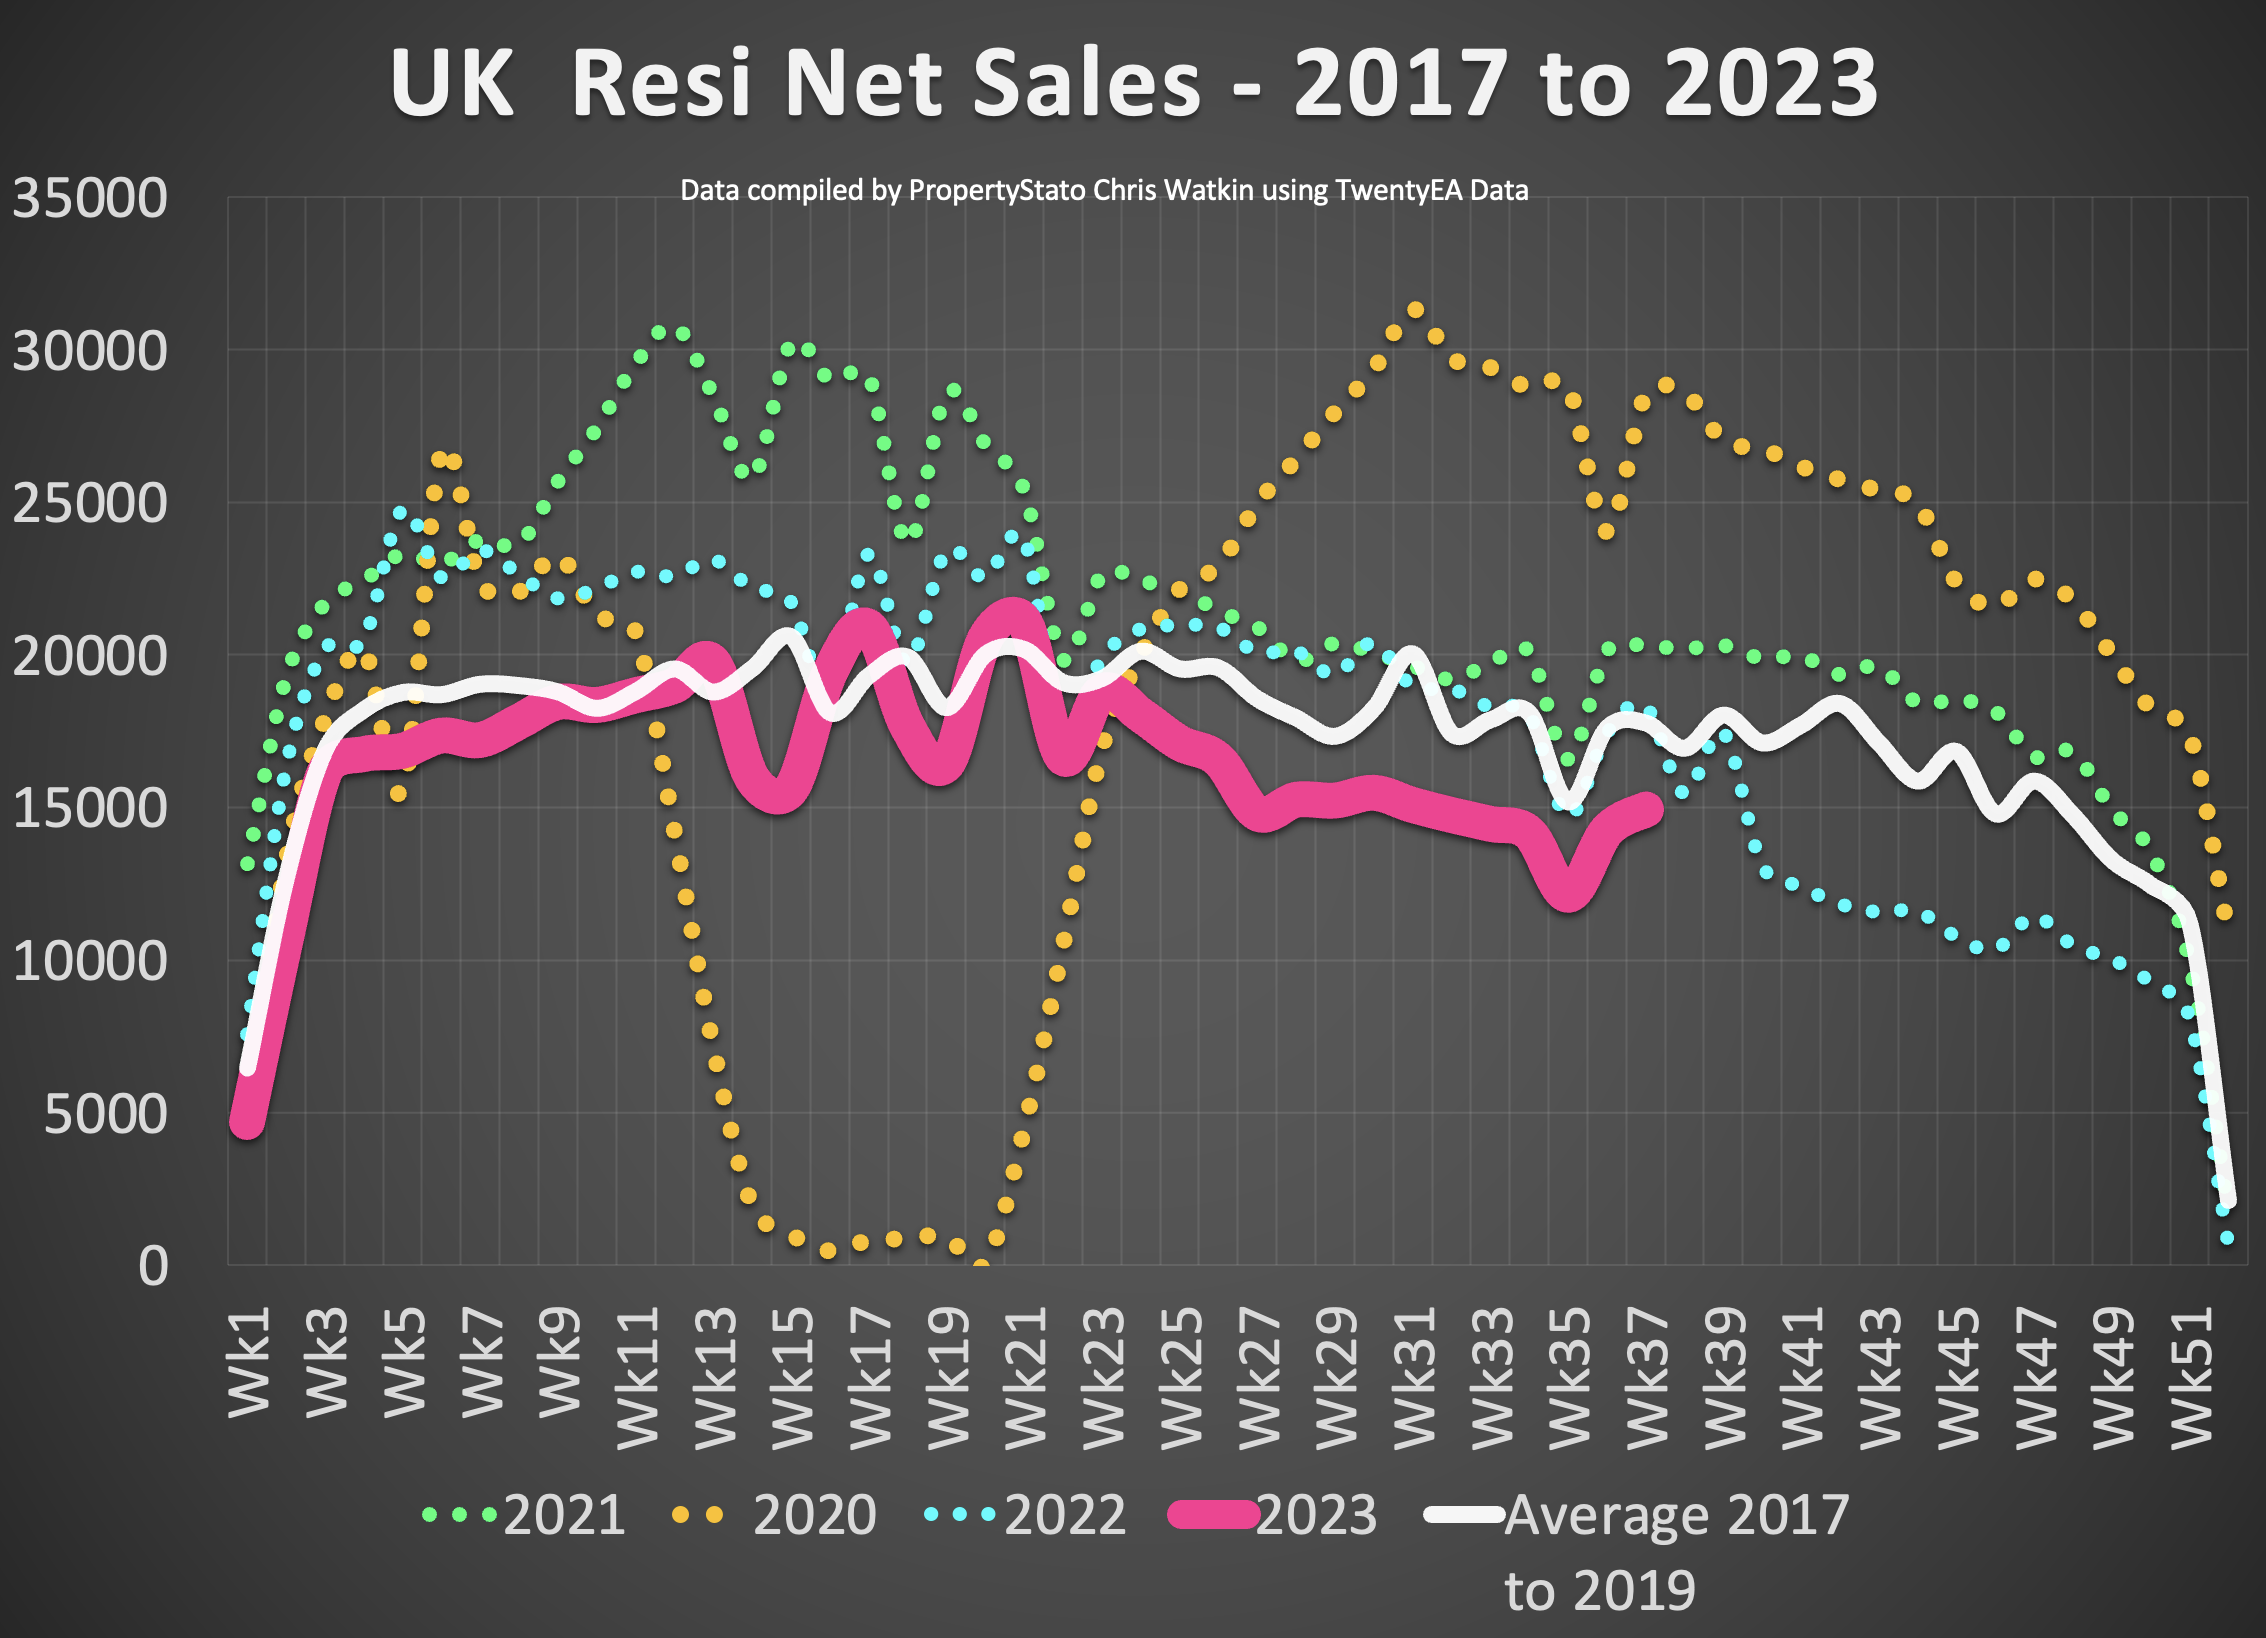
· Number of Properties Sold (Gross Sales): Gross sales increased from last week’s Gross sales figures. Total number of gross sales in the UK last week was 20,647. For comparison, the 2023 running weekly average is 21,841 weekly sales (stc).
· Average Asking Price of Properties Sold STC this Week: The average asking price of the properties selling last week was £341,026. The 2023 running weekly average of £357,608.
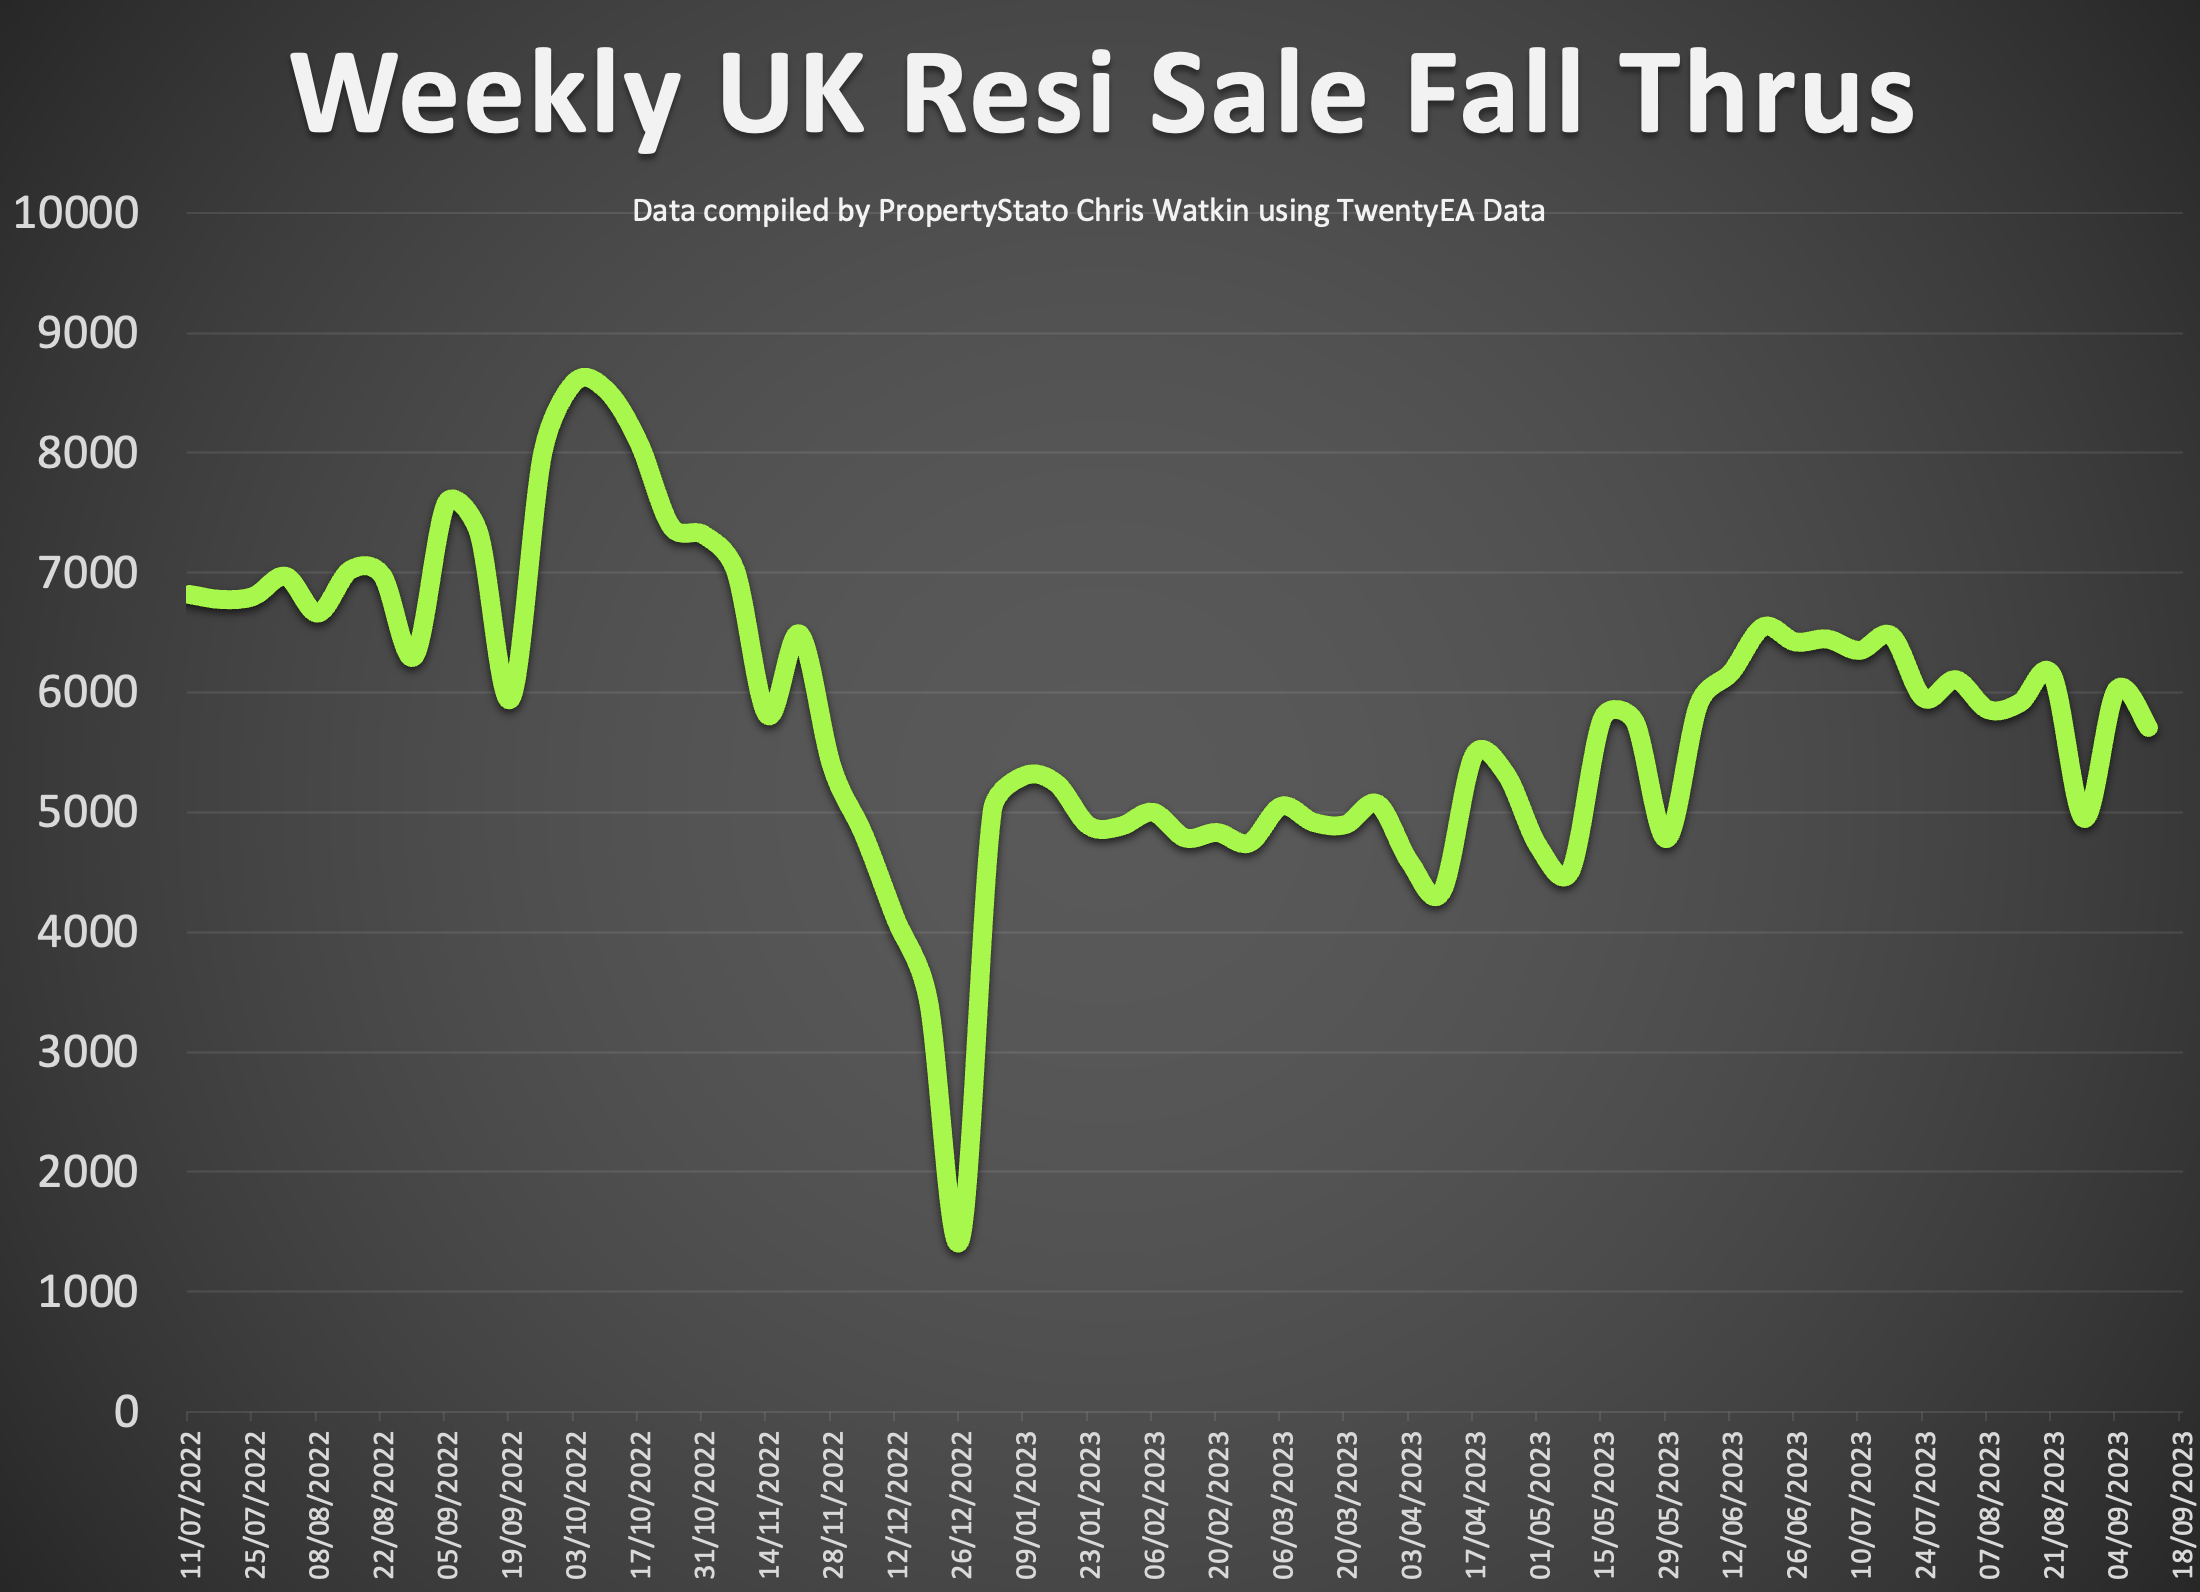
· Sale Fall Throughs: Sale Fall Thrus dropped significantly last week to a 27.64% sale fall thru rate (Sale fall Thru Rate % is the number of sales fall Thrus for the week expressed as a percentage of Gross Sales for the week). The 2023 running weekly average is 25.49% (although, don’t forget, in Q4 2022, the average was North of 38%). The seven-year long-term average is 24.3%.
· Net Sales This Week: Net Sales jumped by 4.82% from the week before to 14,940 (and that’s off the back of an increase of 17.35% from the week before that). The 2023 running weekly average is 16,414.
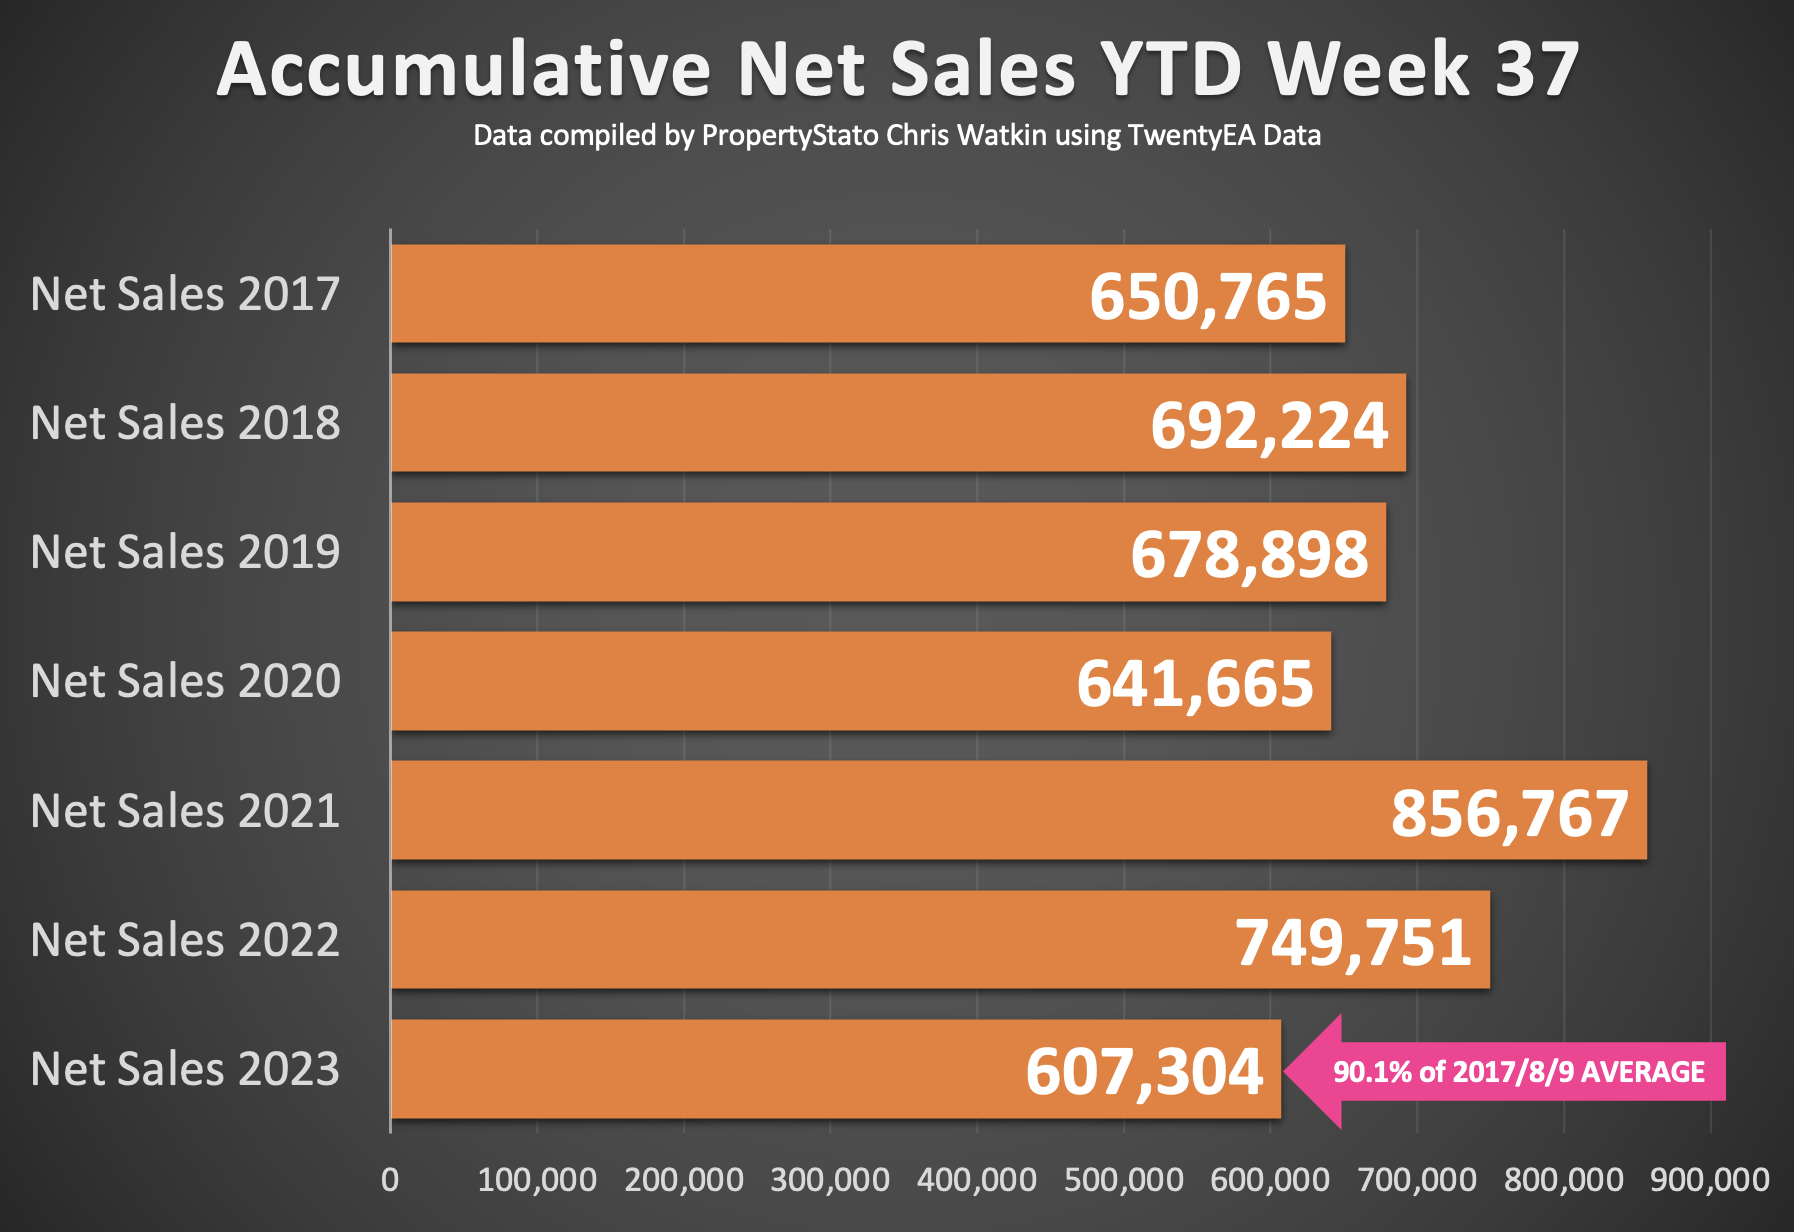
· Net Sales Year-to-Date: Despite the challenges, the year-to-date net sales of 607k showcase despite the challenging economic news, the market is 9.8% behind the 2017/8/9 average YTD for net sales
In the last 20 minutes of the show, there is the usual local focus, and this week it is on Hull.
In a nutshell..
35k listings a week
21k gross sales a week
5k sale fall thrus a week
…. meaning only 45.7% of listings (16k net sales as a % of 35k listings) are going thru to exchange
You must be logged in to like or dislike this comments.
Click to login
Don't have an account? Click here to register
Great stat’s Chris – thanks as ever!
You must be logged in to like or dislike this comments.
Click to login
Don't have an account? Click here to register