
 This week’s special guest Richard Durrant features on the show to talk about the current state of play in the UK property market for the week ending Sunday, 22nd October 2023.
Headlines:
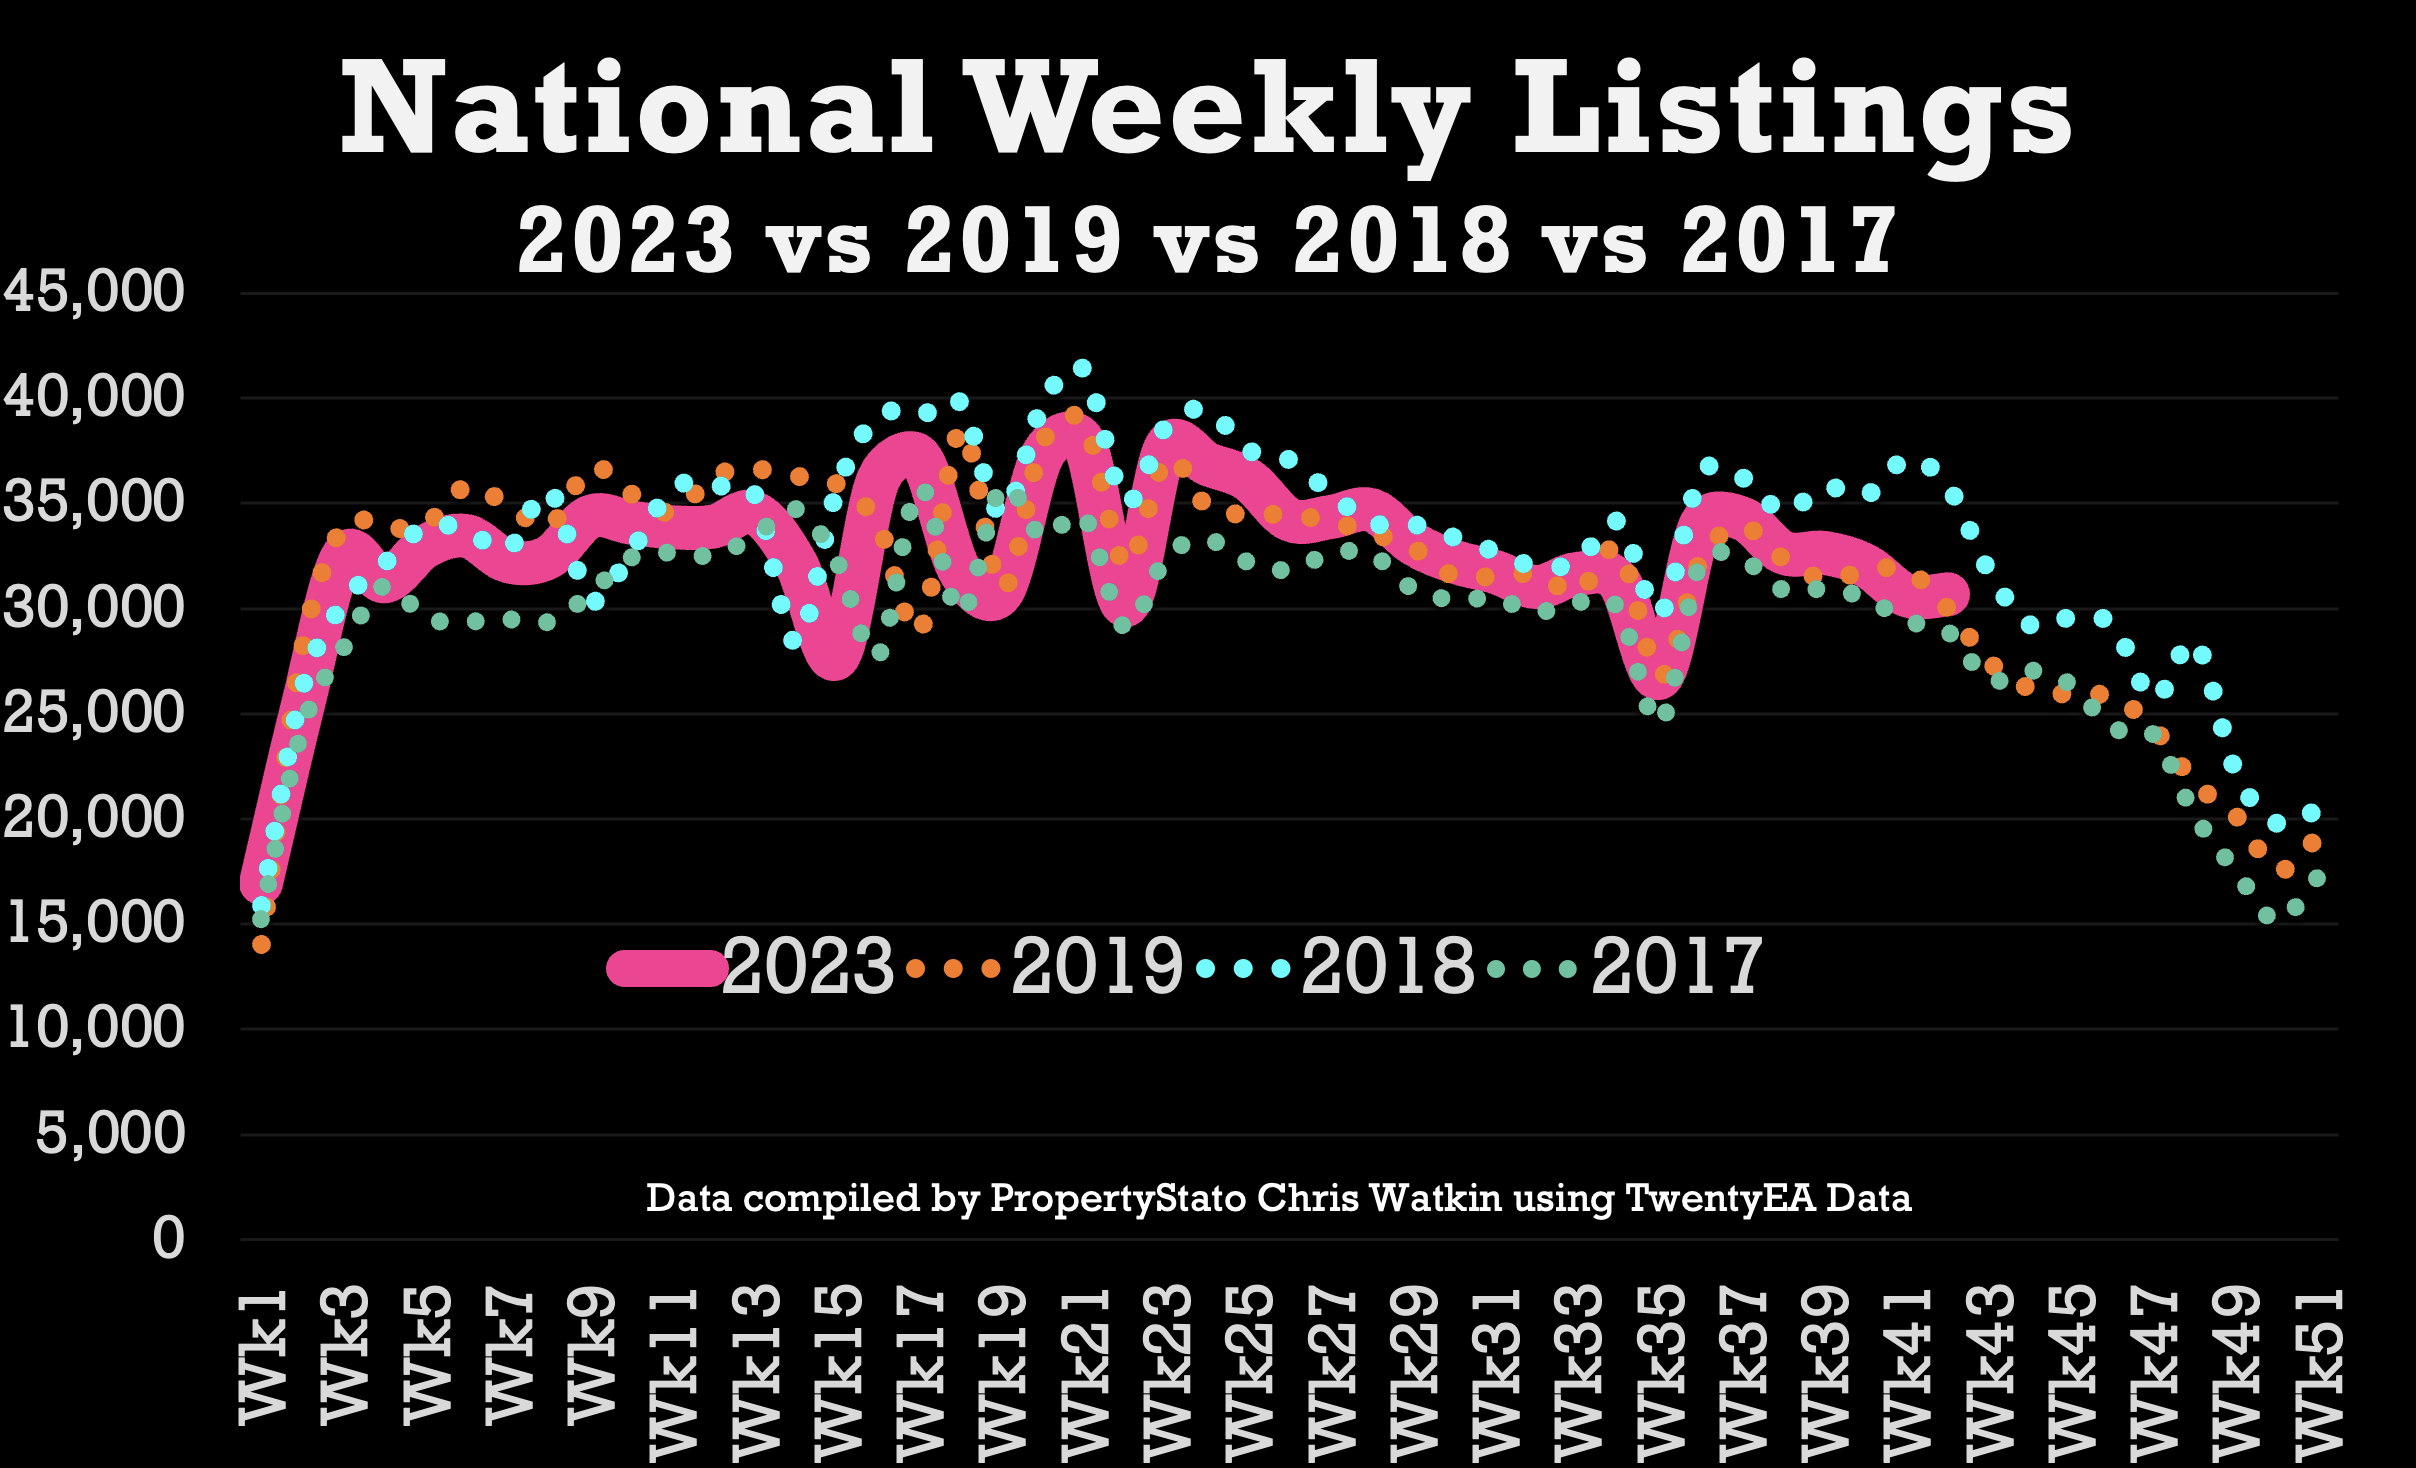
Listings YTD 2023 are 99.5% of the 2017/8/9 YTD average (last week 99.6%)
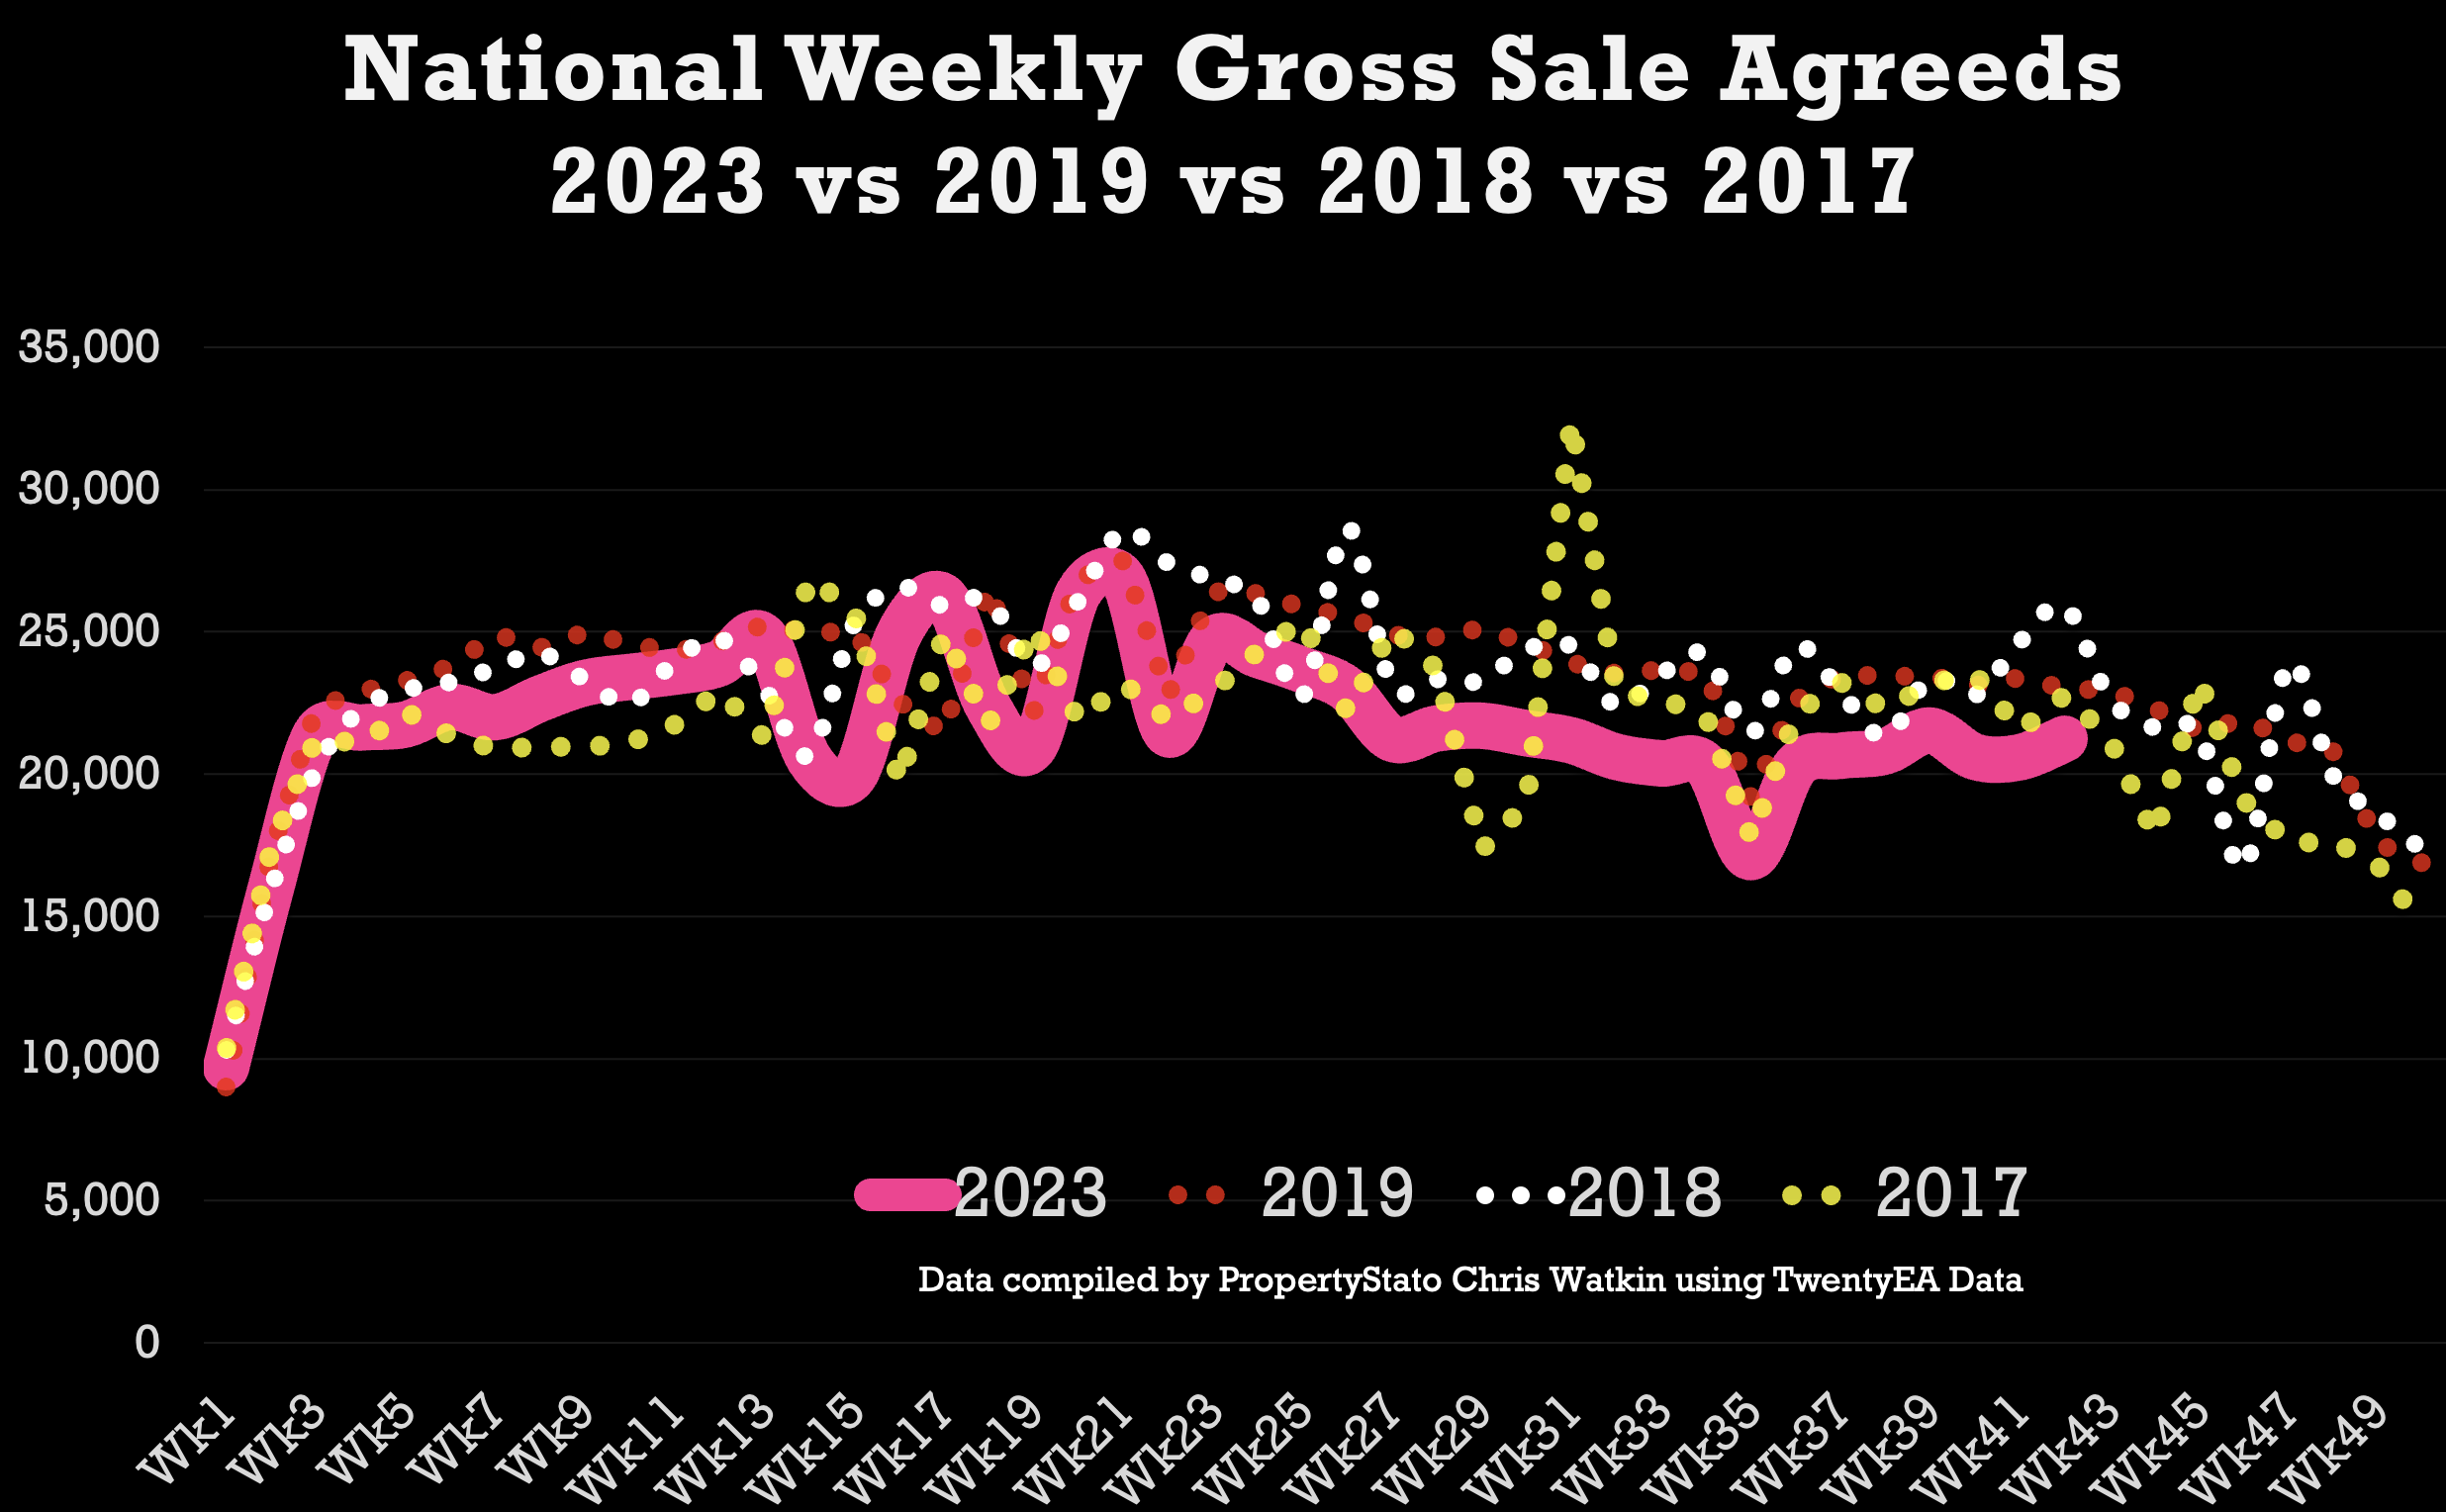
Gross Sales YTD 2023 are 94.0% of the 2017/8/9 YTD average (last week 94.1%)
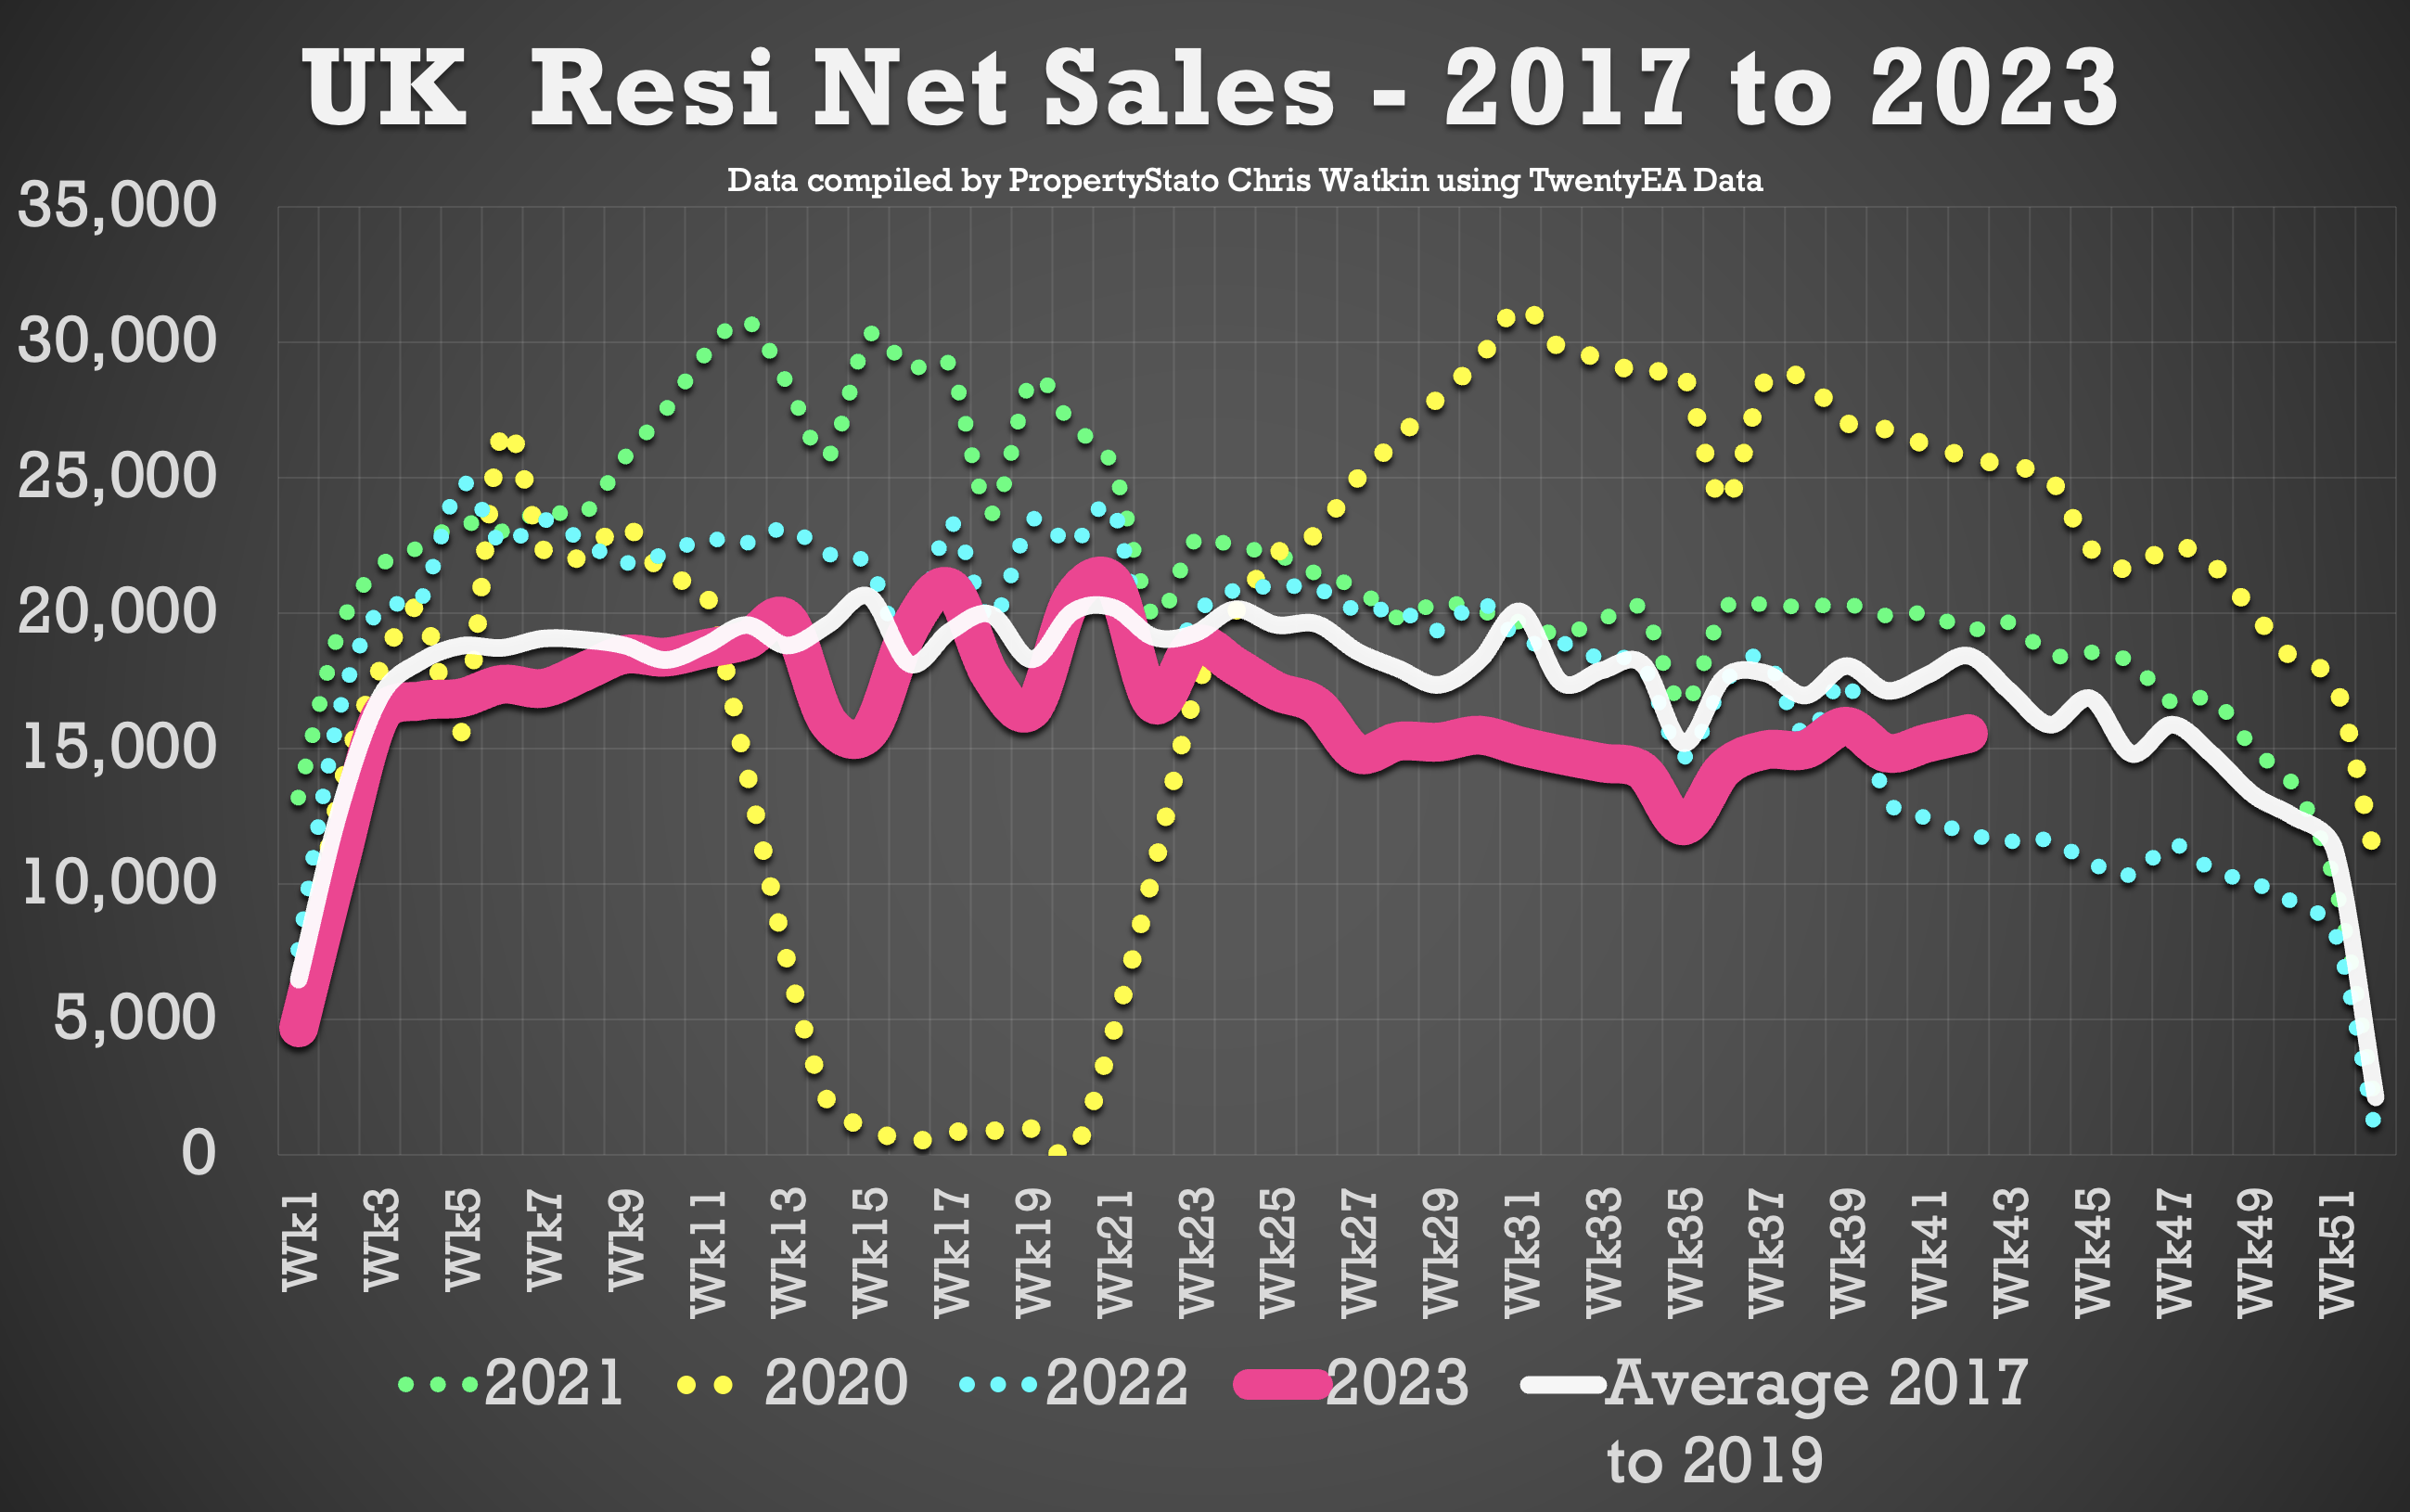
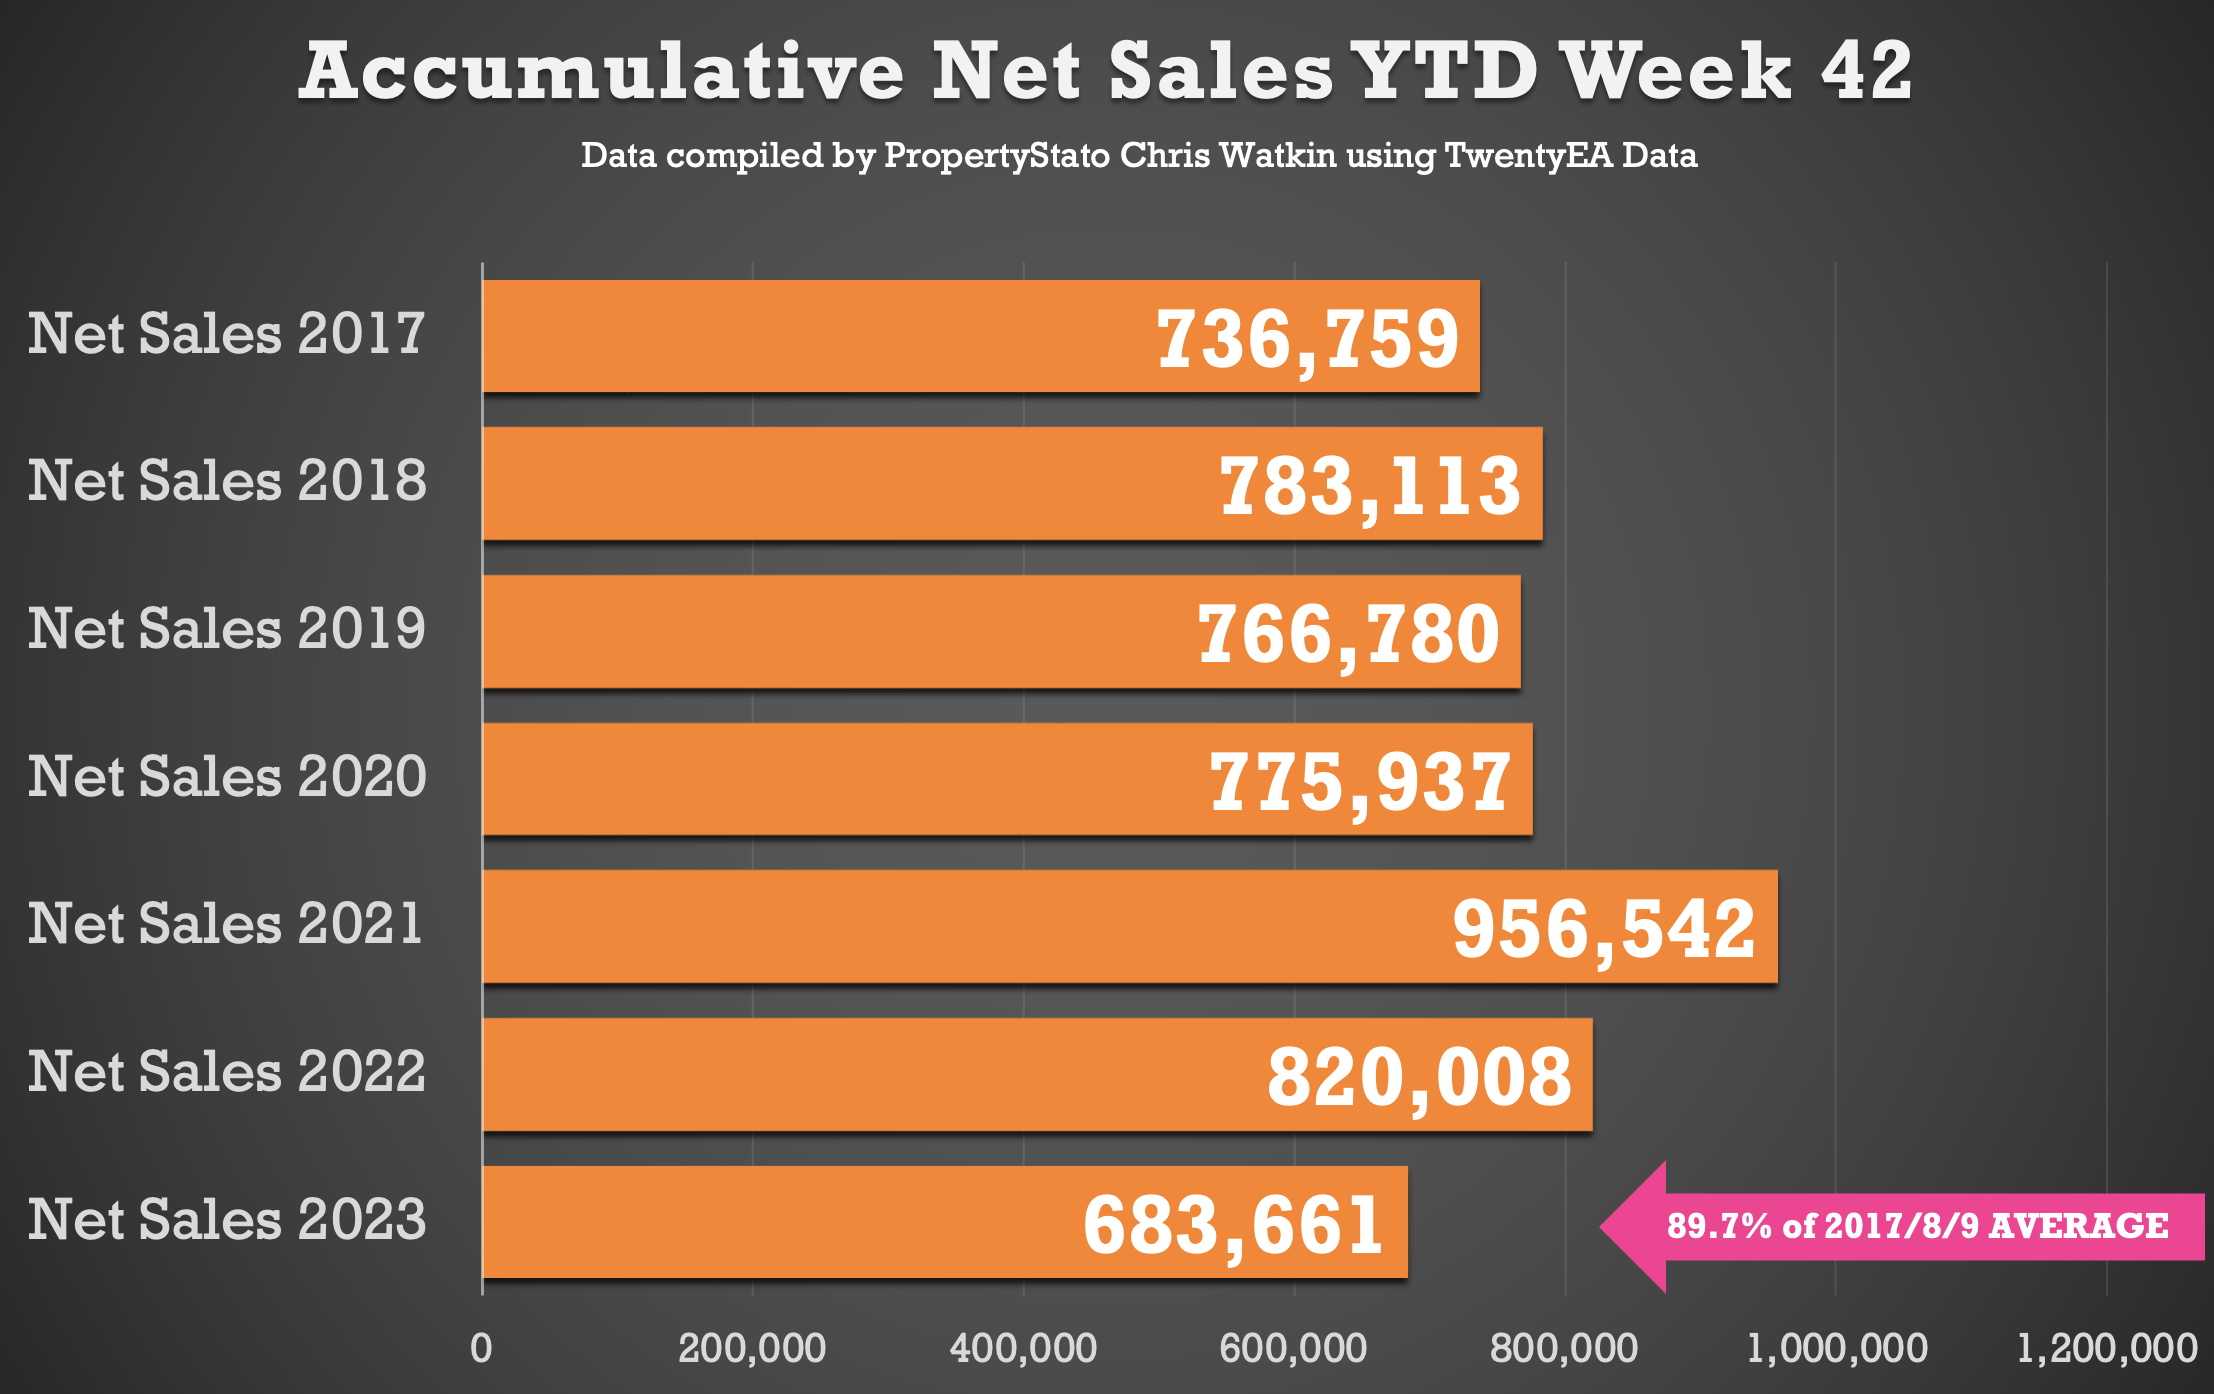
Net Sales YTD 2023 are 89.7% of the 2017/8/9 YTD average (last week 89.8%)
Looking at key statistics in more detail.
· New Properties to the Market (Listings): The number of listings last week was 30,684 (almost identical to last week). The 2023 YTD running weekly average stands strong at 32,580.
· Average Listing Price: The average listing price is continuing showing sings of returning to the sums seen in the Summer. Average Listing price this week £421,944. The 2023 running weekly average of £432,941. % Difference between Listing and Sale Agreed prices at 19% this week which means it’s below the 20% barrier which is better for the property market. 2023 YTD average 21% and long term 7 year average 17%.
· Price Reductions: 23,384 price reductions were seen last week. The 2023 running weekly average is 20,346 per week. This means approximately 14.7% of Resi Stock is being reduced per month (ie just under 1 in 7)
· Average Asking Price of Properties Being Reduced: This week’s average asking price of reduced properties £397,423. The 2023 running weekly average of £403,568.
· Number of Properties Sold (Gross Sales): Gross sales increased from last week’s decent Gross sales figures. Total number of gross sales in the UK last week was 21,247. For comparison, the 2023 running weekly average is 21,736 weekly sales (stc).
· Average Asking Price of Properties Sold STC this Week: The average asking price of the properties selling last week was £356,000, which has remained quite static over the last few months. The 2023 running weekly average of £357,316.
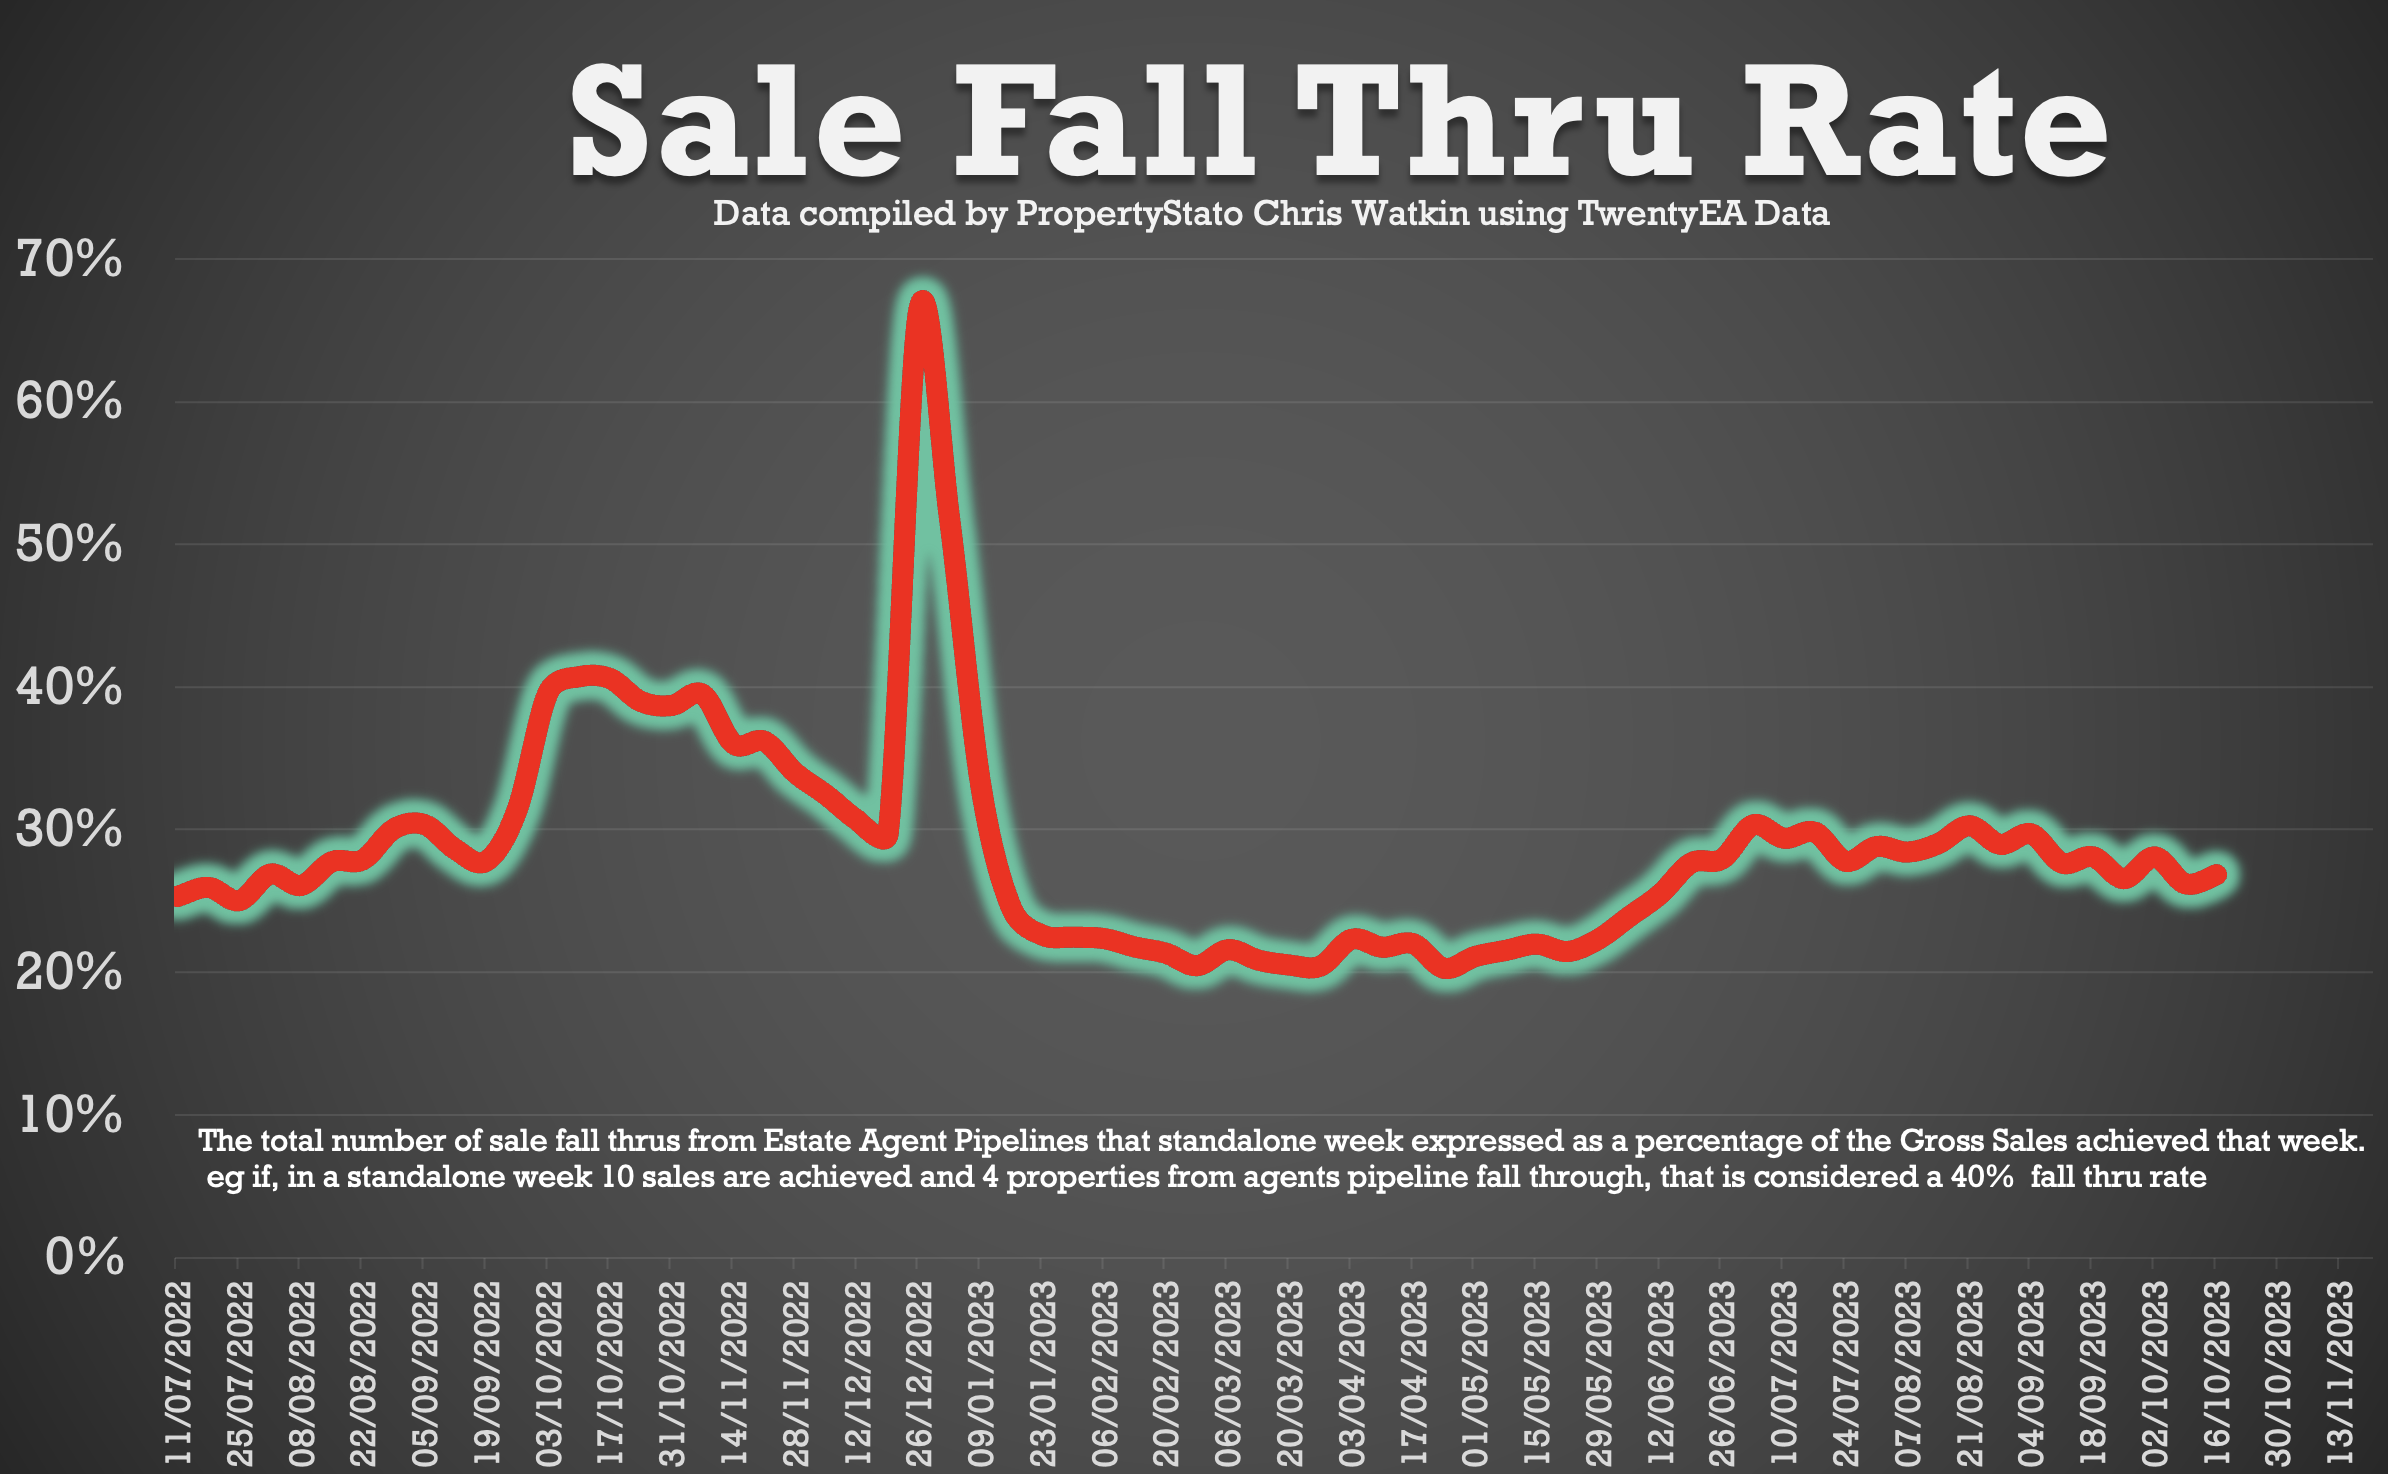
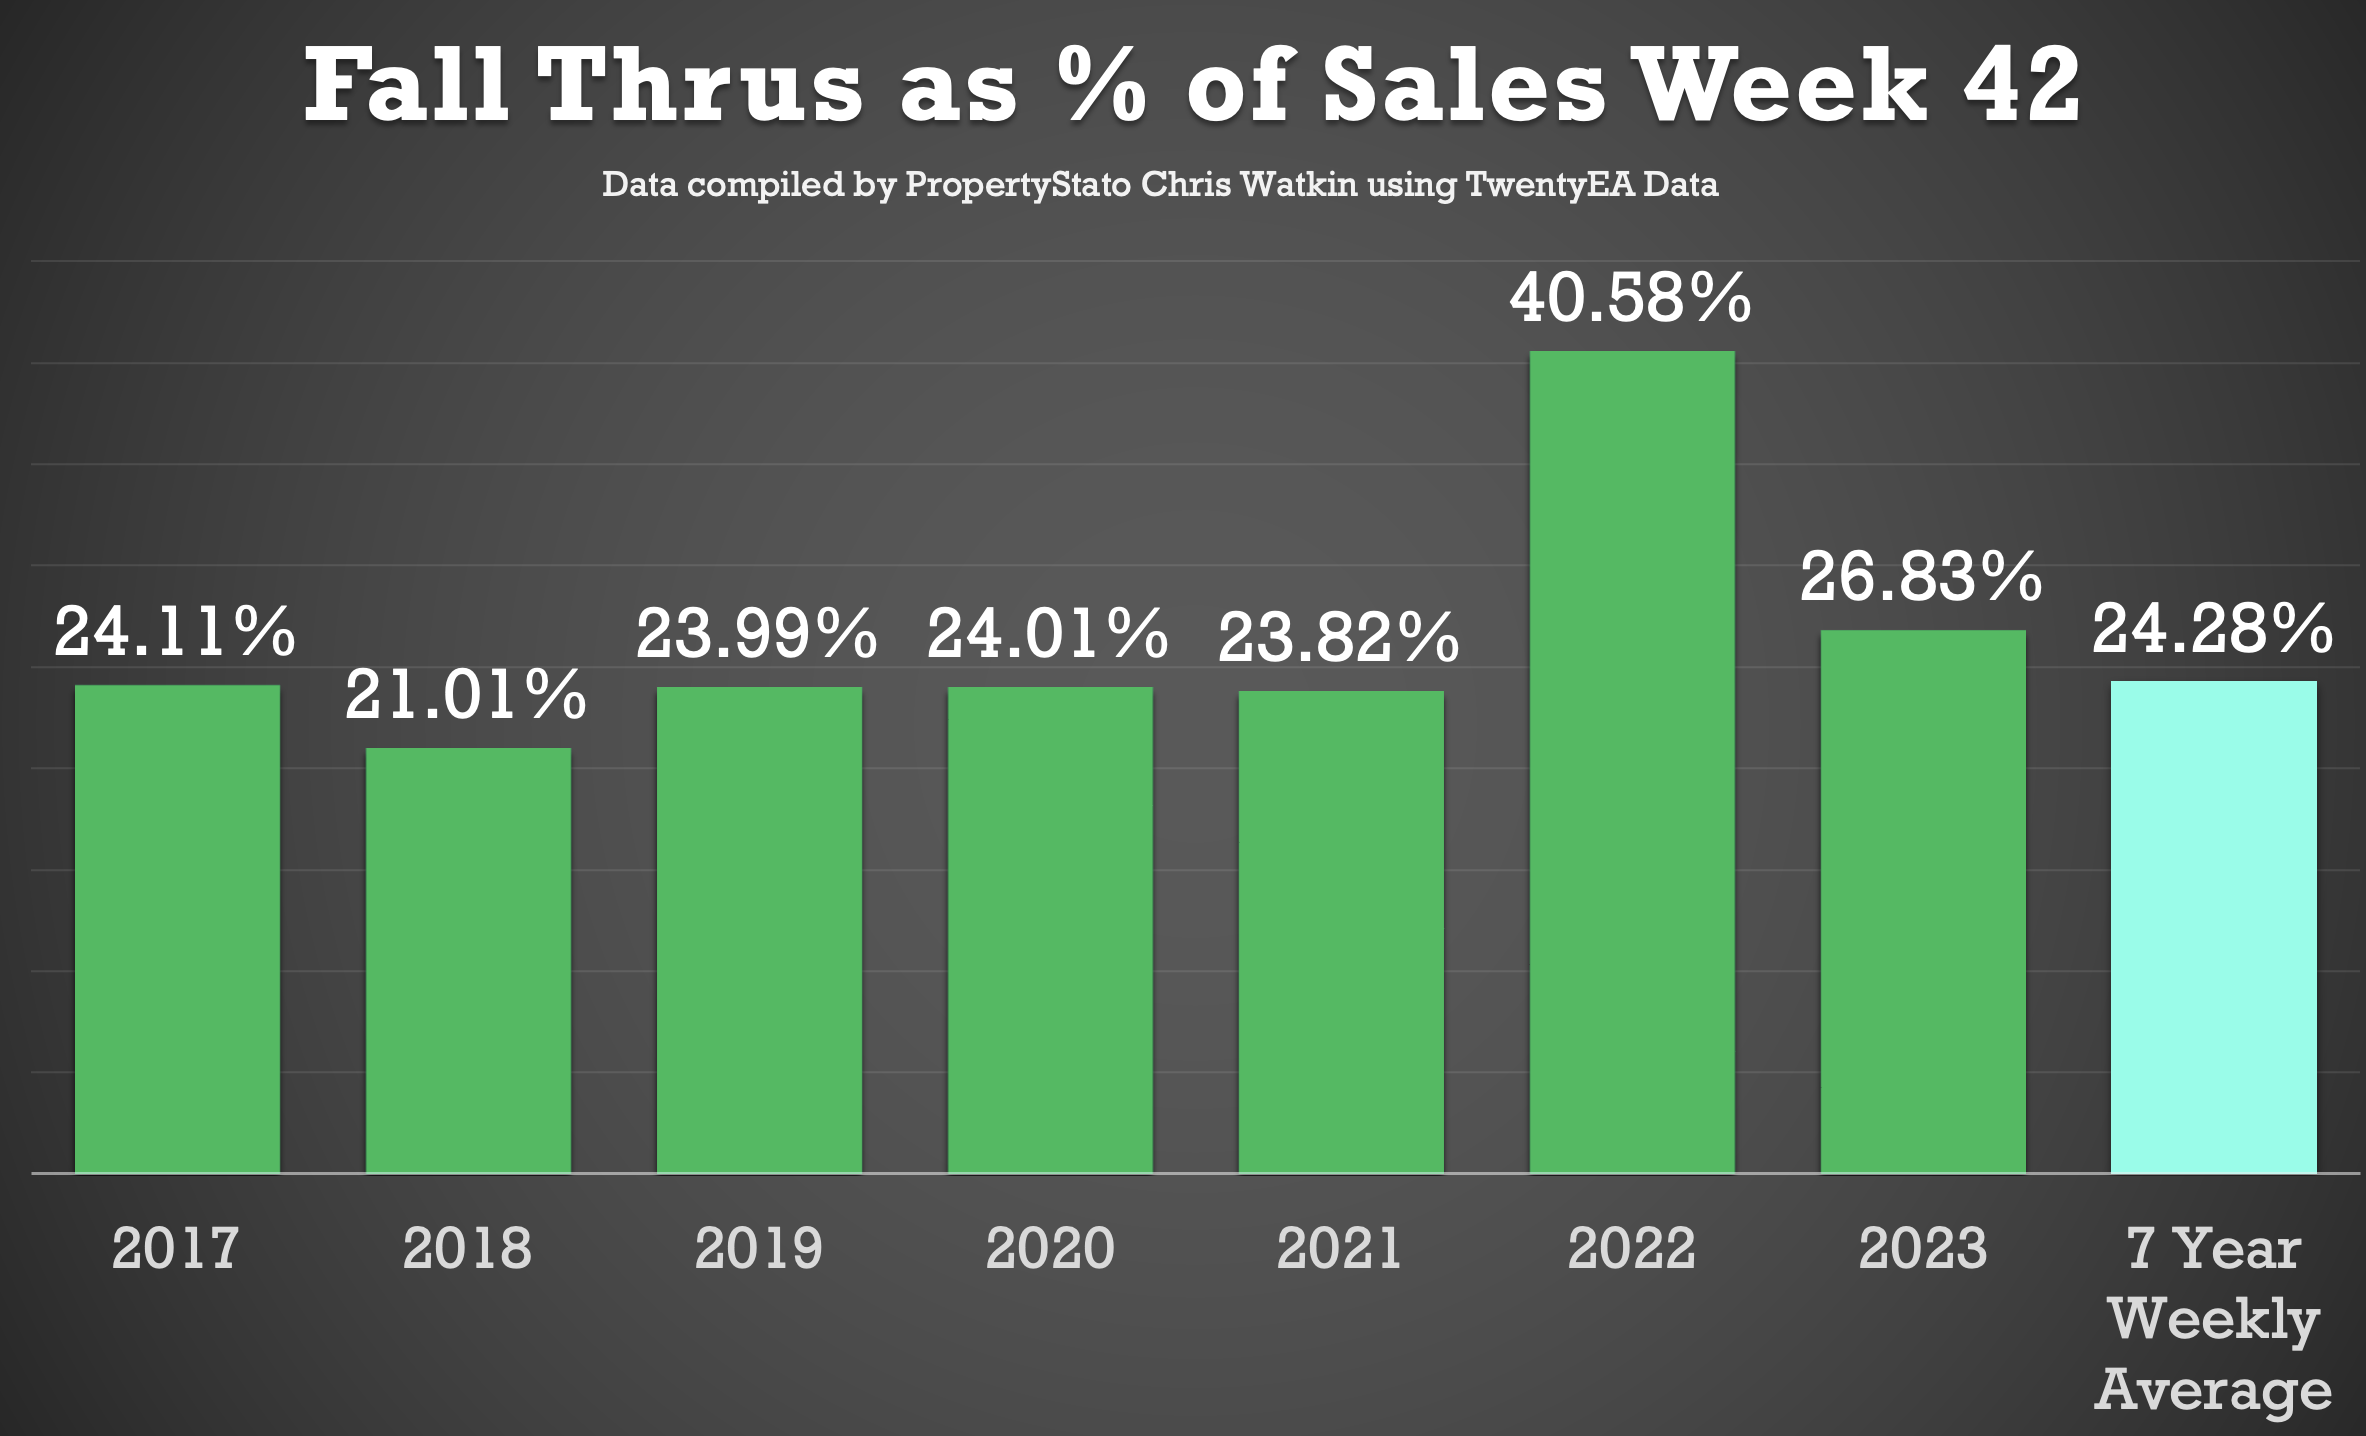
· Sale Fall Throughs: 26.83% sale fall thru rate (Sale fall Thru Rate % is the number of sales fall Thrus for the week expressed as a percentage of Gross Sales for the week) remains nearer the mid 20%’s as opposed to the early 30%’s. The 2023 running weekly average is 25.68% (although, don’t forget, in the same week of 2022, it was 40.8%). The seven-year long-term average is 24.3%.
· Net Sales This Week: Net Sales increased to 15,547, excellent when compared to the running month average to 15,349. YTD running weekly average is 16,278
· Net Sales Year-to-Date: Despite the challenges, the year-to-date net sales of 683k showcase despite the challenging economic news, the market is 10.7% behind the 2017/8/9 average YTD for net sales
· Estate Agents Sales Pipelines : Despite the challenges, 412k properties are currently sold stc That is 11.1% higher for September than the Sept averages of 2017/18/19
Some additional Graphs and Charts that could interest agents ..
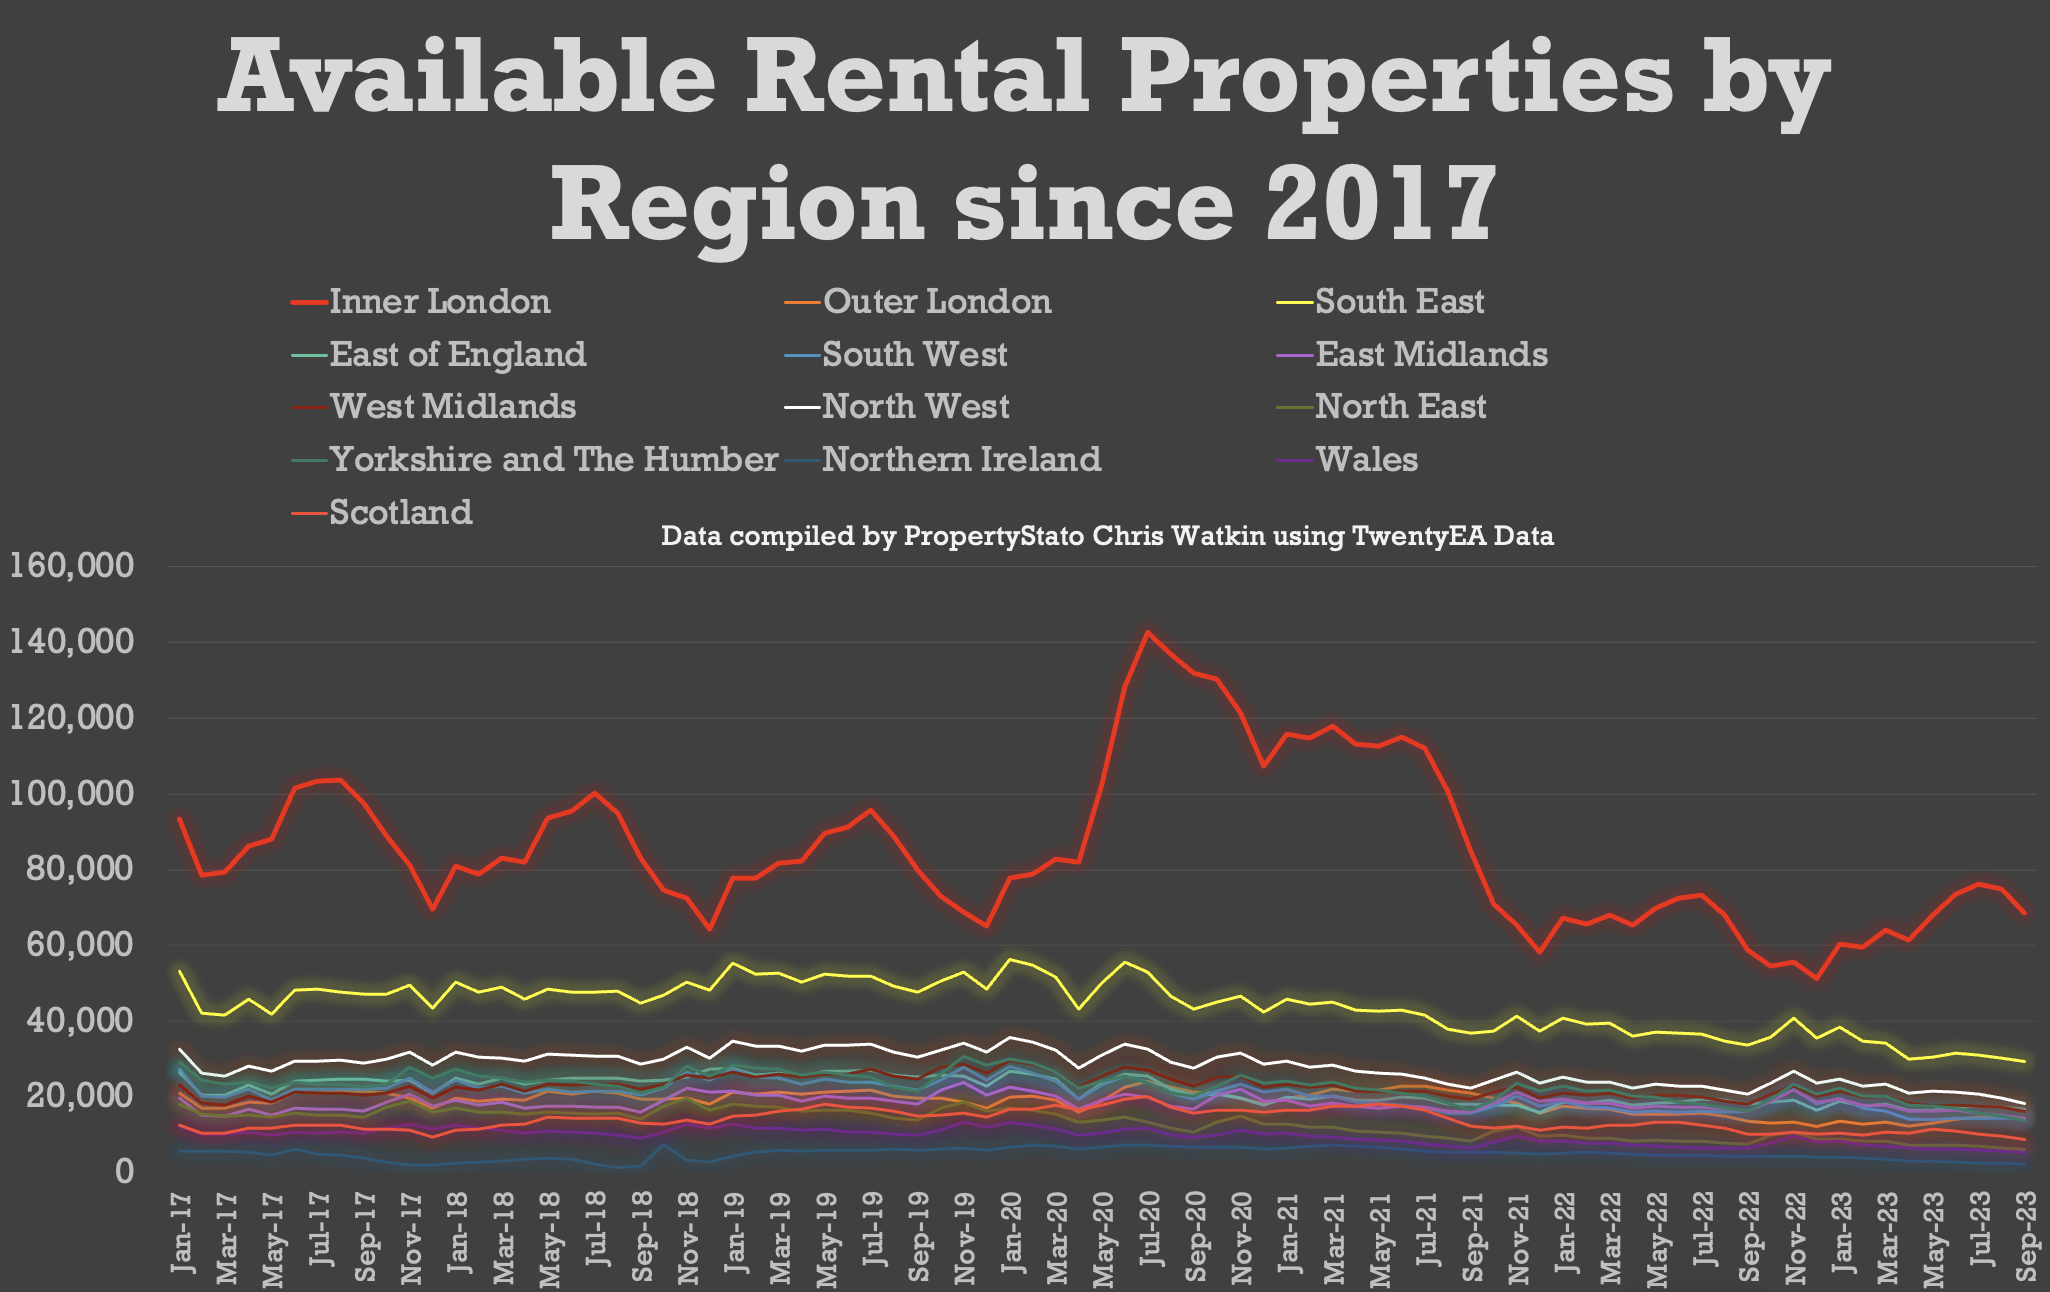
Available Rental Properties by Month in the UK, split down by Region:
The graph illustrates the available rental properties by region since 2017. A notable observation is the significant surge in properties in Inner London around 2020. Beginning near 60,000 in early 2017, Inner London’s rental properties skyrocketed, peaking at over 140,000 in 2020. This sharp rise sets Inner London apart from other regions, which largely display more stable figures. The data, sourced from TwentyEA, encompasses various UK regions but London’s 2020 growth is most striking.
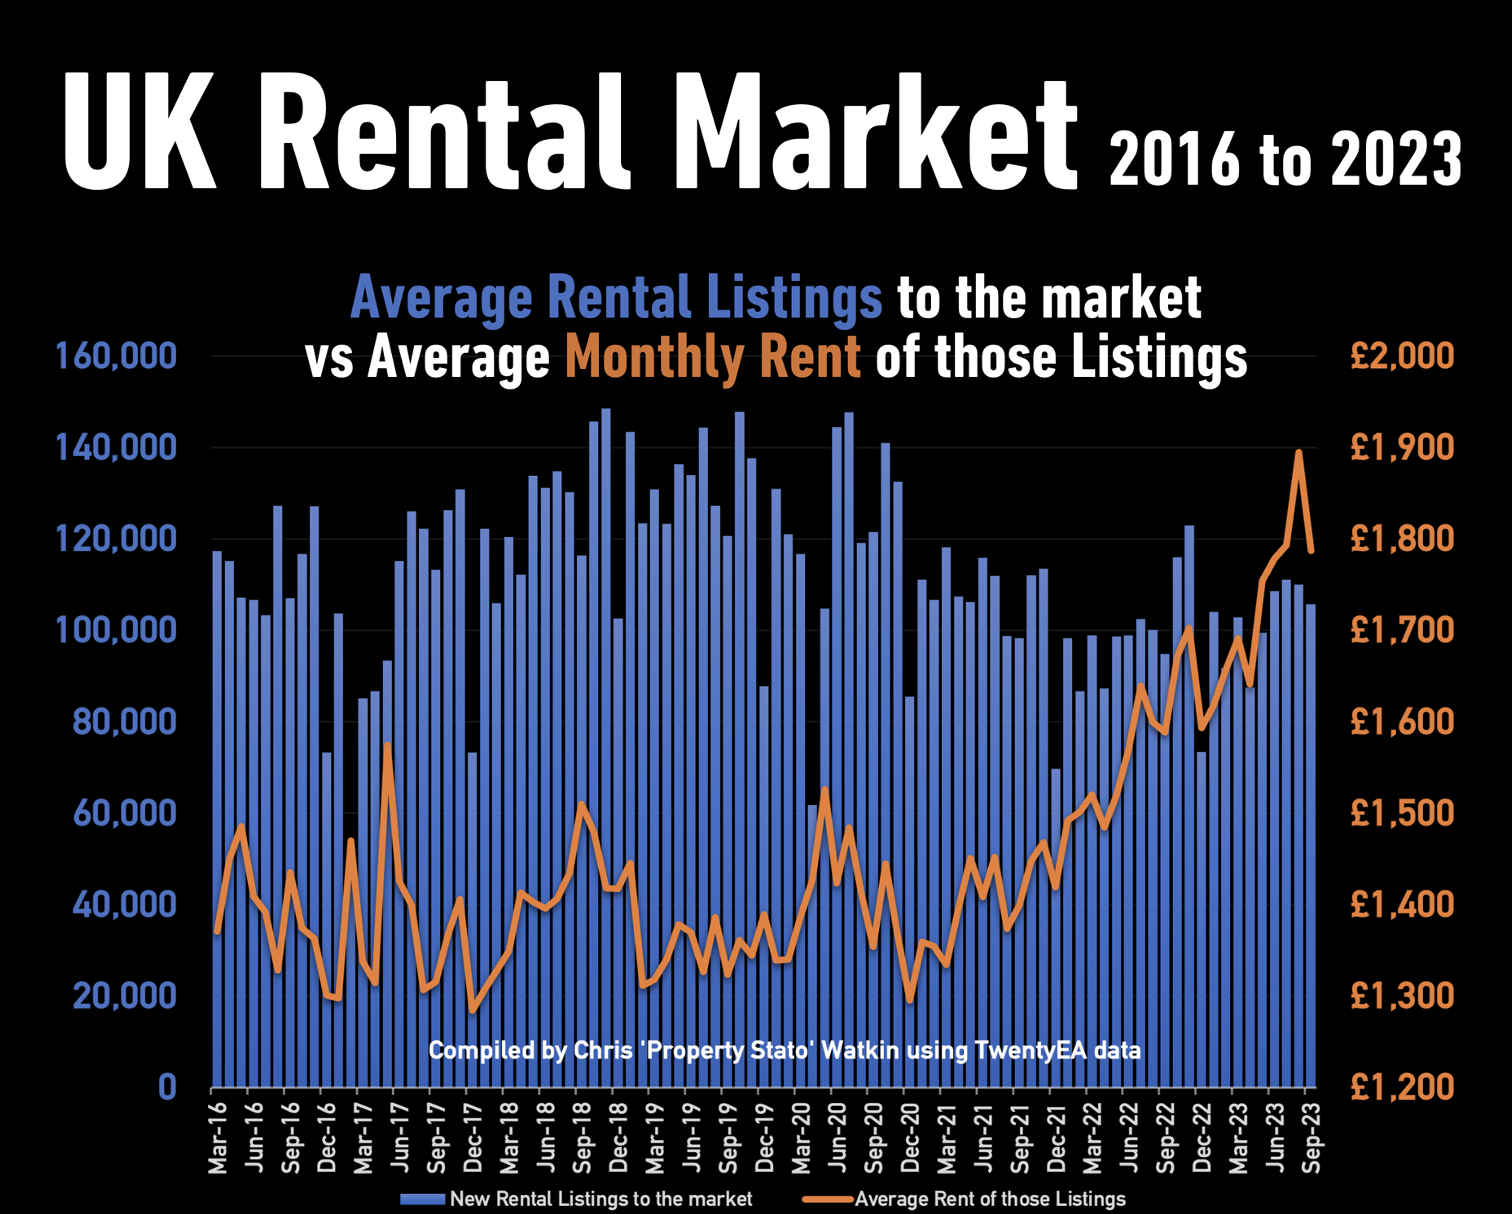
Rental New Listings vs Average Rent for those Rental Listings: The graph illustrates the UK Rental Market from 2016 to 2023, comparing the average monthly rent of listings to the number of new listings. Over this period, new rental listings show periodic fluctuations while the average rent steadily increases, particularly from 2021 onwards, nearing £2,000 by mid-2023.
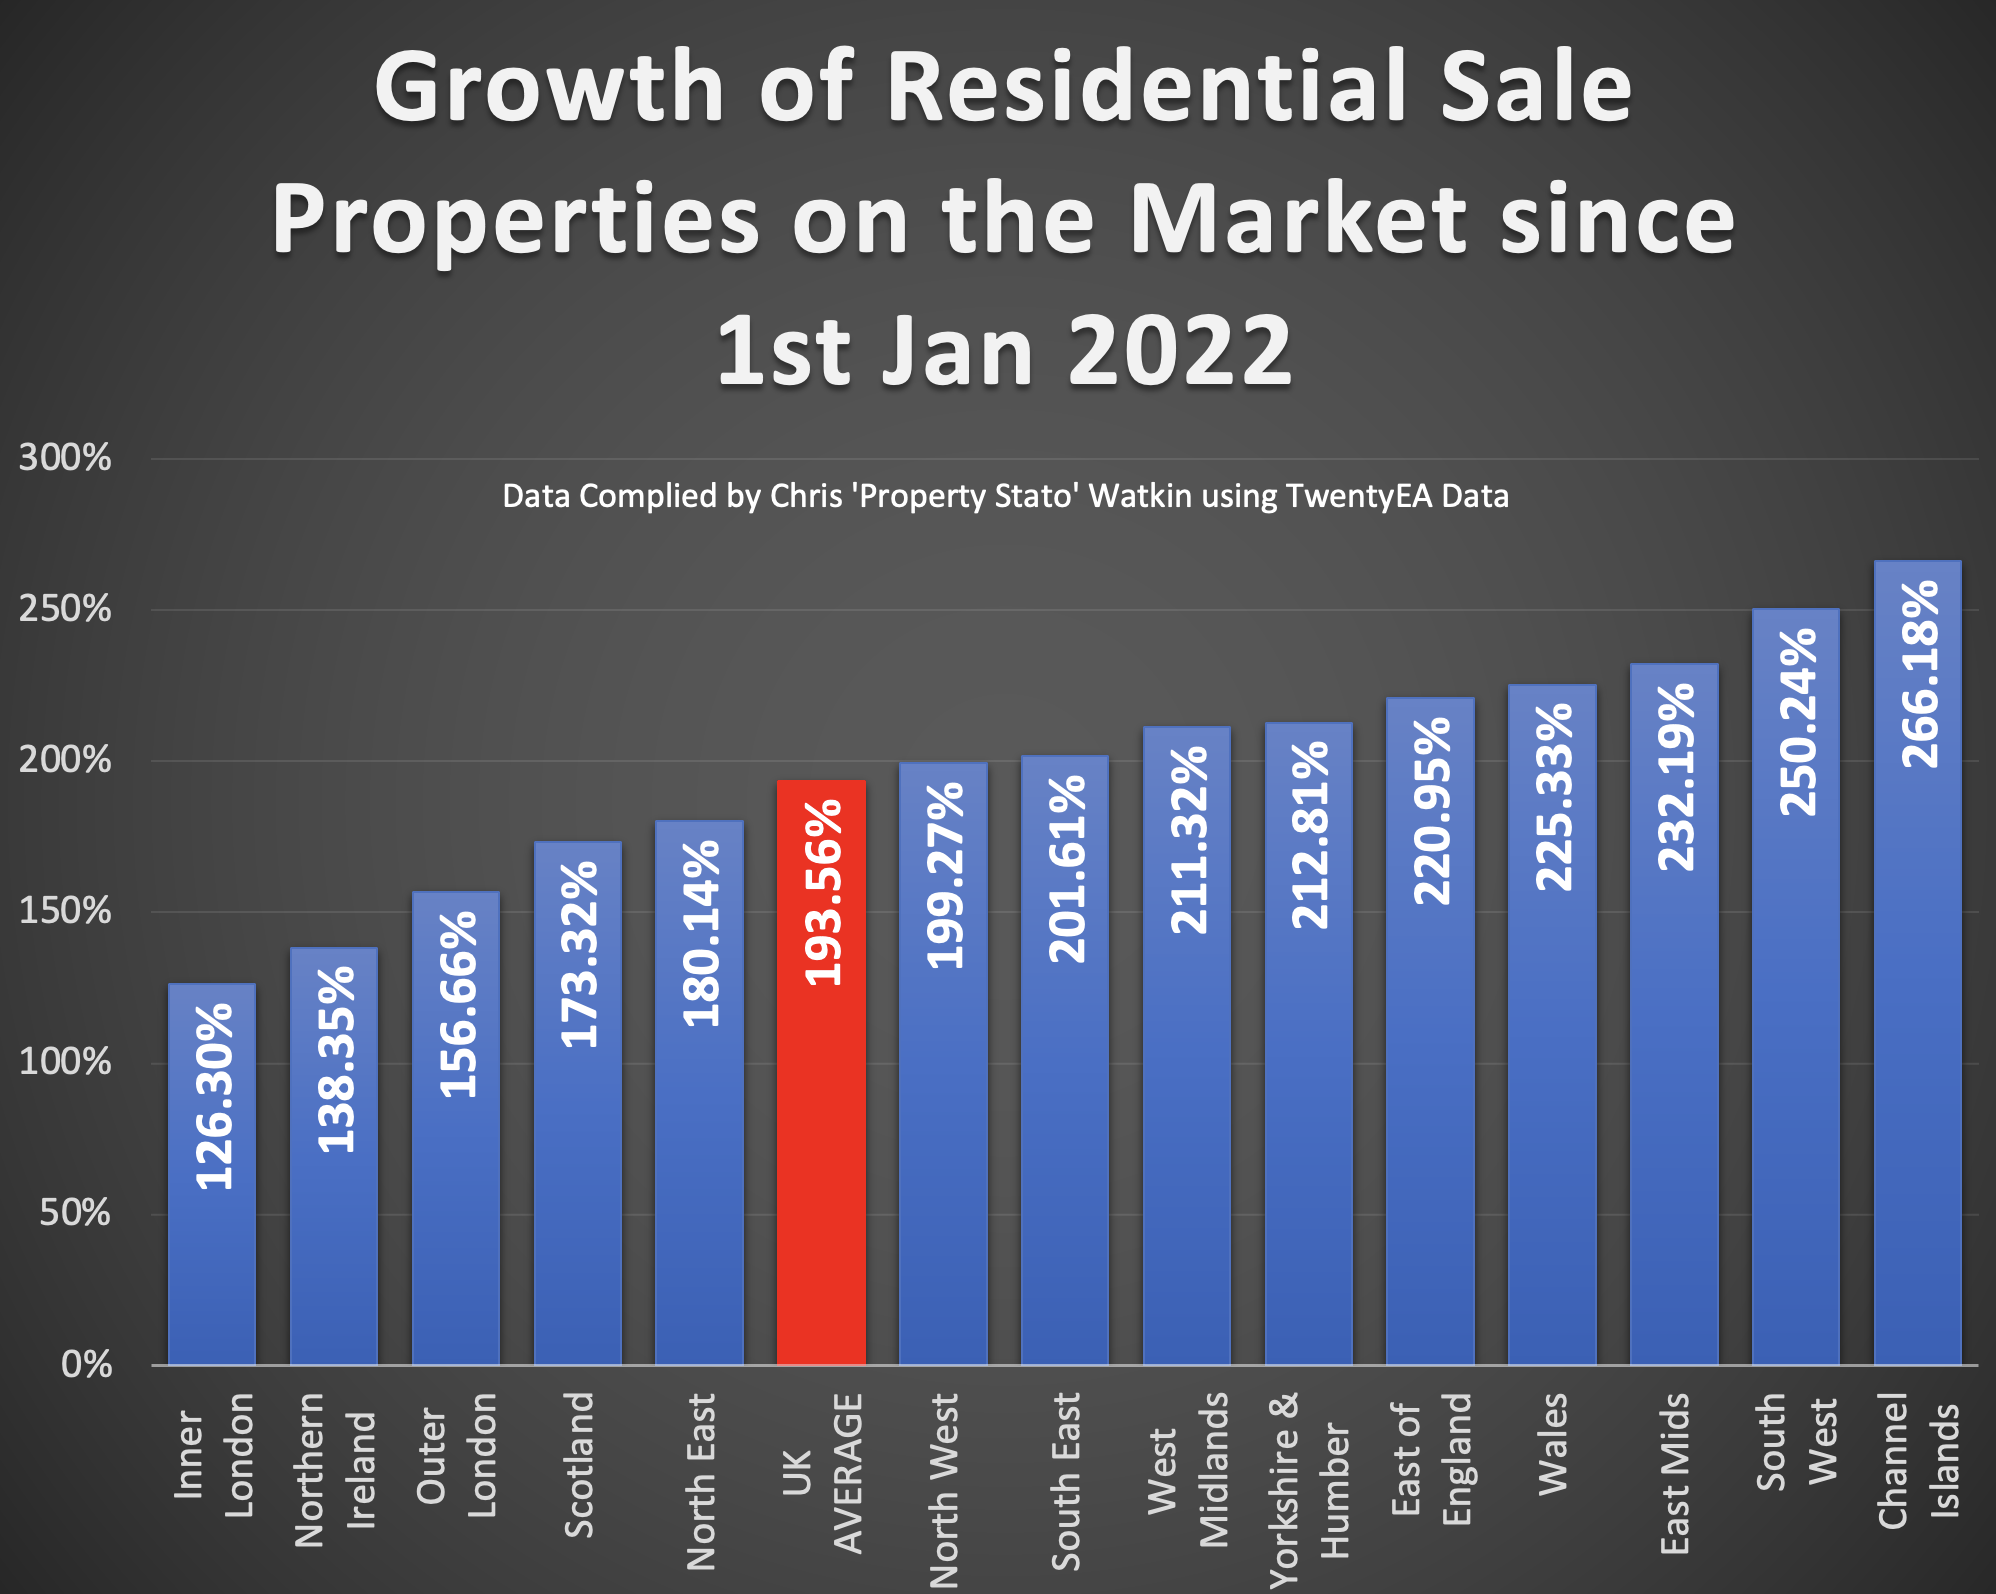
Growth of Available Resi Sales Stock in the UK by Region since 1st Jan 2022: The graph displays the growth of residential sale properties on the market since 1st January 2022 across various UK regions. Inner London observed the smallest growth of 120.63%, while the West Midlands reached 212.32%. The average growth across all regions, represented by a distinctive red bar, stands at 195.56%. The highest growth was seen in the East Midlands, South West and Channel Islands.
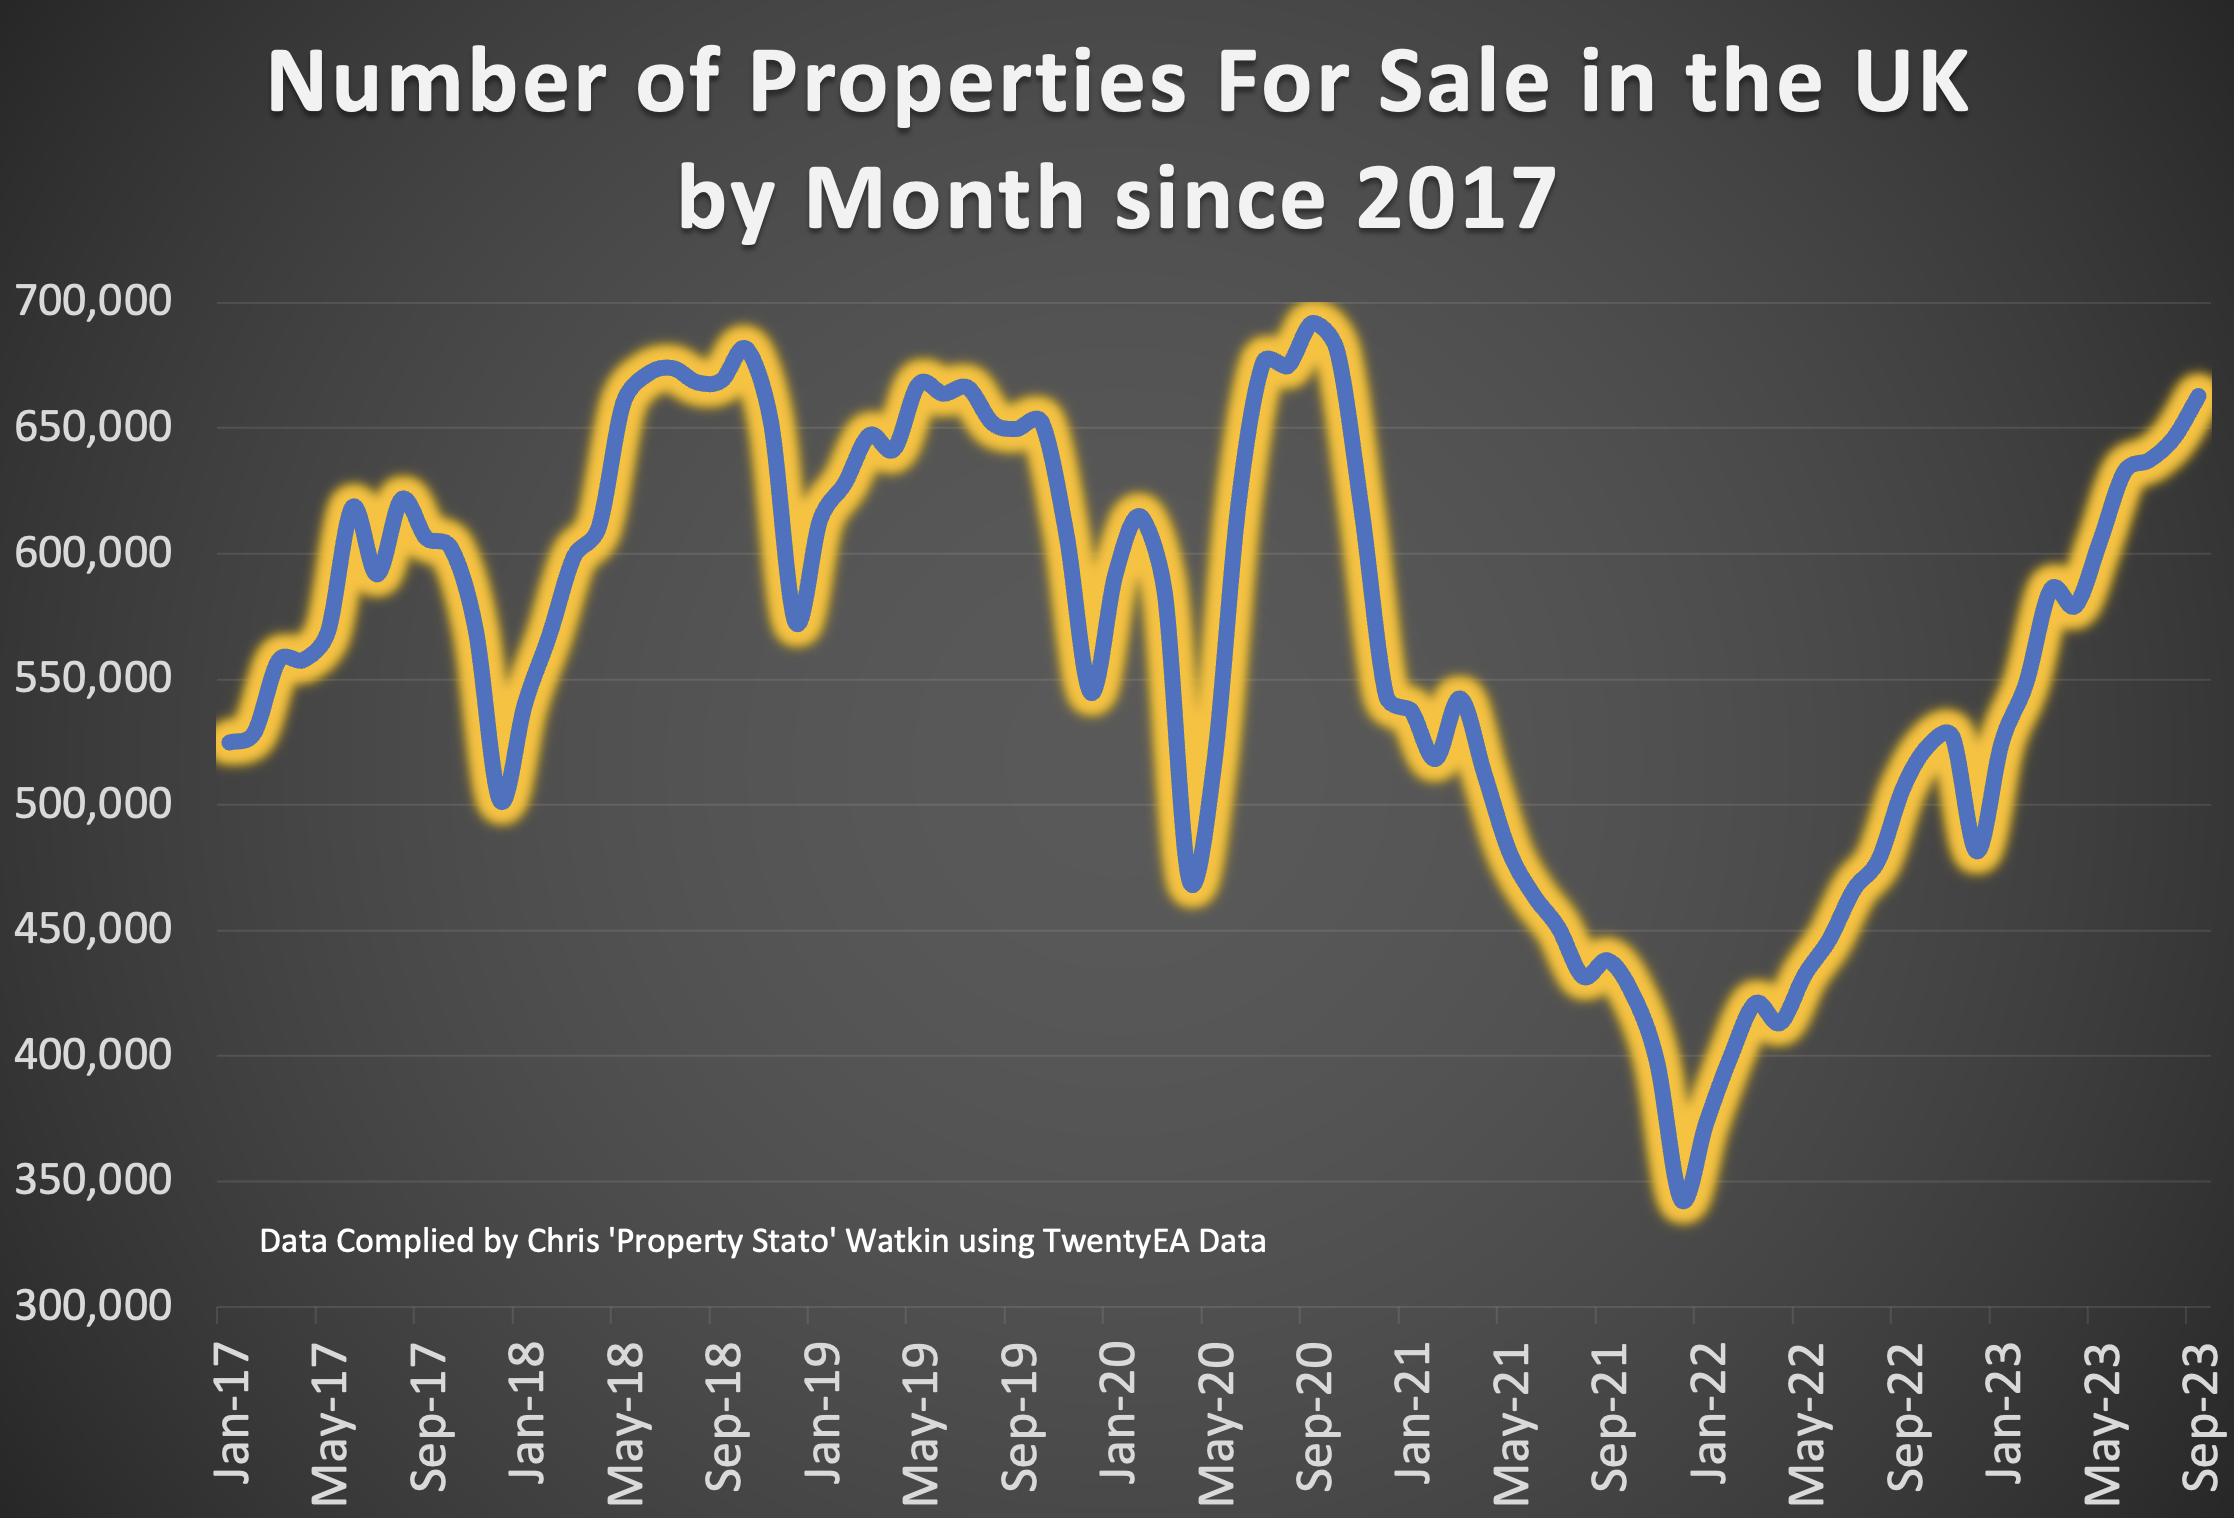
Total number of residential properties for sale since January 2017, on a month by month basis: The graph portrays the fluctuating number of properties for sale in the UK by month, spanning from January 2017 to September 2023. Beginning around 550,000 listings in early 2017, the number peaks near 700,000 before dipping considerably around early 2020. The lowest point is seen in early 2021, with less than 400,000 properties. Since then, there’s a steady upward trend, nearing the initial numbers by September 2023.
In the last 20 minutes of the show, there is the usual local focus, and this week it is on Chelsea.


Comments (11)
Just for interest sake do you have the % figure in sales £ turnover? I suspect it will be very much higher
Un fortunately I do not have that data because I don’t know what each Estate Agent charges
Thanks as ever Chris…
I’ve often wondered if there is actually any correlation between fees charged and market share. Obviously I’m not sure as I, like you, do not have the actual evidence of the fees charged by all estate agents across the country. That said, and antidotally, I would suggest that there is either no correlation at all or, in actual fact, that correlation is inversed and the agents charging the higher than average fees have a greater market share than the agents charging lower fees or nothing at all.
Thoughts?
Simon – you certainly make an interesting question on whether there is actually a correlation between fees charged and market share. Like you say no one has any actual evidence and I would agree with you, there is no correlation between market share and fees achieved. One could say that market share is a vanity metric anything is prophet that the HMRC measures! Again, thank you for your very kind comment and insightful thoughts
Bonus Stats for those of you reading the comments …
The largest 25 estate agency groups combined (Connells Group, The Property Franchise Group, LSL, PurpleBricks, Spicerhaart, Leaders Romans, Belvoir Group, Strike, Yopa, Arun Estates, Savills , EXP UK, Northern Estate Agencies Group, Winkworth , The Lomond Group, KFH, Foxtons, Pattinson, Knight Frank, Chancellors Group, Andrews Property Group, Keller Williams, Chesterton Global, BNP Paribas Group and Stirling Ackroyd) in 2021 had 30.63% of all property sales in the UK.
In 2022, that reduced to 29.47% of all UK residential sales
and Year to date 2023, that is 27.81% …
What are agent’s thoughts on this?
Why are the larger firm’s market share for Resi sales slipping?
How do you calculate the numbers ref MS of large agents ?
Cant wait to see Strikes bottom line numbers
Just % of sales (units) compare to the total sales unit
Could this be to do with Purplebricks losing a large chunk?
The online agents appear to be going backwards and a proportion of that business will be going to the independents.
I’m guessing!
you make a very valid point with regard to Purplebricks, and losing market share.
However, that drop has not beentaken by these larger agents. In fact, the vast majority of these agents in the top 25% have lost market share on top of the drop from PB
in fact, the vast majority of these agents in the top 25% have lost market share on top of the drop from Purplebricks.
Thank you again for asking the question GreenBay
Very interesting Chris.
Just thoughts, but it would be interesting to see if this falling sales issue for larger businesses is consistent with previous, tougher markets, when house prices fell.
Consistently, large companies focus on listings market share and often over-value, to win business, on long contracts – 6 months for example.
In a rising market, sales do follow.
We are in a falling market and over-pricing to win the listing is still rife. But that does not now result in sales.
2nd agent sells. Often more local indys.
Also, local indy’s are not under the same corporate pressures to simply list.
More often, local indys price to list a sale, not just list a property for market share.
John – you make some valid points. Only time will tell if your thoughts are true. I will keep an eye on the stats and report back accordingly to the industry as time goes. Thank you again for making your comment my friend.