


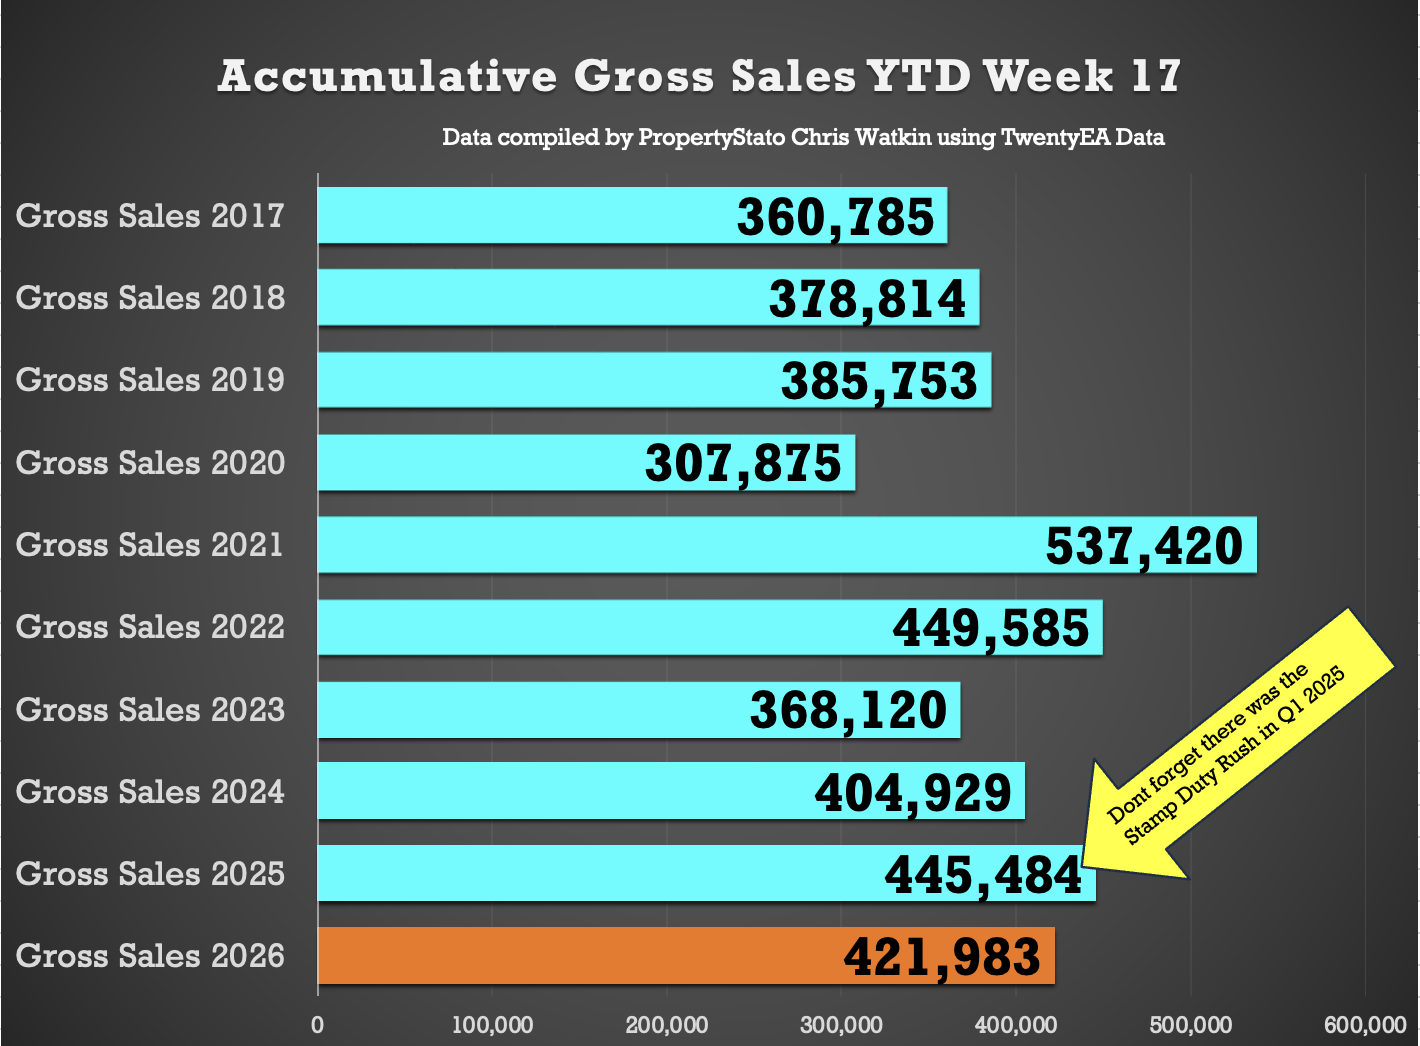
🟩 Gross Residential Sales YTD
422k UK homes sold STC YTD
The best week for Resi sales in 45 weeks
5.3% lower than 2025 YTD (445k) , 4.2% higher than 2024 YTD (405k), 14.6% higher than 2023 YTD (368k) and 12.5% higher above pre Covid norms (375k).
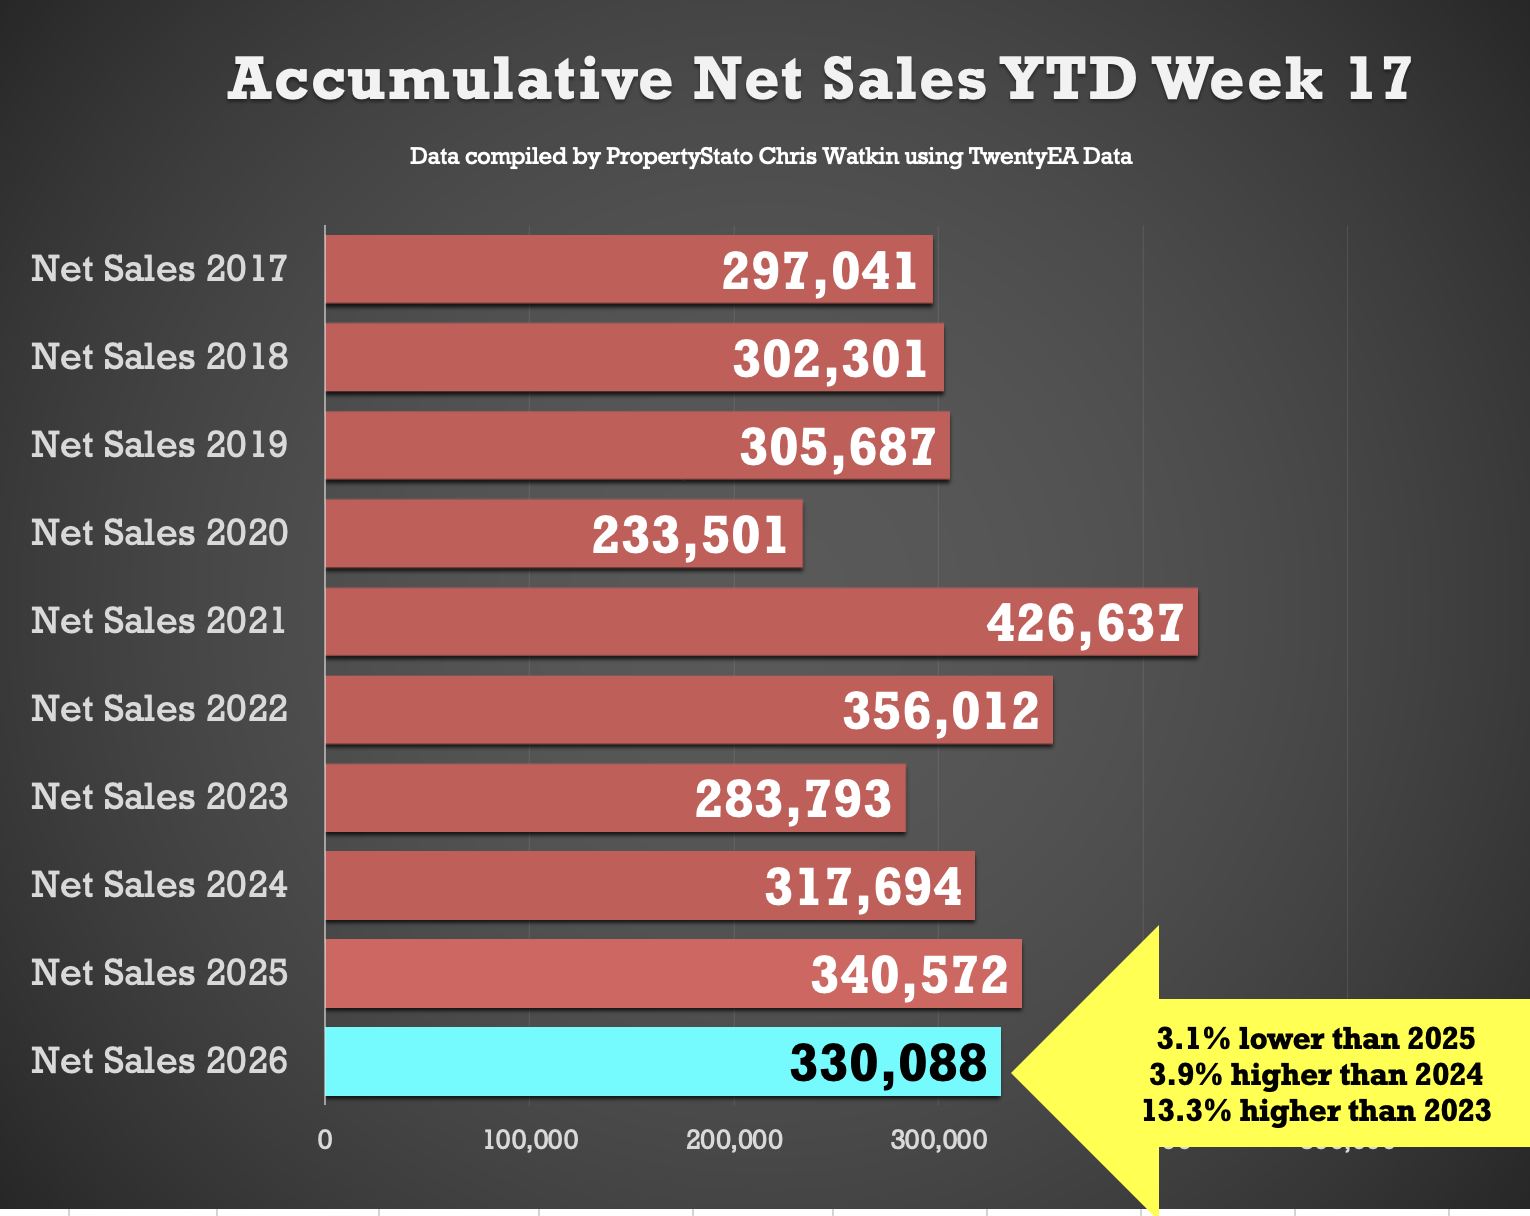
🟩 Net Resi Sales YTD
330k UK net home sales YTD (Net Sales being Gross sales less Fall Thrus).
3.1% lower than 2025 (341k), 3.9% ahead of 2024 (318k), 16.3% ahead of 2023 (284k) and 9.4% above the 2017–19 average (302k).
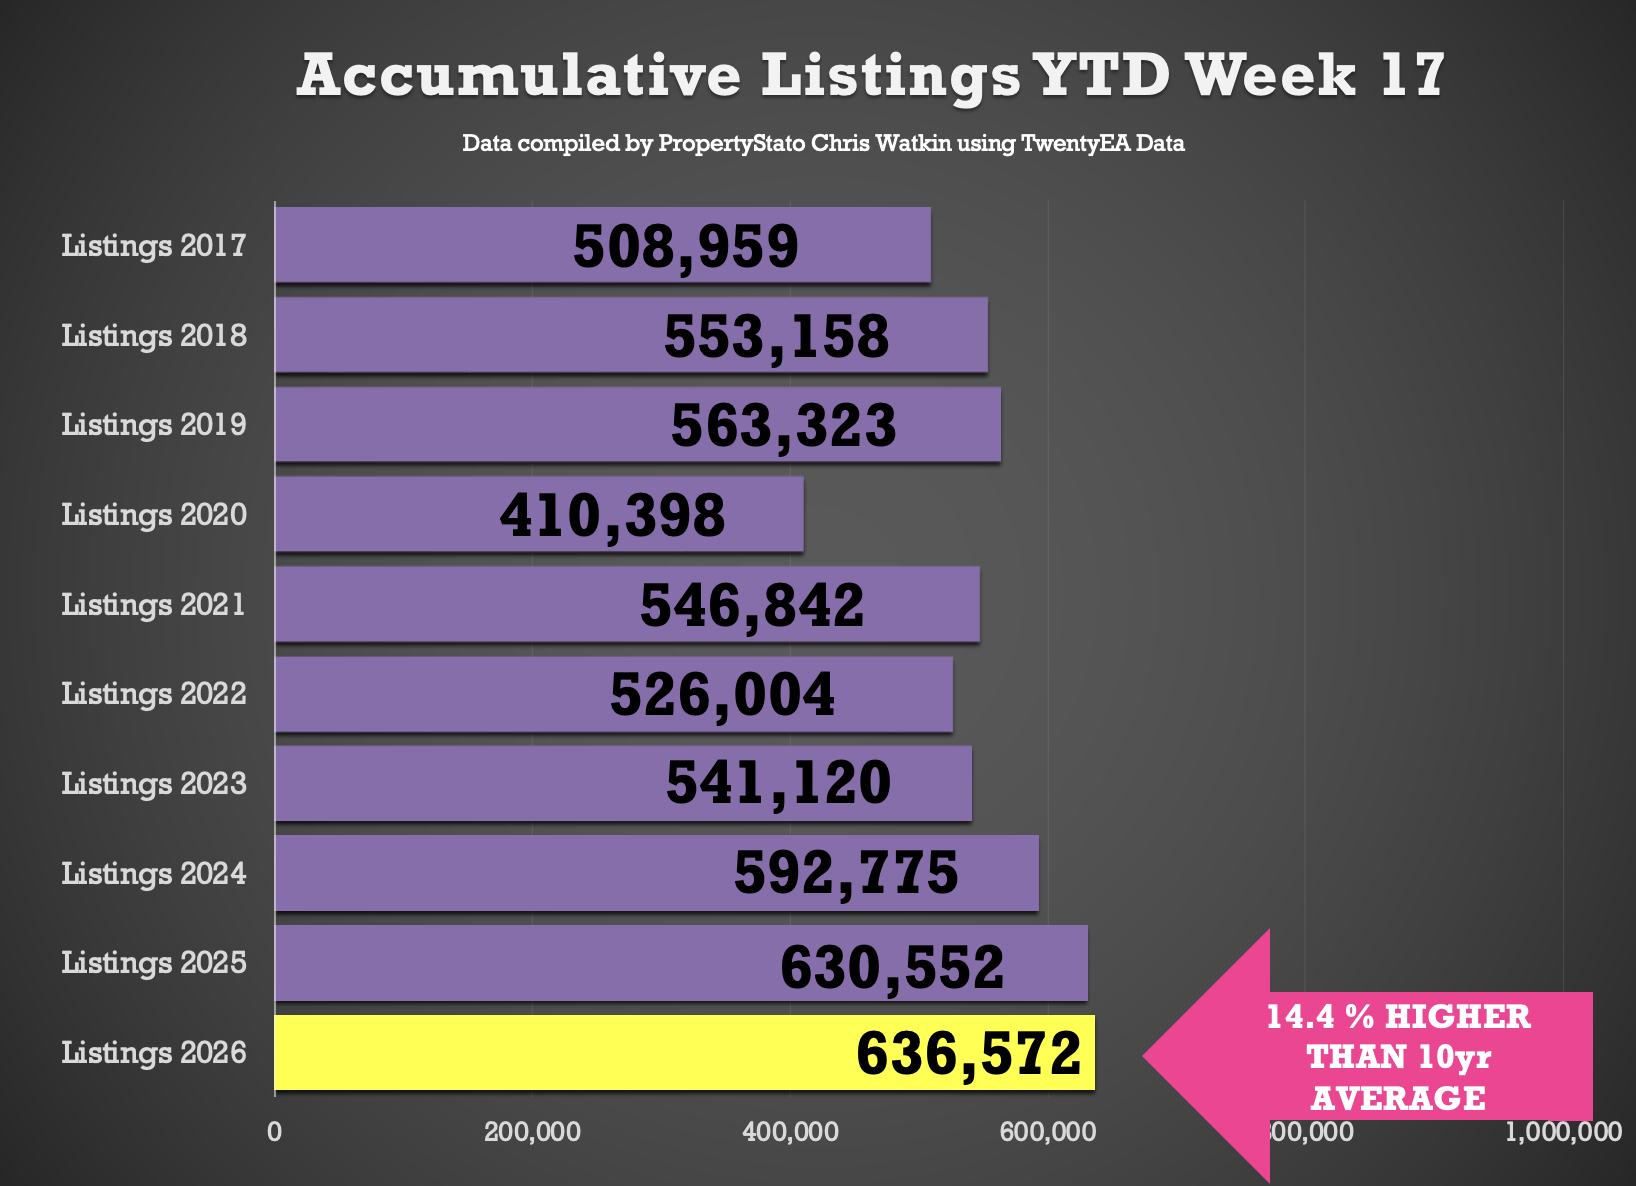
🟩 Listings YTD
637k new properties have come onto the market YTD
1% above of 2025 YTD, 7.4% above 2024 YTD, and 17.5% higher than the 2017–19 average YTD
🟩 Exchanges YTD
240k UK Exchanges to the 2nd week of April 2026
14% lower the 2nd week of April 2026, when it was 279k.
Note – There were more exchanges in Q1 2025 because of the stamp duty holiday which finished in April 2025
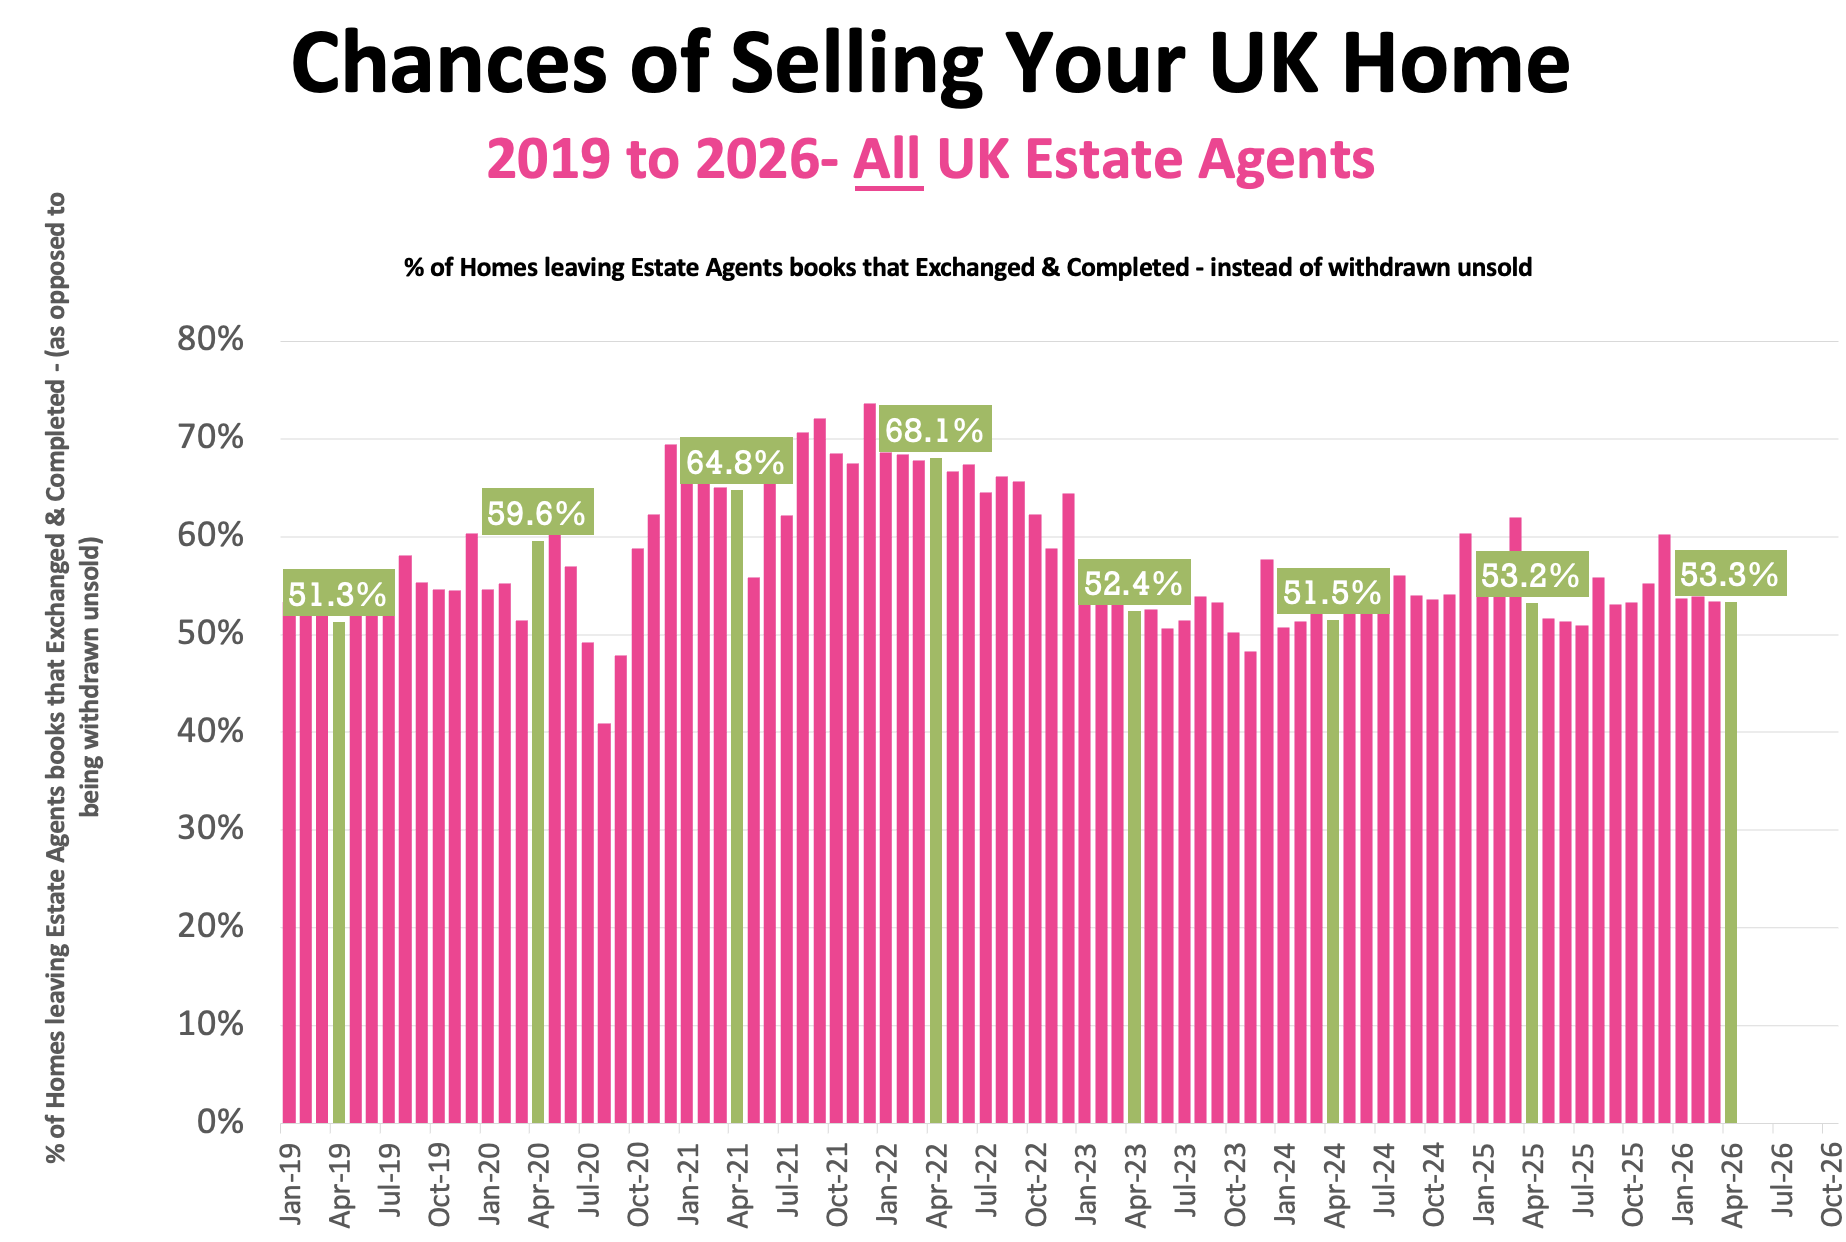
🟩 Overvaluing
46.7% of the homes that left UK Estate Agents books in April were withdrawn unsold.
Main cause – blatant overvaluing supported by long sole agency agreements of 20+ weeks.
Detailed Breakdown …
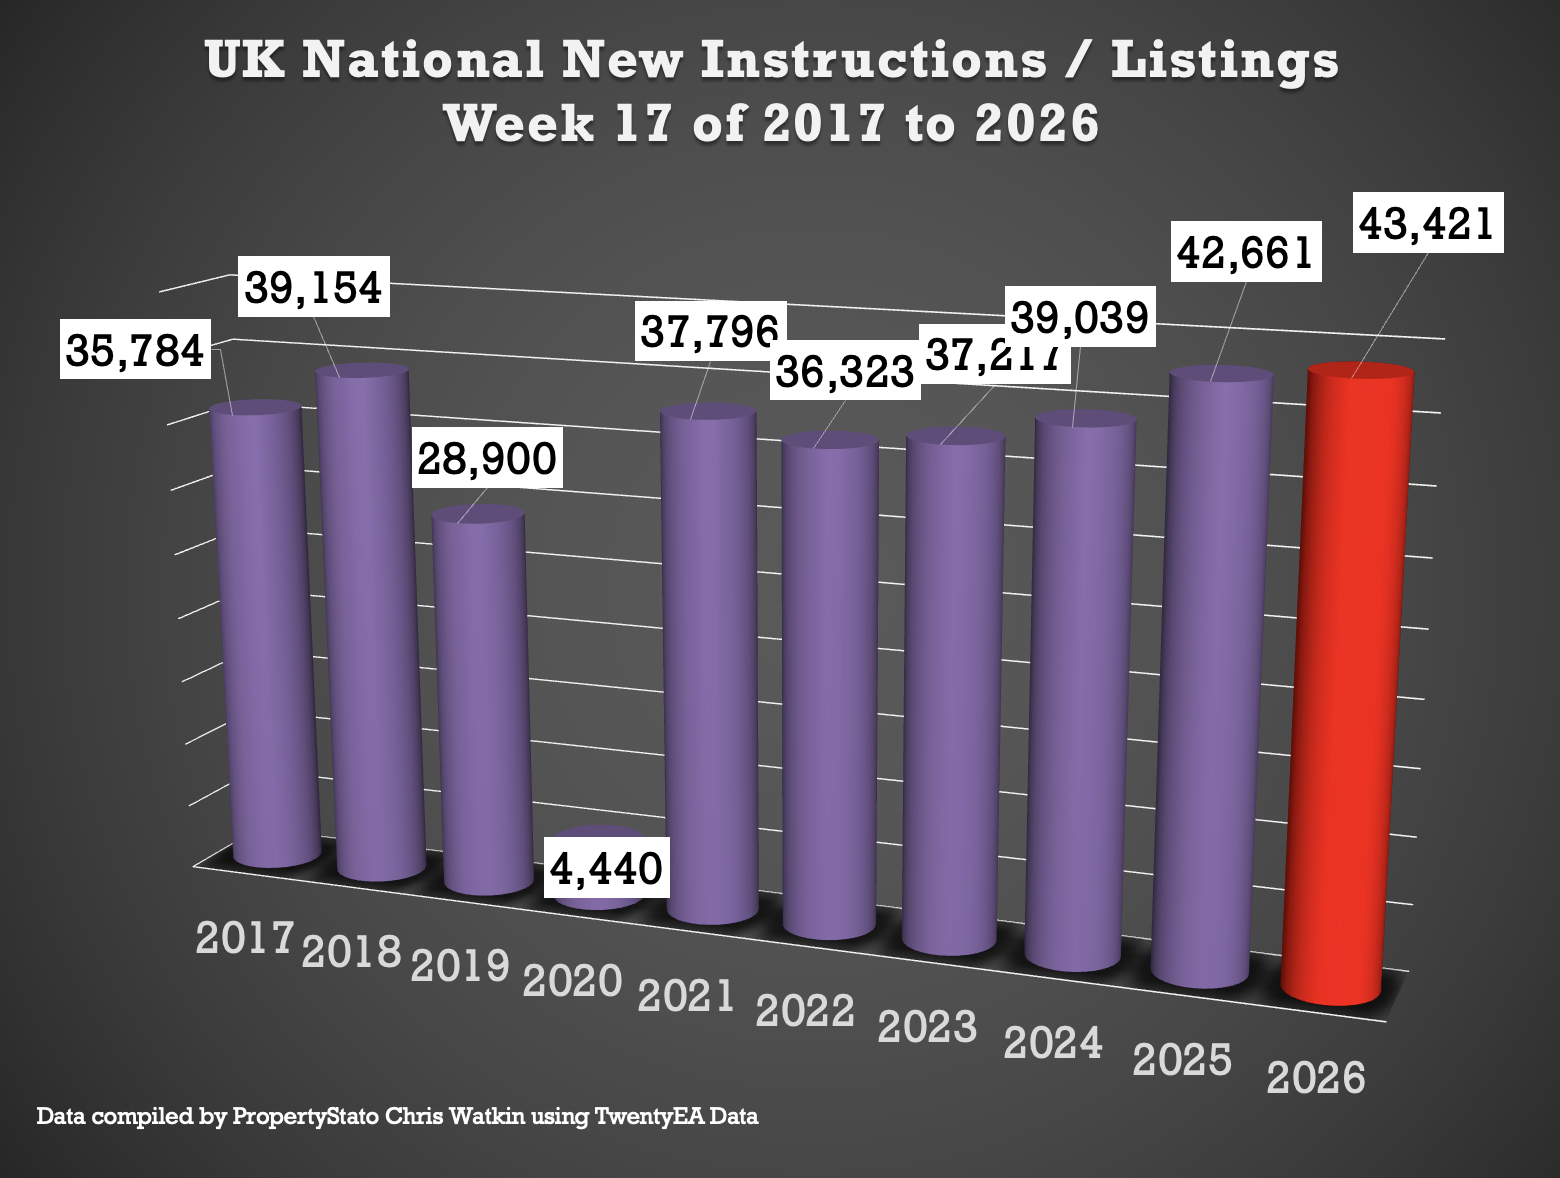
✅ New Listings
• 43.4k new properties came onto market this week (week 17), up from 40.2k last week.
• 2025 weekly average: 30.6k.
• 10-year week 17 average : 34.5k (dont forget some previous week 17’s were Easter’s, thus dragging the average down).
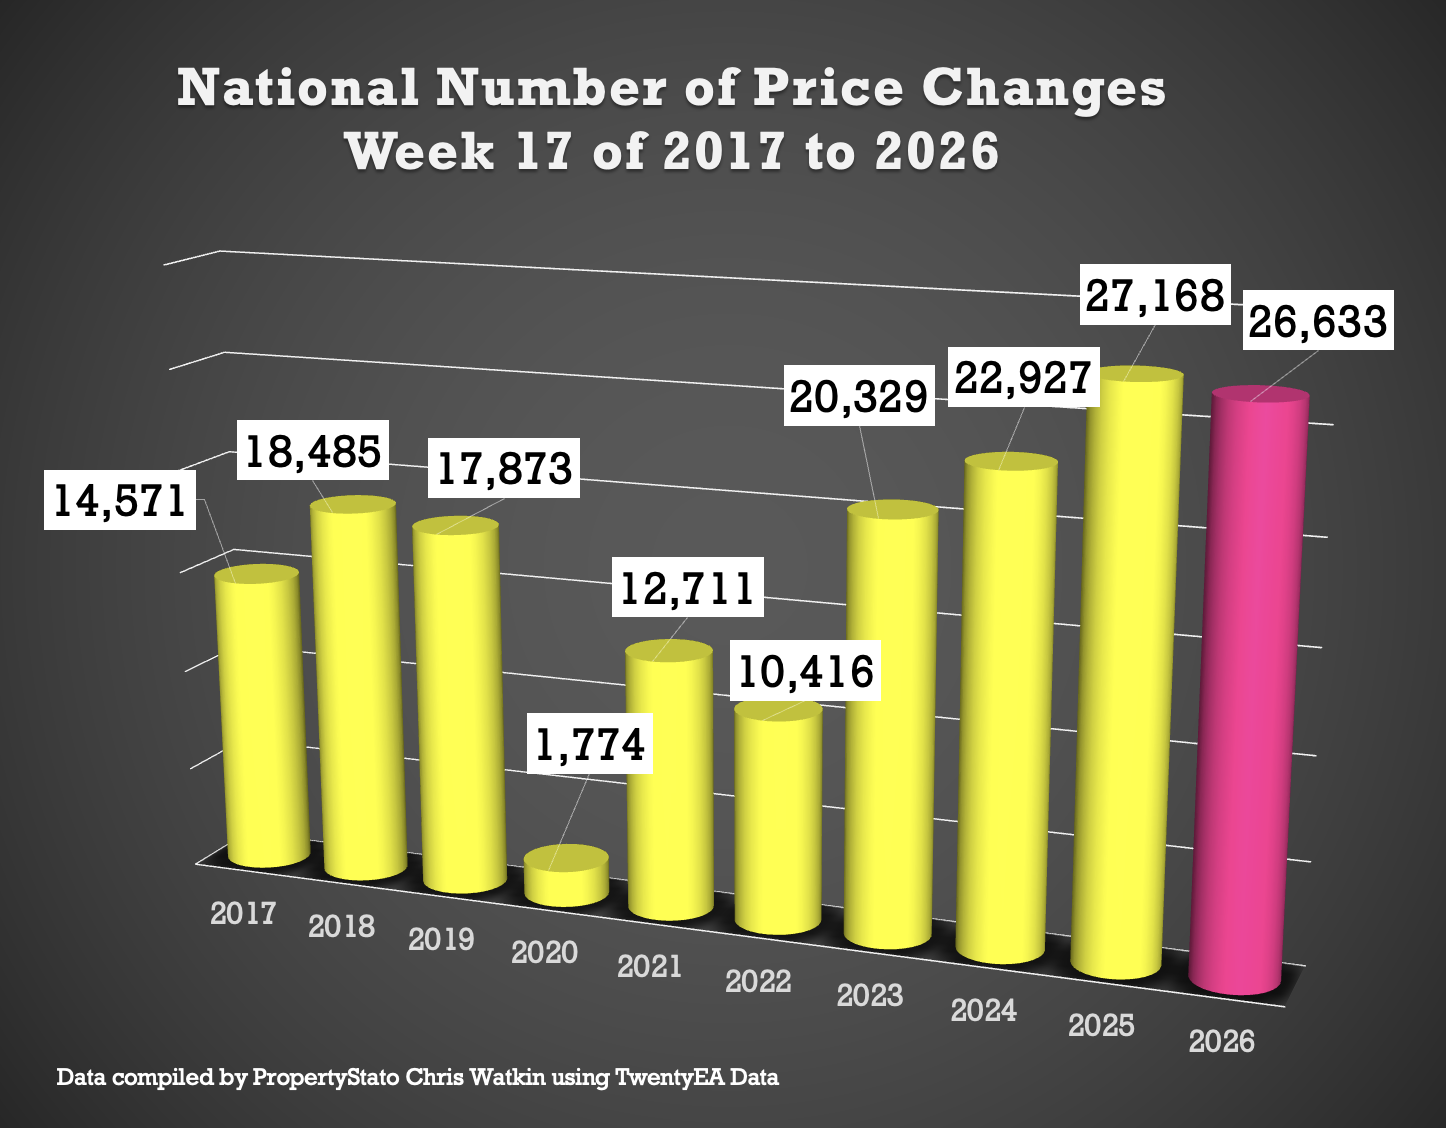
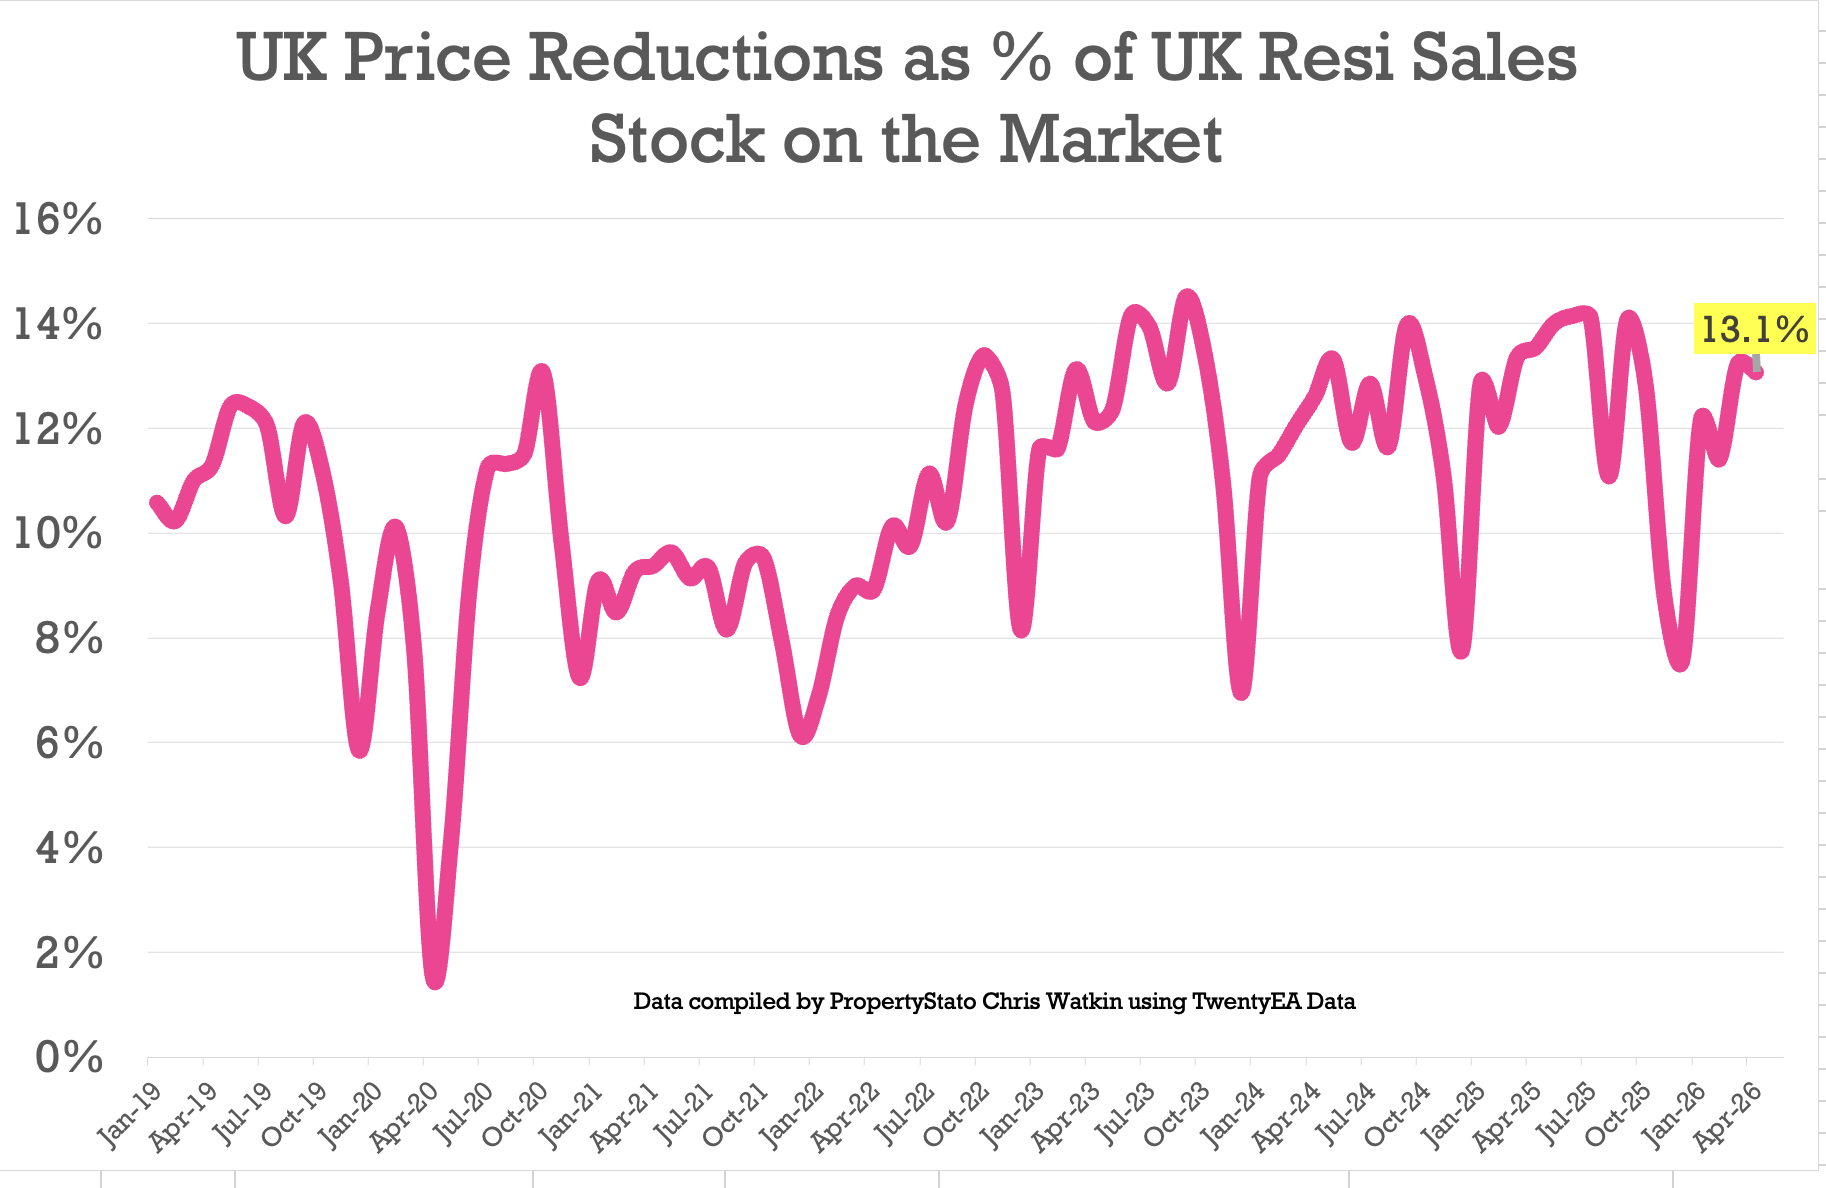
✅ Price Reductions
• 26.3k reductions this week, up from 25.6k last week.
• 13.1% of UK resi homes for sale were reduced in April. Mar 26 was 13.2%.
• 2025 average was 12.8%, versus the 6-year long-term average of 10.7%.
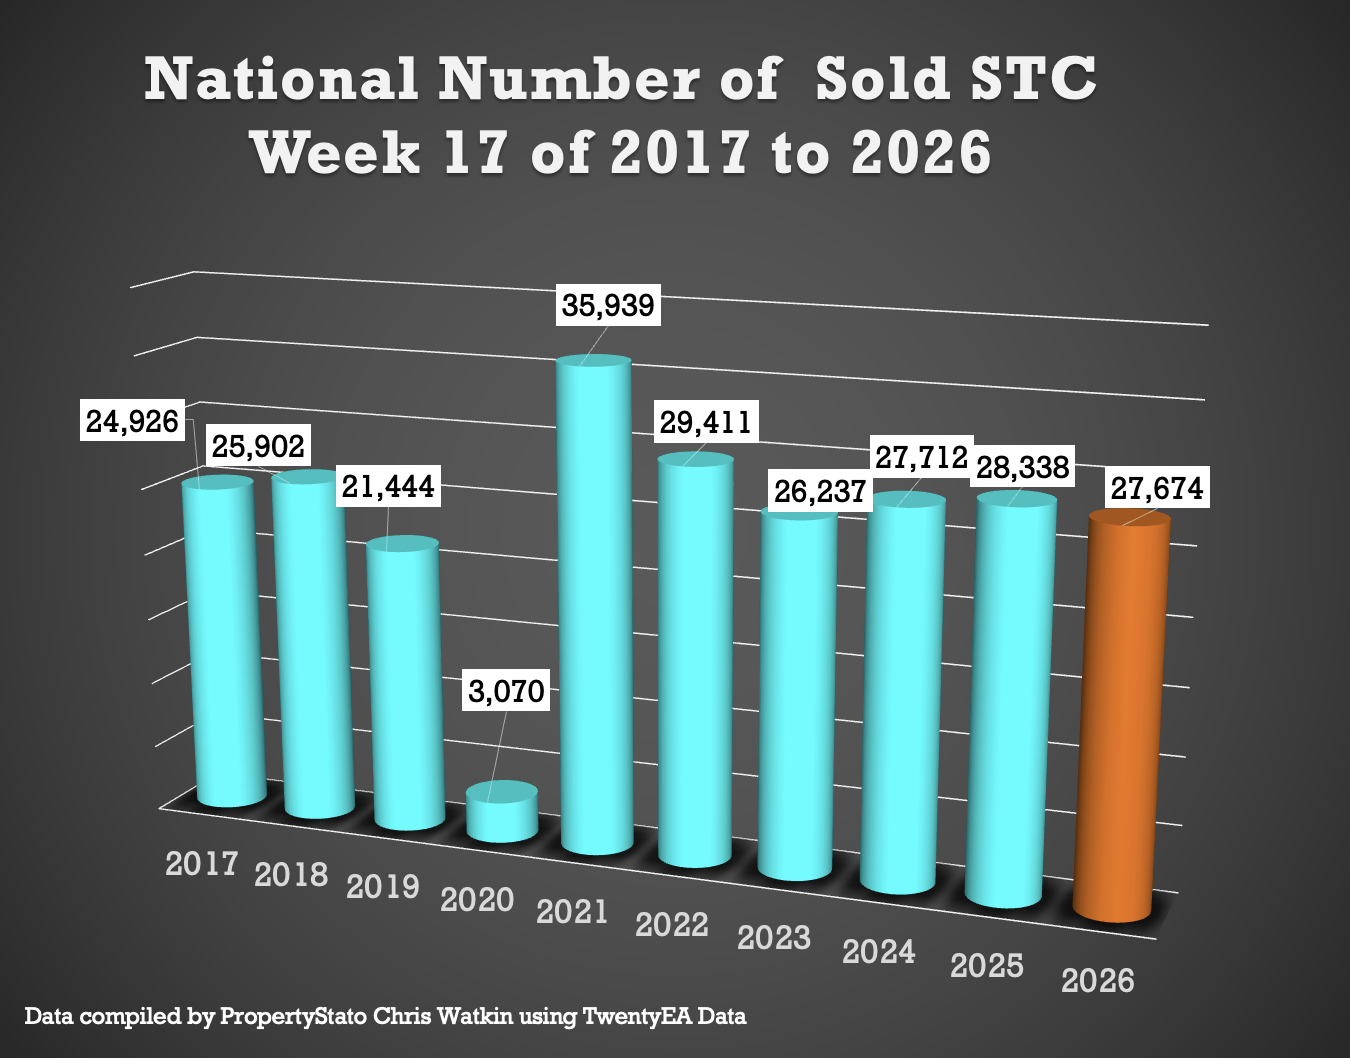
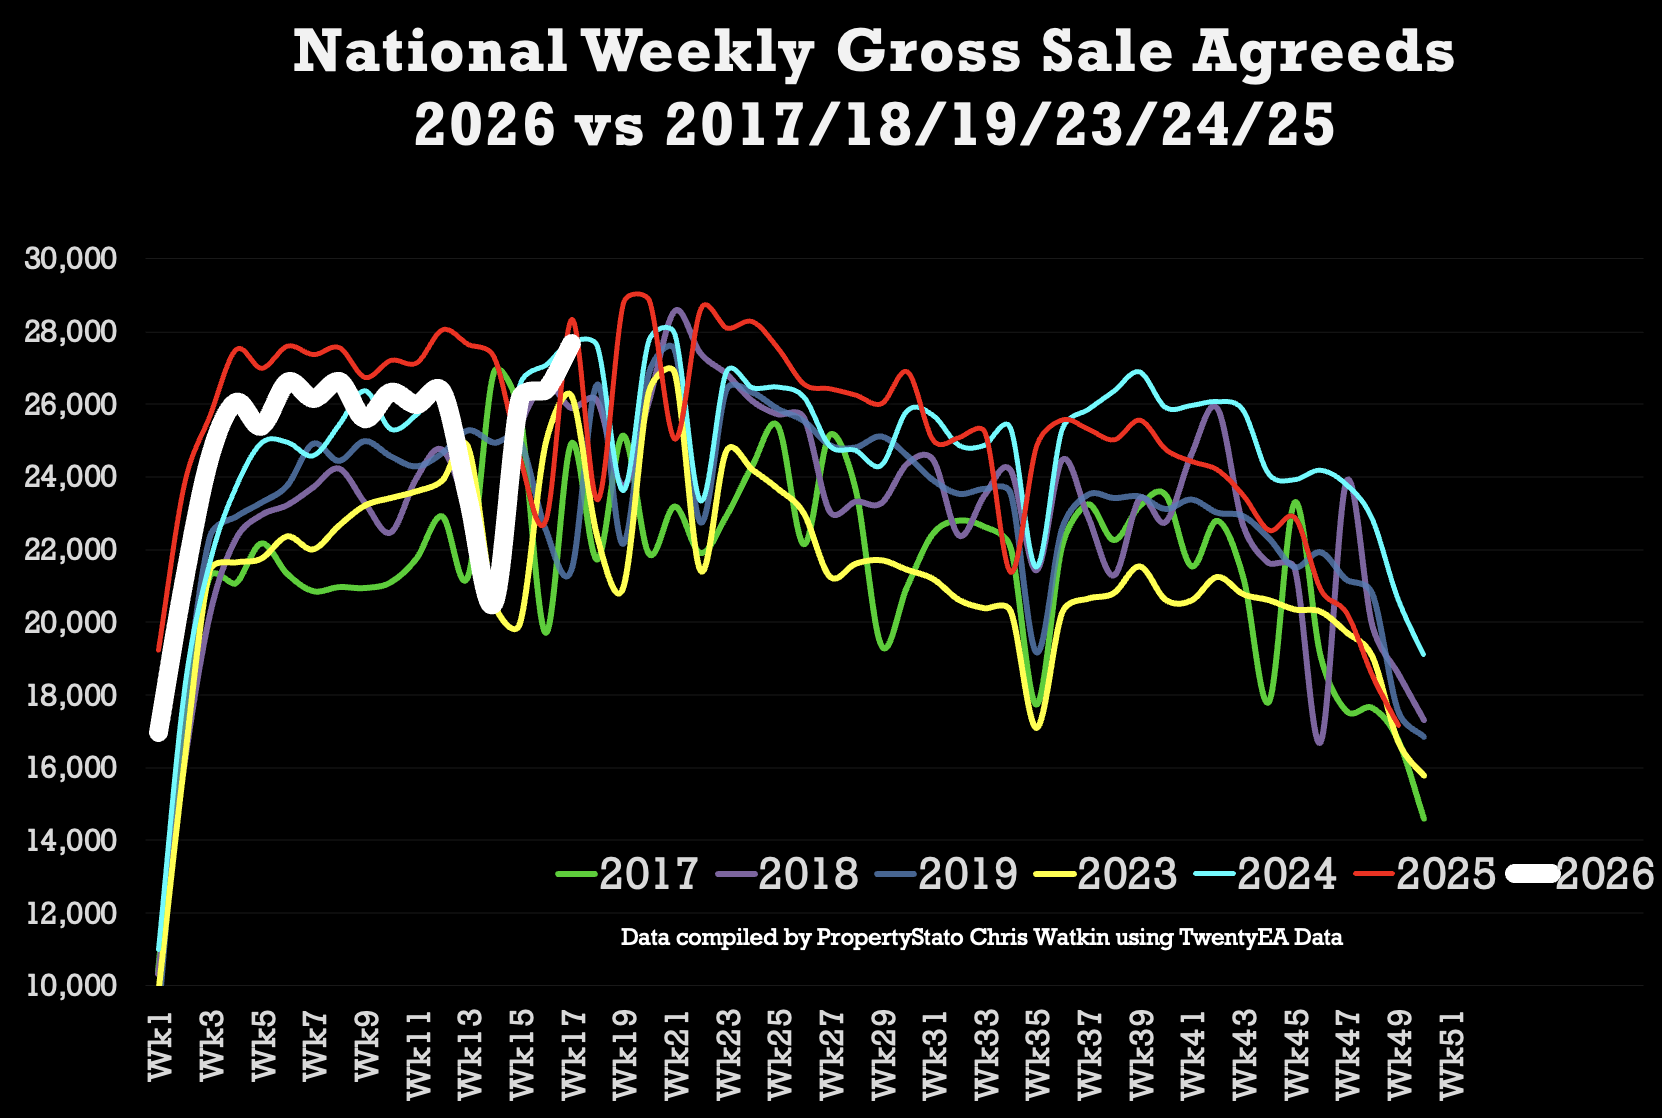
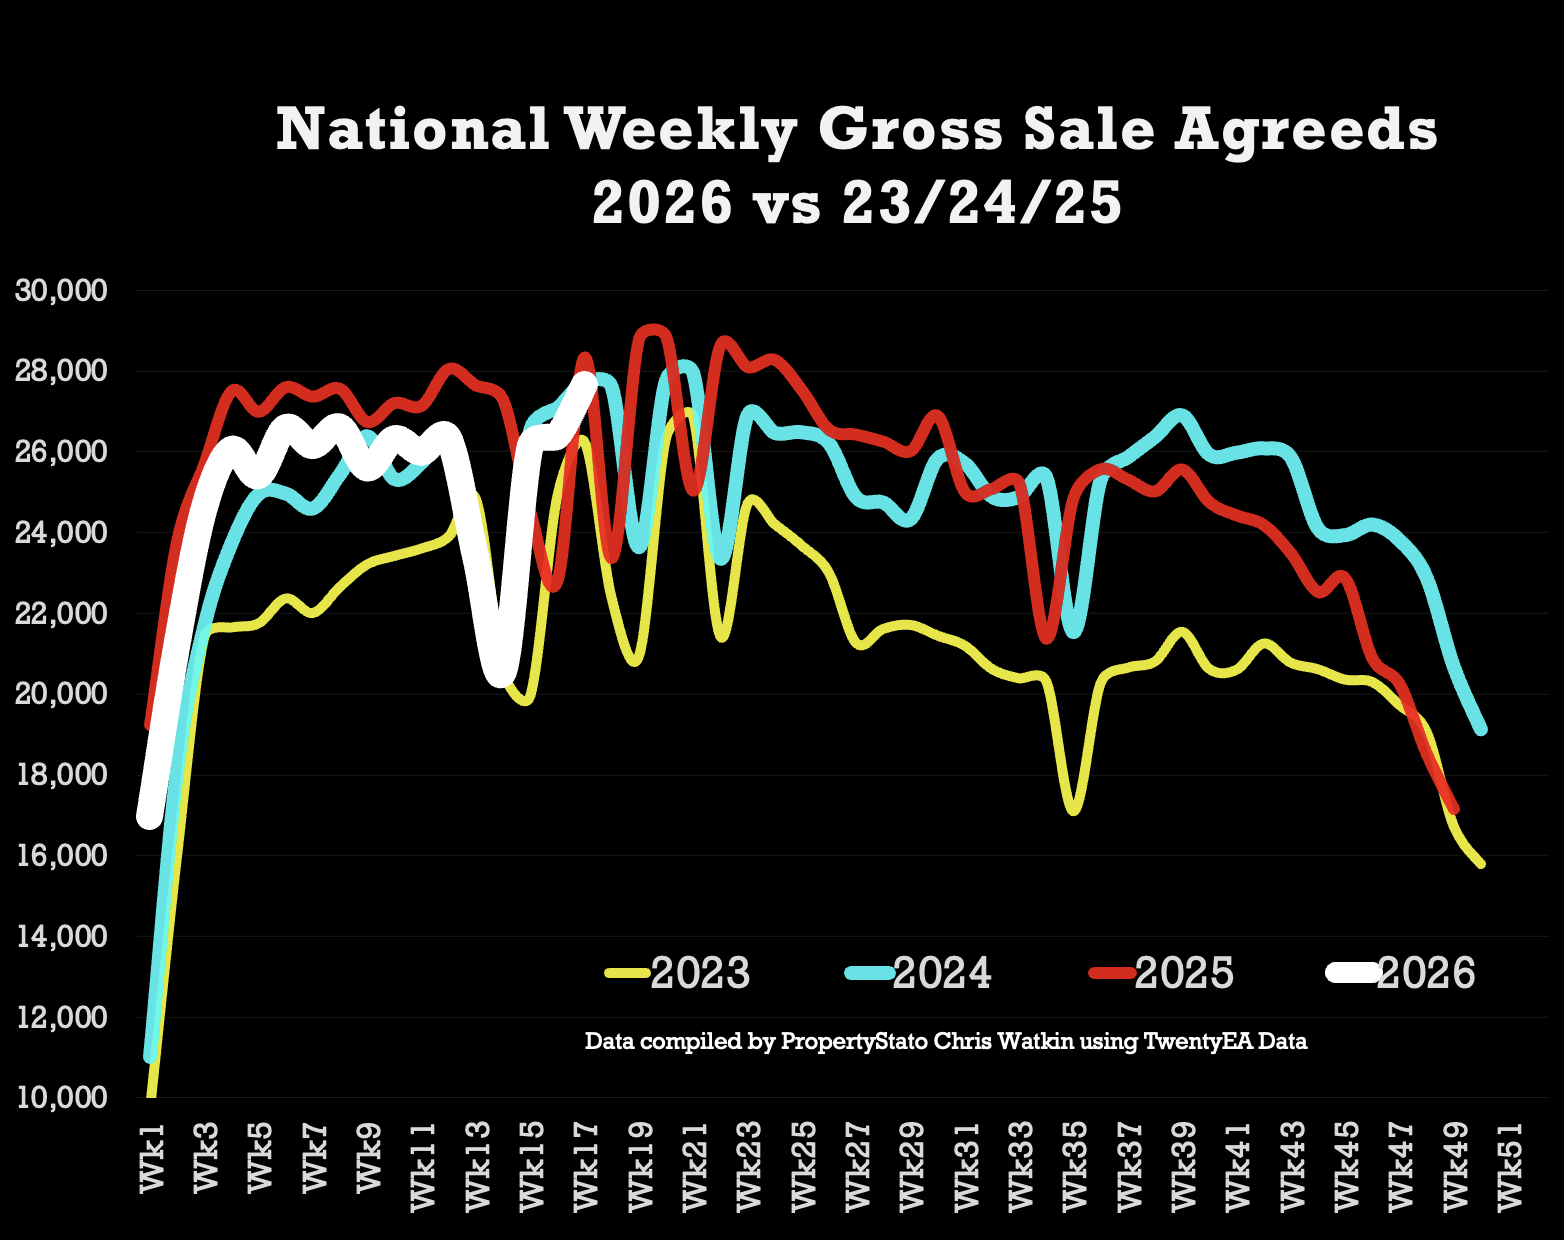
✅ Sales Agreed
• 27.7k homes sold stc this week 17, up from 26.4k last week.
• Week 17 average (for last 10 years which includes the post pandemic boom) : 25.1k
• 2026 weekly average : 24.8k.
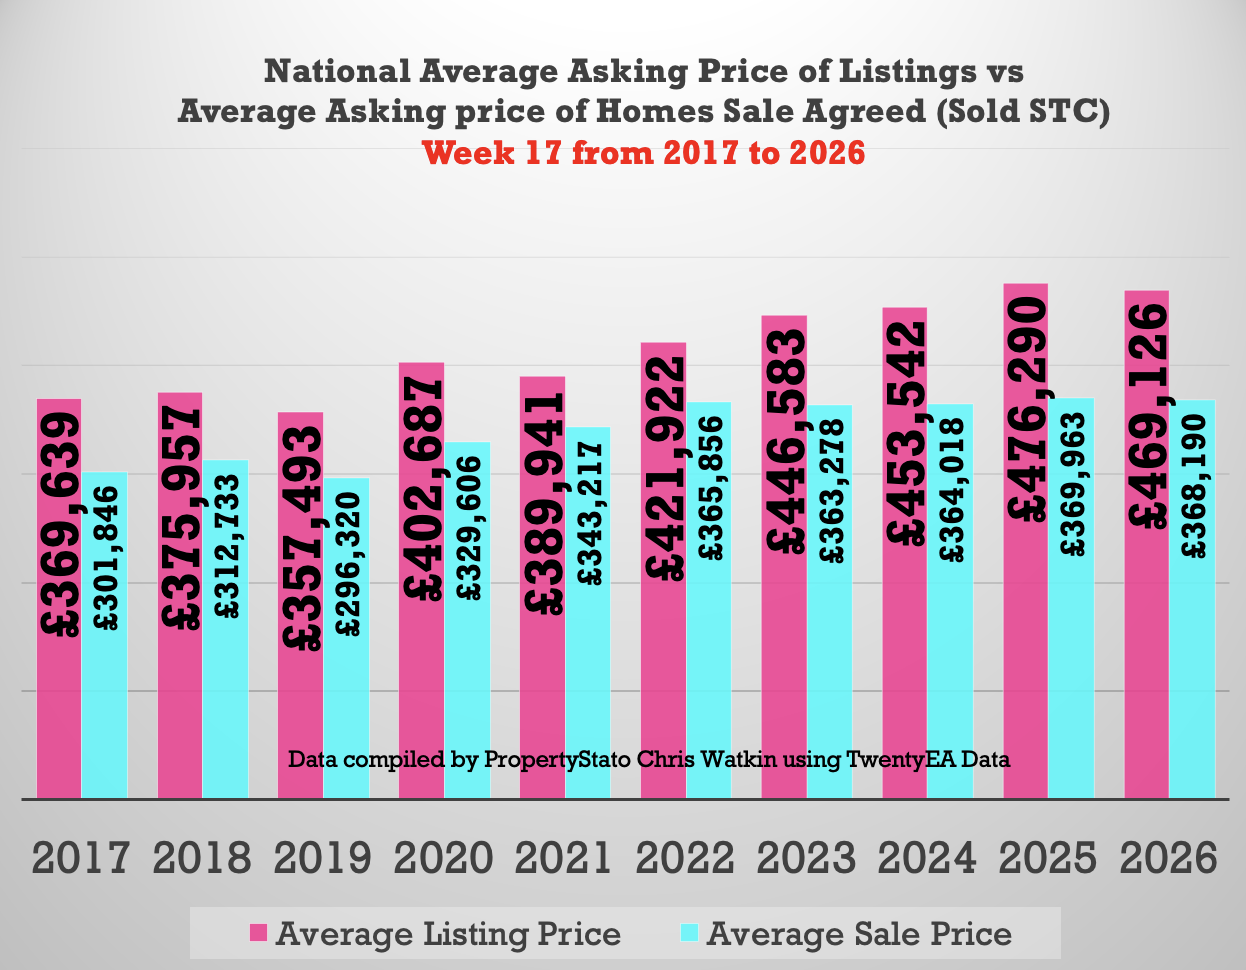
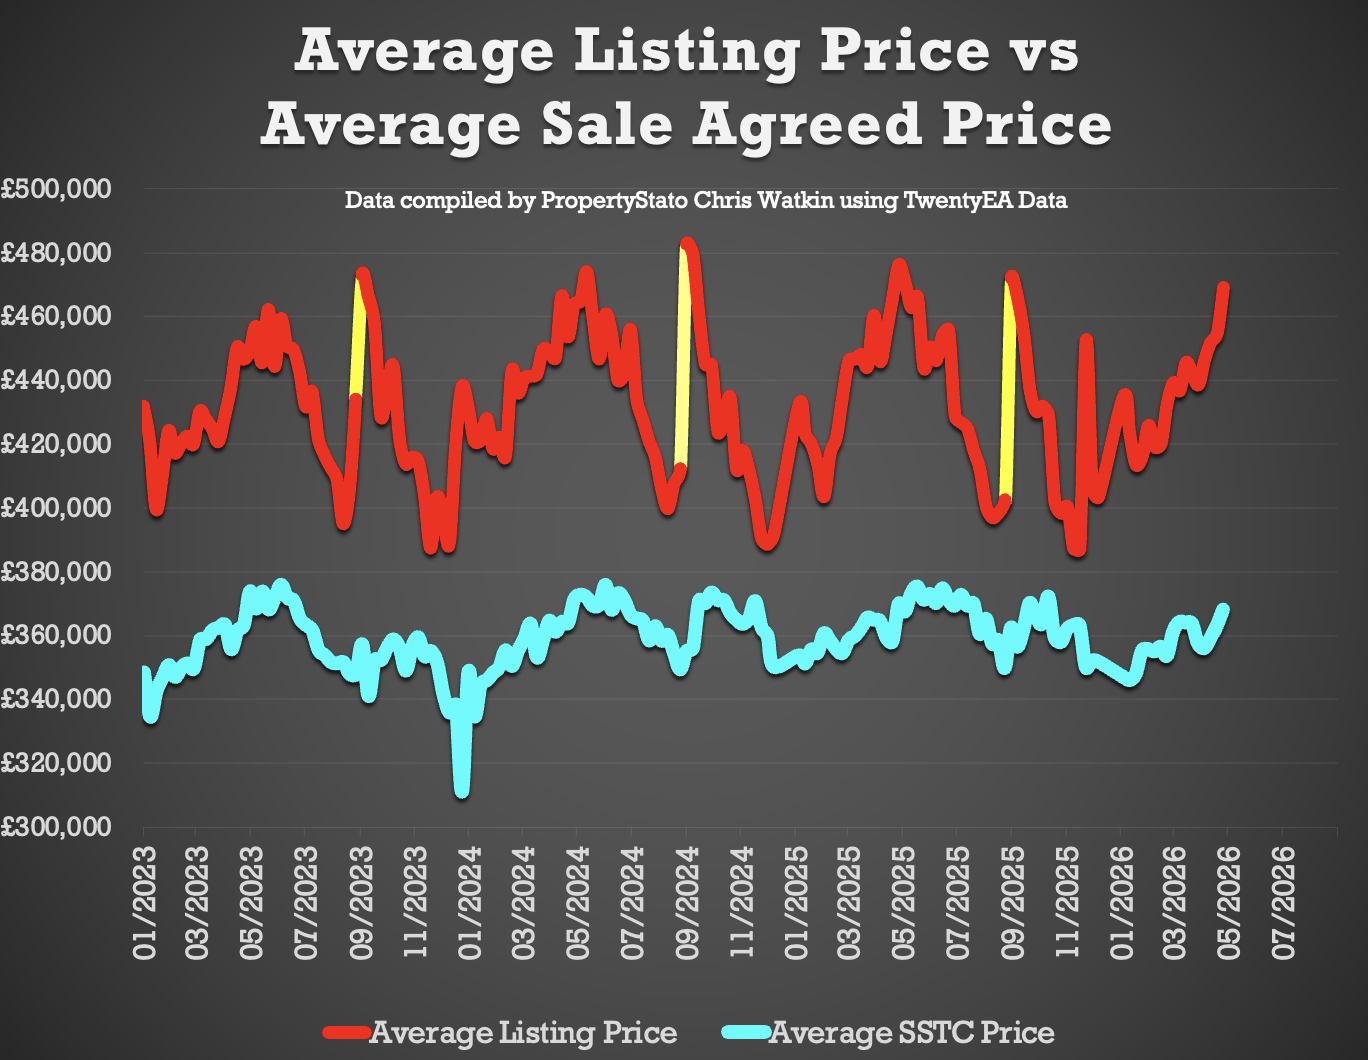
✅ Price Difference between Listings & Sales
• 27.4% difference (long term 10 year average is 16% to 17%). (£455k ave Listing Ave Asking price vs £363k Sale Agreed ave Asking price).
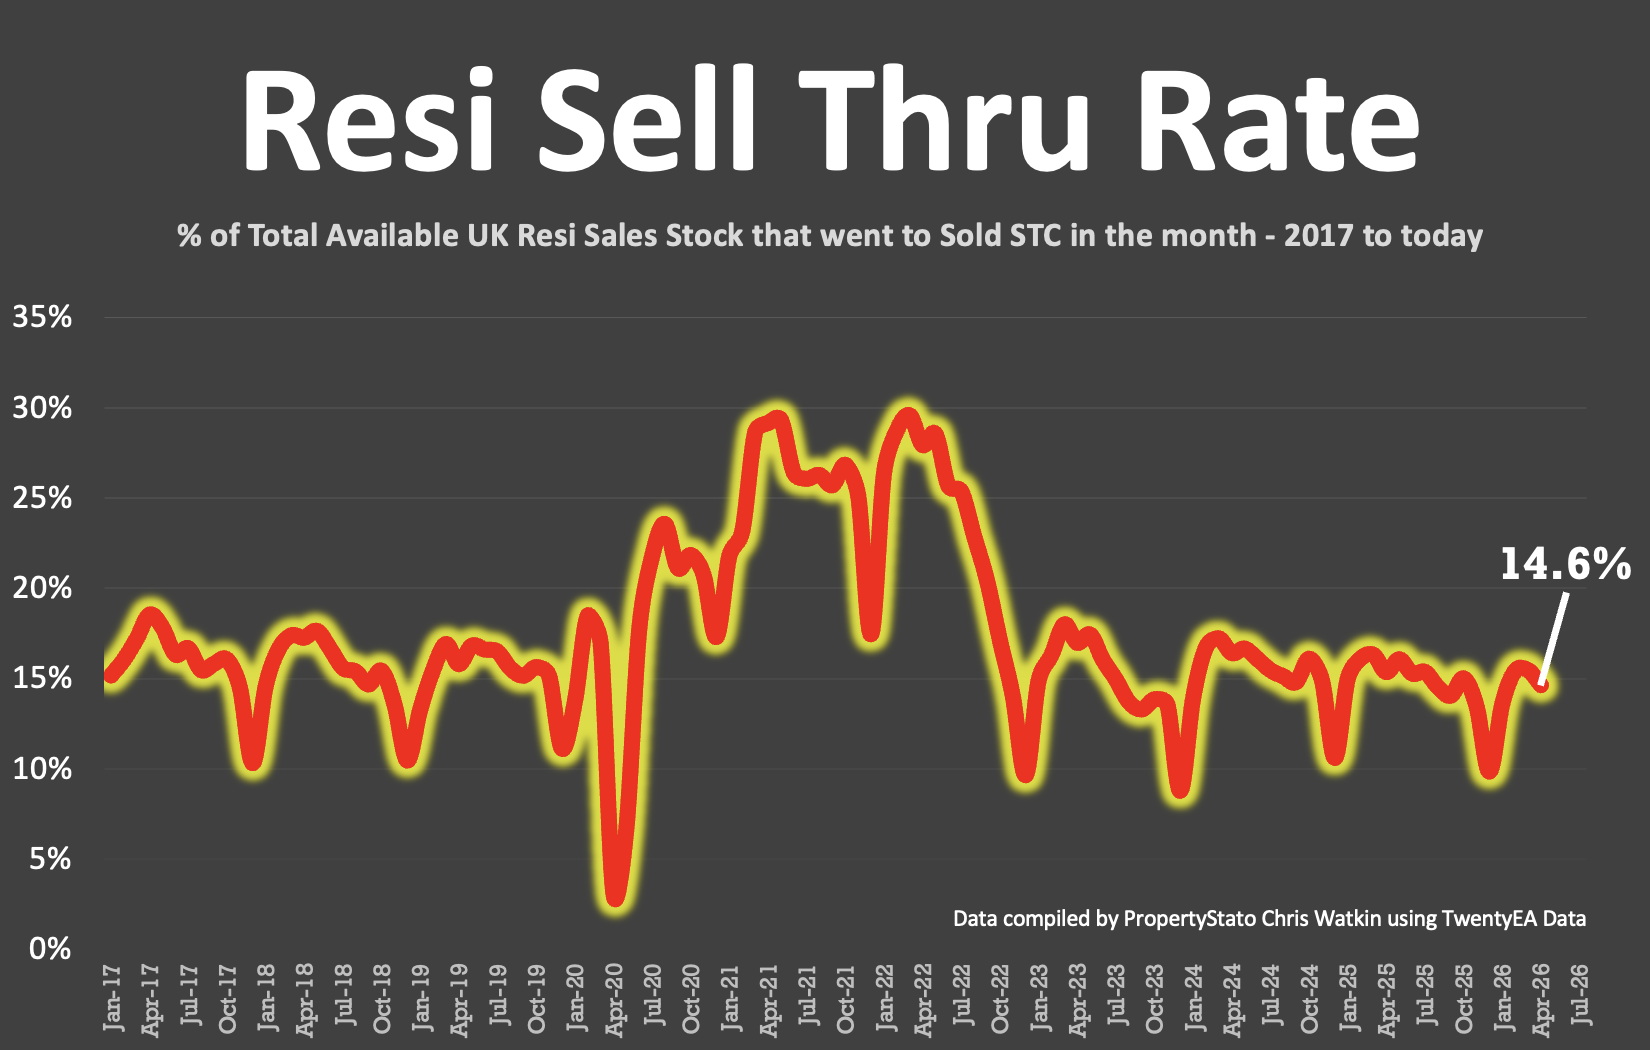
✅ Sell-Through Rate
• 14.6% of homes on agents’ books went SSTC in March ’26. Down from March ’26 – 15.5%
• Pre-Covid average: 15.5%.
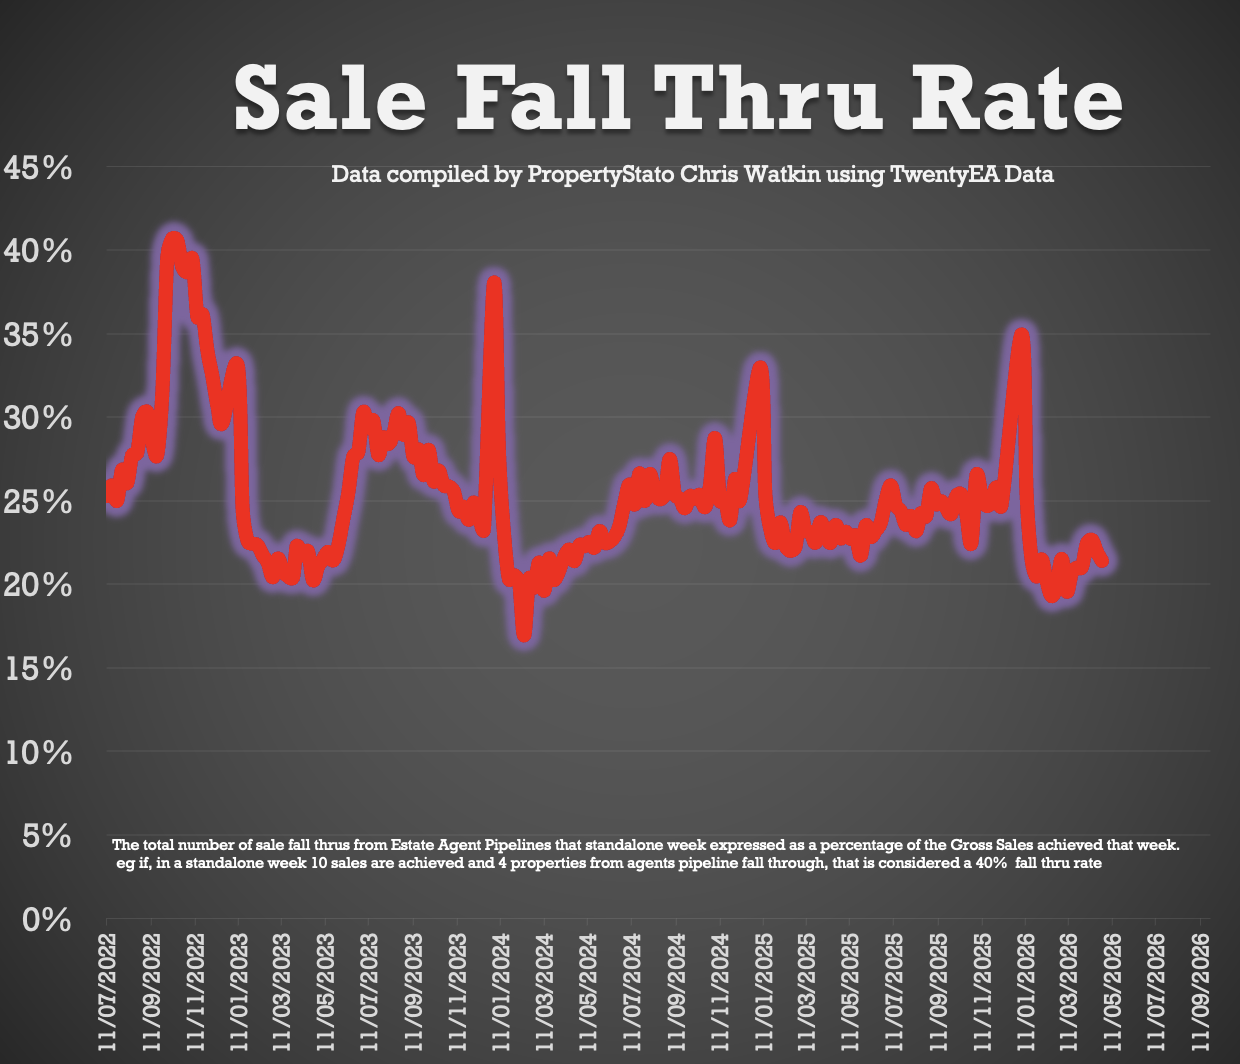
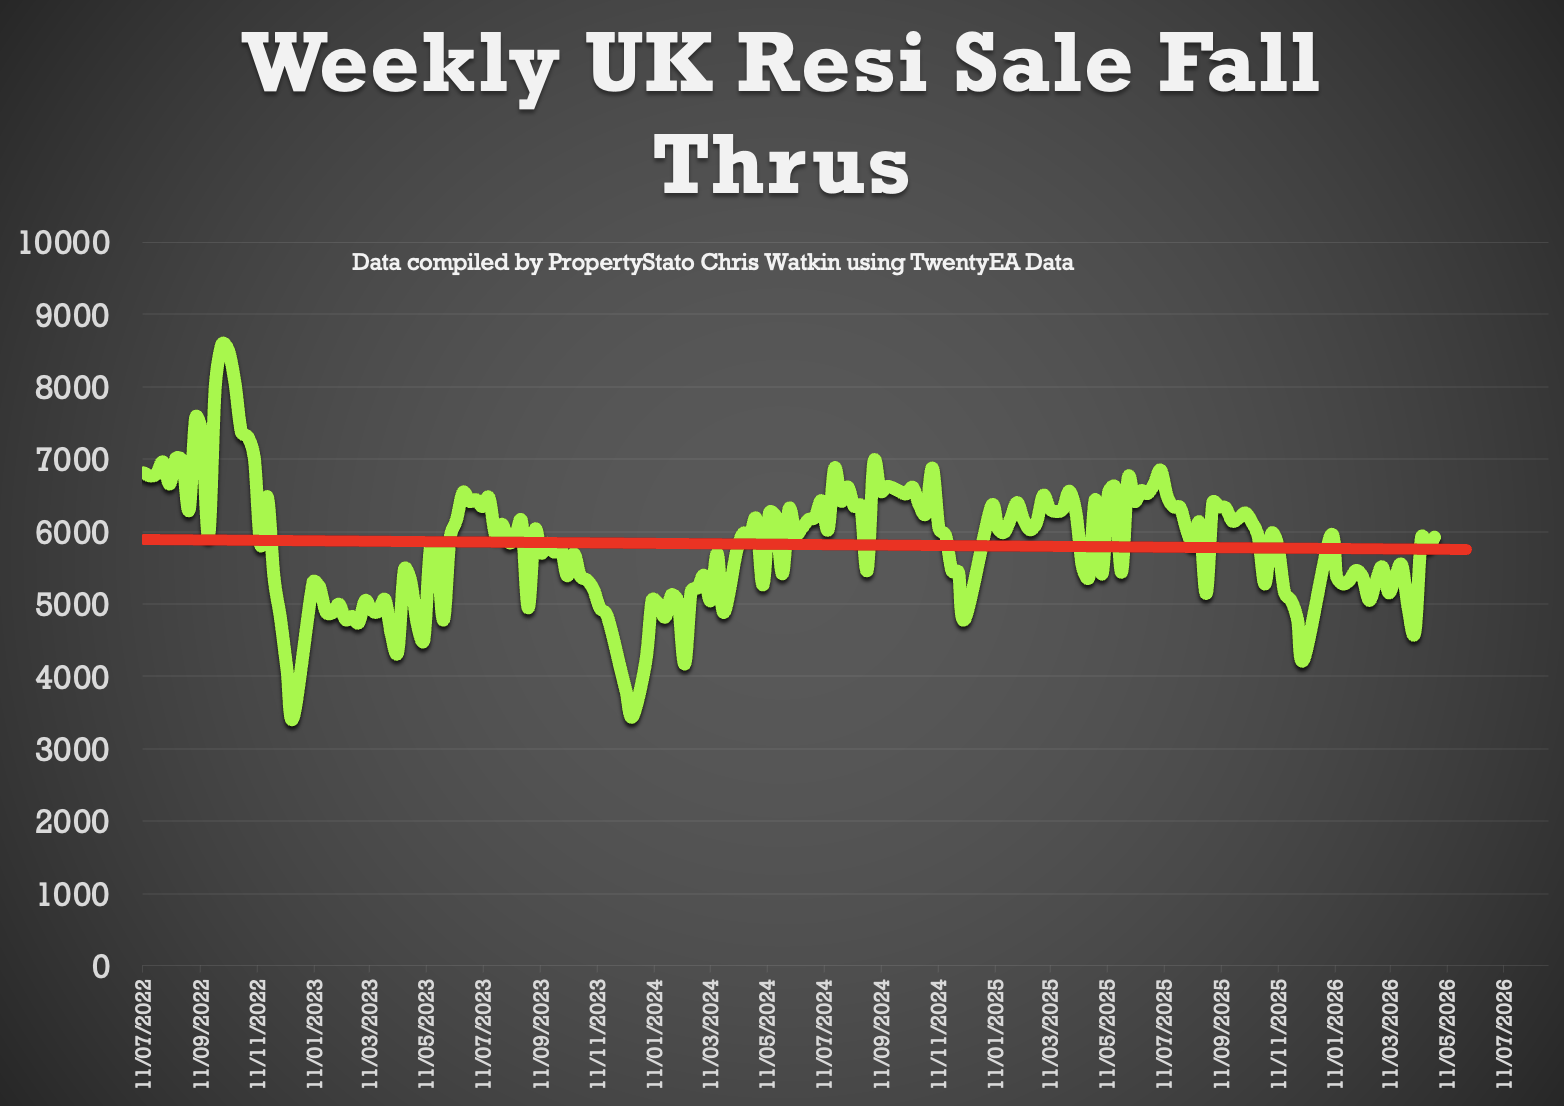
✅ Fall-Throughs
• 5,927 fall-throughs last week (pipeline of 461k home Sold STC).
• Weekly average of fall thrus for the whole of 2025: 6.1k and 5.4k in 2026 YTD
• Fall-through rate (Fall thru expressed as a % of the Gross sales that week): 21.4%, down from last weeks 25.8%.
• Long-term average: 24.5% (post-Truss chaos saw levels exceed 40%).
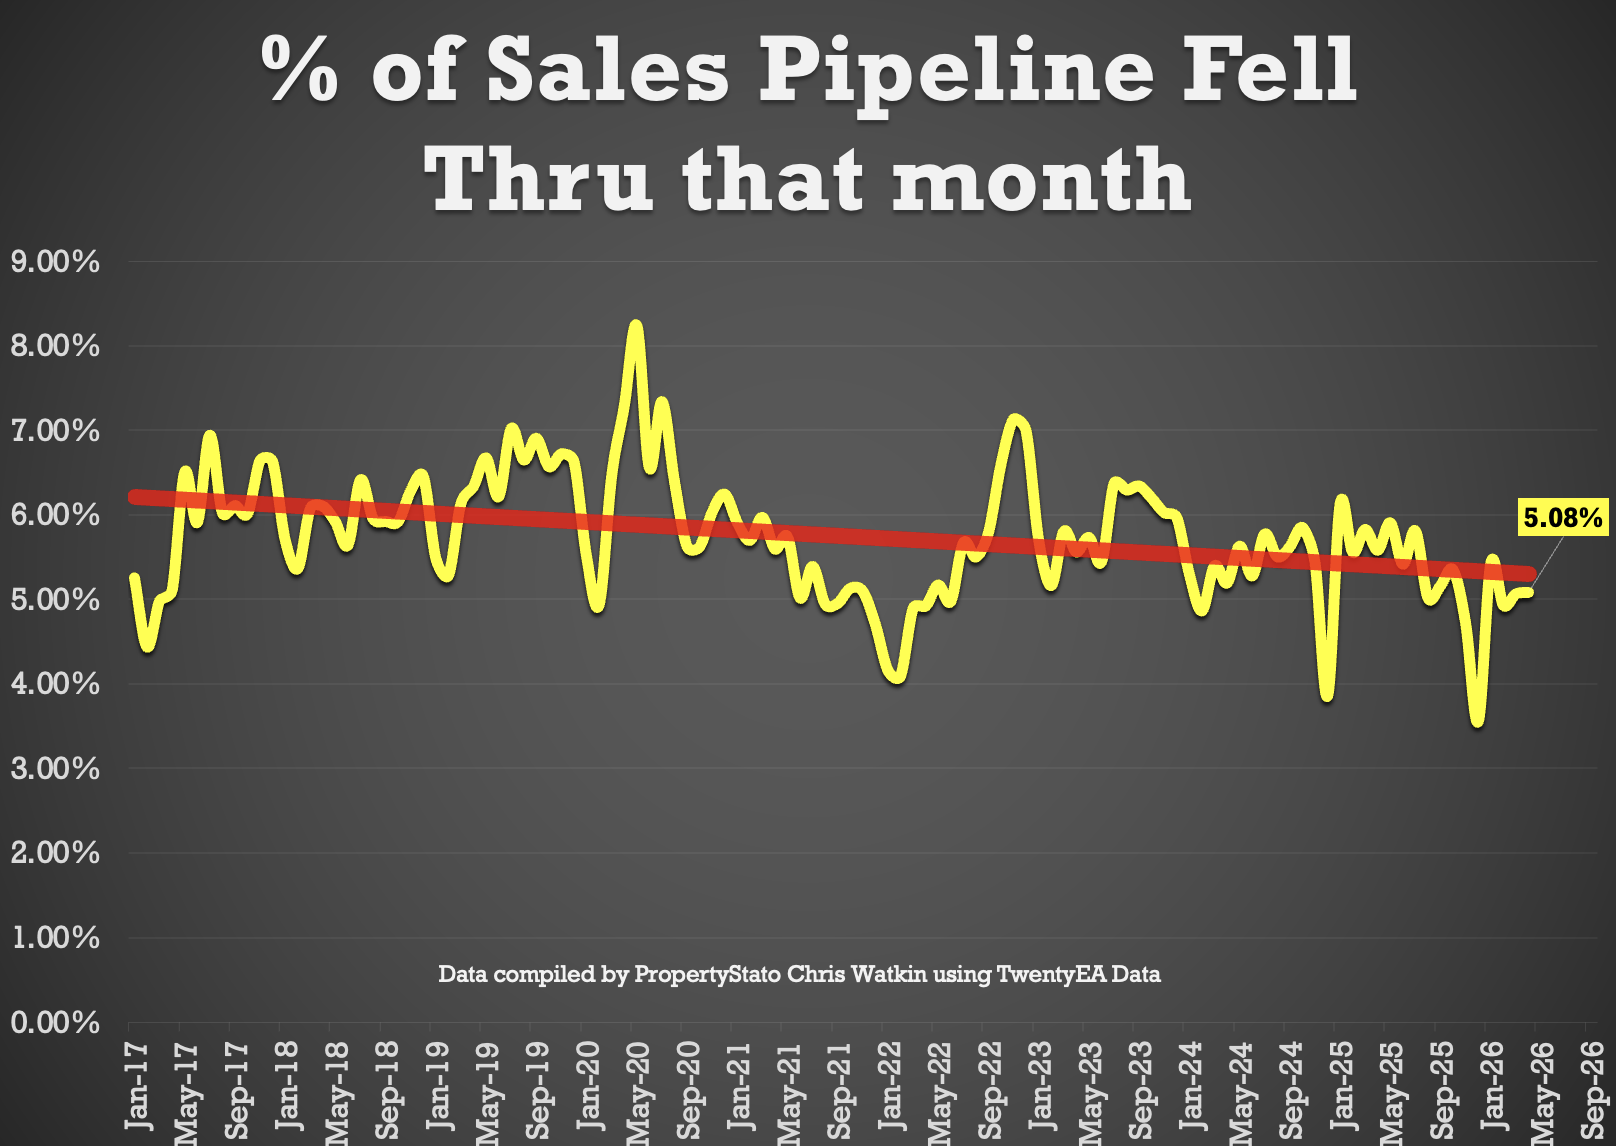
• 5.08% of all the sales agreed in Estate Agent’s Sales pipelines fell thru in April 2026. 2025 average – 5.3% & 10 year average 5.8%).
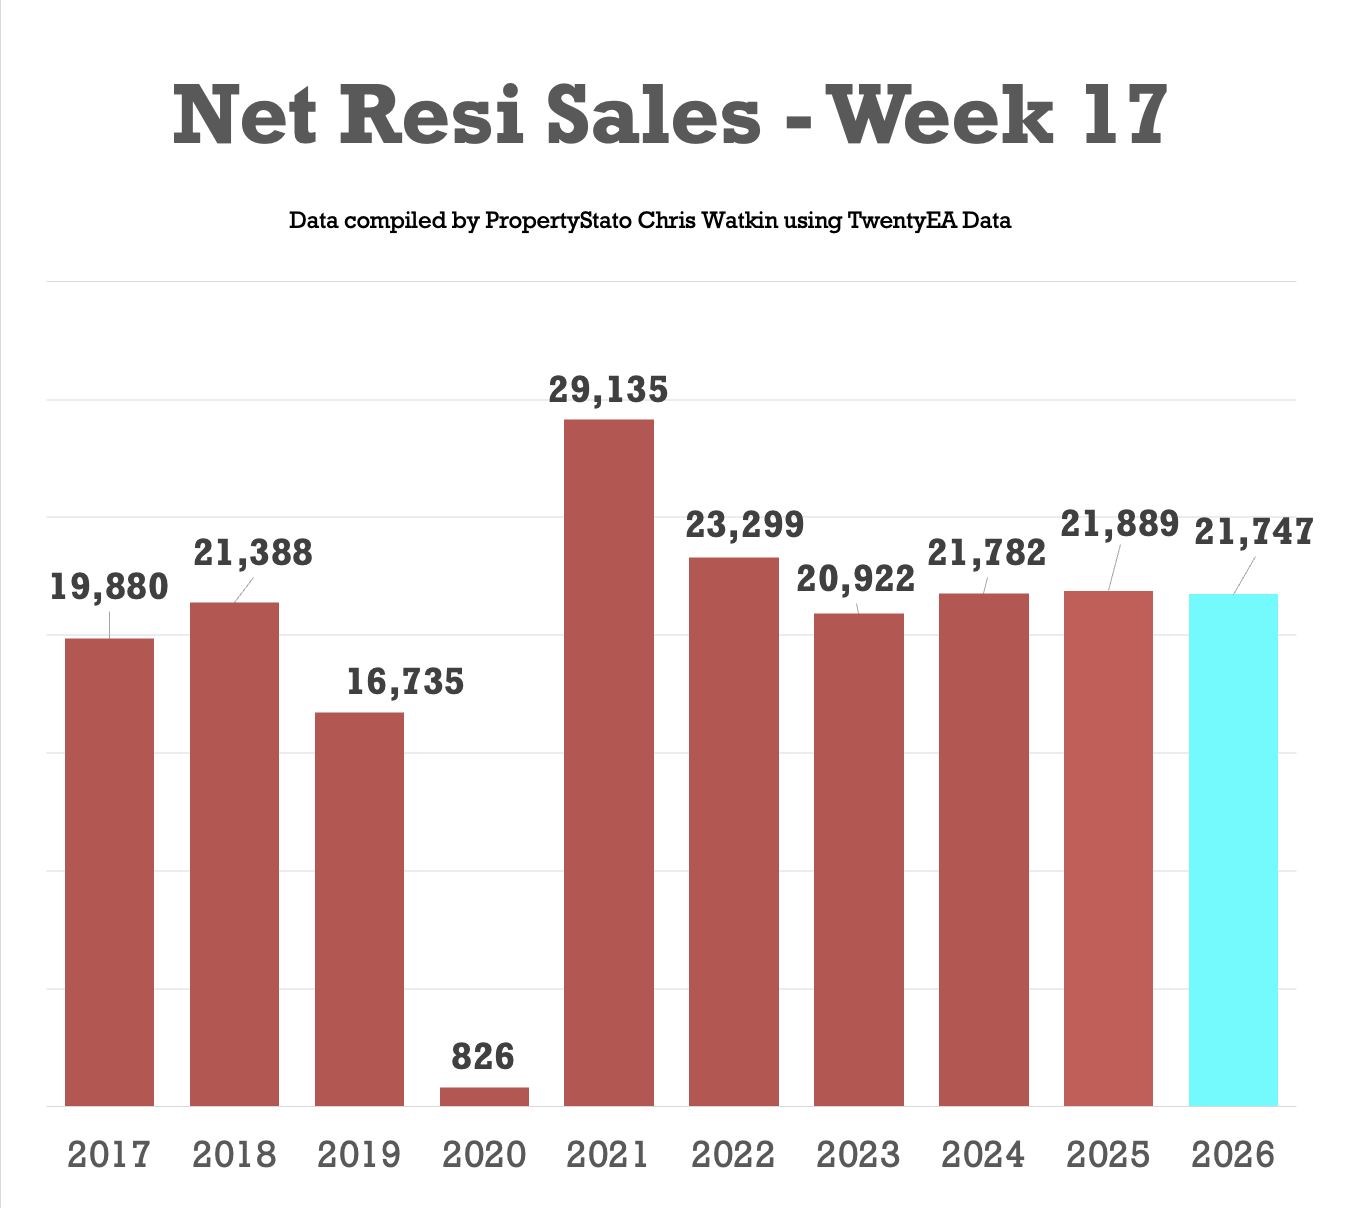
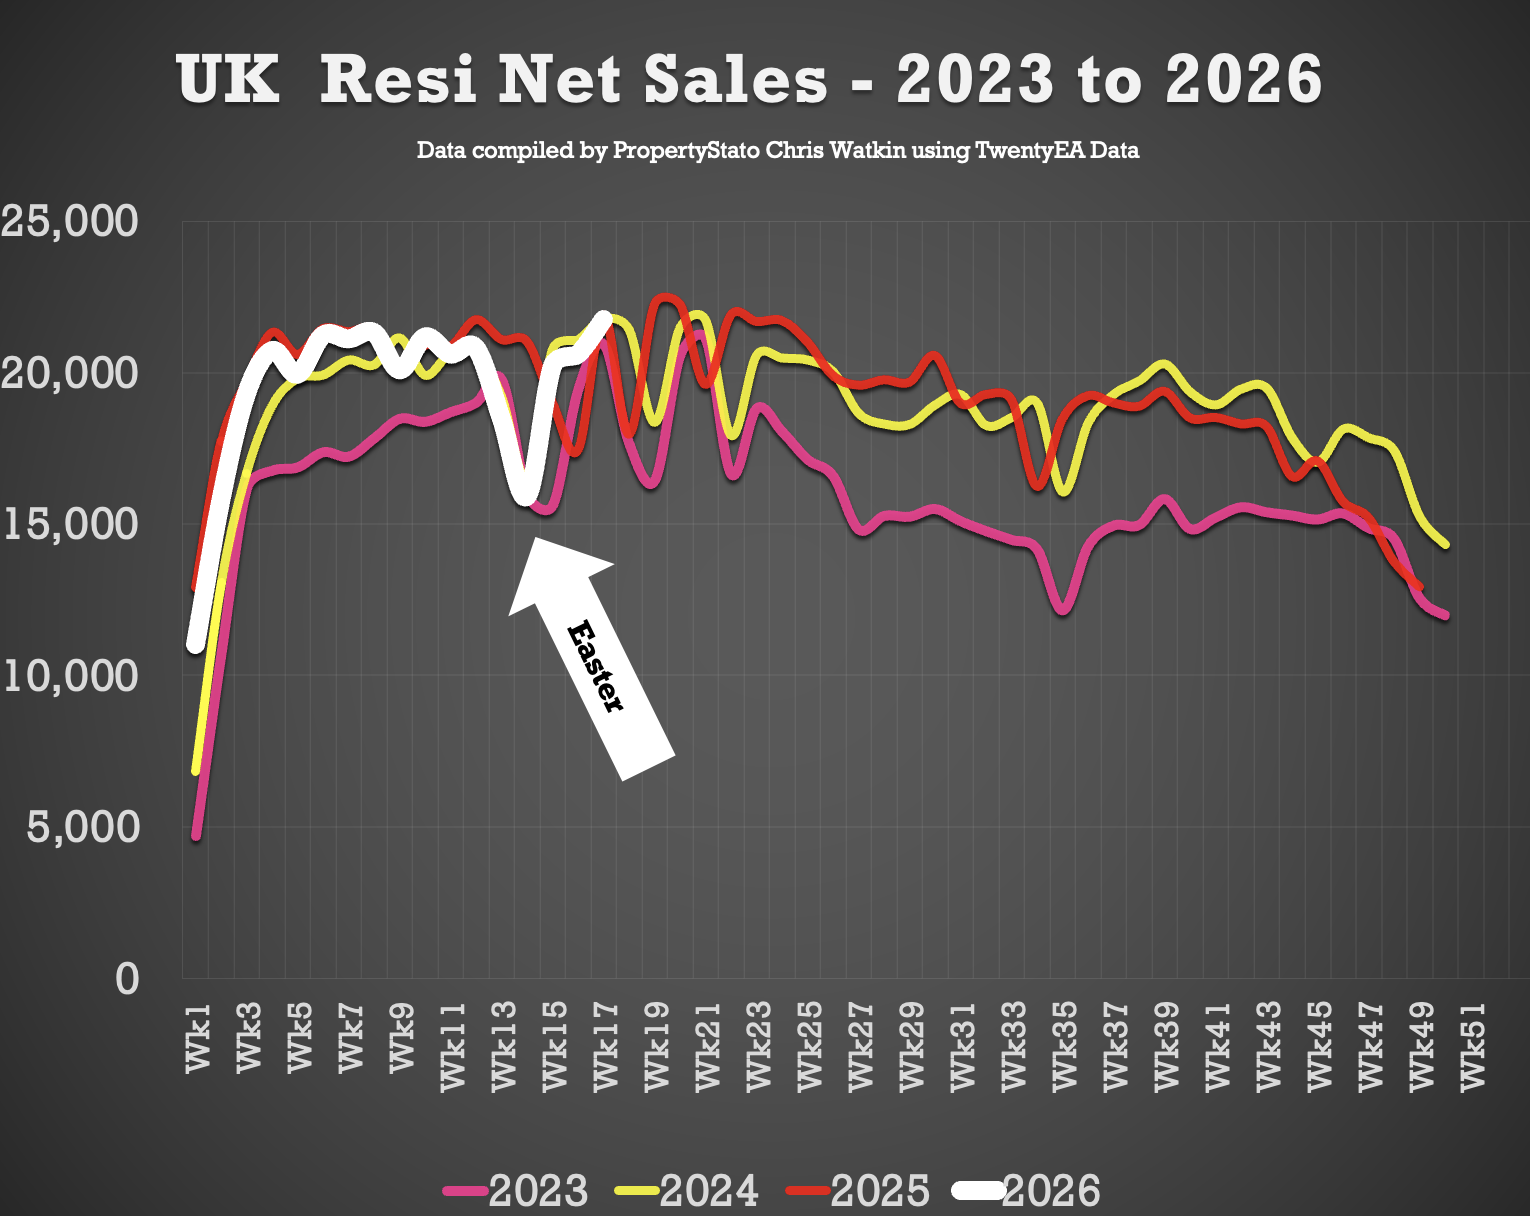
✅ Net Sales
• 21.7k Net Sales, up from 20.6k last week
• Ten-year Week 17 average: 19.8k.
• Weekly average for 2026: 19.4k.
• Weekly average for the whole of 2025: 18.8k.
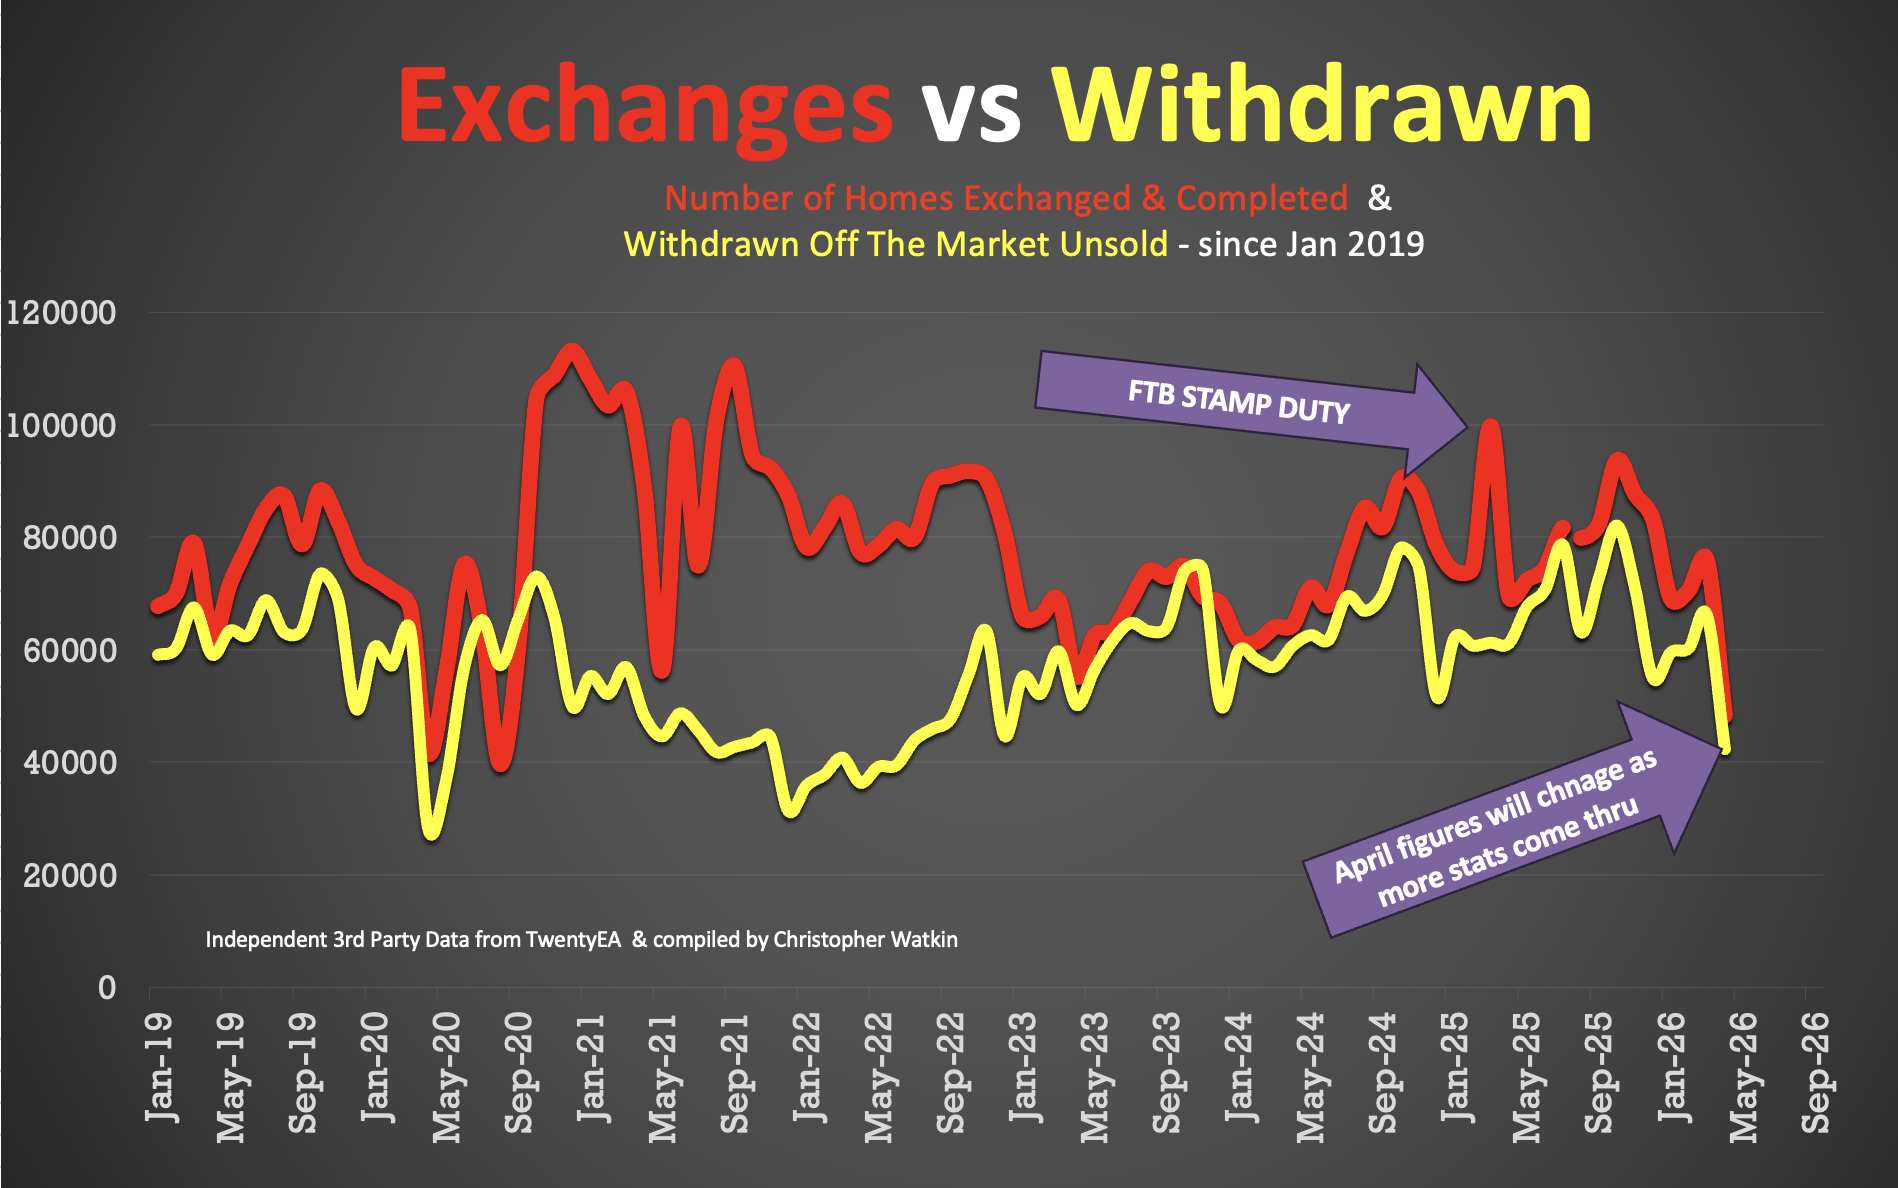
✅ Probability of Selling (% that Exchange vs withdrawal)
• March ’26 Stats : 53.3% of homes that left agents’ books exchanged & completed in April. (Note this figure will change throughout the month as more April stats come in).
• 57.6% is the 7 year average (which includes the crazy years post lockdown 18 months).
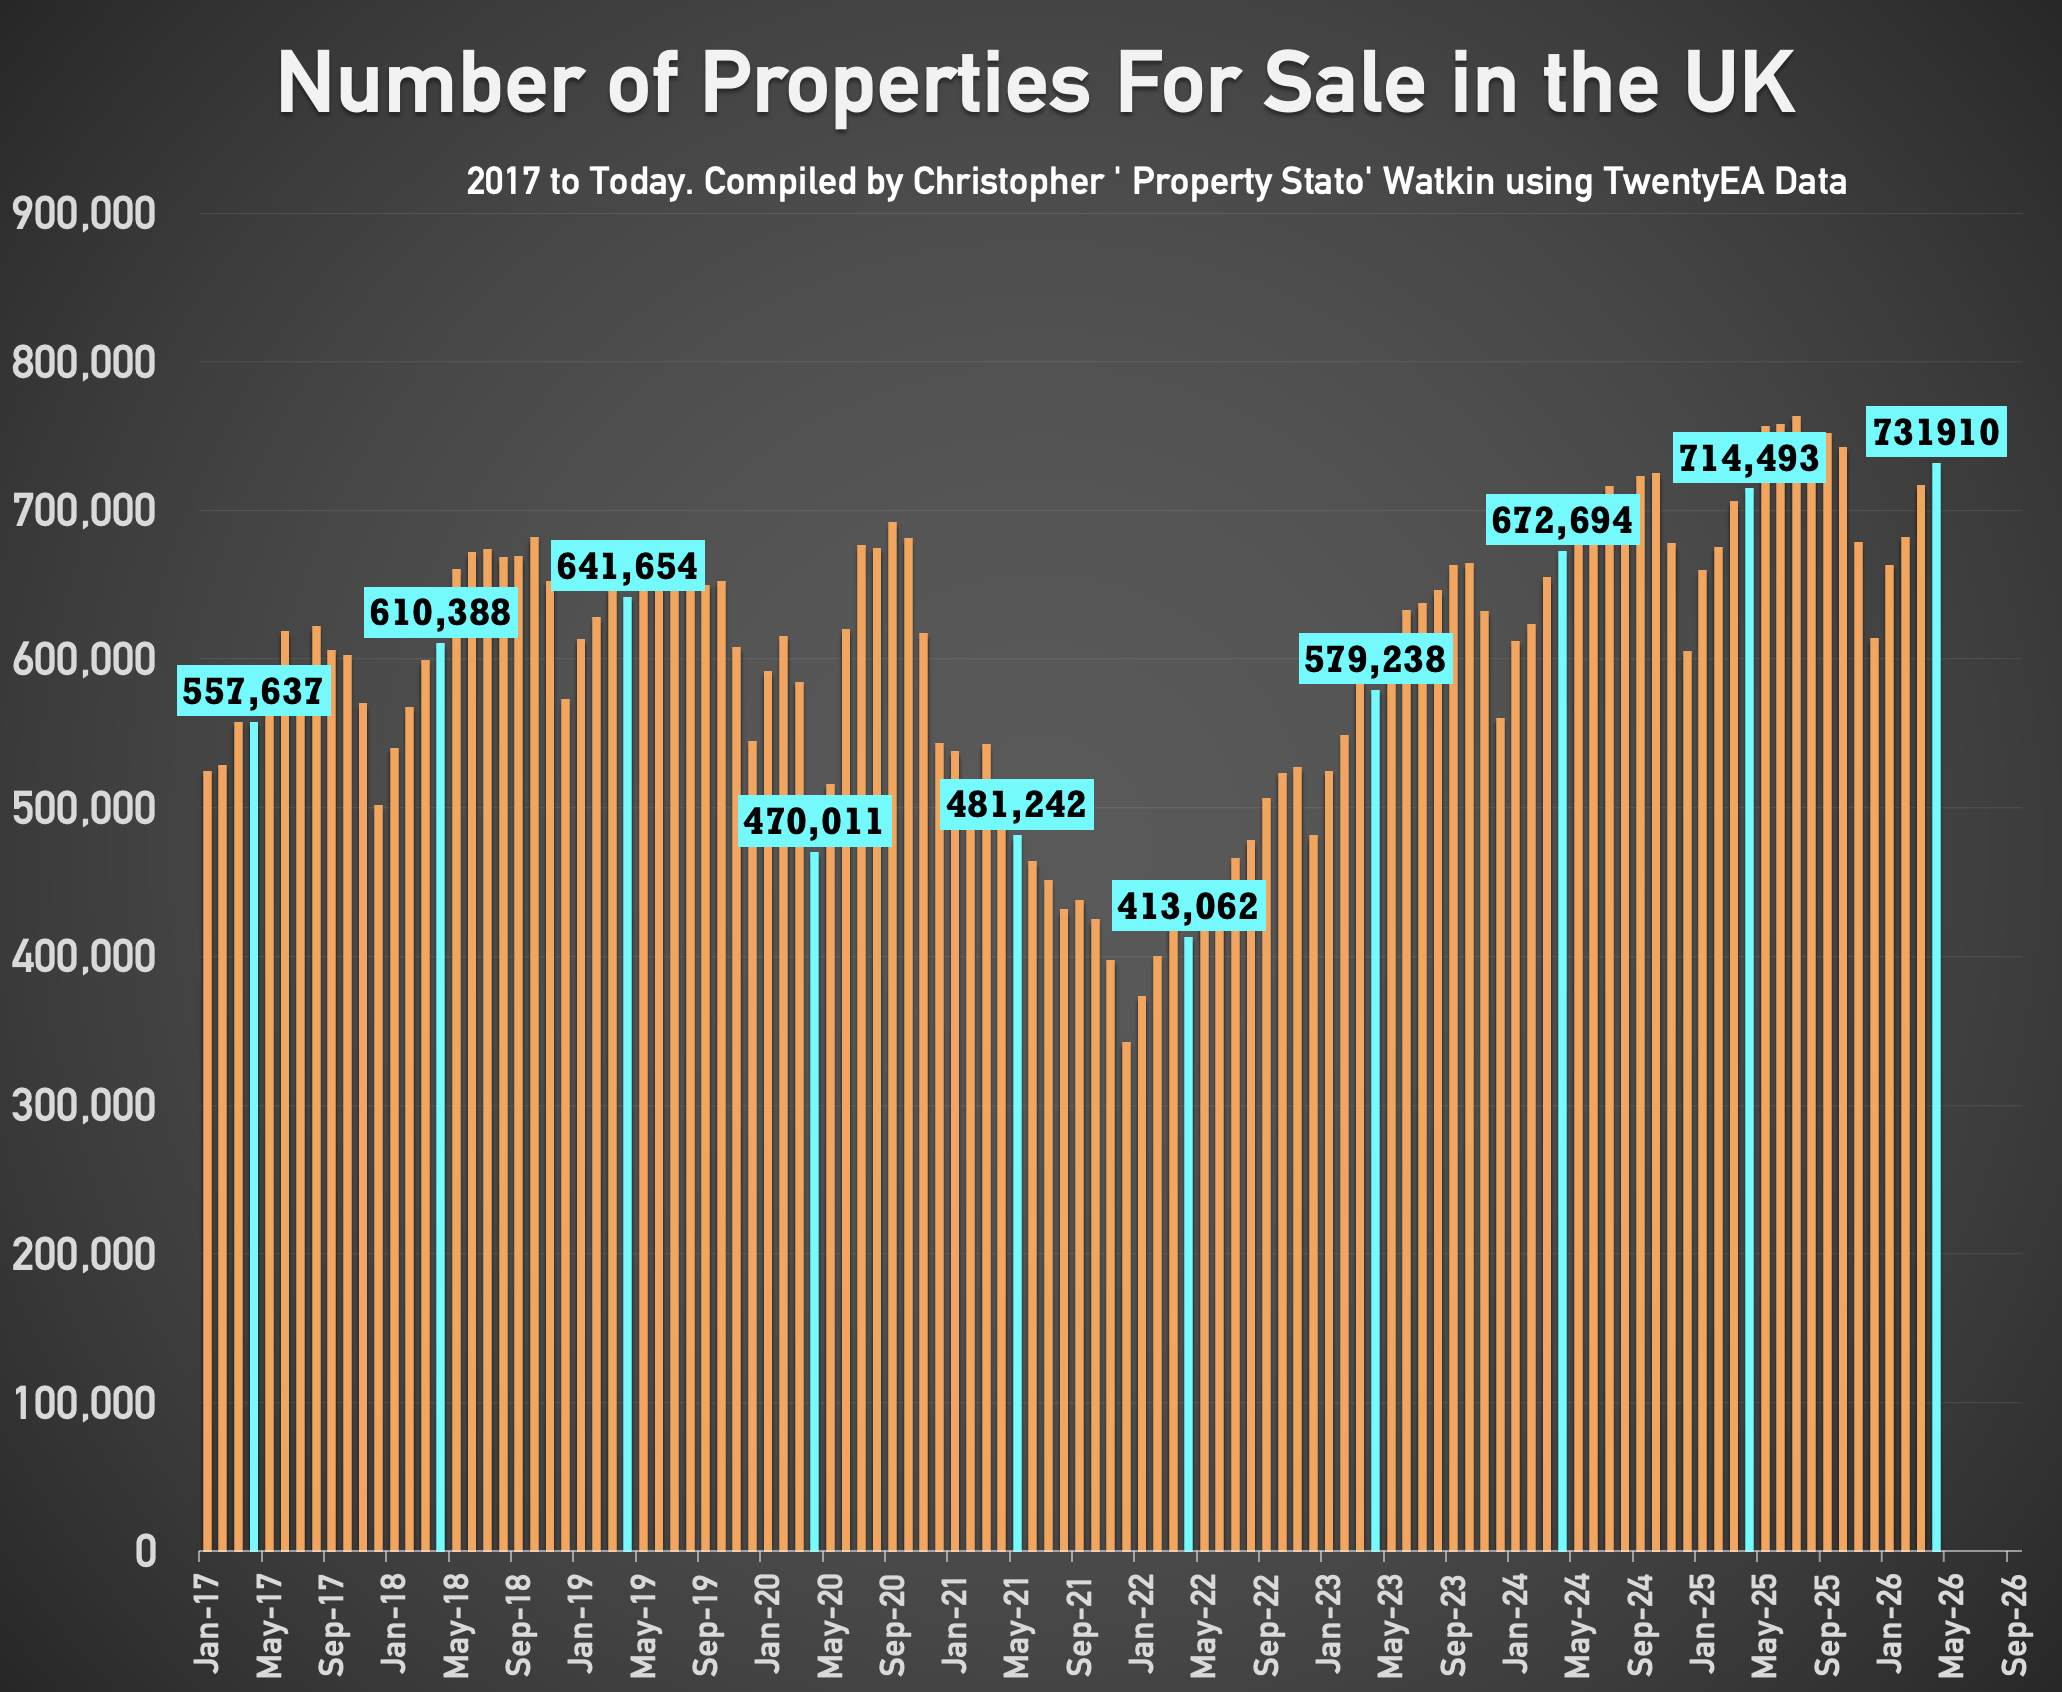
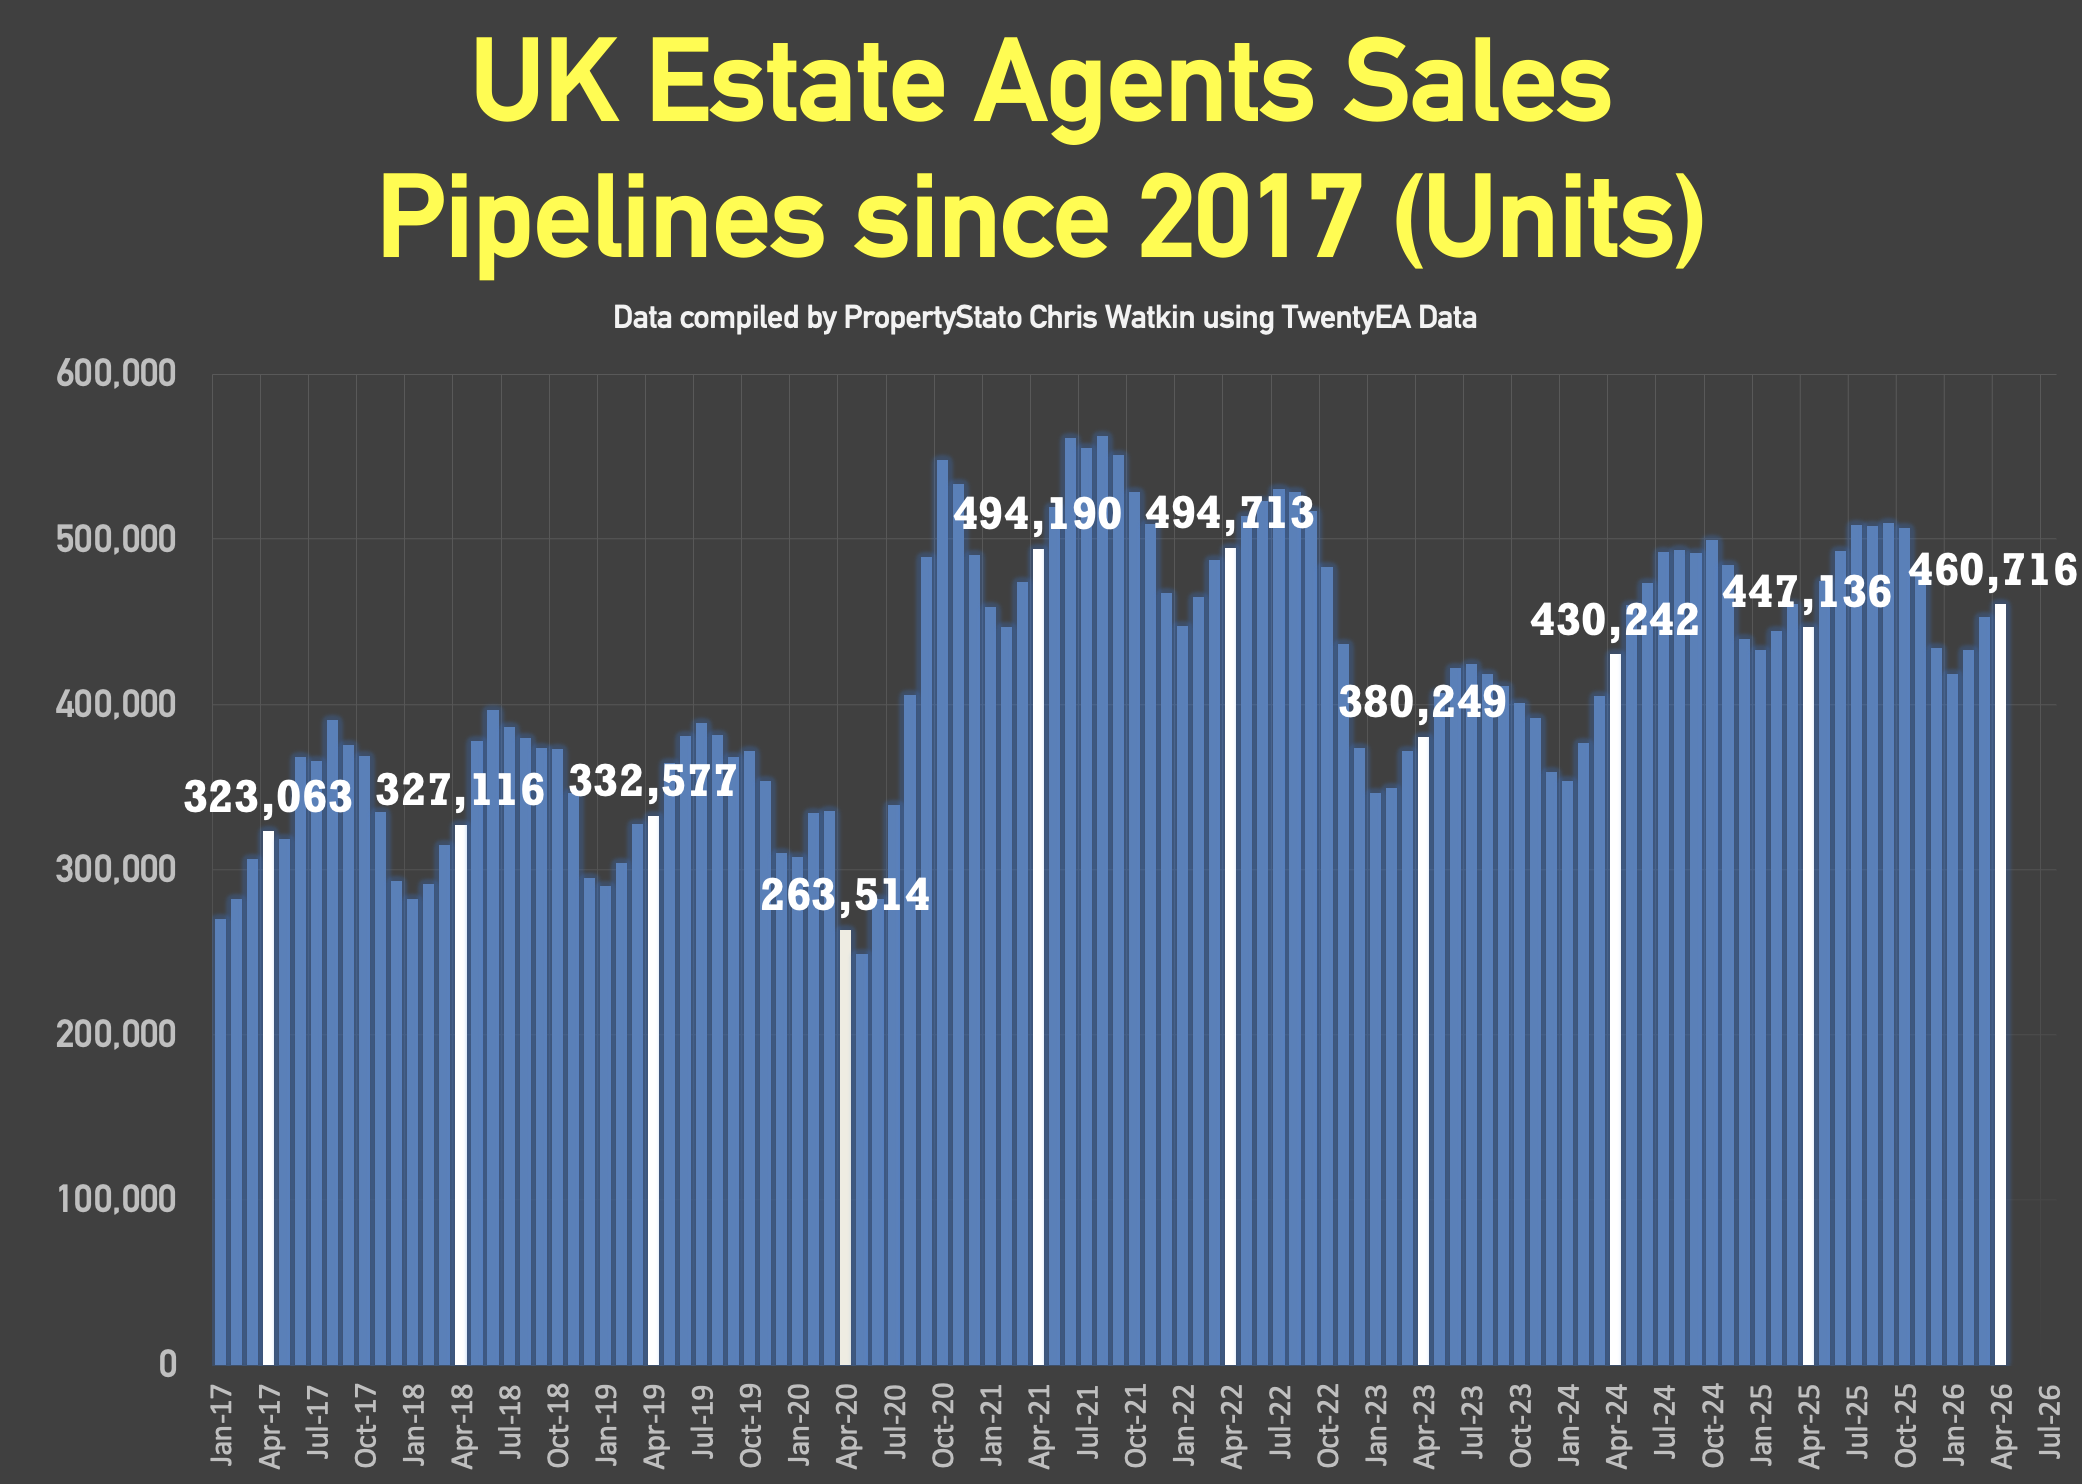
✅ Stock Levels
• 731k homes on the market on the 1st of May ’26. (714k – 1st May 25)
• 461k homes in agent’s sales pipeline on the 1st May 2026, slightly higher than 12 months ago on 1st May ’25 (447k).
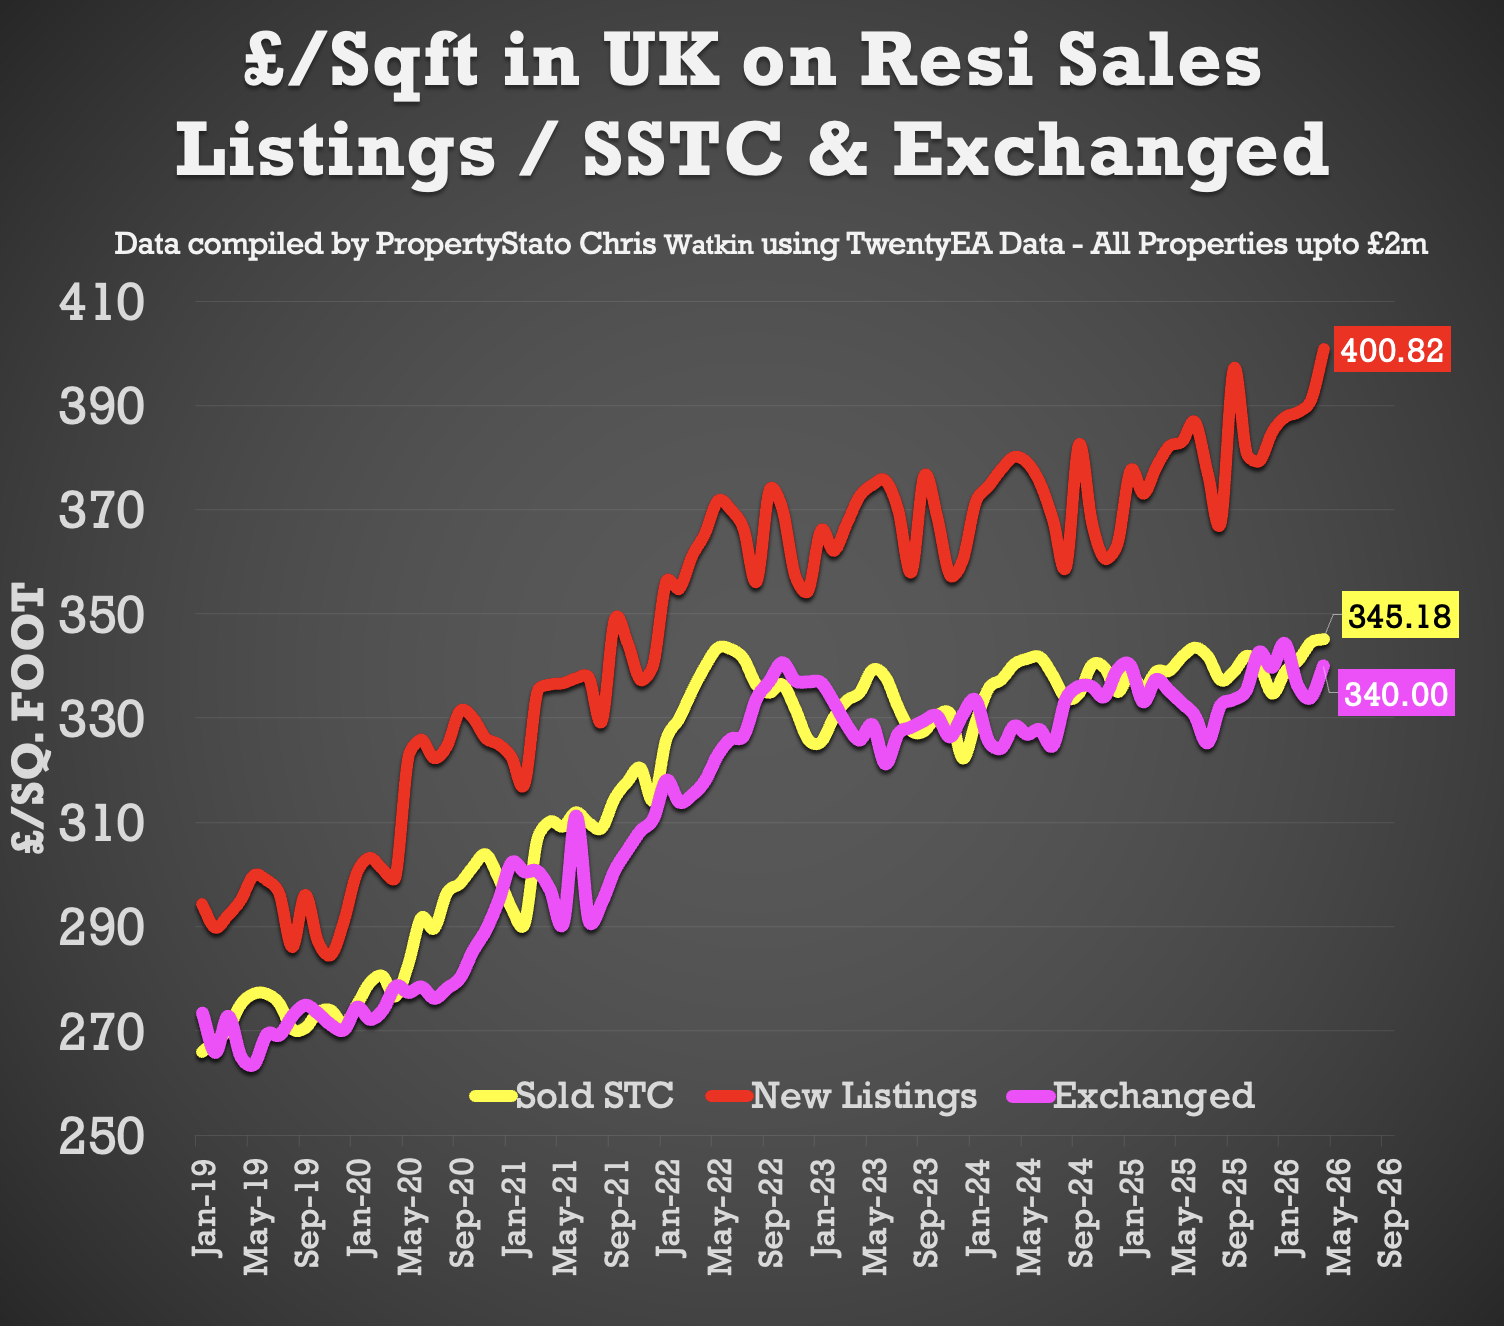
✅ House Prices (£/sq.ft)
• April ’26 agreed sales averaged £345.18 per sq.ft. 1.8% higher than 12 months ago (£339.10) and 11.3% than 5 years ago (£310.18).
The £/sqft at sale agreed matches the HM Land Registry Index with a 98% accuracy, 5 months in advance. That is why it is so important.
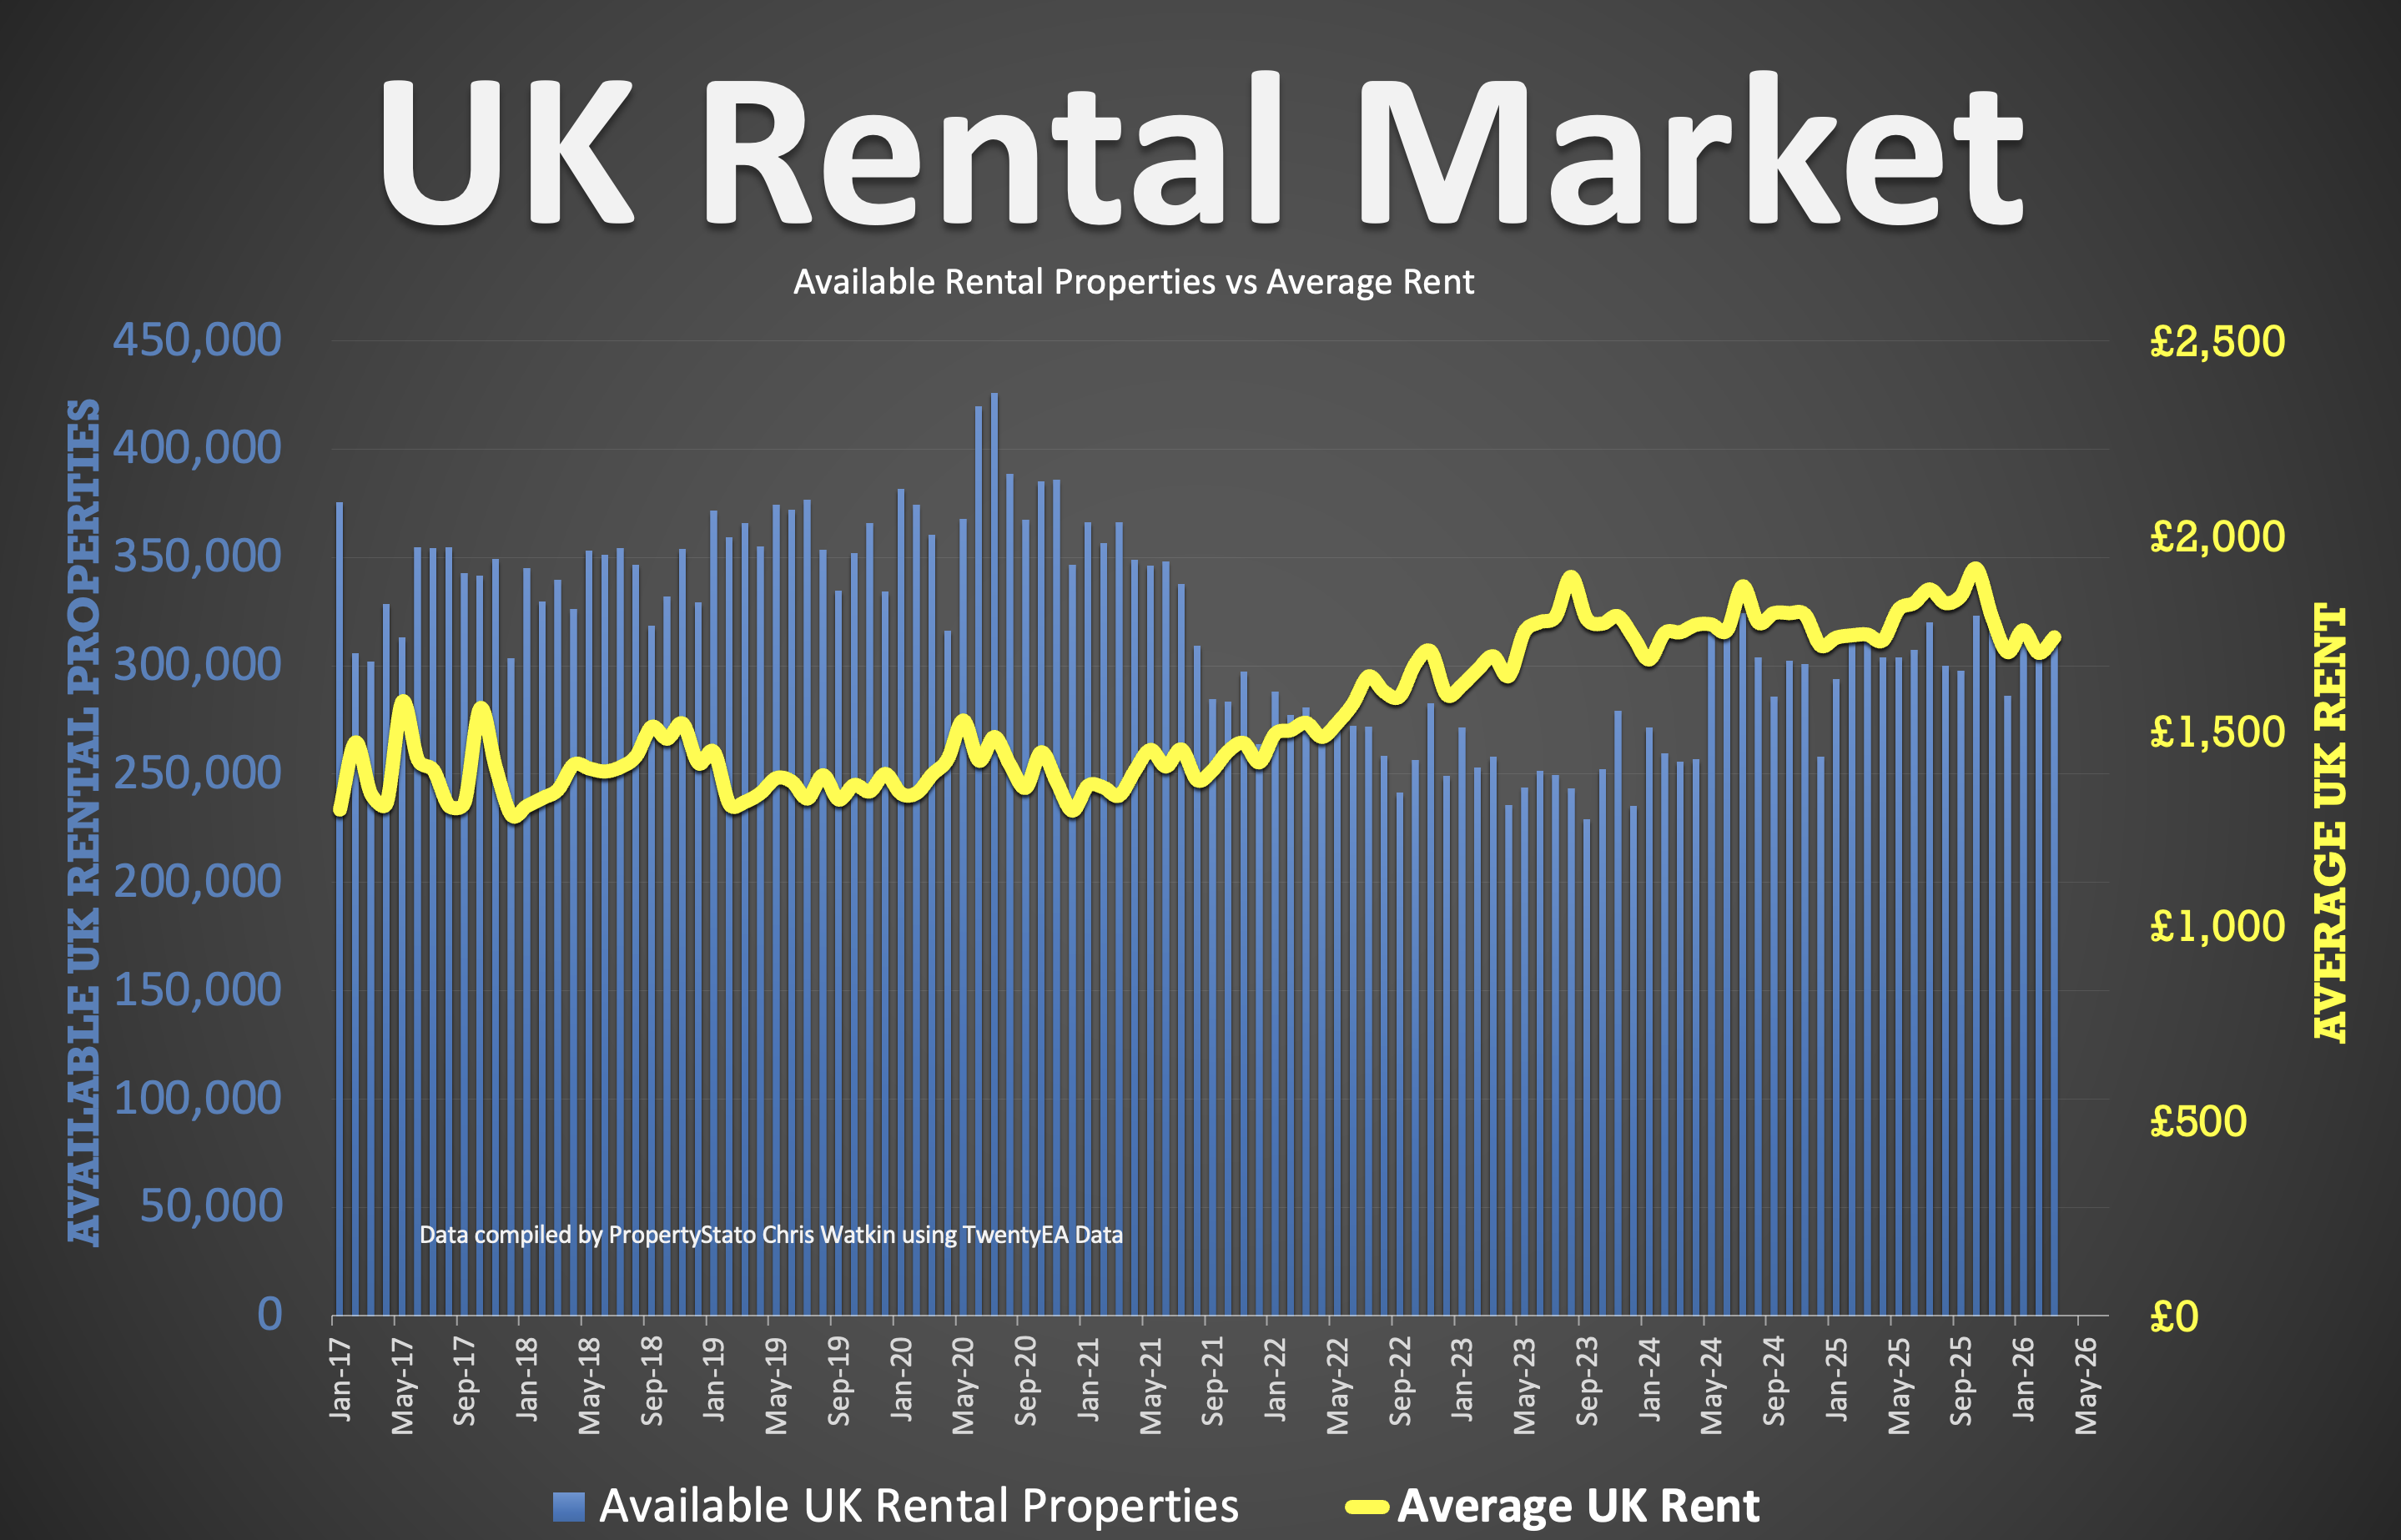
✅ UK Rental Data
• Average Rent in Wk 17 – £1,778 pcm
• Average Rent in April 2026 – £1,778 pcm (£1,700 in April 25)
• Average Rent in YTD 2026 – £1,739 pcm
• 302k UK Rental Stock available to rent in April 26 (303k in April 2025).
✅ Local Focus
Swansea

Comments are closed.