
 The UK Property Market for the week ending Sunday, 24th March 2024 (Week 12) continues its onward journey with regard to a decent levels of transactions and house prices achieved.
In this week’s UK Property Market Stats Show with Richard Durrant, the headlines are as follows:
+ House Prices on the 95k Sale Agreed homes in March stands at £341/sq.ft (Feb ’24 £339/sq.ft & Jan ’24 to £331/sq.ft)
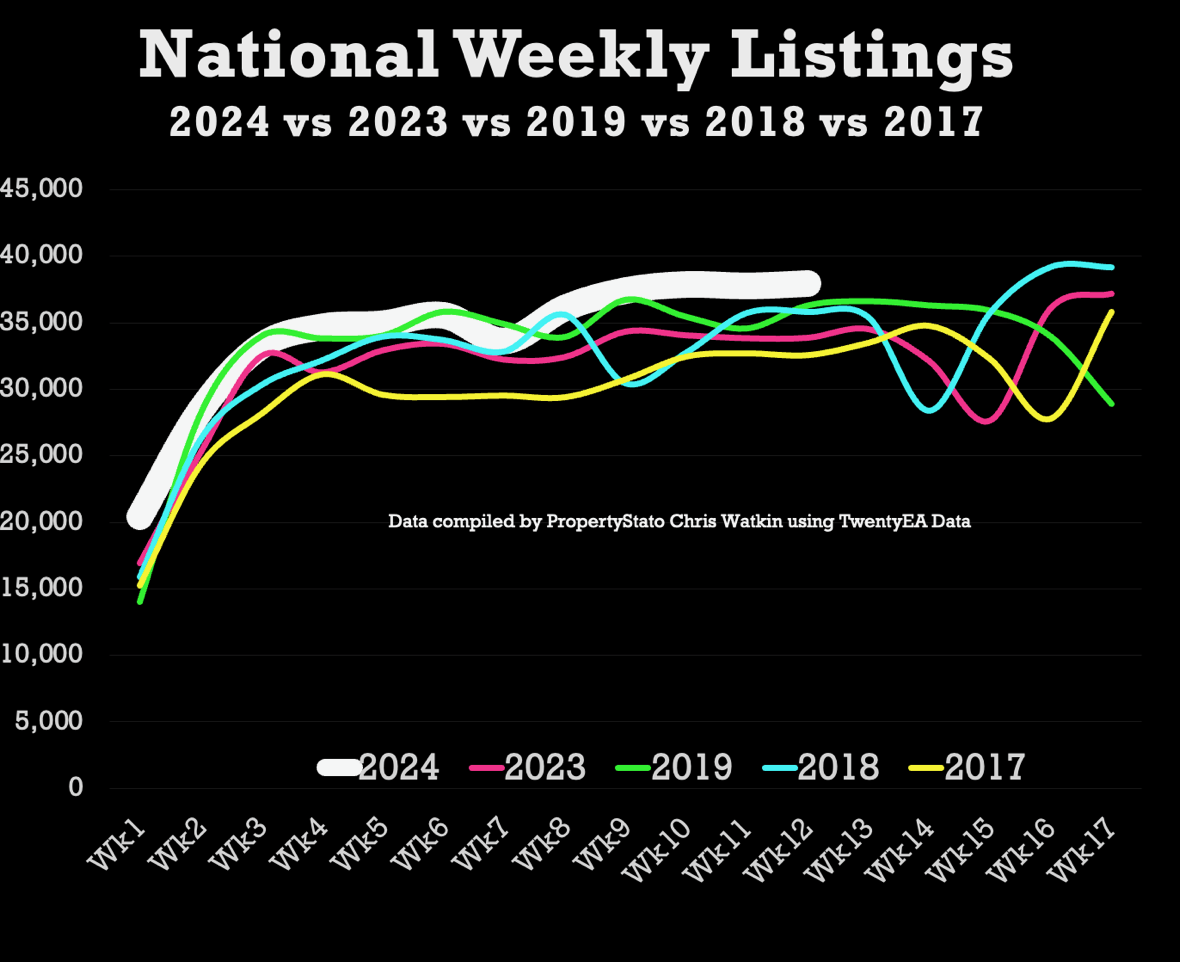
+ Listings for last week (Week 12) were 10% higher than Wk 12 eight year average.
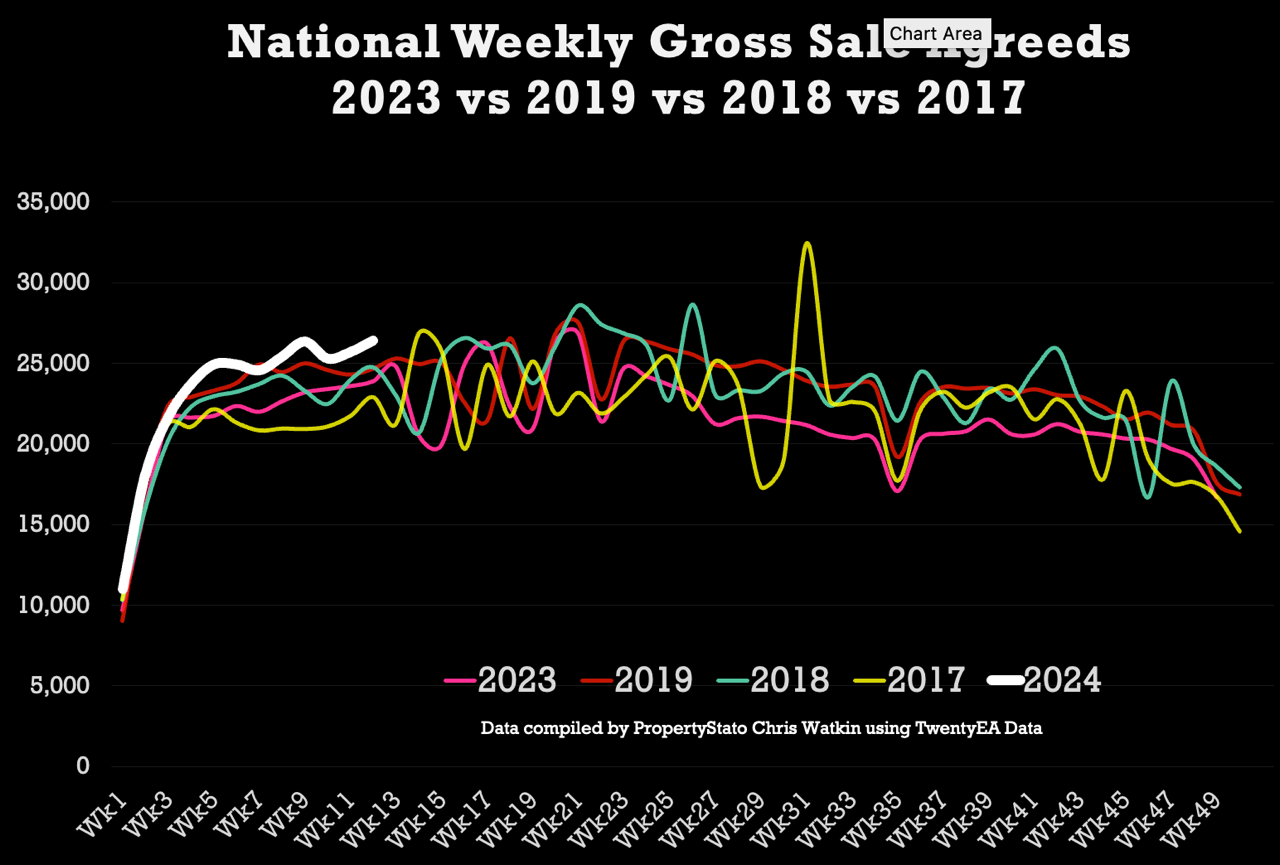
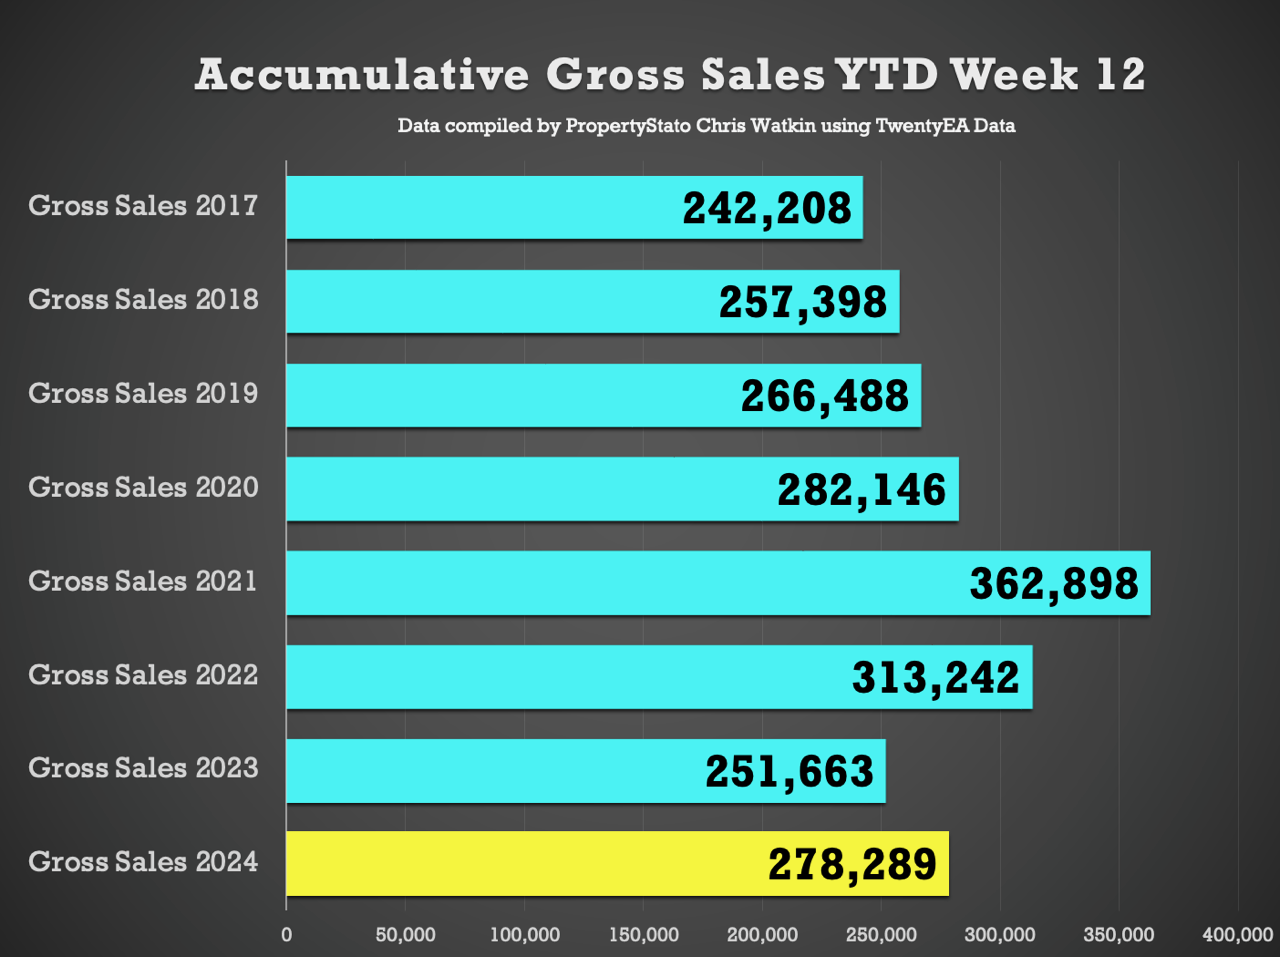
+ Total Gross Sales YTD are 10.6% than 2023 YTD levels & 9% higher than 2017/18/19 levels. This is the best week for house sales in 44 weeks (and that was the highest sales week in the whole of 2023)
+ Net Sales last week 13.6% higher than Week 12 2023 at 14% above the 2024 weekly average
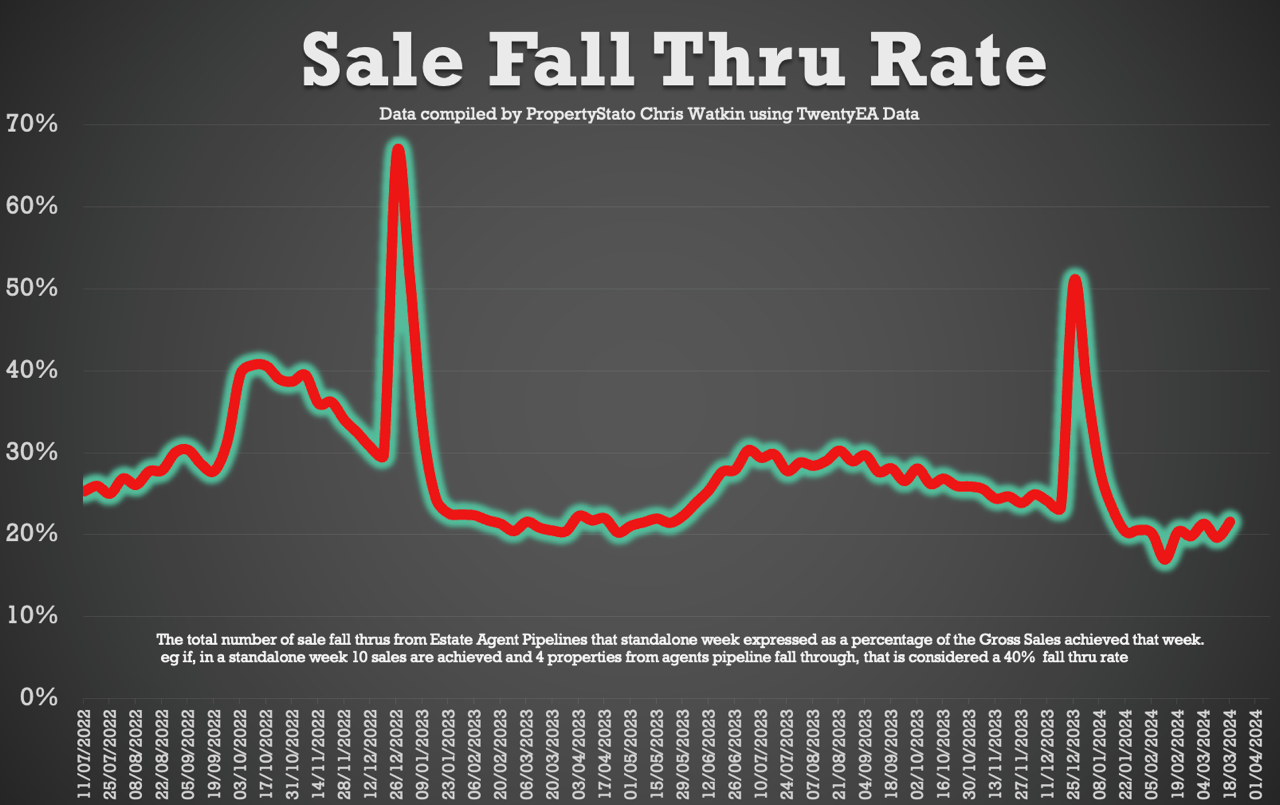
+ Sale fall-throughs still just over 1 in 5 sales.
Chris’s In-Depth Analysis (Week 12) :
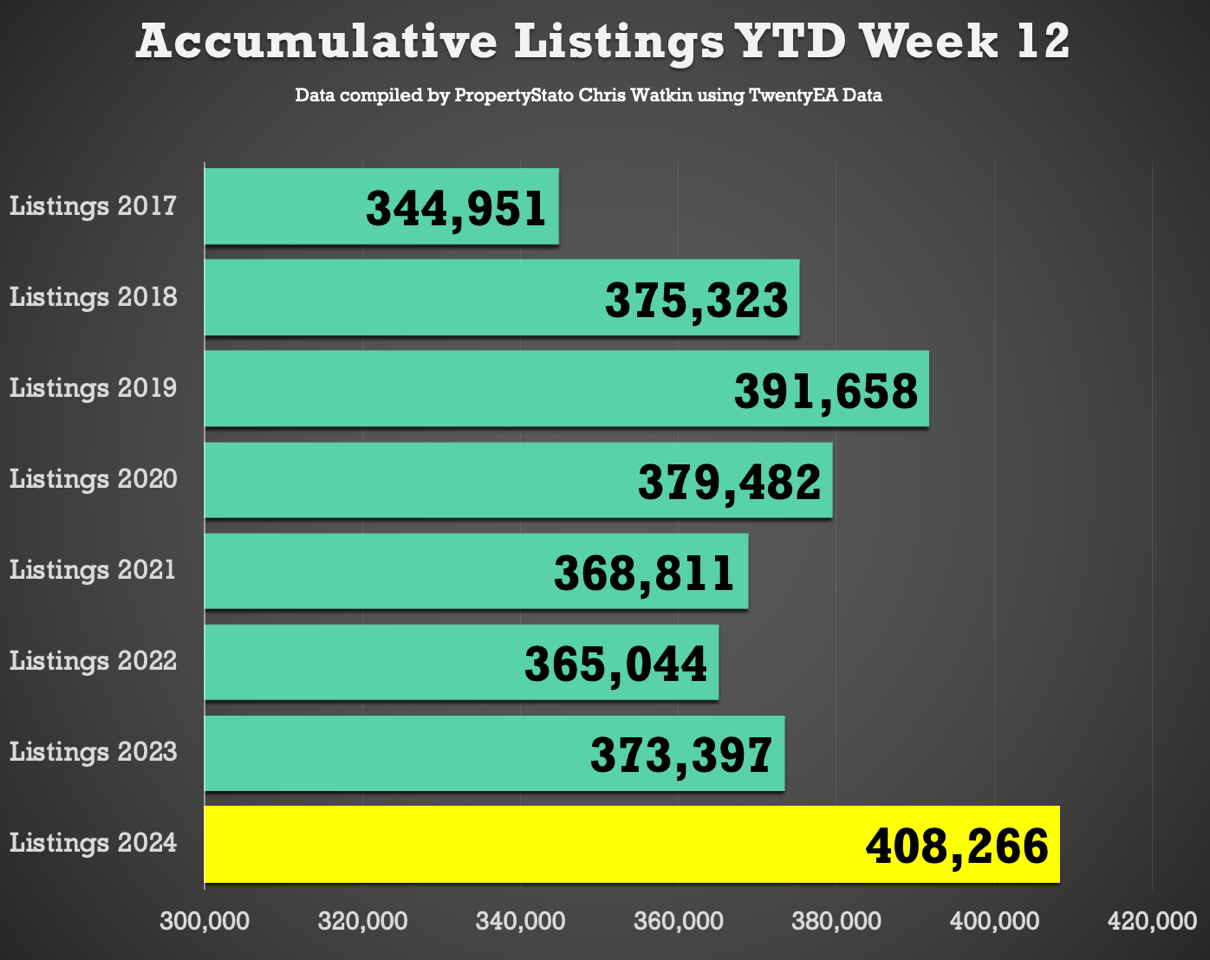
+ New Properties to Market: The UK saw 37,973 new listings. This year’s YTD listings stand at 408,266, 8% higher than the historical 8 year YTD average of 375,867 and 9.3% higher YTD 2023.
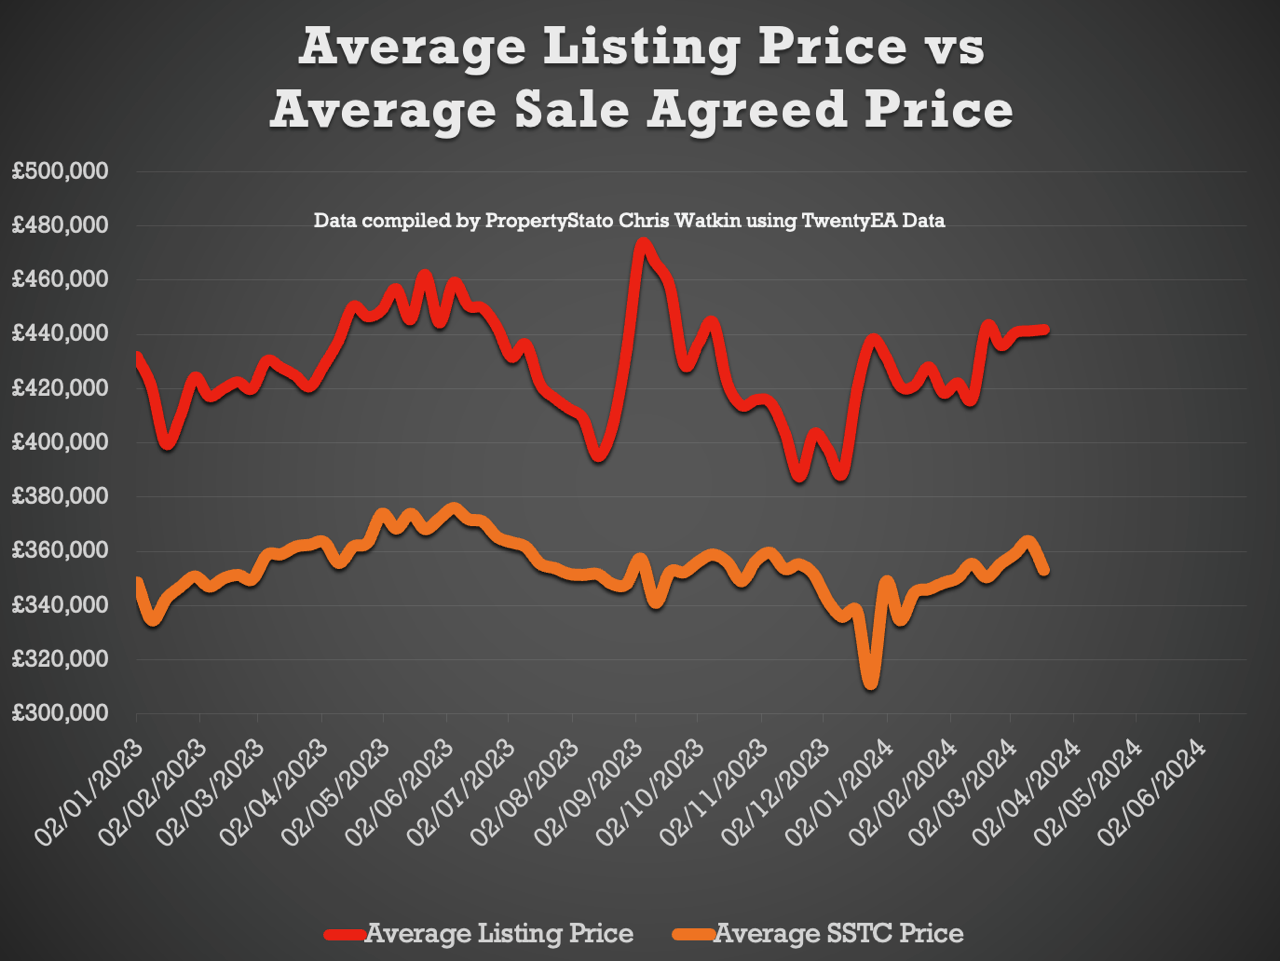
+ Average Listing Price: £441,809.
+ Average Asking Price of this week’s Listings vs Average Asking Price of the Properties that Sale Agreed this week: Increased slightly to 25%. The long-term average is between 16% and 17%.
+ Price Reductions: Last week, 21,378 properties saw price reductions, a significant number compared to the 8-year Week 10 average of 14,536. This means 1 in 6.9 properties each month are being reduced (Long term average 1 in 9.5 per month)
+ Average Asking Price for Reduced Properties: £395,593.
+ Gross Sales: 26,435 properties were sold stc last week (a 3.7% increase from last week’s Gross Sales figures). For comparison, it was 23,897 for the same week 12 in 2023. Average for 2017/18/19 was 24,113 for Week 12 – therefore, all things continue to look well.
+ Accumulative Gross Sales YTD: The total stands at 278,289, exceeding the average of 255,365 from 17/18/19 and 251,663 in the same week 12 in 2023.
+ Average Asking Price of Sold STC Properties: Still staying in the £350k/£360k range at £353,131.
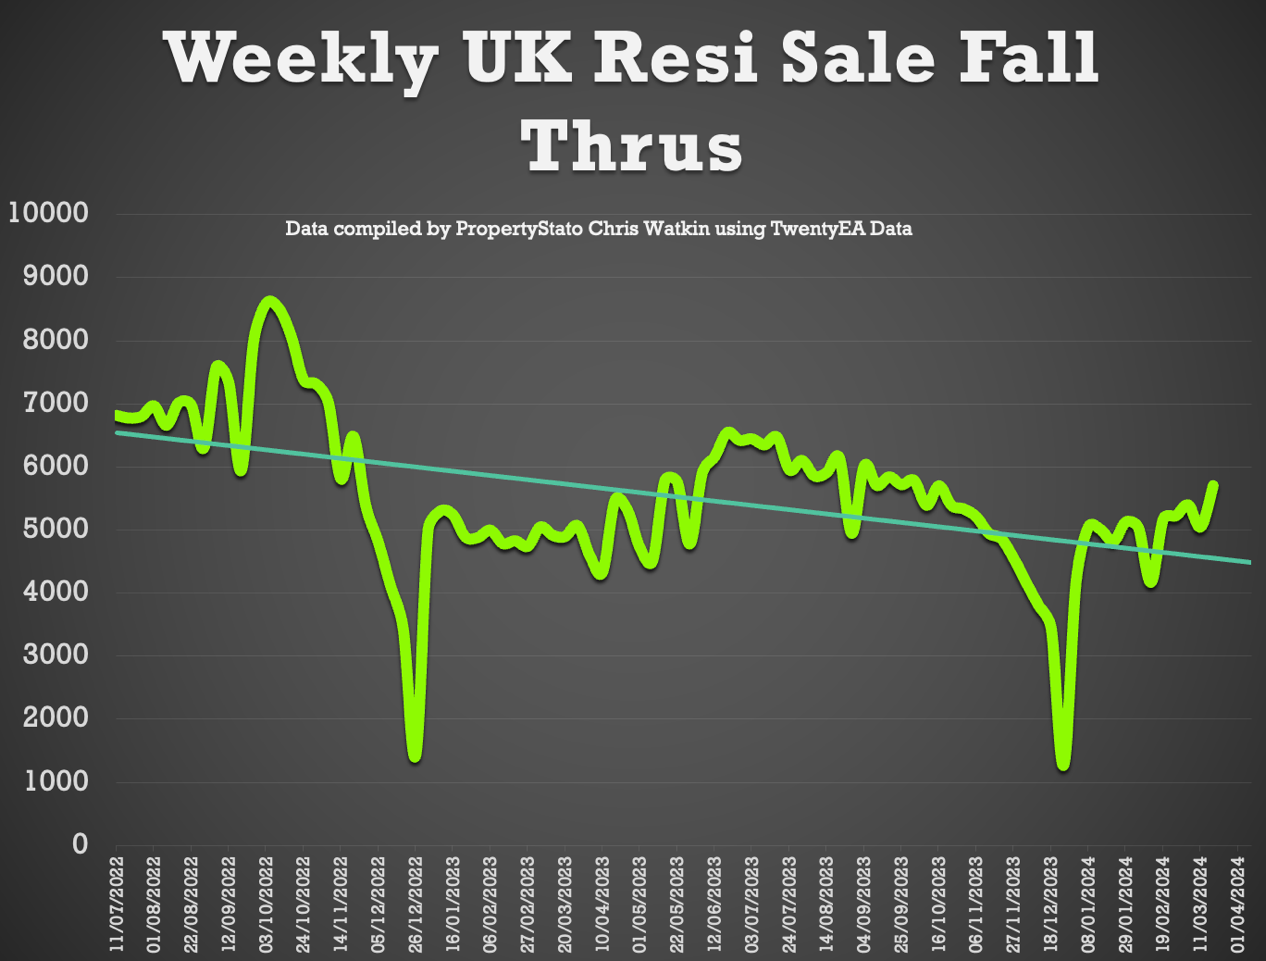
+ Sale Fall Throughs: Increased slightly this week to 5,702, just above the 2023 whole of year average of 5,382 weekly fall-throughs and 7,590 weekly sale fall thrus in two months after there Truss’onomics Budget in Q4 2022.
+ Sale Fall Through Rate: Increased slightly from last week, to 21.57% for the week (8 years average is 24.8%)
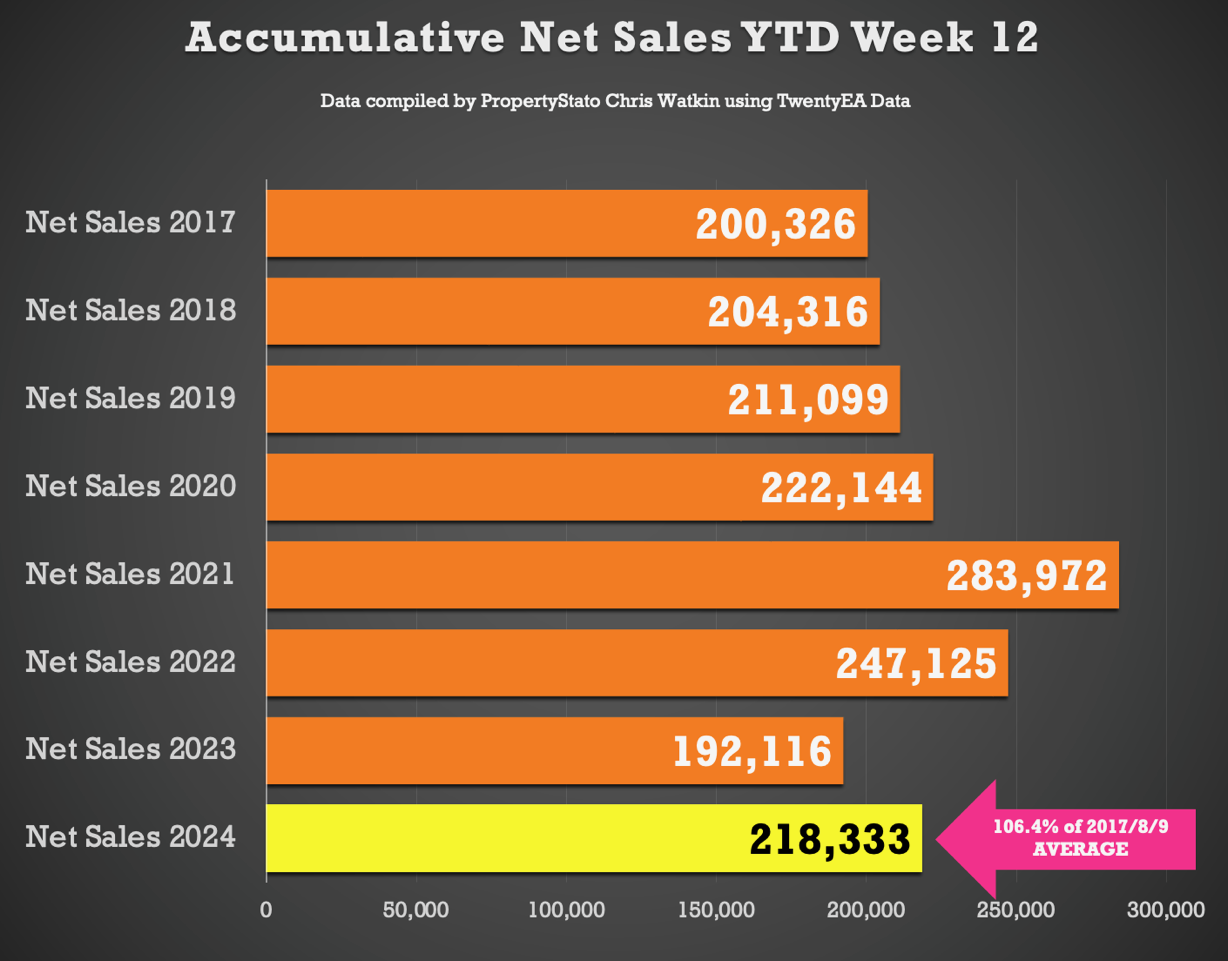
+ Net Sales similar to last weeks figures at 20,733, above the 17/18/19 average of 19,555 for Week 12.
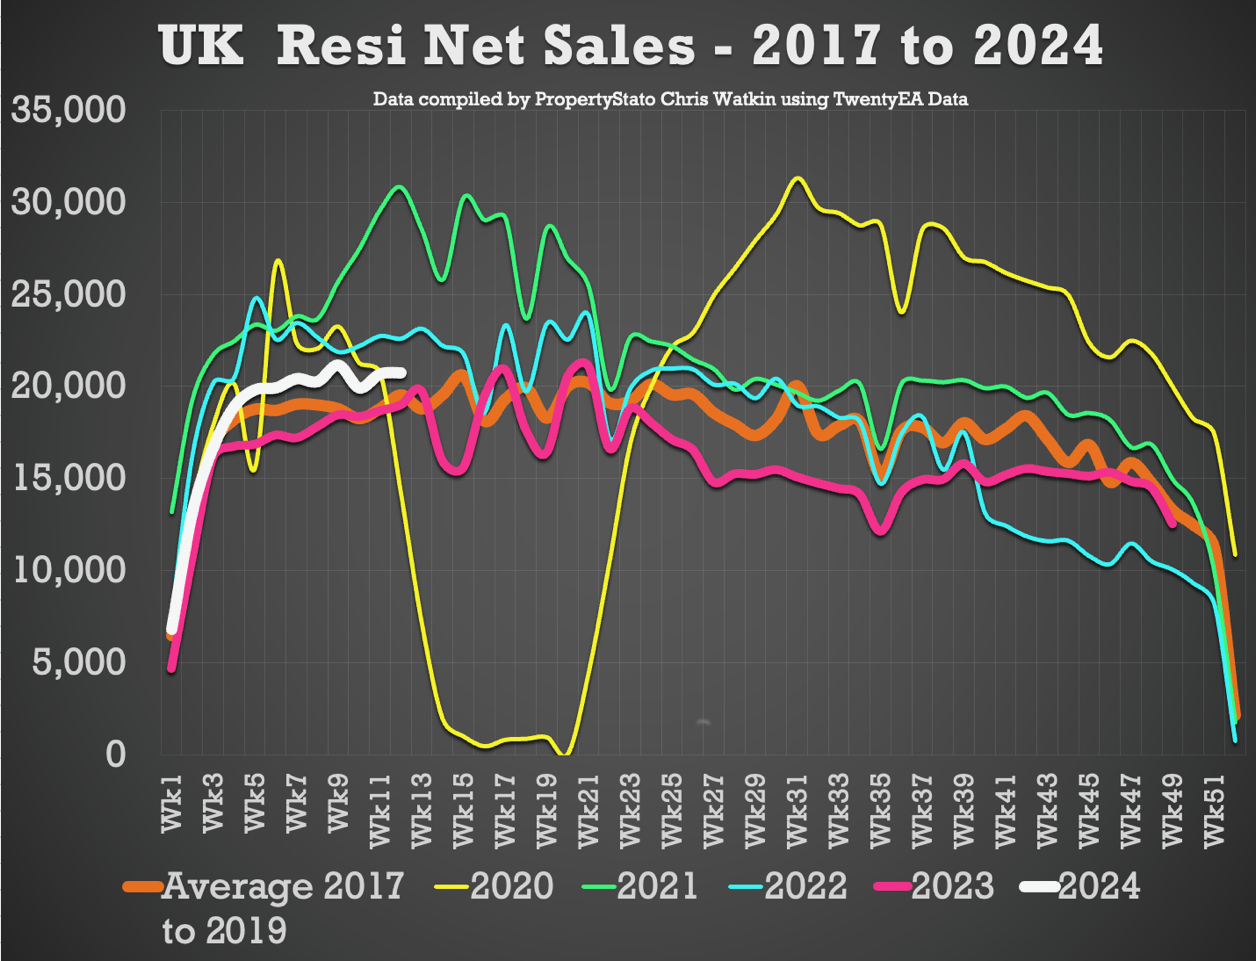
+ Accumulative Net Sales YTD: The total stands at 218,333, 6.4% higher the 17/18/19 YTD Net sales average and 13.6% higher than the YTD figure for 2023 for Net Sales (2023 : 192,116).
+ Average Rents in the UK by region.
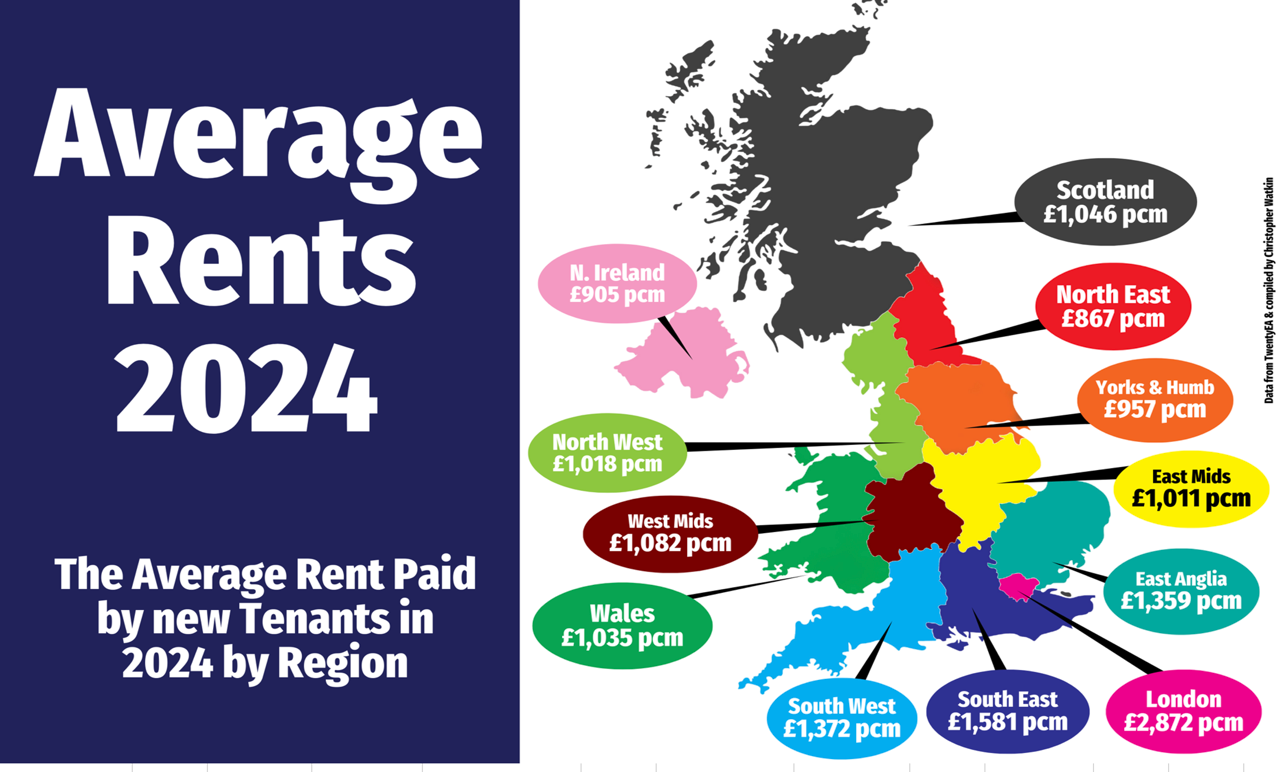
South East: £1,581pcm
South West: £1,372pcm
East Anglia: £1,359pcm
West Mids: £1,082pcm
Scotland: £1,046pcm
Wales: £1,035pcm
North West: £1,018pcm
East Mids: £1,011pcm
Yorks & Humb: £957pcm
N. Ireland: £905pcm
North East: £867pcm
Local Focus
This week’s local focus is on Kensington


