

 The UK property market for the week ending Sunday, 10th March 2024 (Week 10) continued on a good track with regard to transaction levels and house prices achieved.
In this week’s UK Property Market Stats Show with Iain White, the headlines are as follows:
+ House Prices: Sale agreed homes in March have so far stood at £341/sq.ft (February £338.77/sq.ft & Jan ’24 to £331/sq.ft)
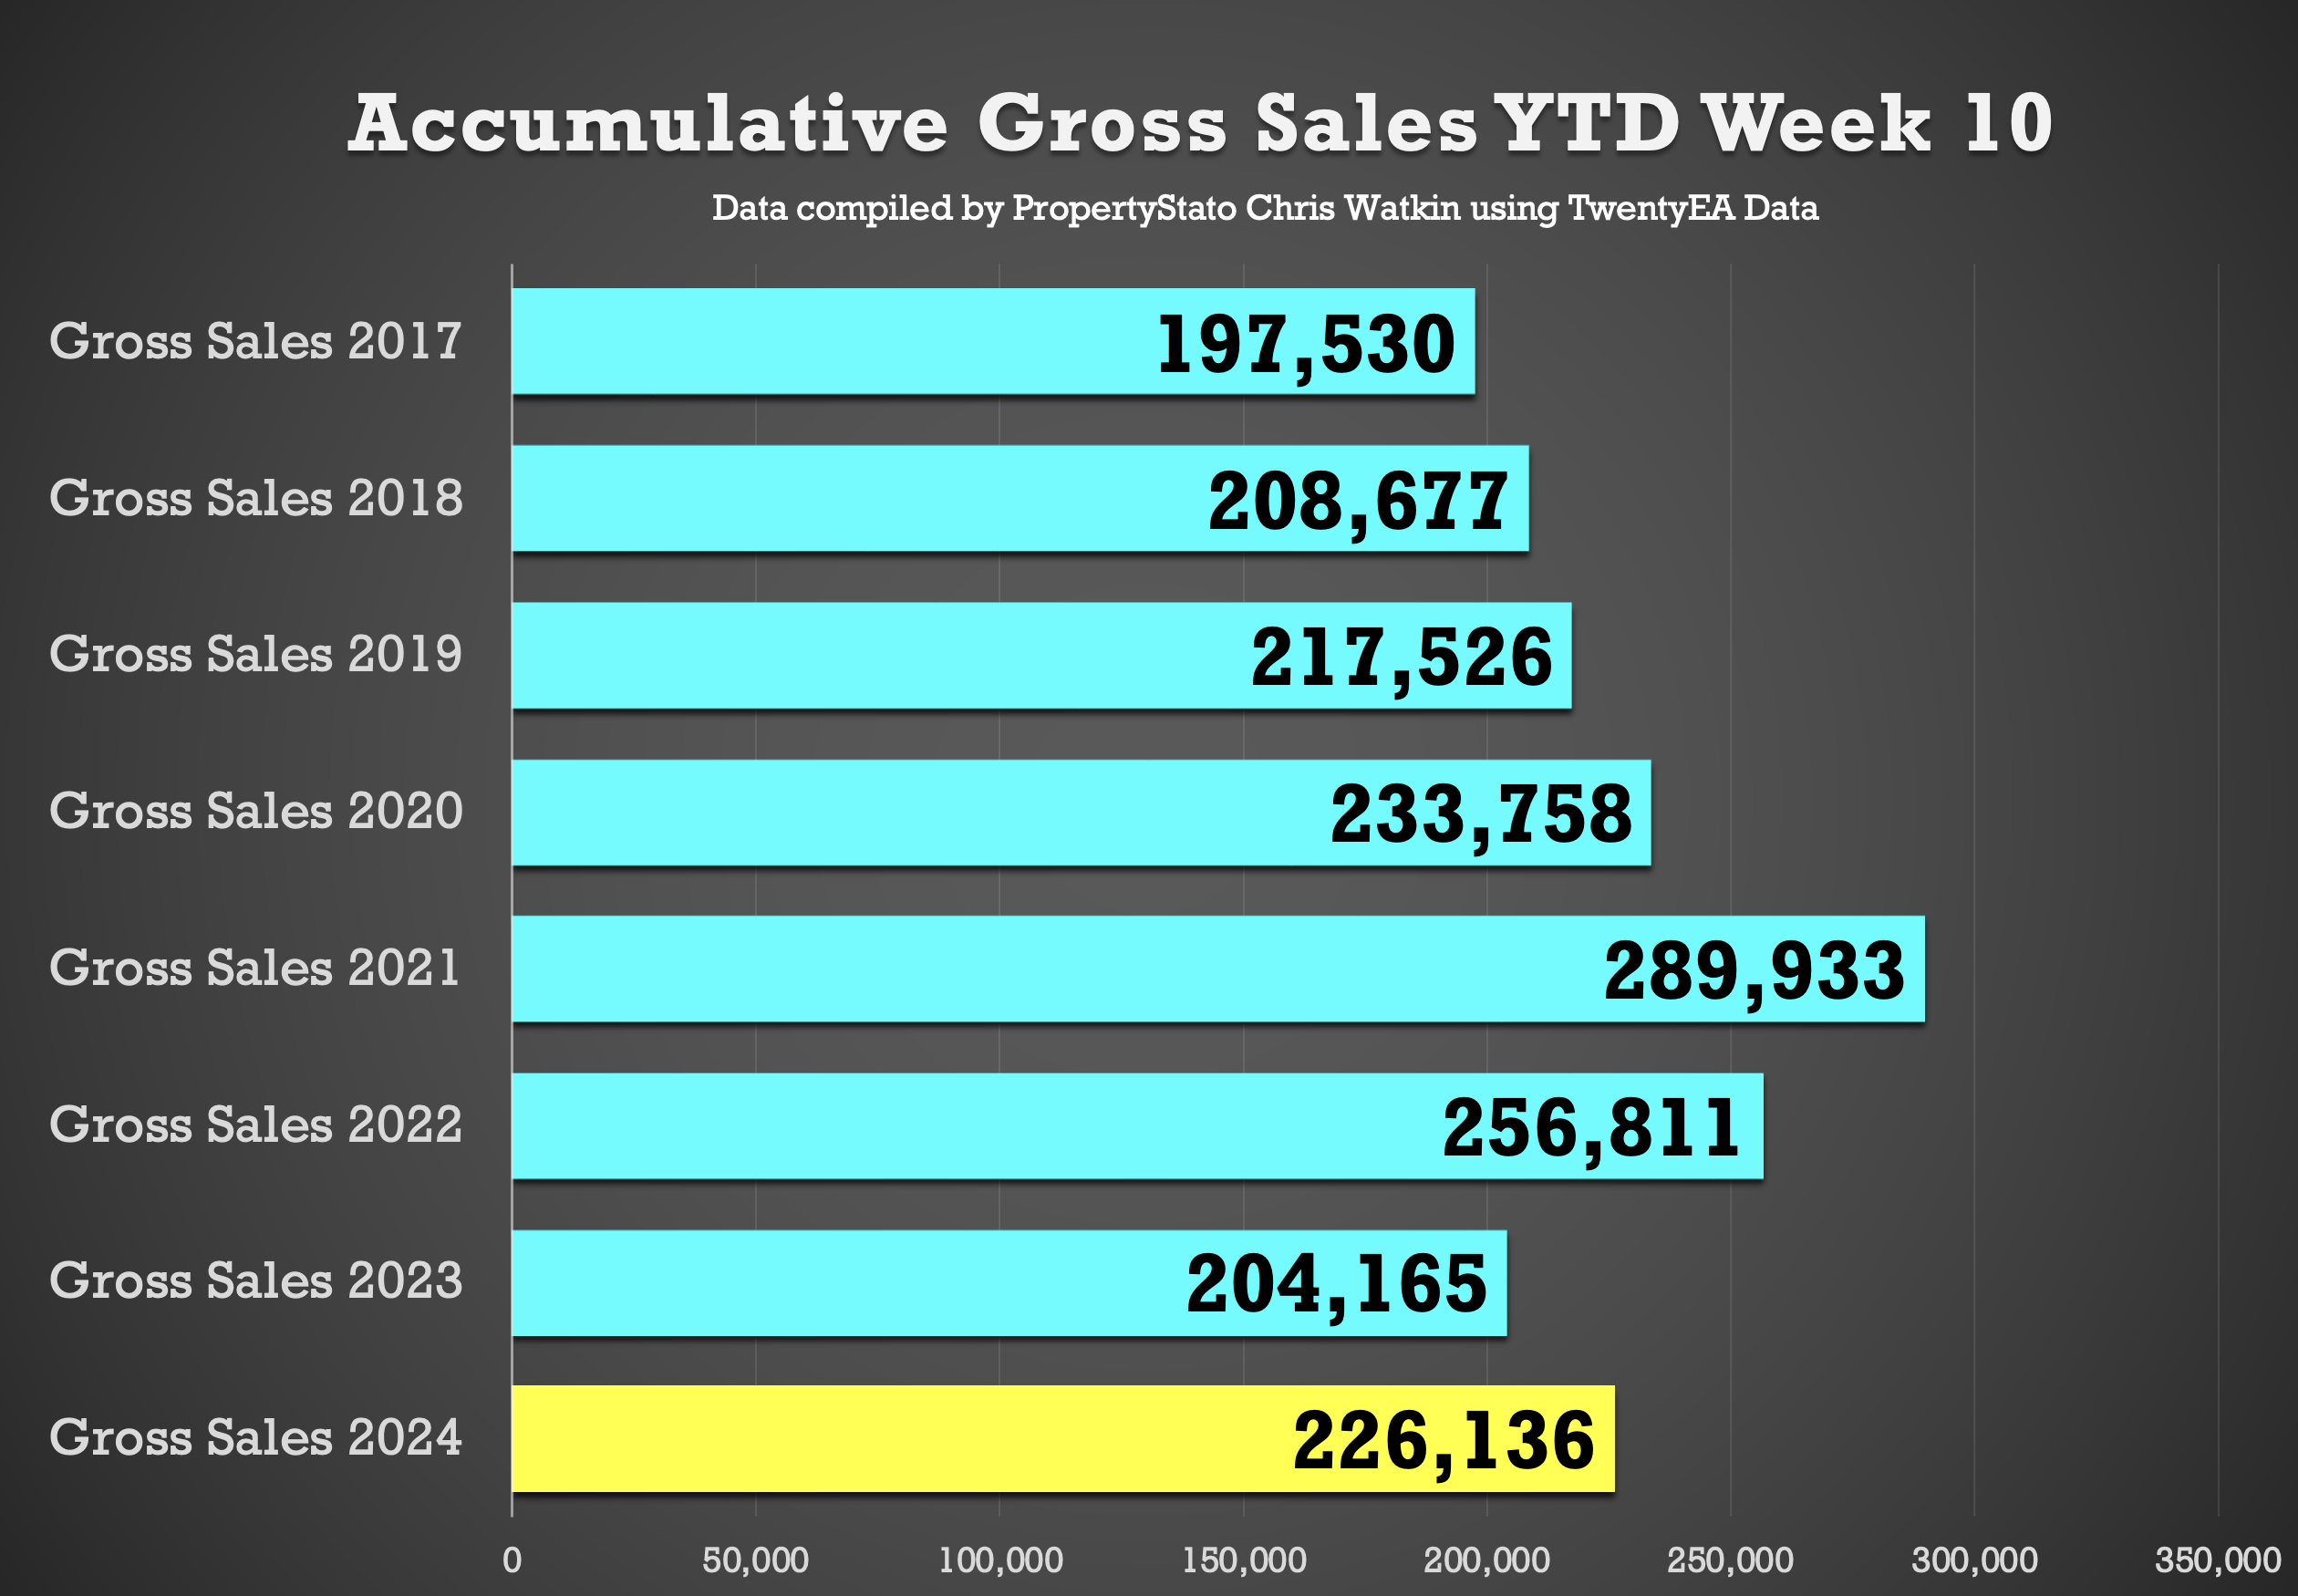
+ Total Gross Sales YTD are 10.8% than 2023 YTD levels & 8.8% higher than 2017/18/19 levels
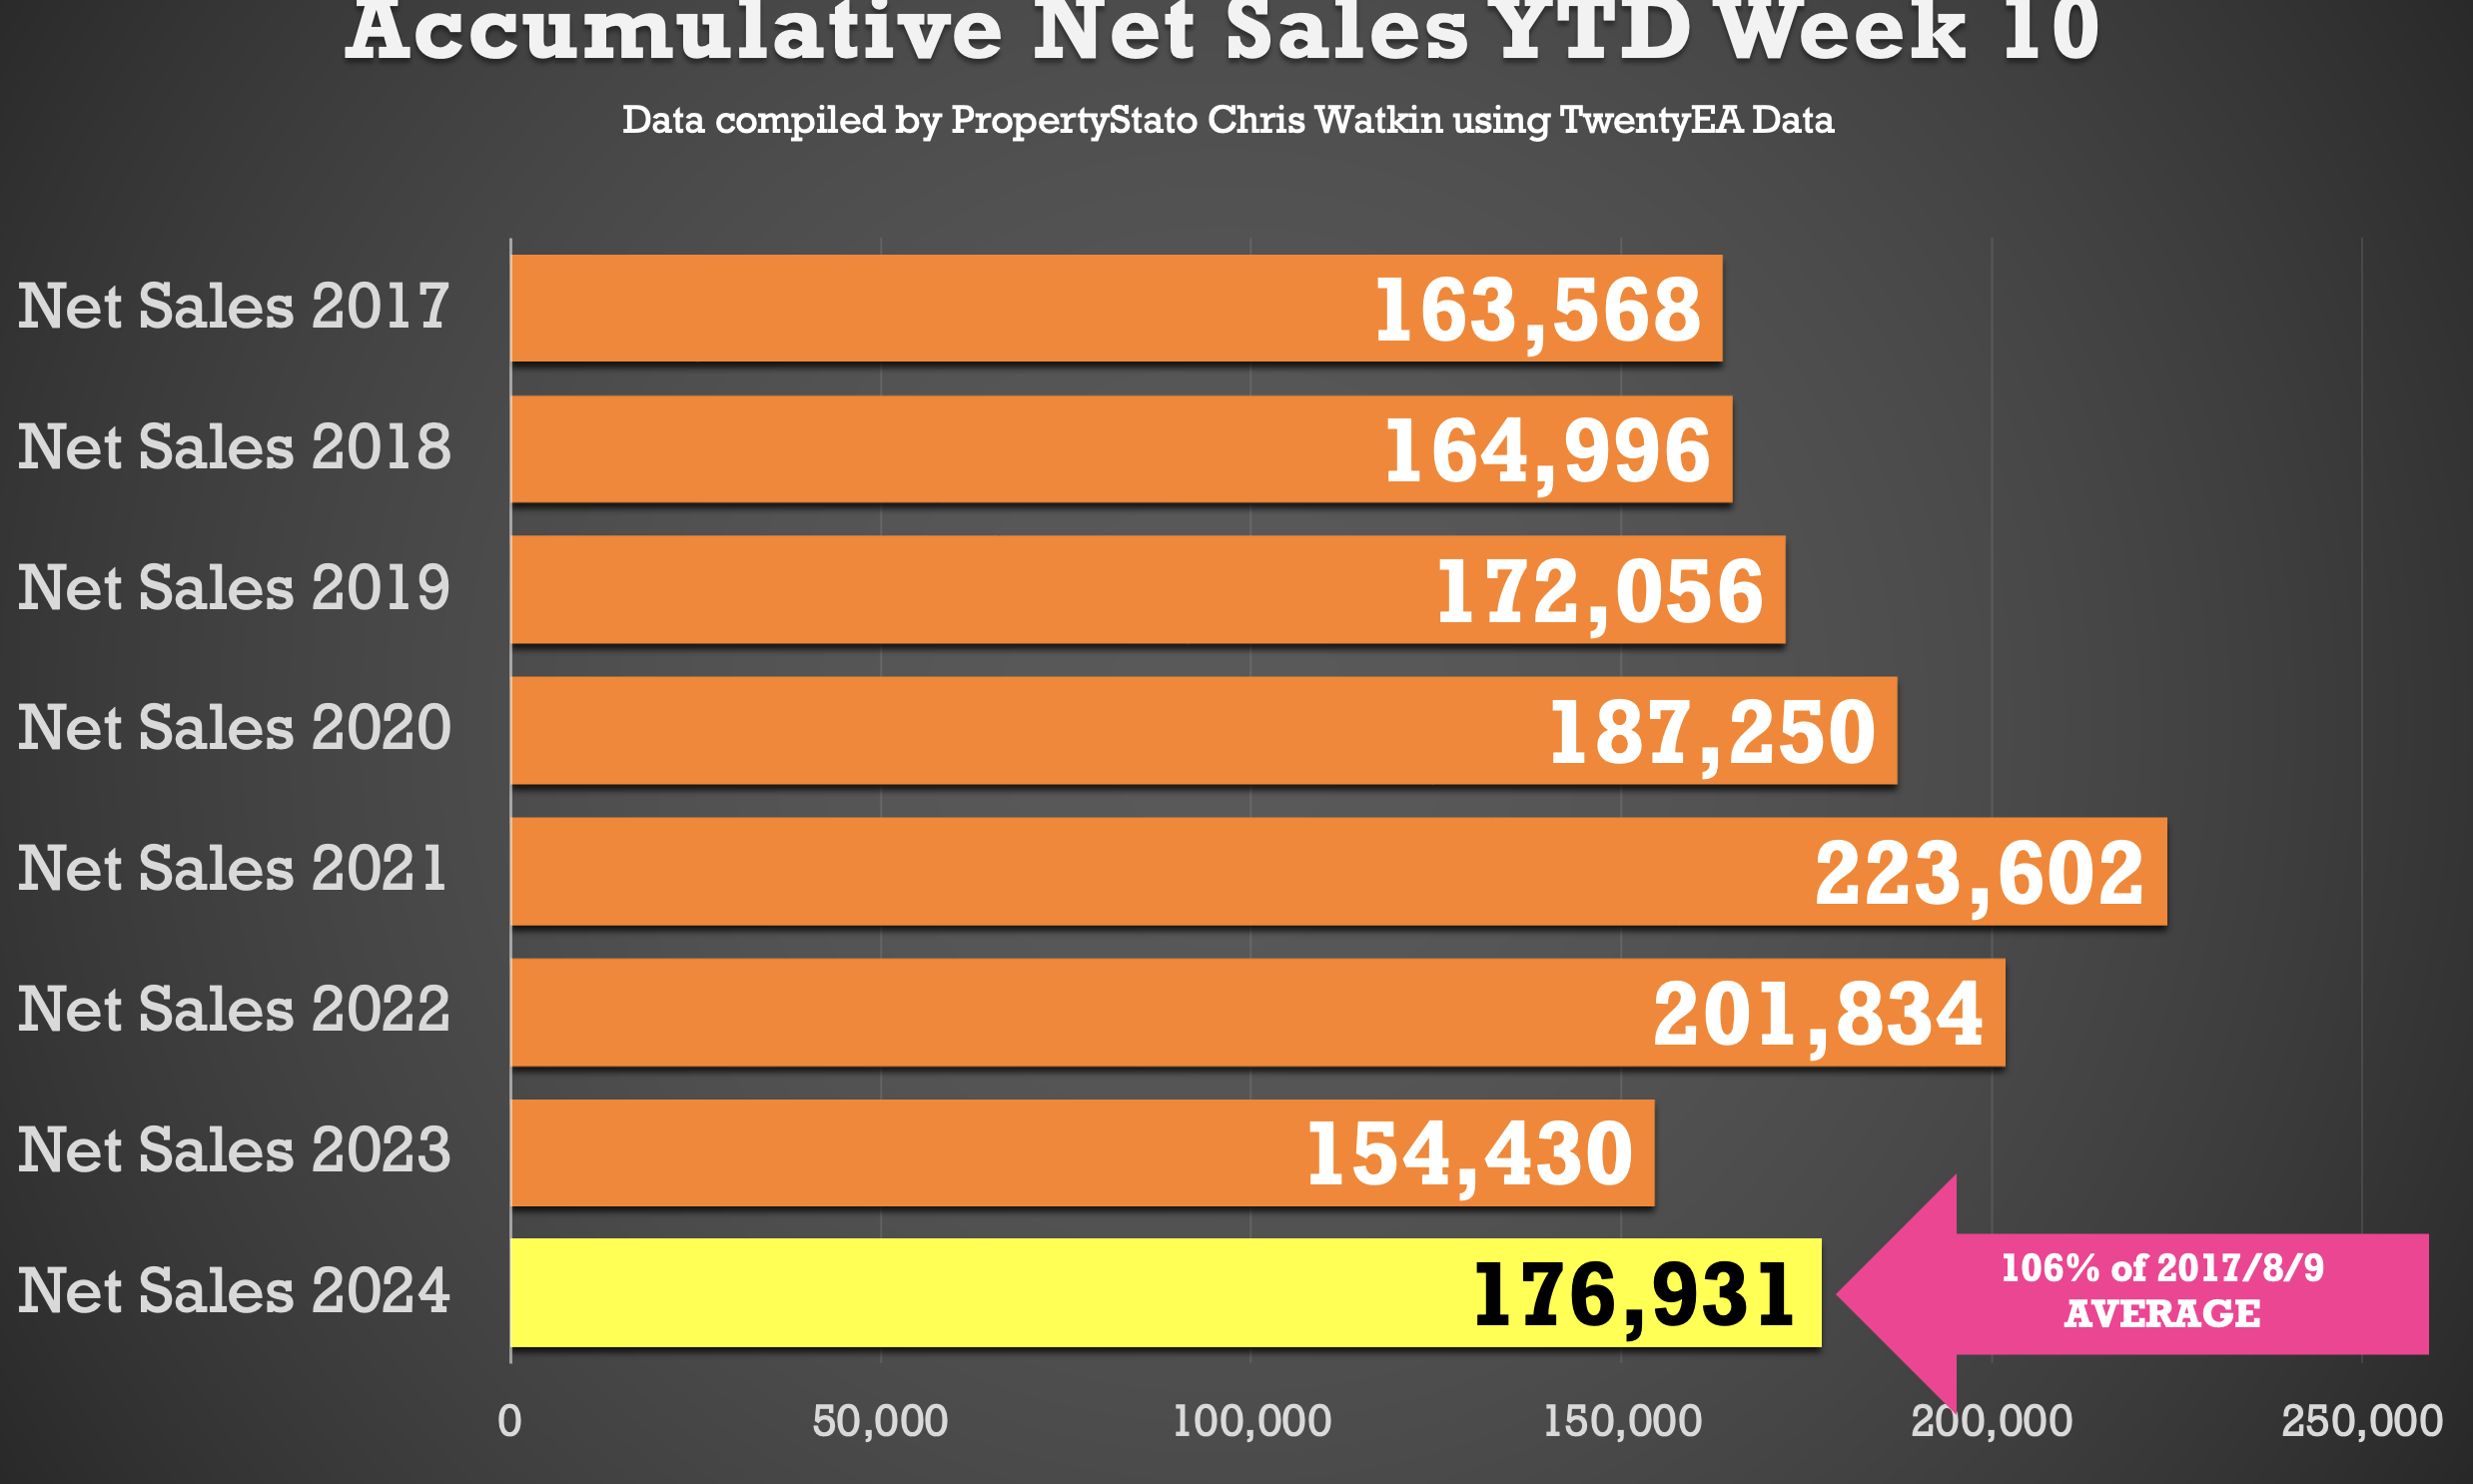
+ Net Sales last week 8.4% higher than Week 10 2023
Chris’s In-Depth Analysis (Week 10) :
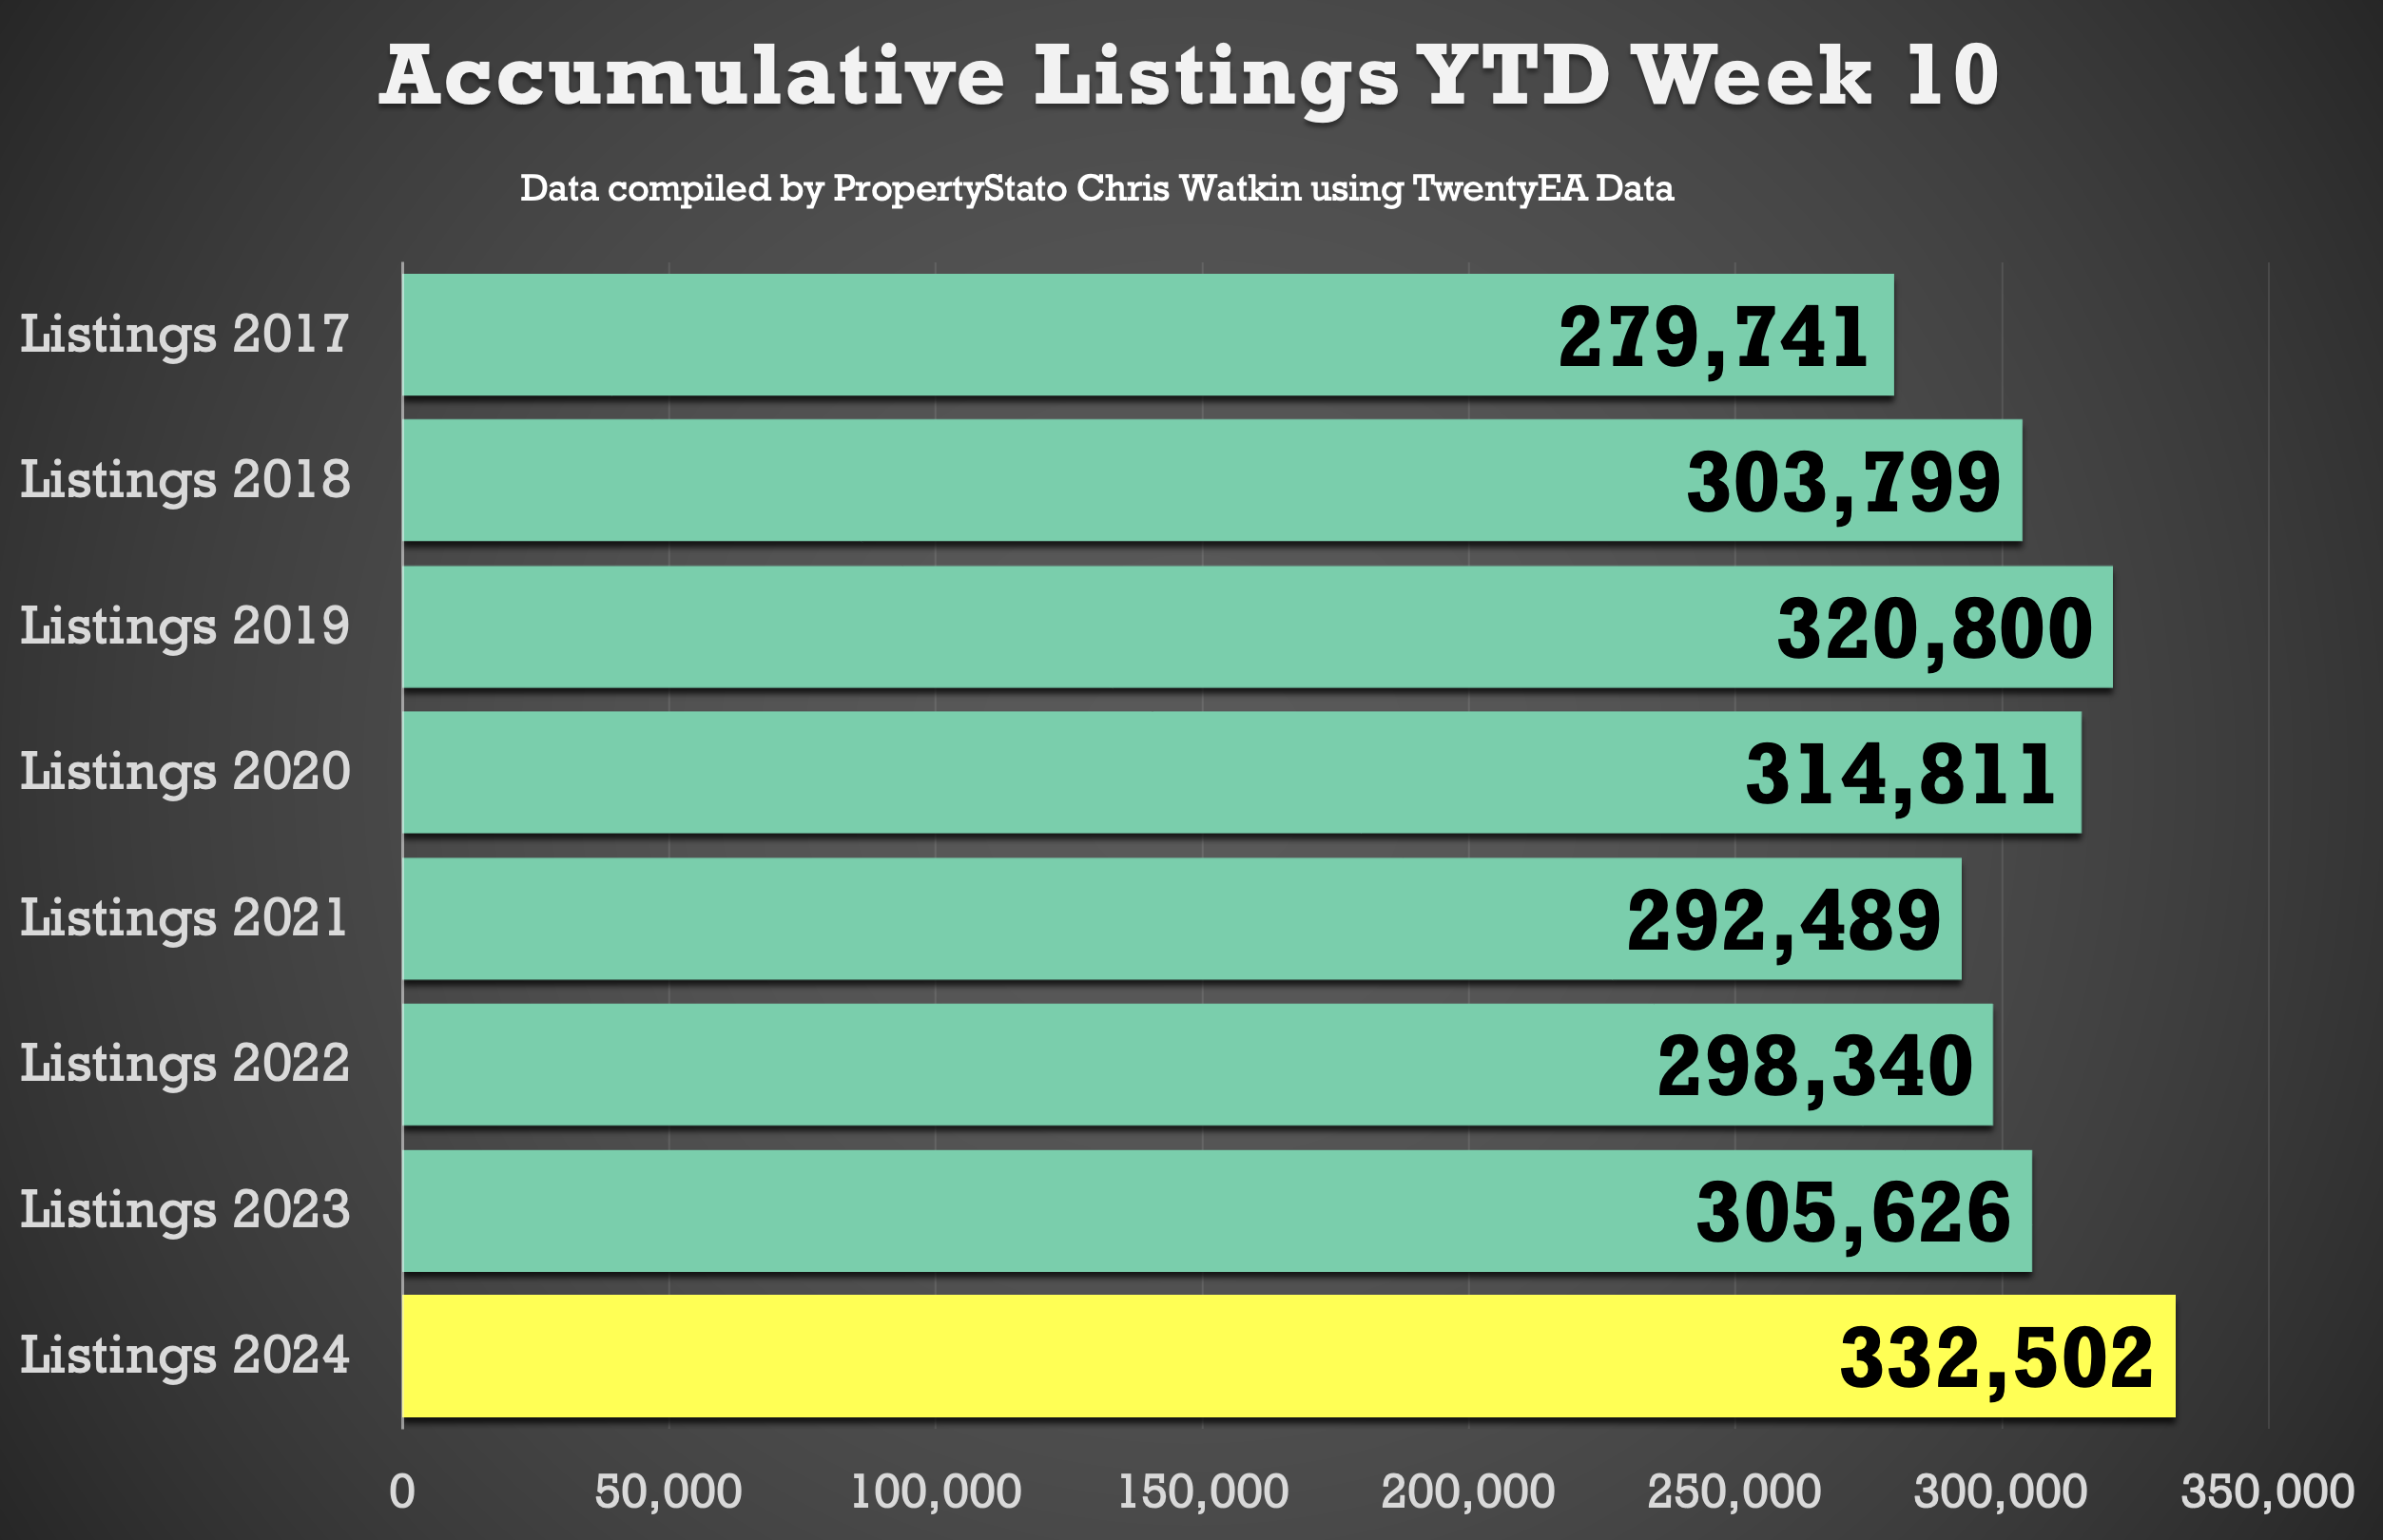
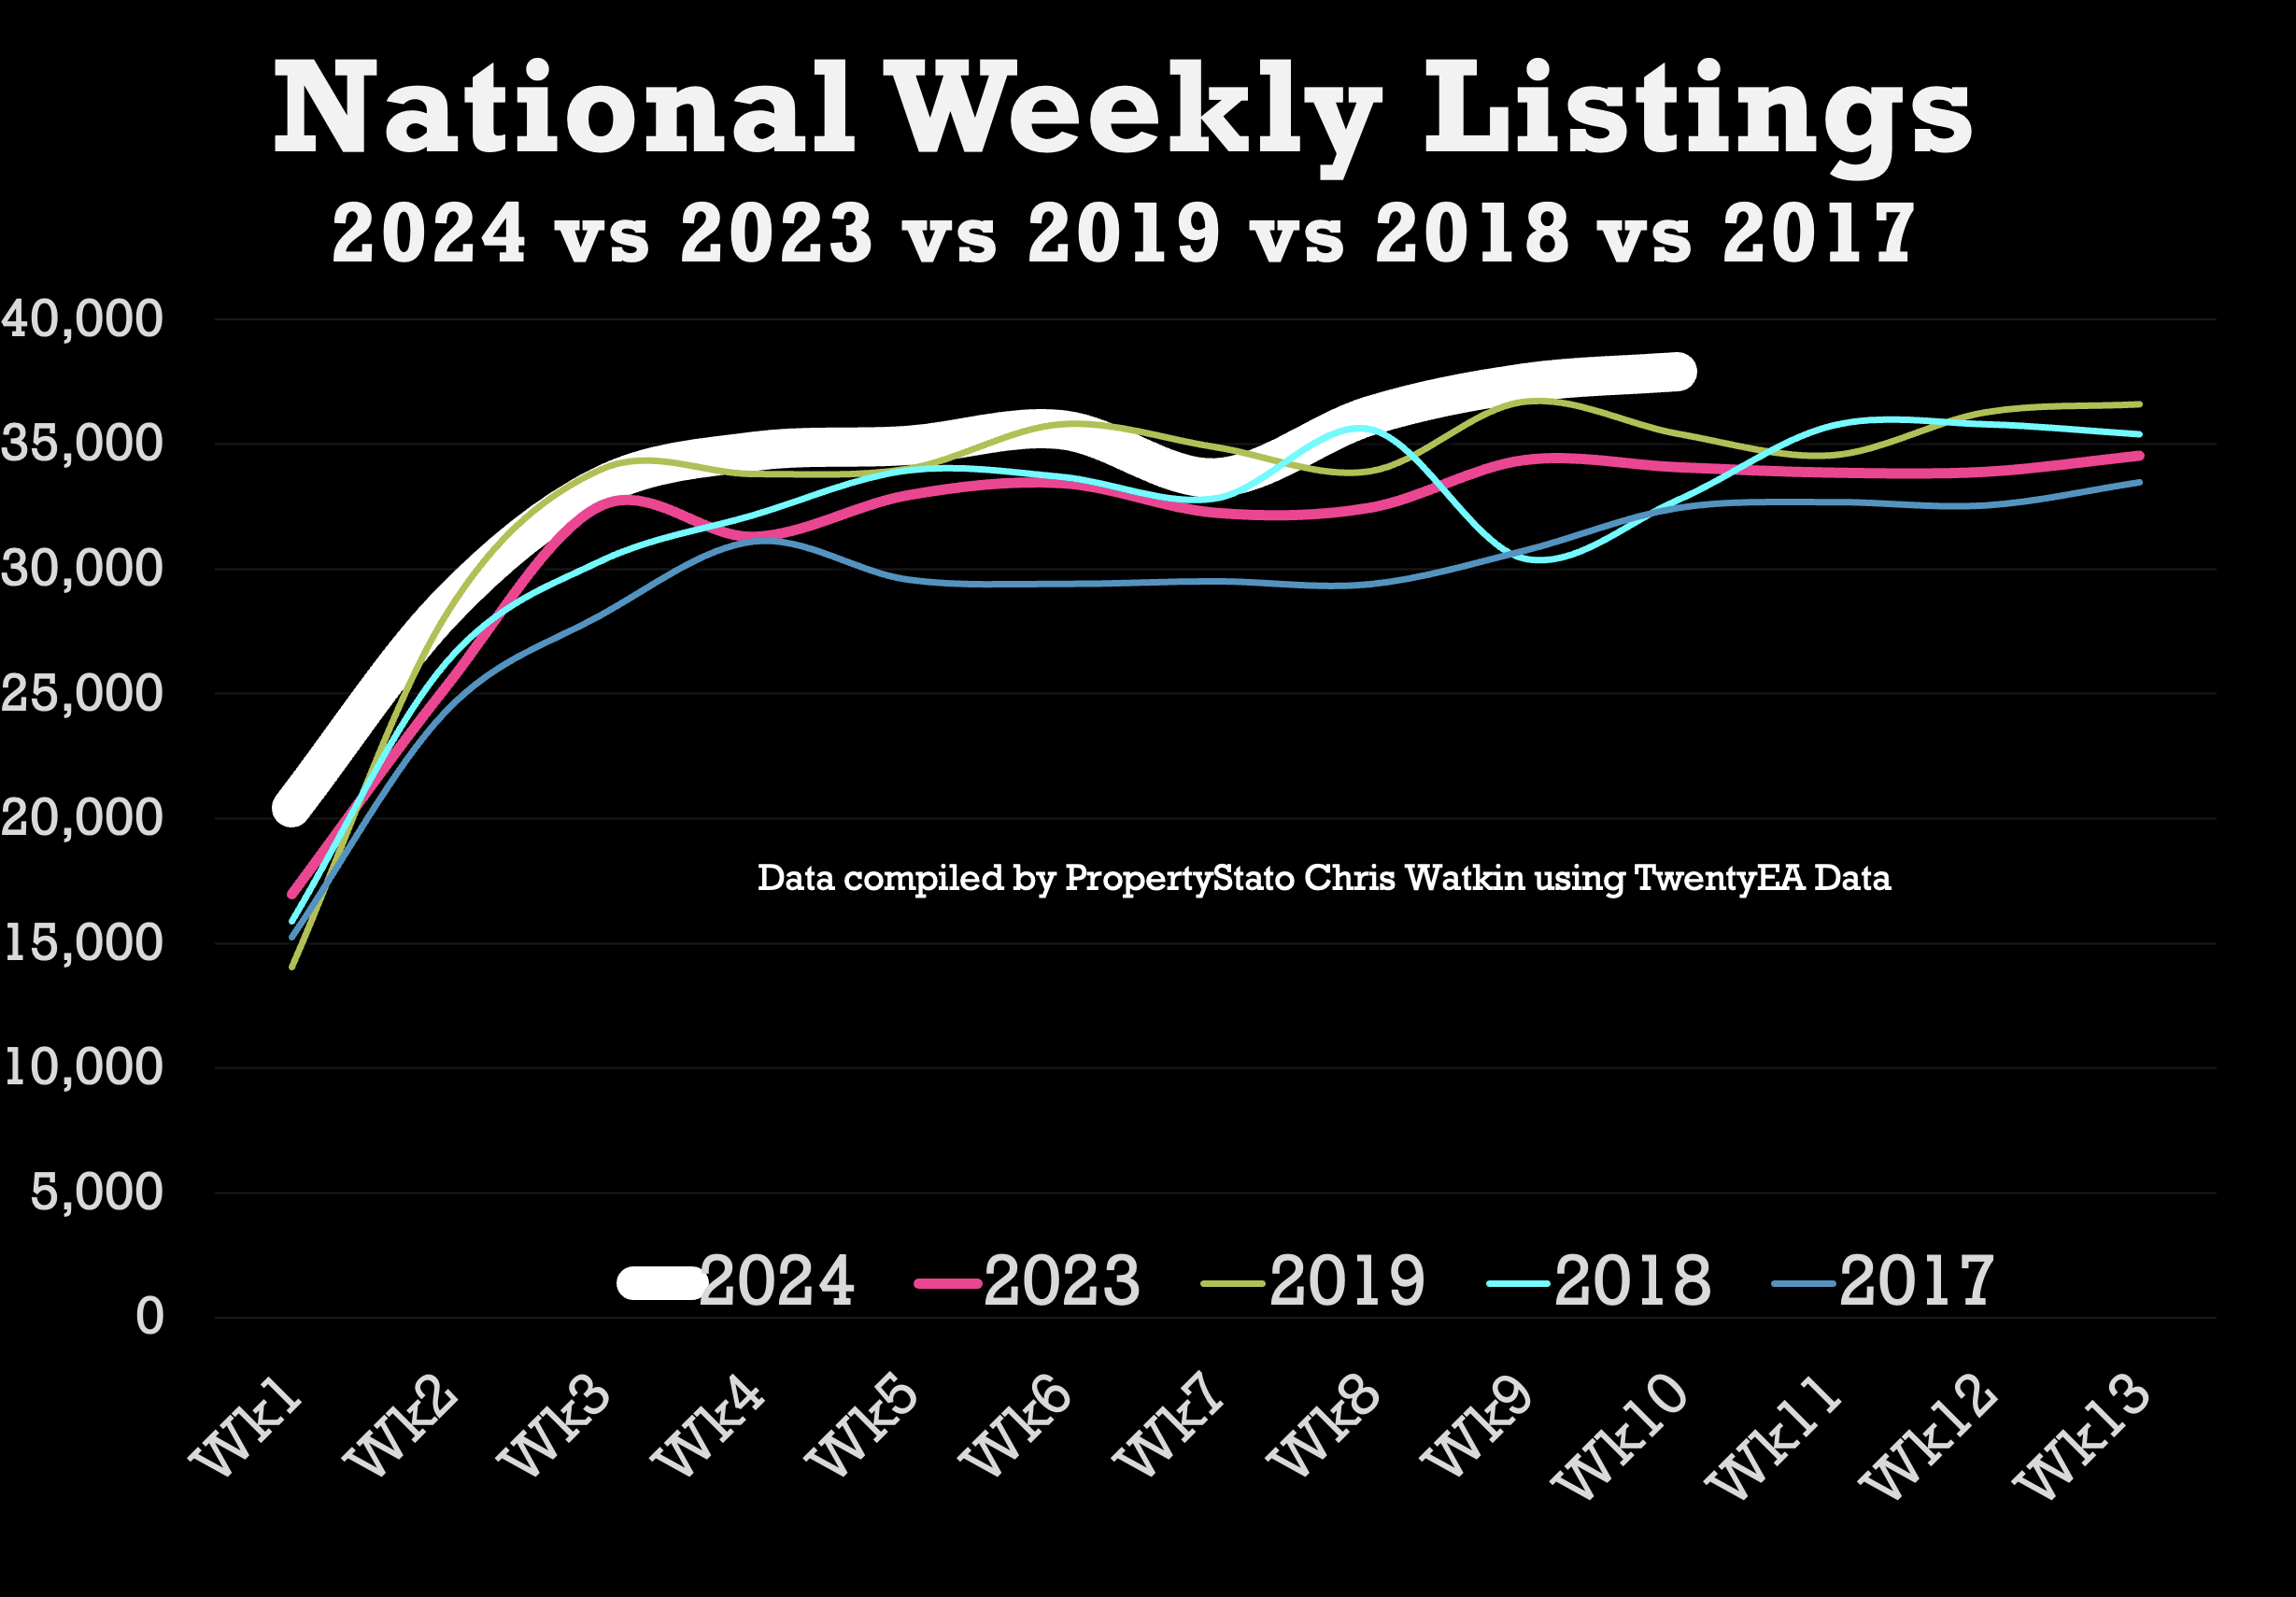
New Properties to Market: The UK saw 37,903 new listings. This year’s YTD listings stand at 332,502, 8.7% higher than the historical 8 year YTD average of 306,014 and 8.8% higher YTD 2023.
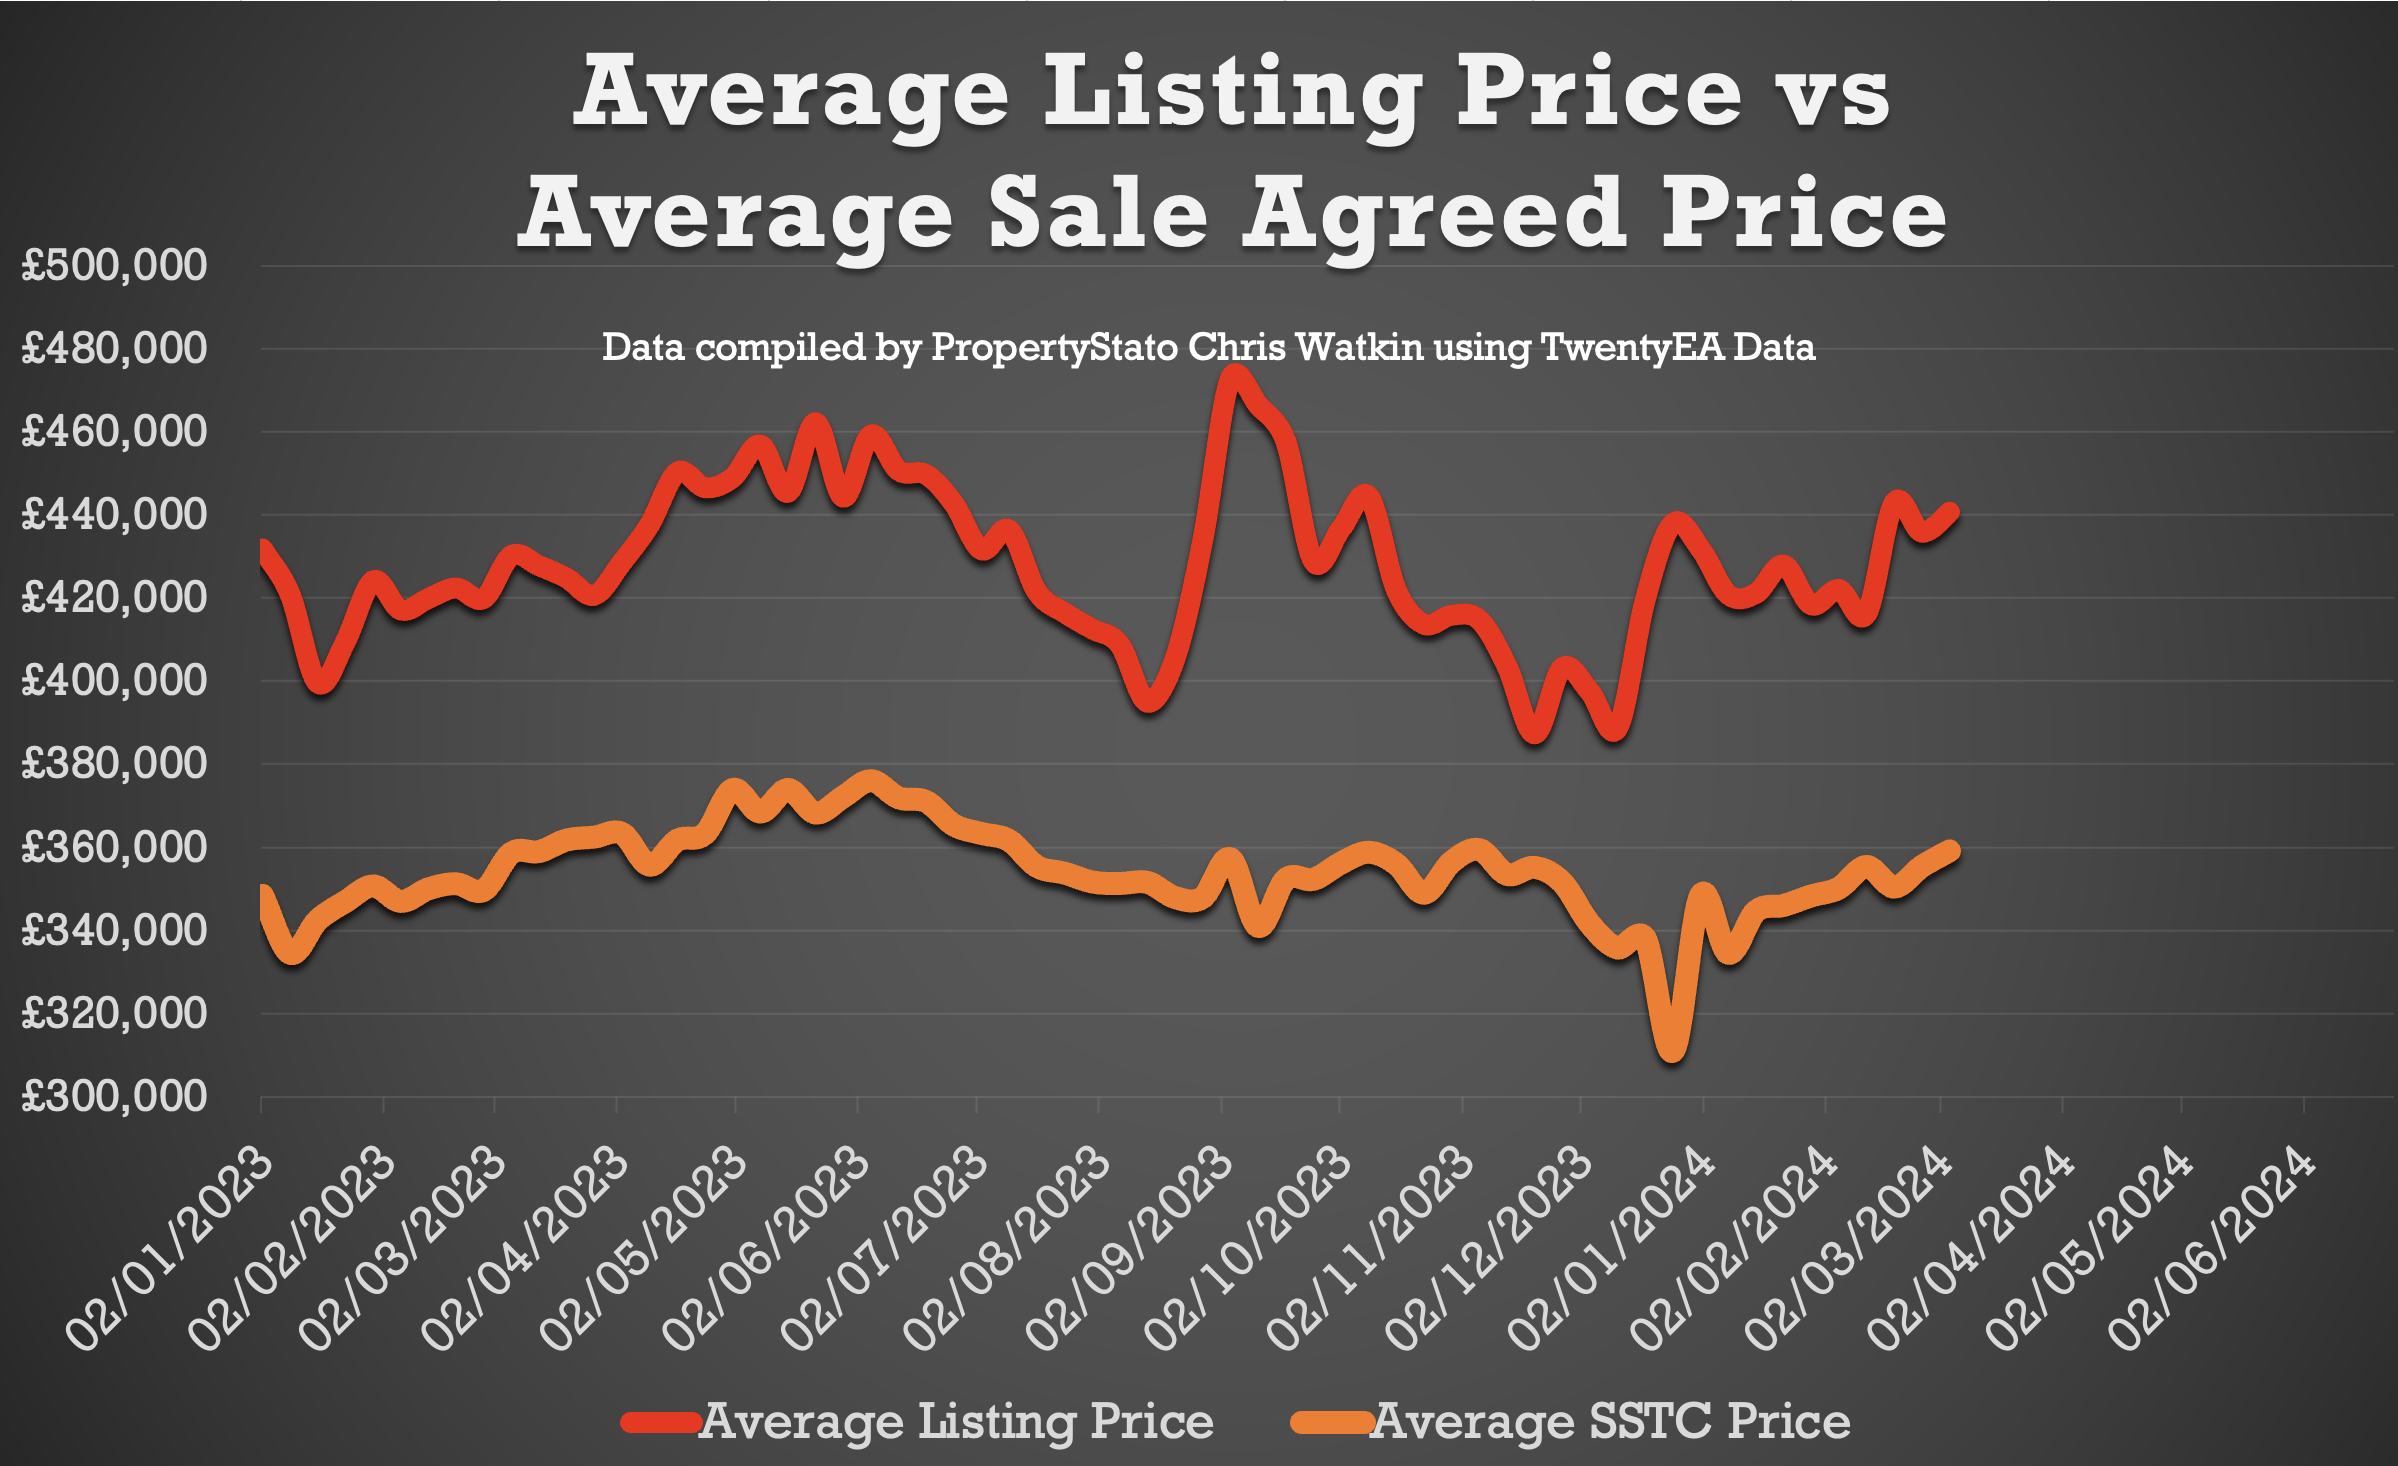
Average Listing Price: £440,688 .
Listing vs Sale Agreed Prices: The difference continues to hang around like bad smell at 23% mark. The long-term average is between 16 and 17%, so something this high continues to concern me.
Price Reductions: Last week, 19,623 properties saw price reductions, a significant number compared to the 8-year Week 10 average of 14,955. This means 1 in 8 properties each month are being reduced.
Average Asking Price for Reduced Properties: £398,297.
Gross Sales: Impressively, 25,313 properties were sold stc last week (a 3.9% drop from last week’s Gross Sales figures. However, Its was 23,417 for the same week 10 in 2023. Average for 17/18/19 was 22,719 for Week 10 – therefore, all things continue to look well.
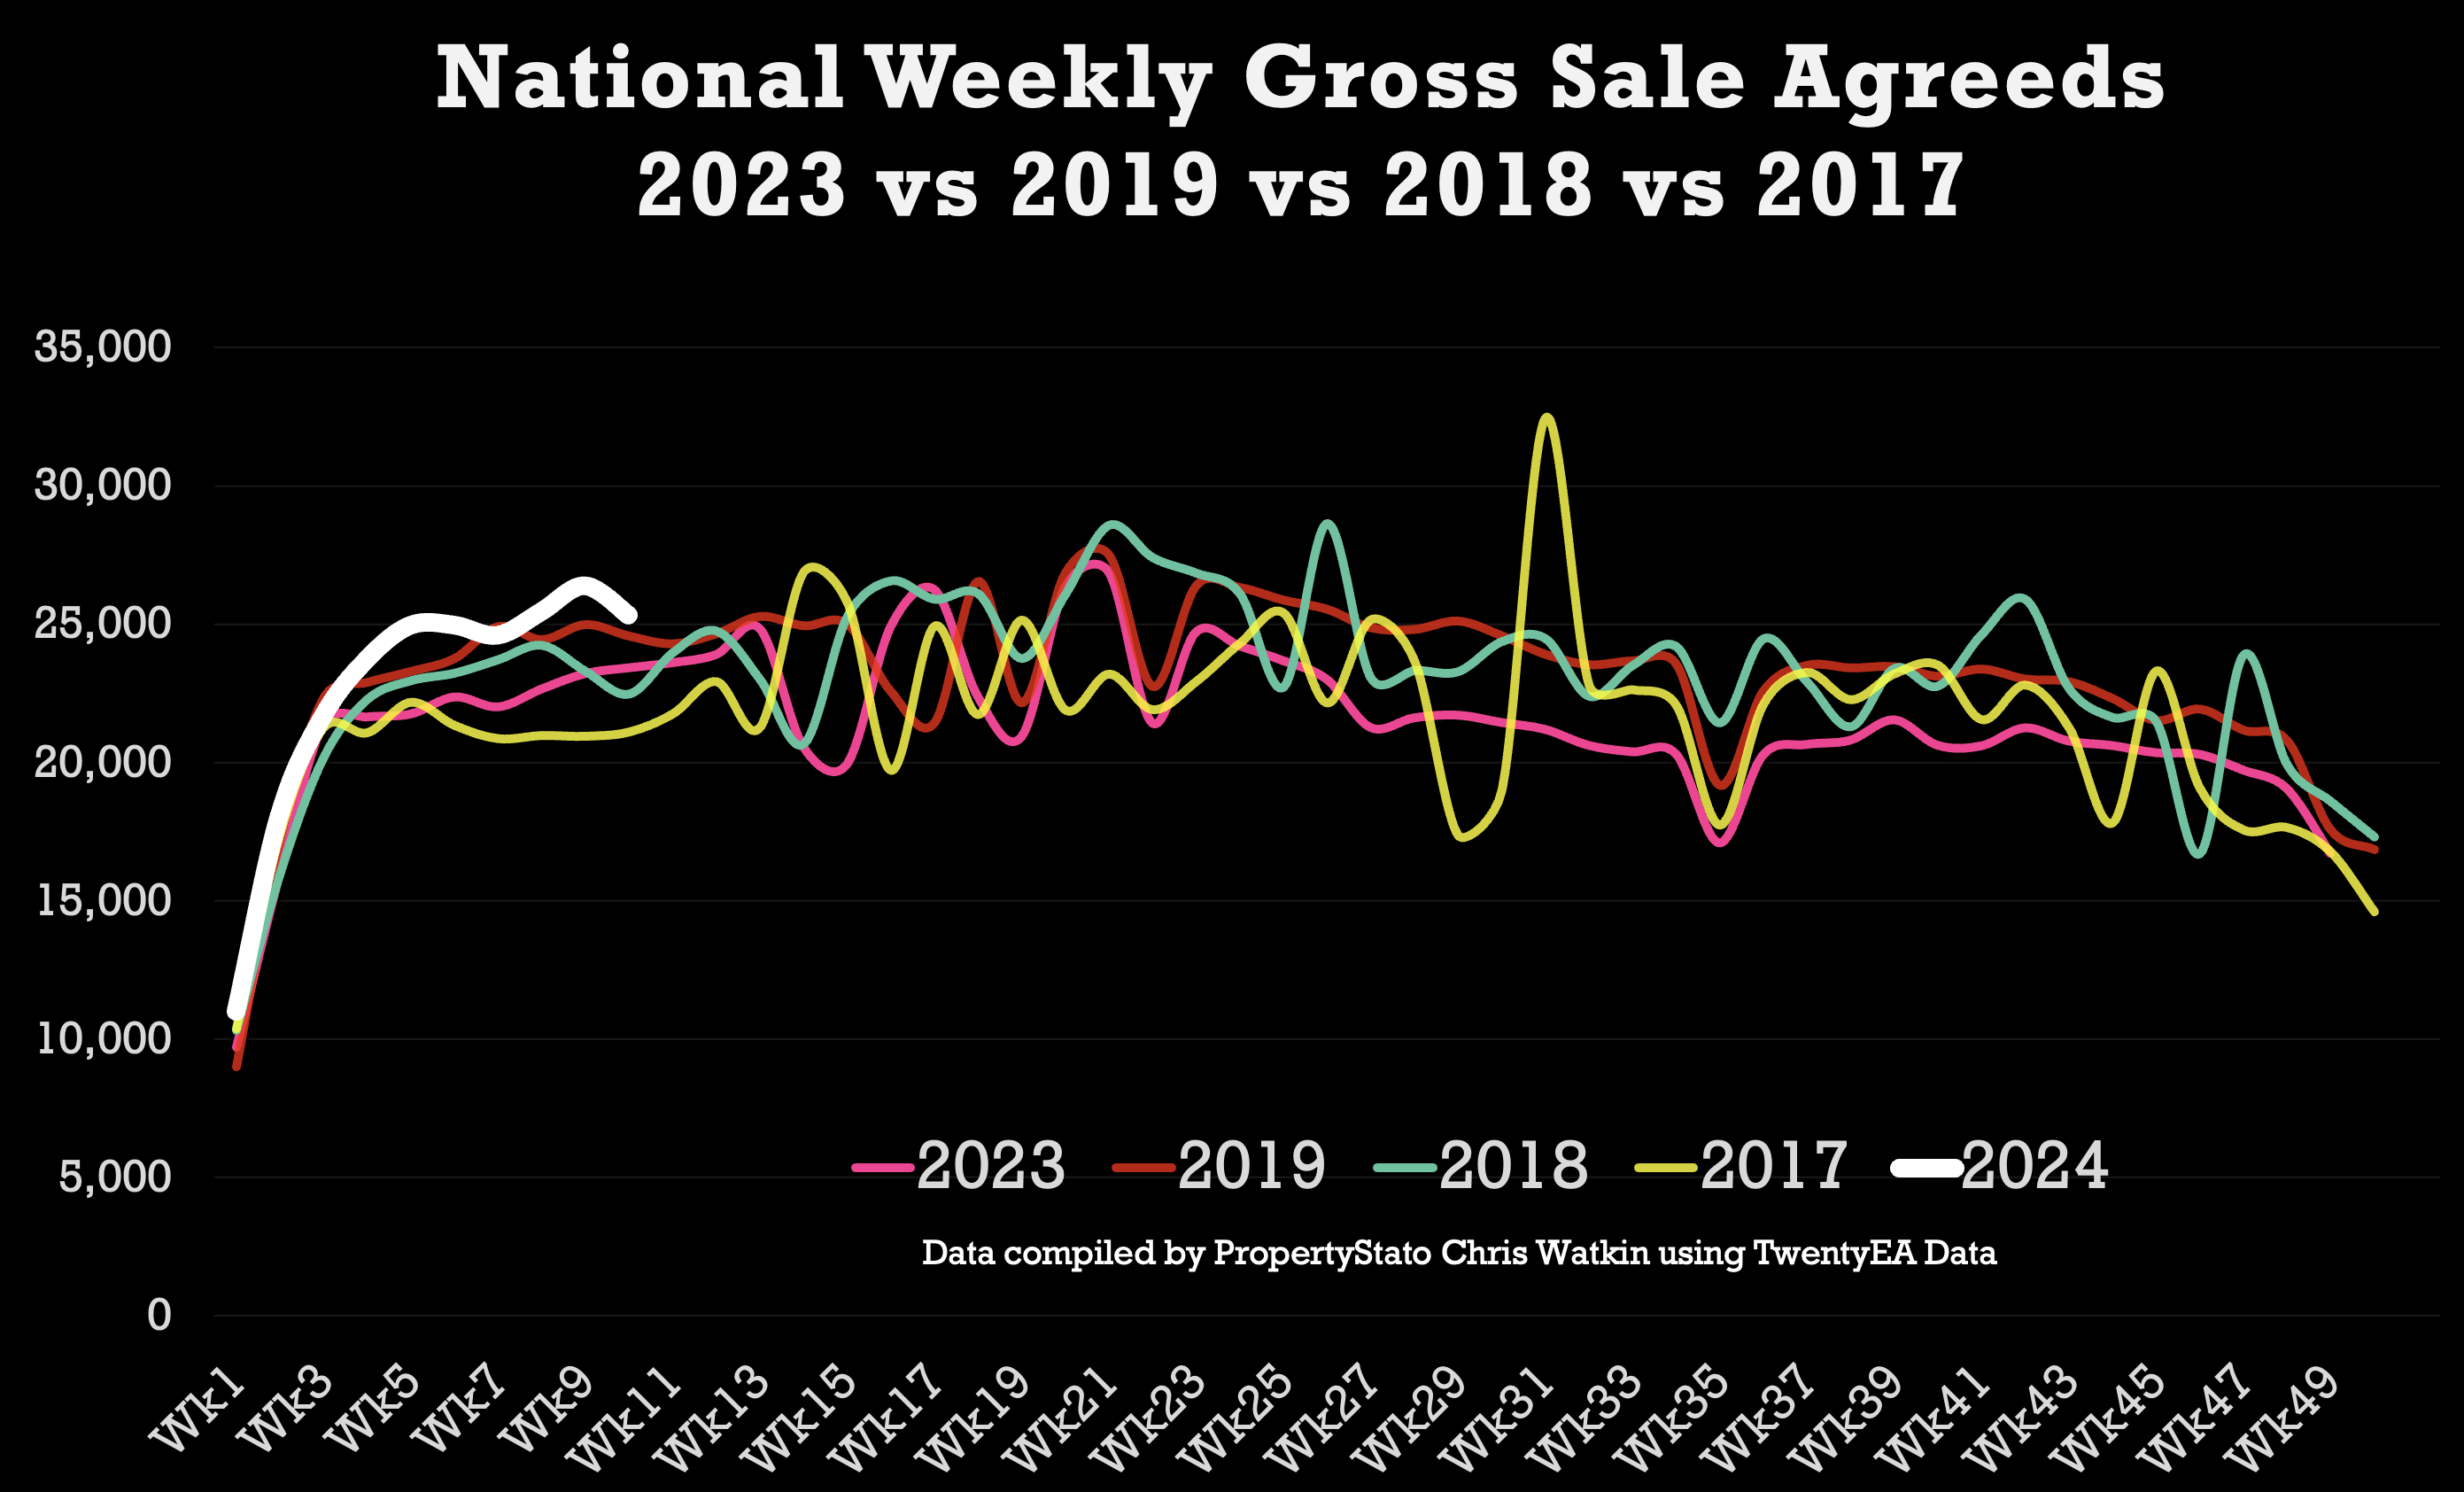
Accumulative Gross Sales YTD: The total stands at 226,136, exceeding the average of 207,911 from 17/18/19 and 204,165 in the same week 10 in 2023.
Average Asking Price of Sold STC Properties: Stubbornly staying in the mid/late £350k range for months at £359,155.
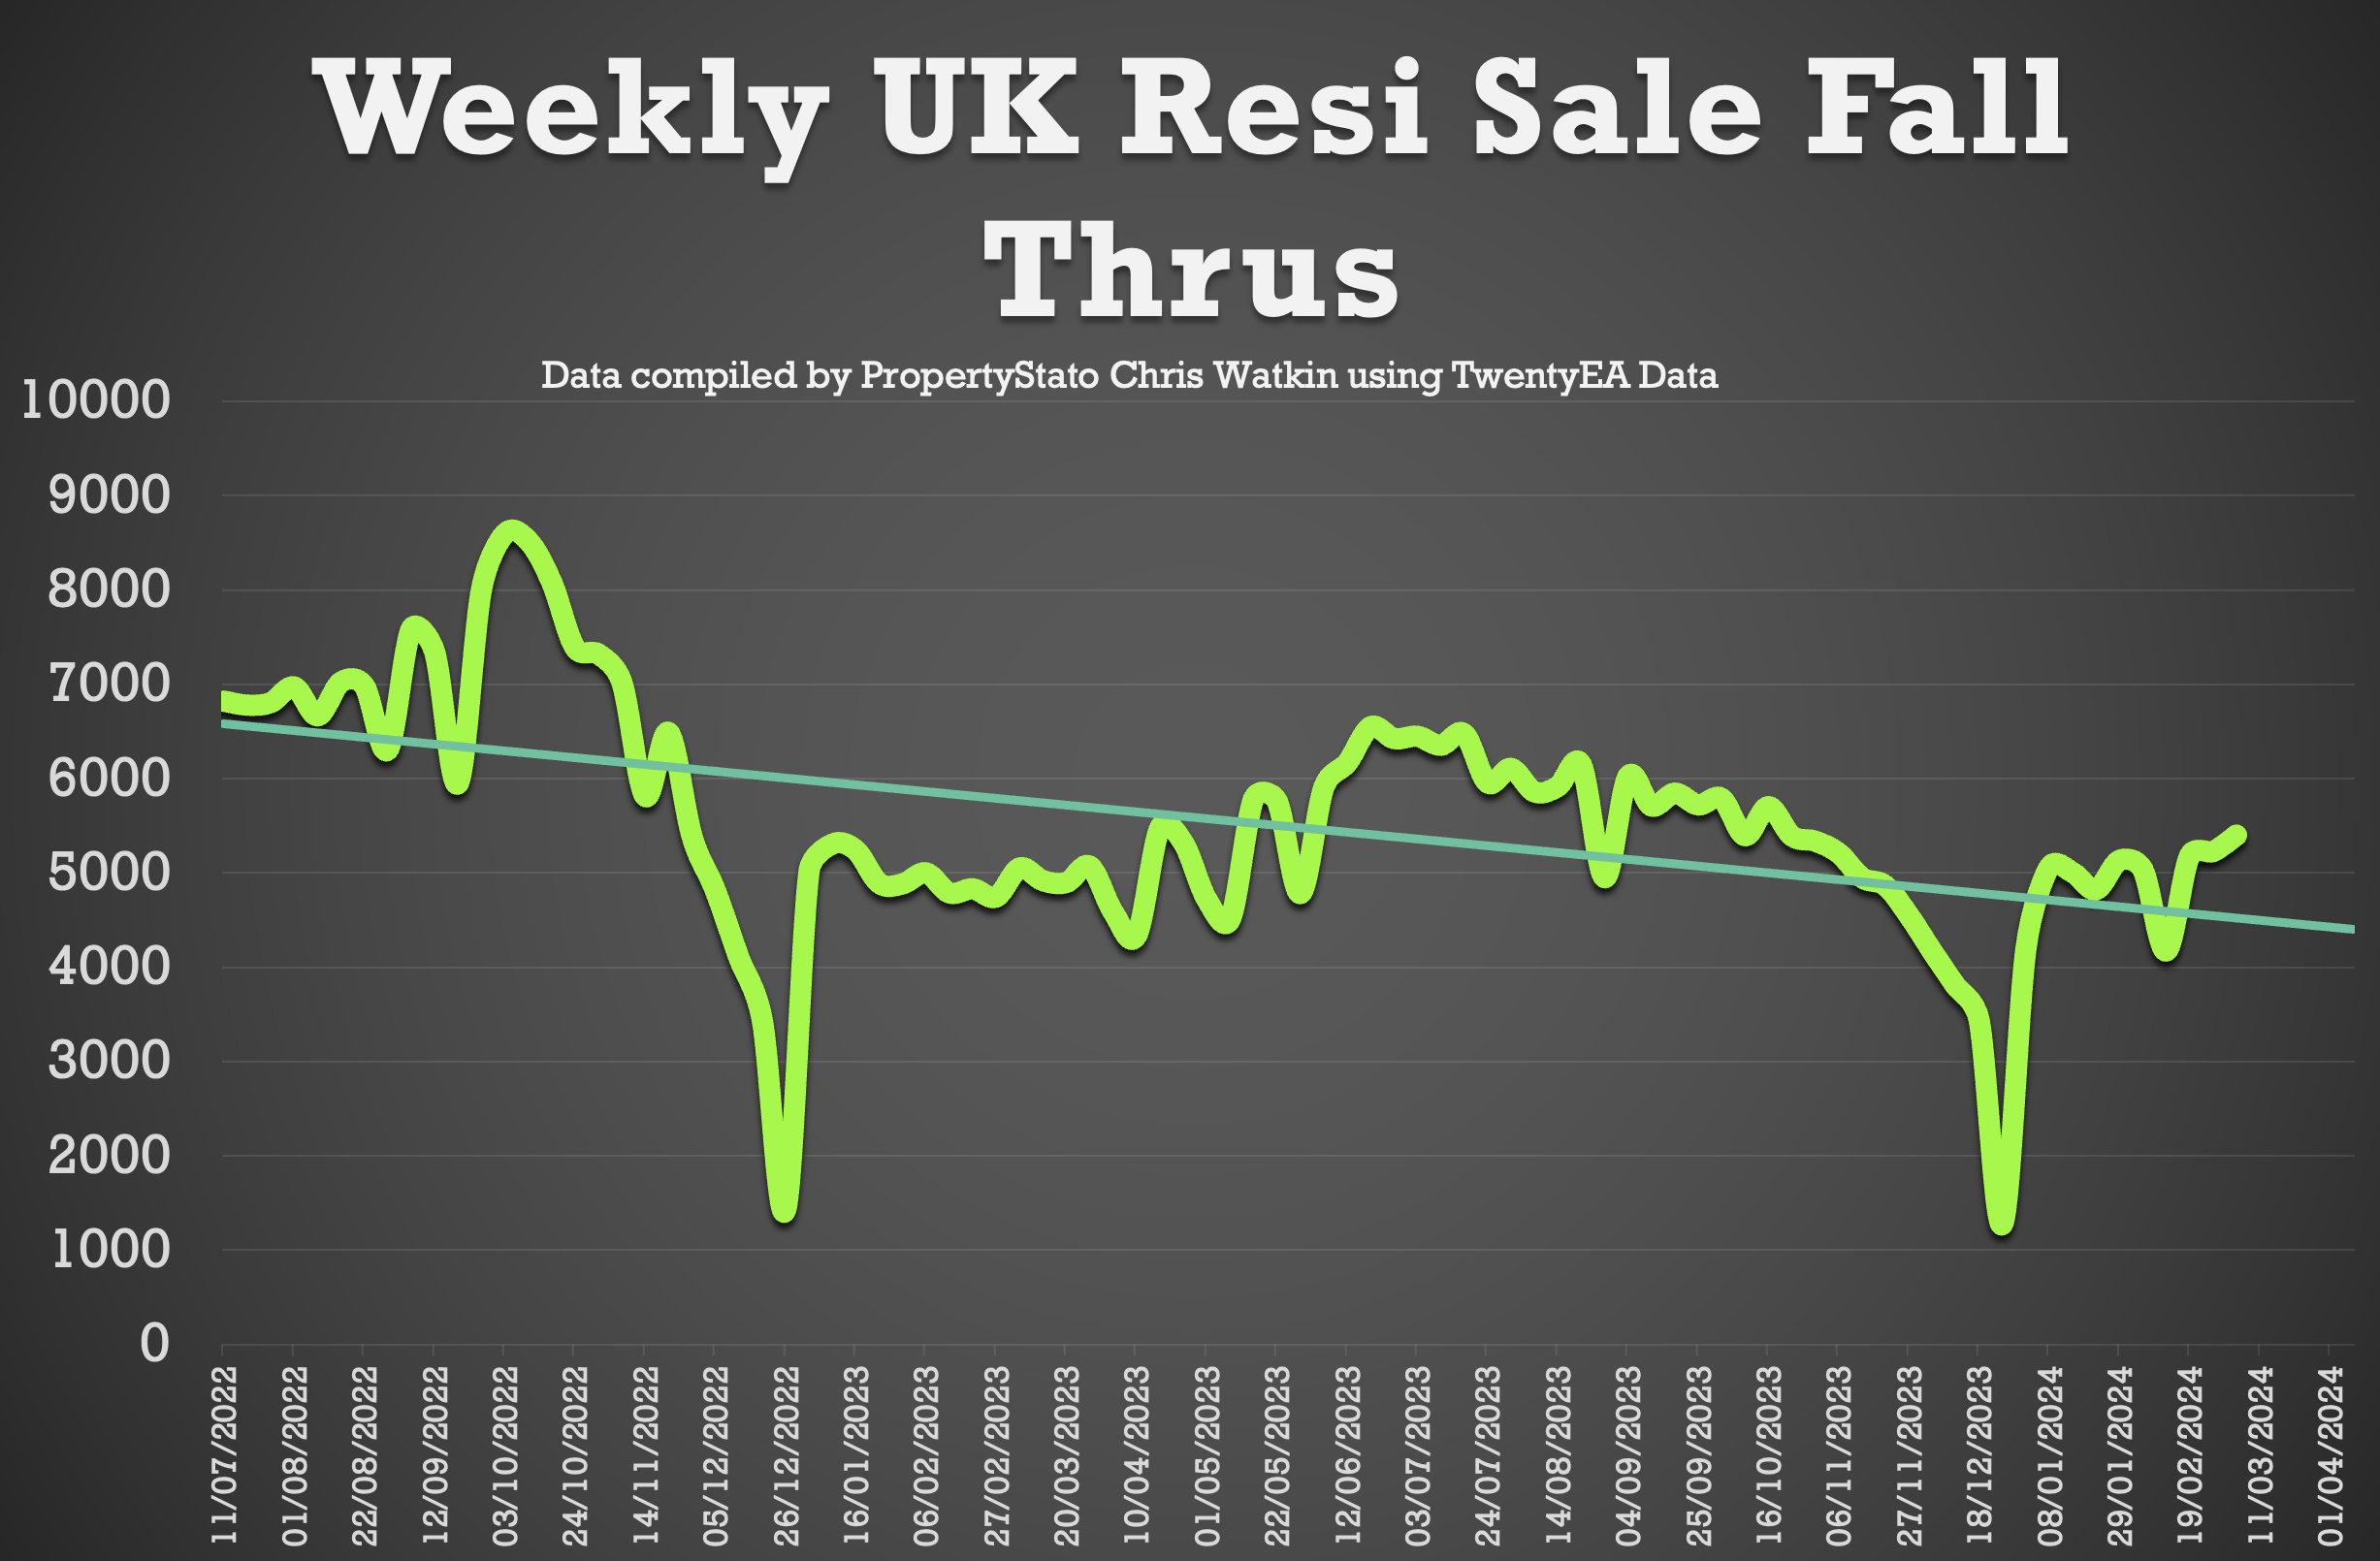
Sale Fall Throughs: Back to normal medium levels this week at 5,398, still below than the 2023 while of year average of 5,382 weekly fall-throughs and 7,590 weekly sale fall throughs in two months after there Truss’onomics Budget in Q4 2022.
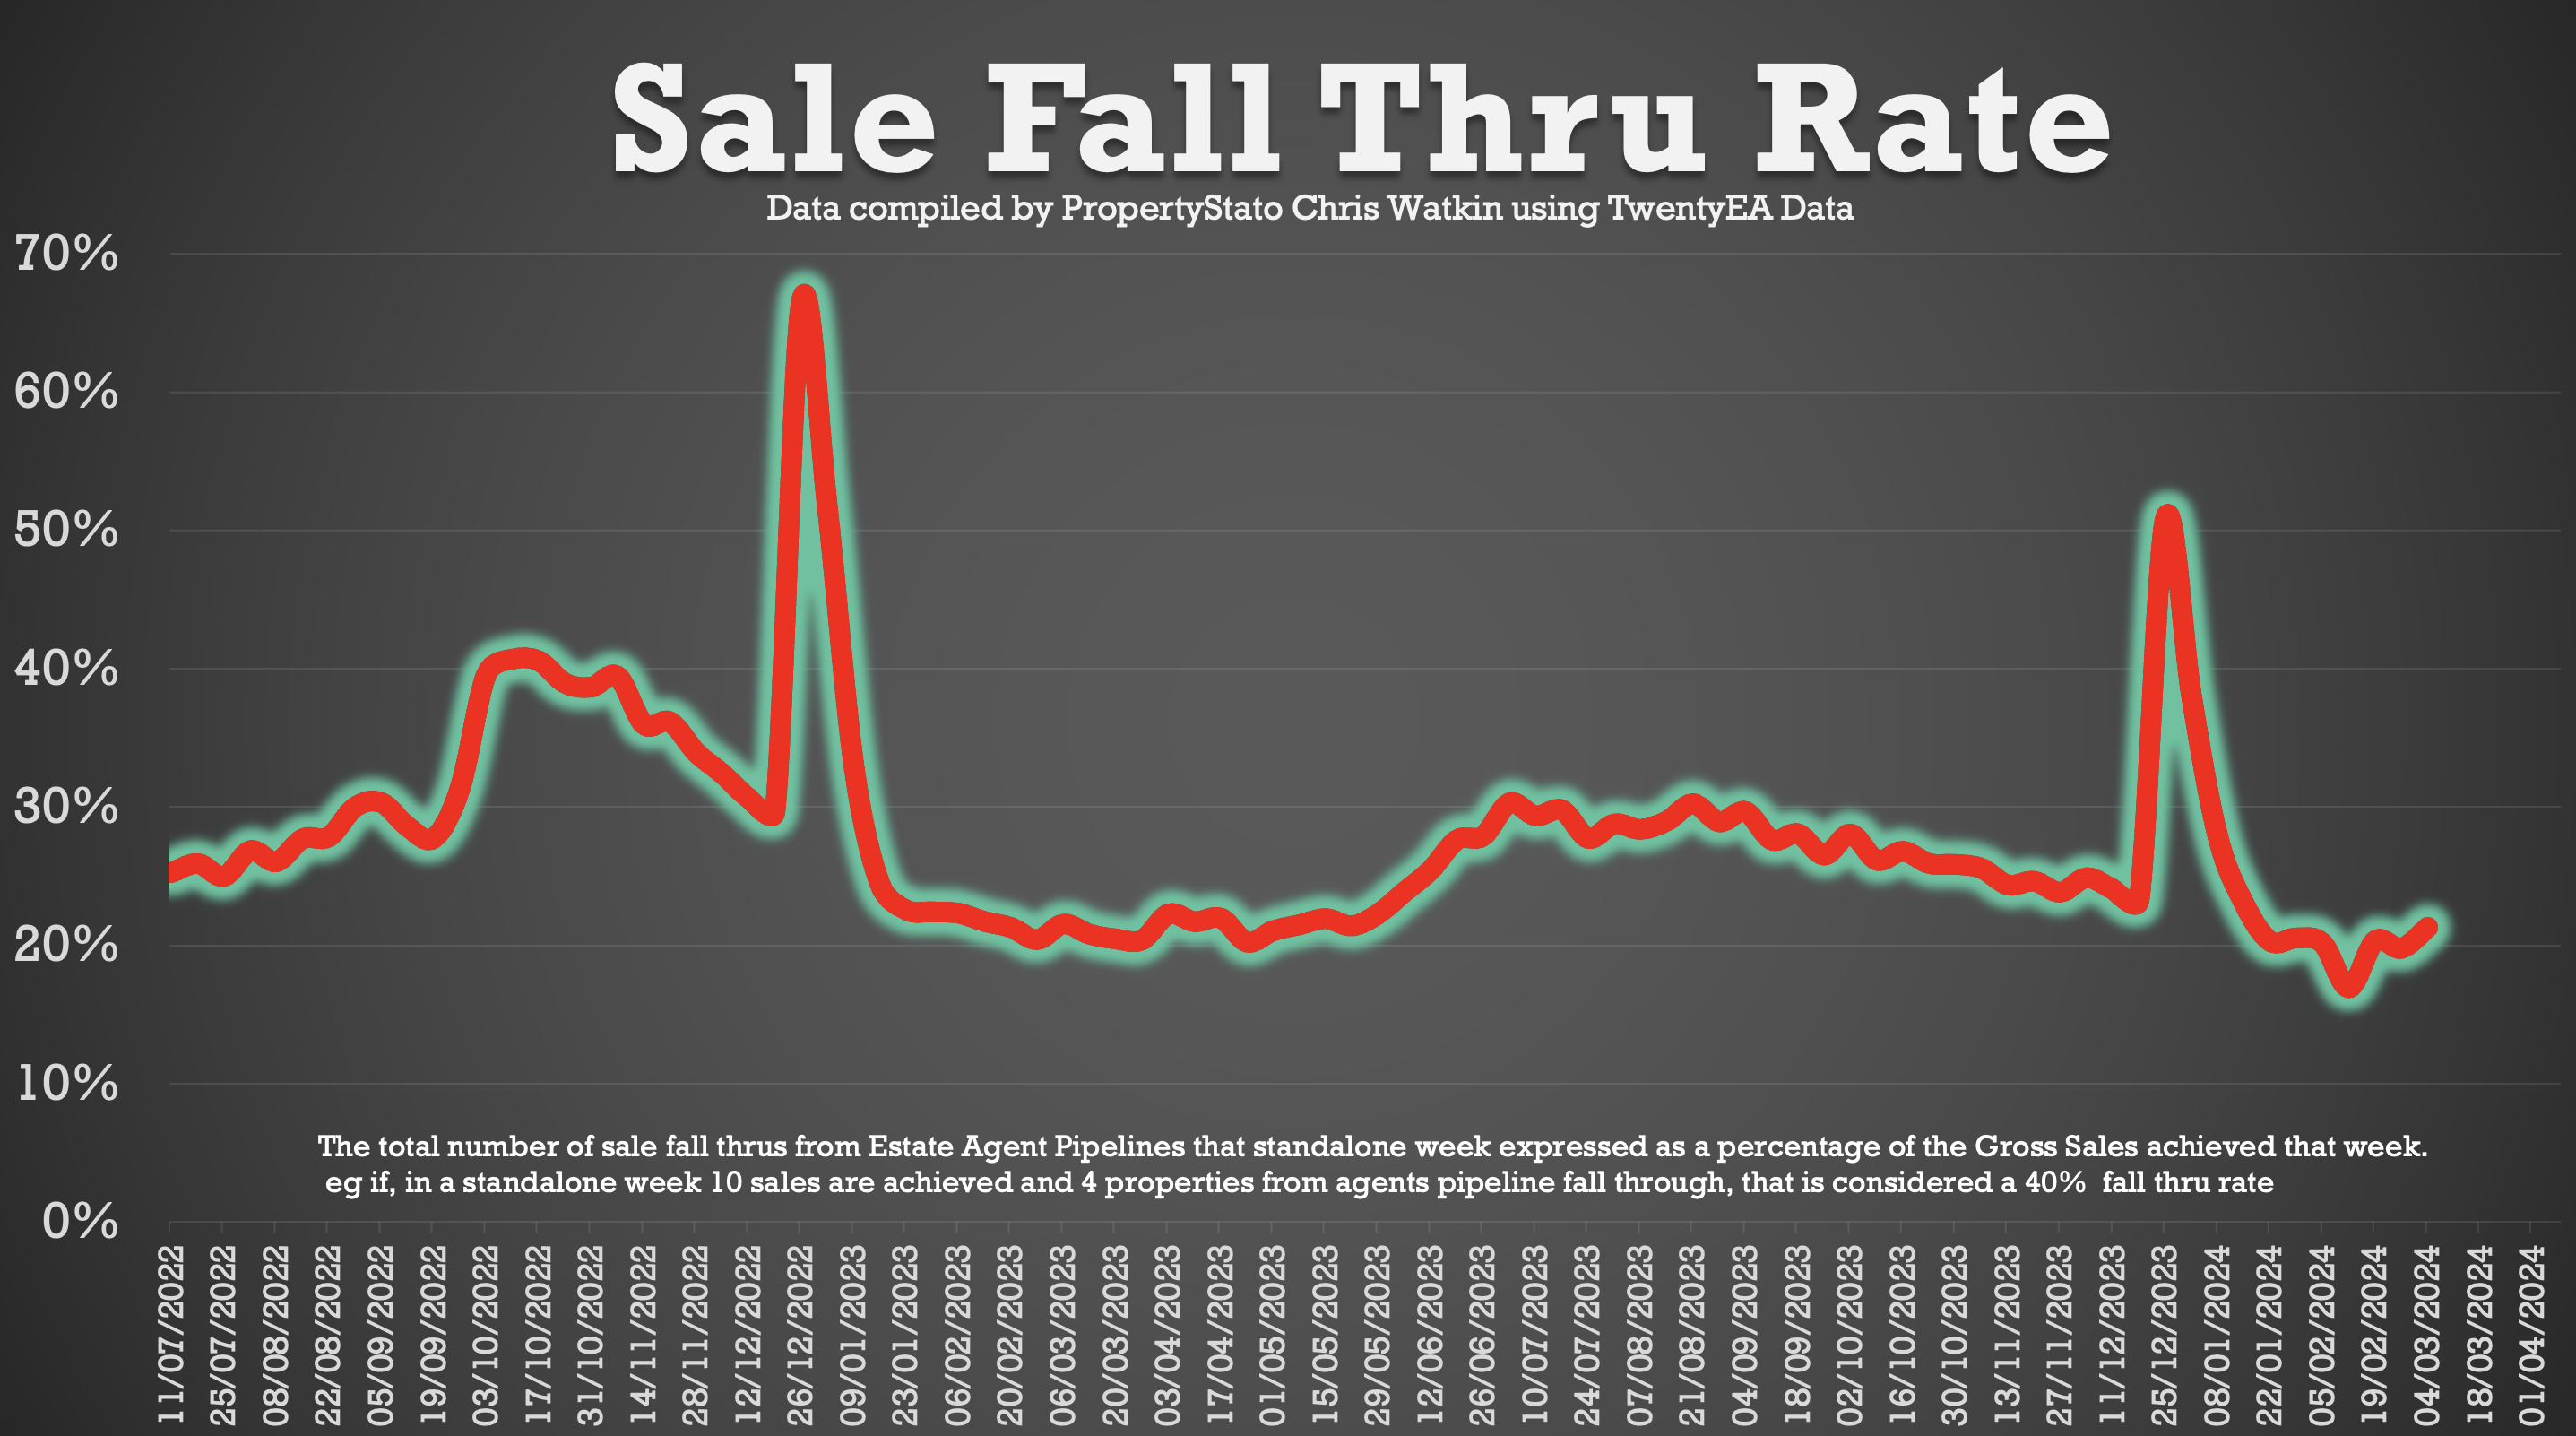
Sale Fall Through Rate: Picked up slightly from last week, yet still only back to its medium term downward trend at 21.33% for the week (8 years average is 24.8%)
Net Sales down 5.8% from last week’s figures at 19,915 for the week, above the 17/18/19 average of 18,263 for Week 10.
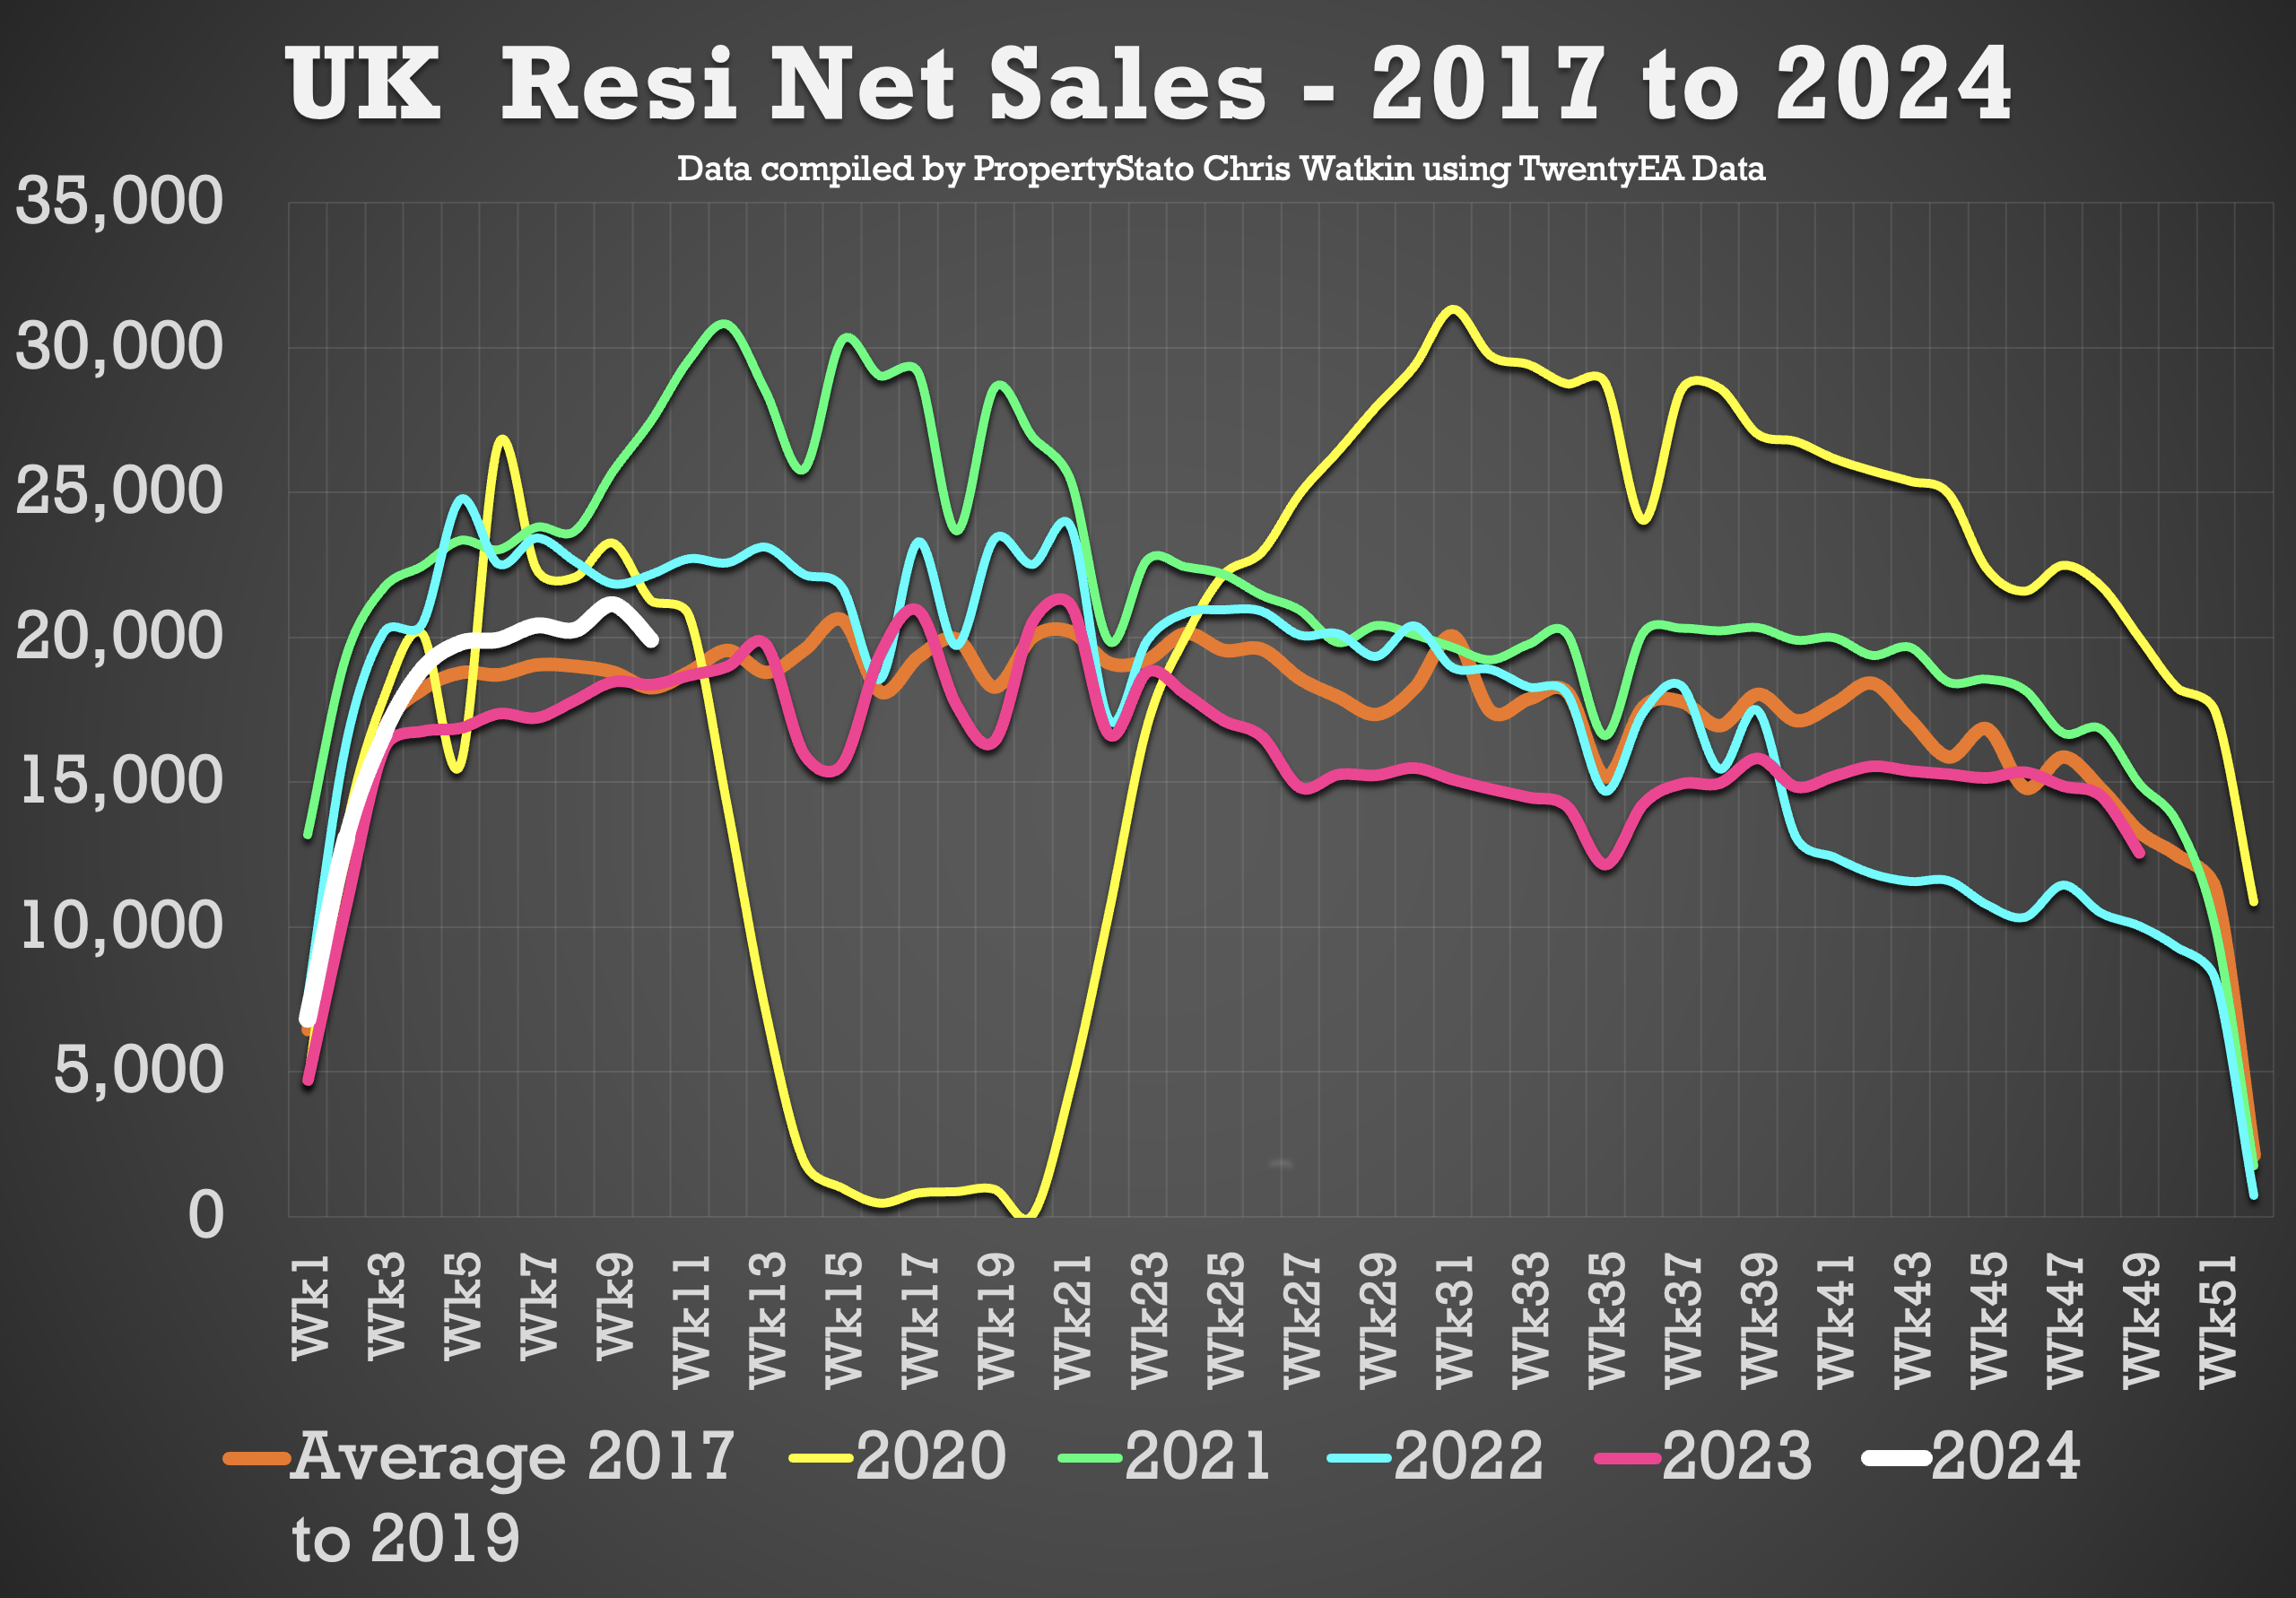
Accumulative Net Sales YTD: The total stands at 176,931, 6.0% higher the 17/18/19 YTD Net sales average and 14.6% higher than the YTD figure for 2023 for Net Sales (2023 : 154,430).
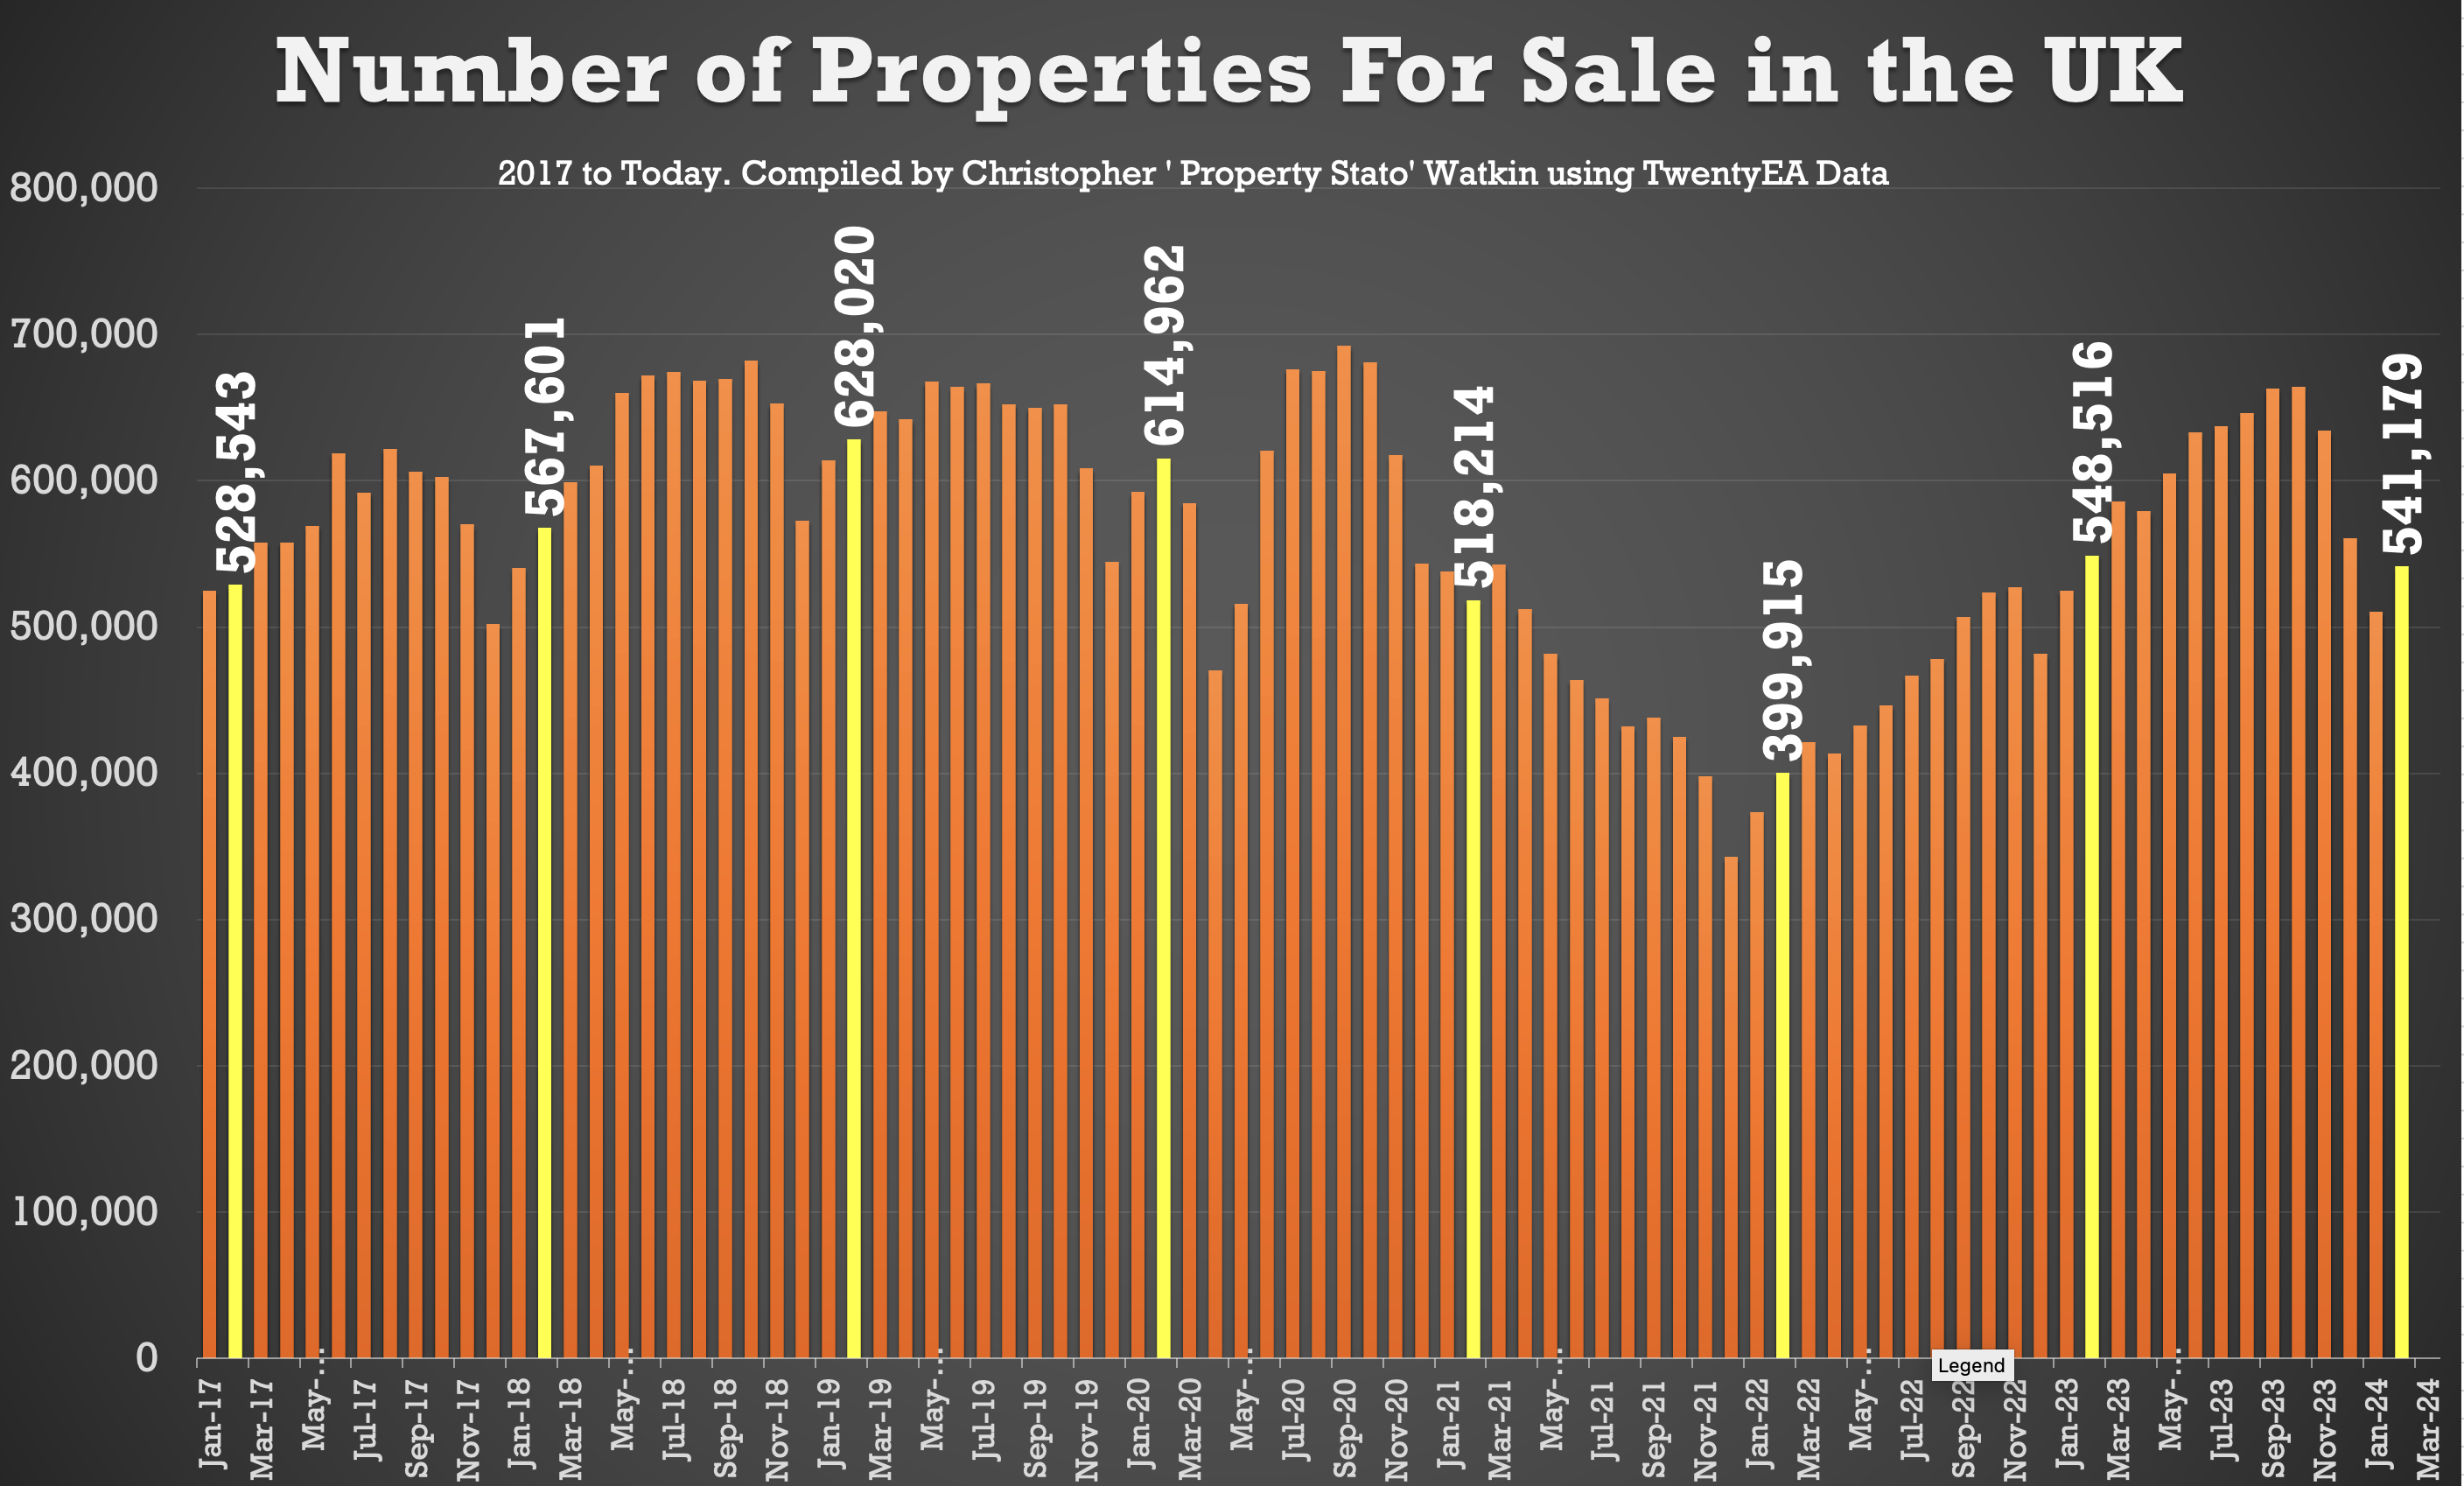
Number of properties for sale on the 1st of March 2024 was 541,179, which is 13% below the 1st of March average for the 1st March 2019 and 1st March 2020
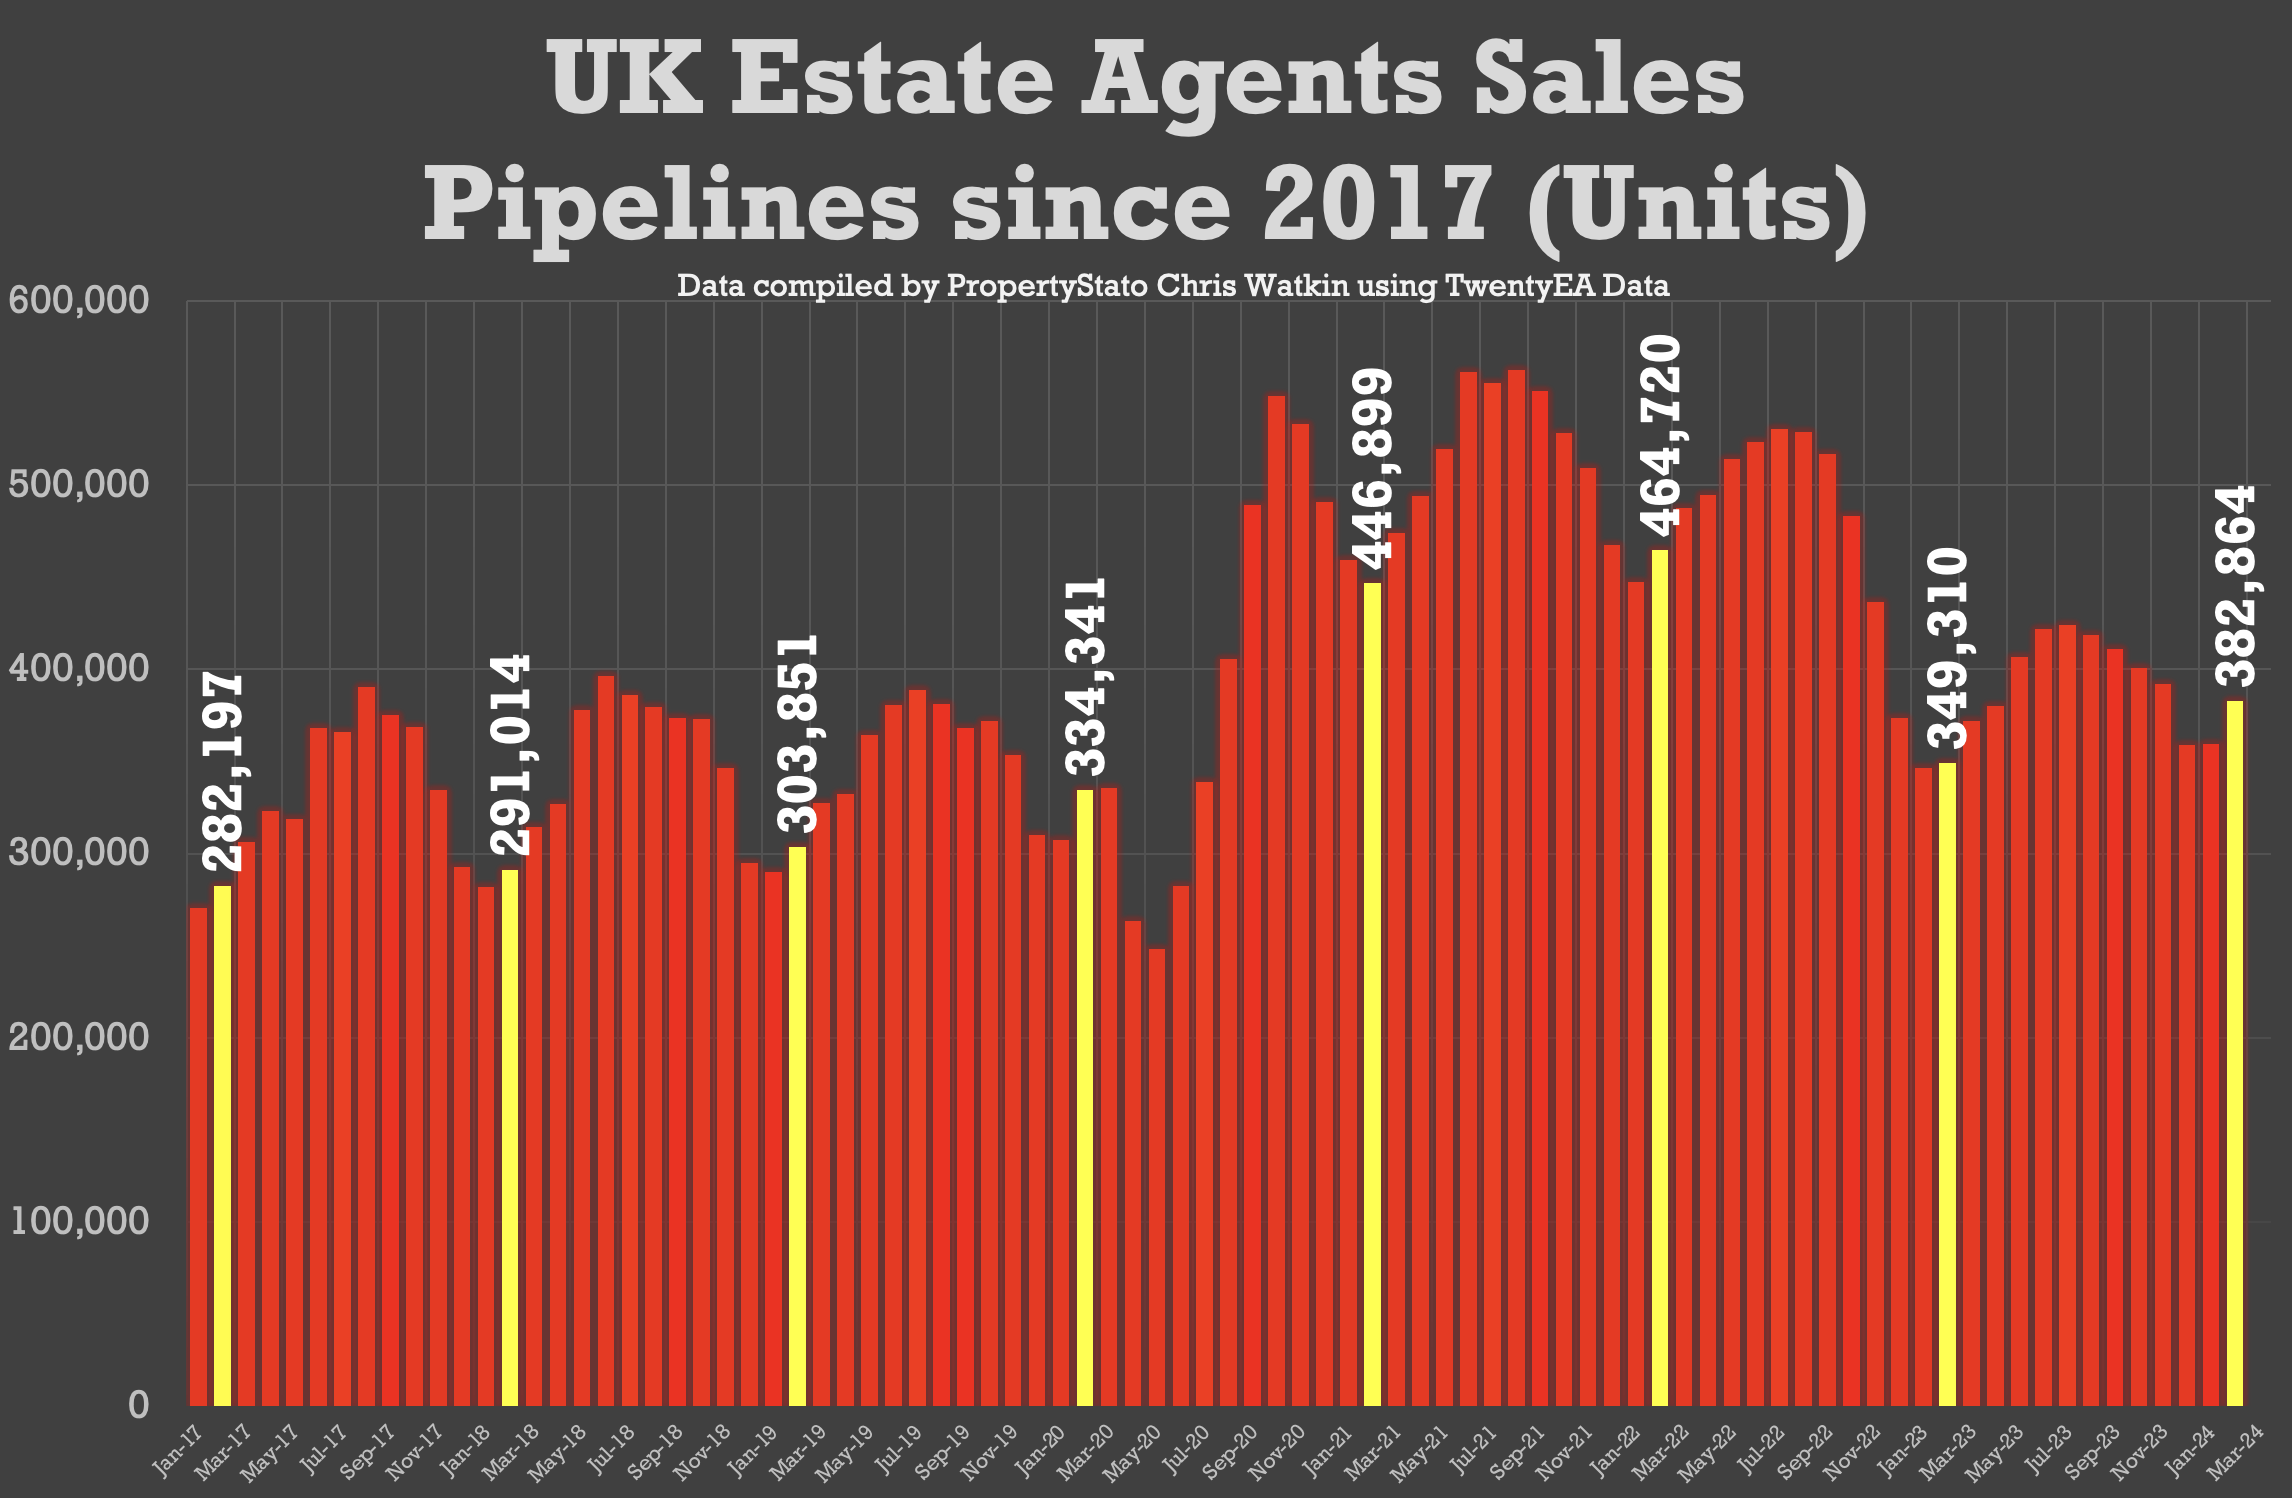
UK Estate Agents Sales Pipelines at 382,864 for 29th February 2024.
Local Focus:
This week’s local focus is on Chesterfield
Watkin’s Thoughts on the UK Property Market this week
Steady as she goes is the order of the day for listings and sales … but (there is always a but!)
Of 238,897 properties that have left estate agent’s books since 1st January 2024, only 120,211 (or 50.32%) have exchanged contracts and Agents therefore been paid on them. The others 118,686 were withdrawn with the agent paying all that money in marketing expenses, for them not to earn one penny. (In London that drops to 37.8% of properties being exchanged)
So whilst the market is doing OK, remember, it’s it isn’t 2021. Don’t overvalue (or if you do, get it down after 3 or 4 weeks maximum), and get the home sold.

It’s good to look back against multi year averages. I would like to see these over longer periods if possible. Taking 17/18/19 as a group is not indicative of a long term market average as these were the 3 years between referendum and Brexit and were all somewhat different to a normal market. Taking 17-23 probably averages things out but I’d love to see 10 year averages used. Great article though and useful information. Thanks.
You must be logged in to like or dislike this comments.
Click to login
Don't have an account? Click here to register
Thank you EAMD172 – the data only goes back to 2017 – my apologies
You must be logged in to like or dislike this comments.
Click to login
Don't have an account? Click here to register