 The UK property market headlines only tell you so much. In this week’s show, we get underneath them and look at what actually happened last week, from new listings and price reductions to sales agreed, fall-throughs and exchanges. More importantly, we ask what those numbers are really telling estate agents about the market they are working in right now.
Joining me is Bryan Mansell, and as you might expect, the statistics very quickly turn into a few home truths for estate agents. We get into overvaluing, why agents leave price reductions too late, whether there really is such a thing as a buyers’ or sellers’ market, upfront surveys, reservation agreements and why getting the instruction is pointless if the strategy afterwards does not actually help the homeowner move.
In the second part of the show, we head to Weymouth and put the local Weymouth estate & letting agents under the microscope. Not simply who lists the most homes, but who actually gives homeowners the strongest chance of moving, who achieves the better prices and who appears to be gaining ground locally. If you are an estate agent anywhere in the UK, the way we analyse Weymouth might give you a few ideas about how you could prove your own value too.
🟩 Listings
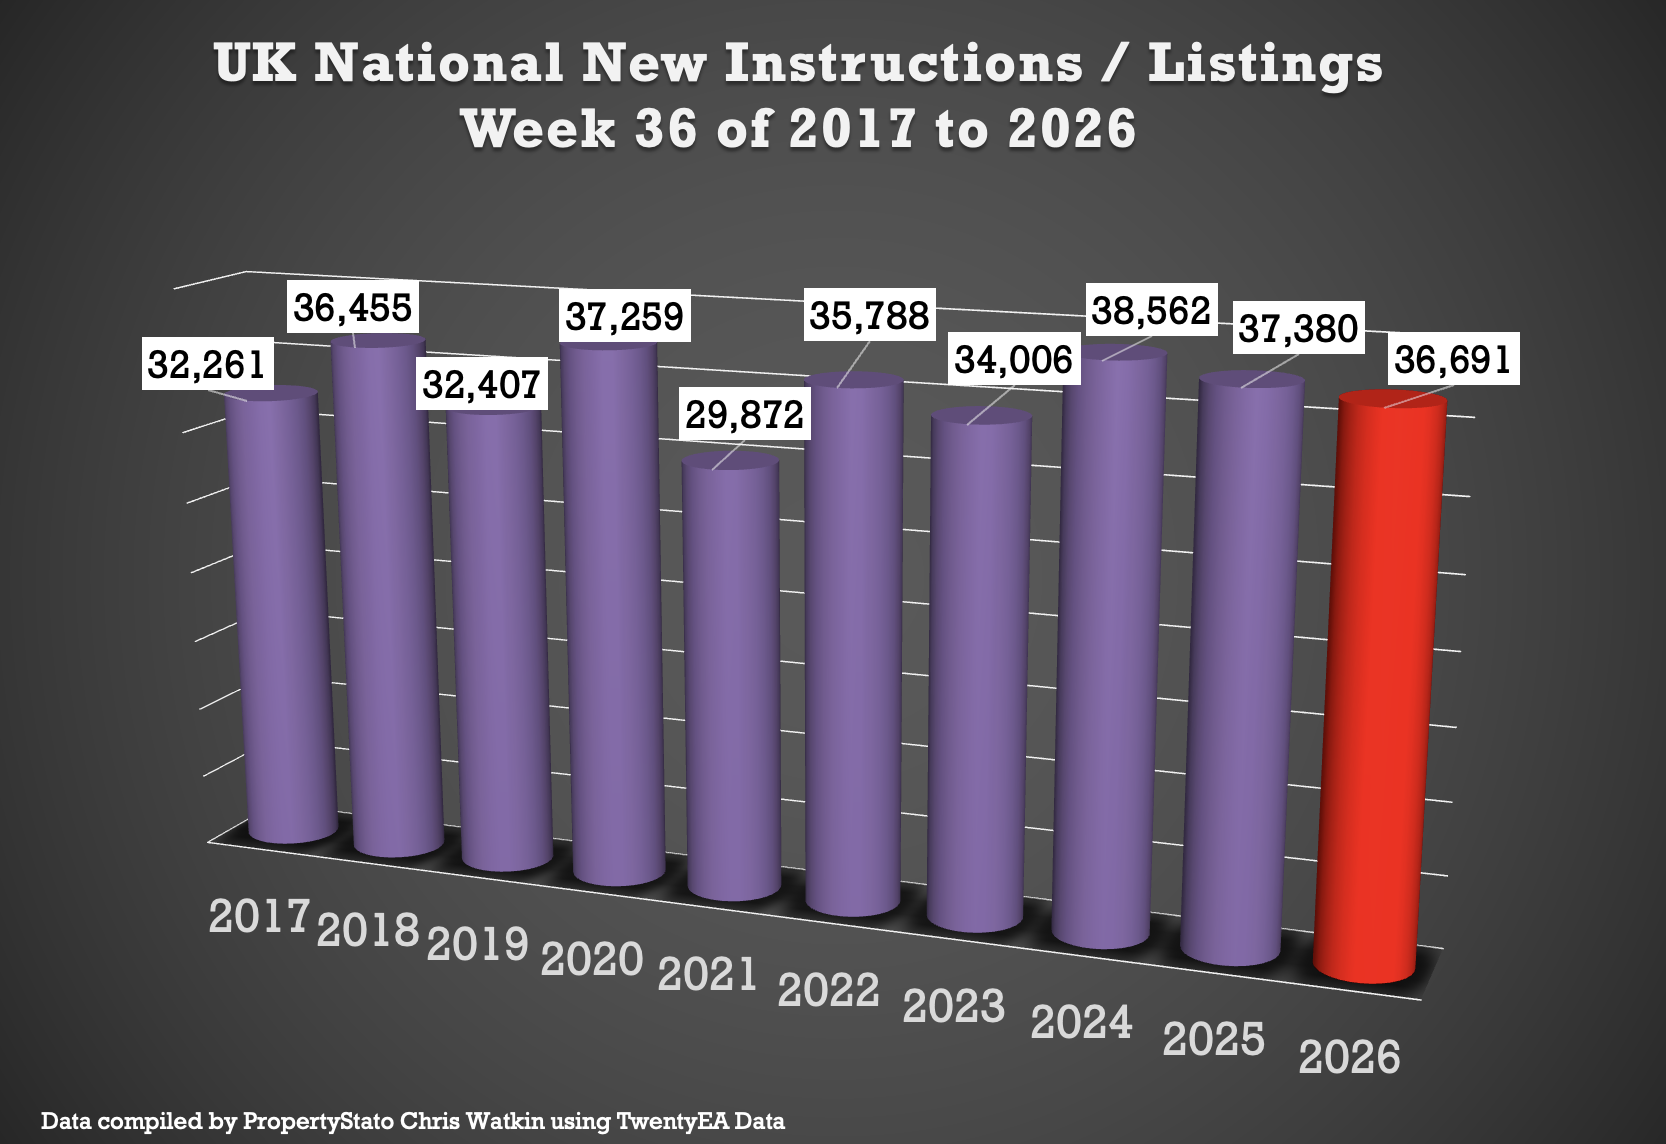
Week 36 ..
36.7k new listings this week, (31.7k last week).
Weekly 2026 average : 36k.
10 year week 36 average : 35k
Year to Date
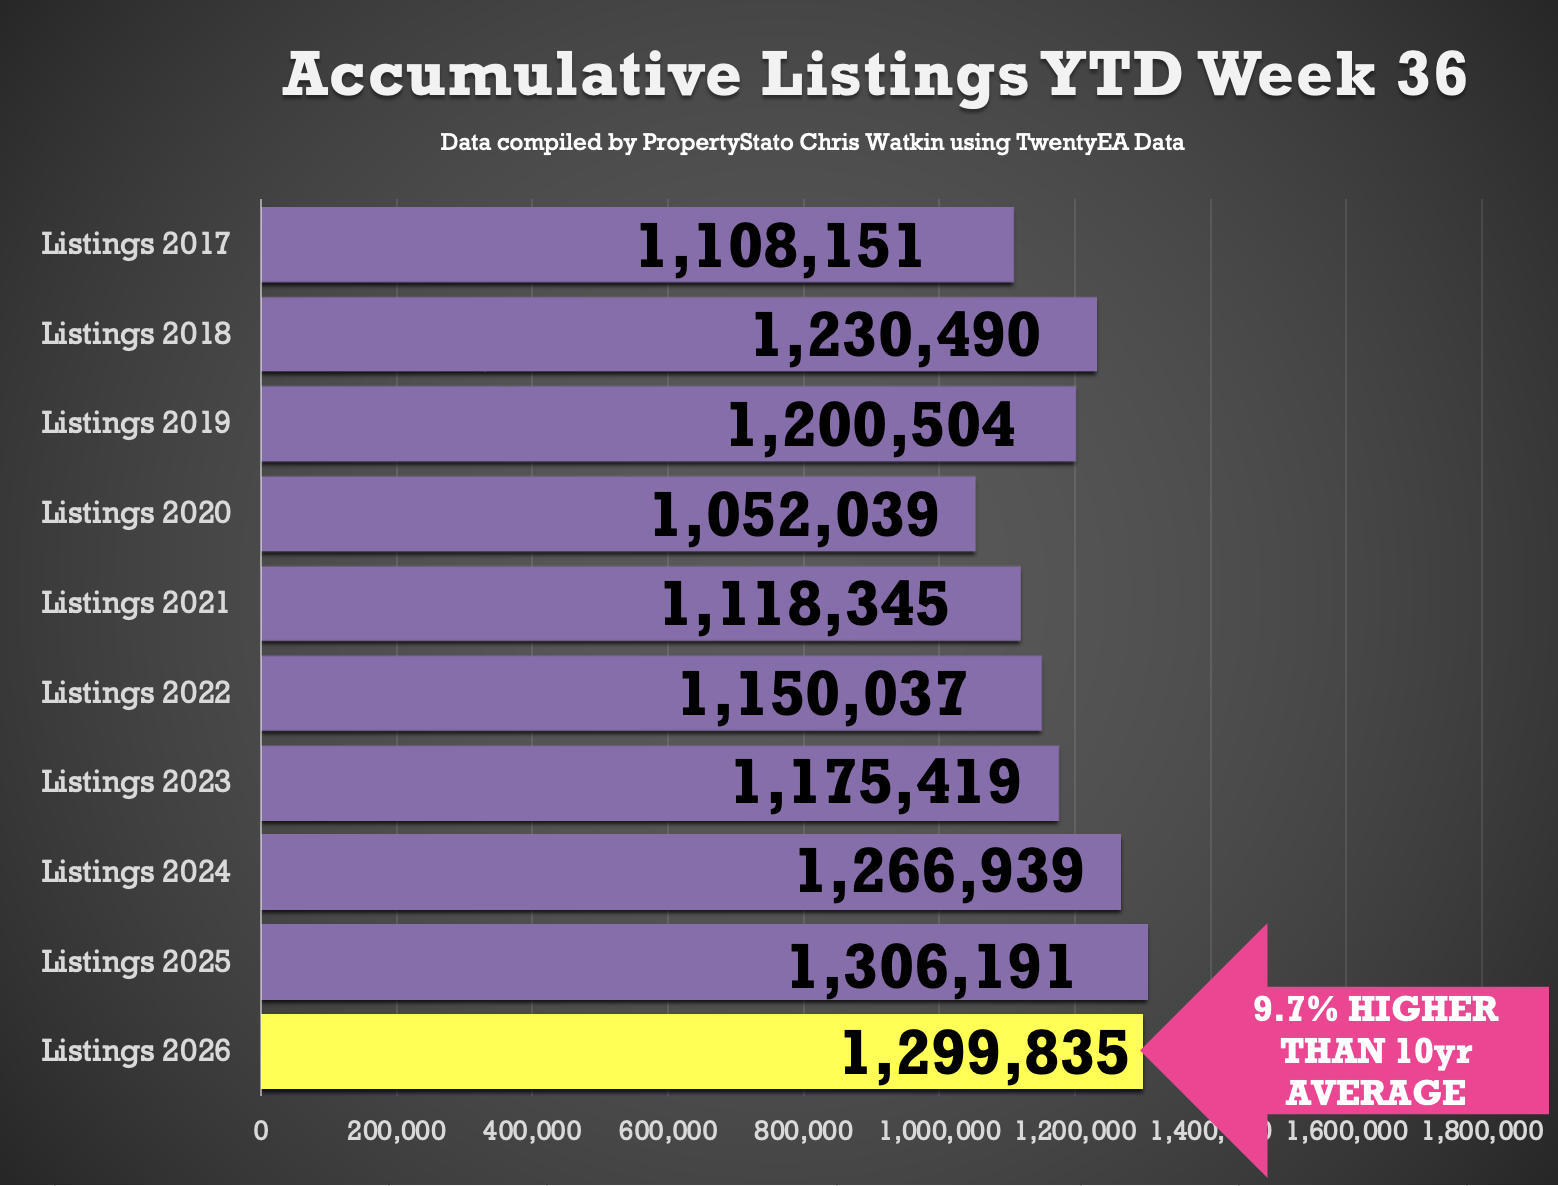
1.299m new listings YTD, which is …
0.5% below 2025 YTD (1.306m)
2.6% ahead of 2024 YTD (1.267m)
10.2% ahead of 2023 YTD (1.175m)
9.7% higher than the 2017–19 average YTD (1.175m).
The last decade average – 1.190m.
🟩 UK Gross Resi Sales
Week 36..
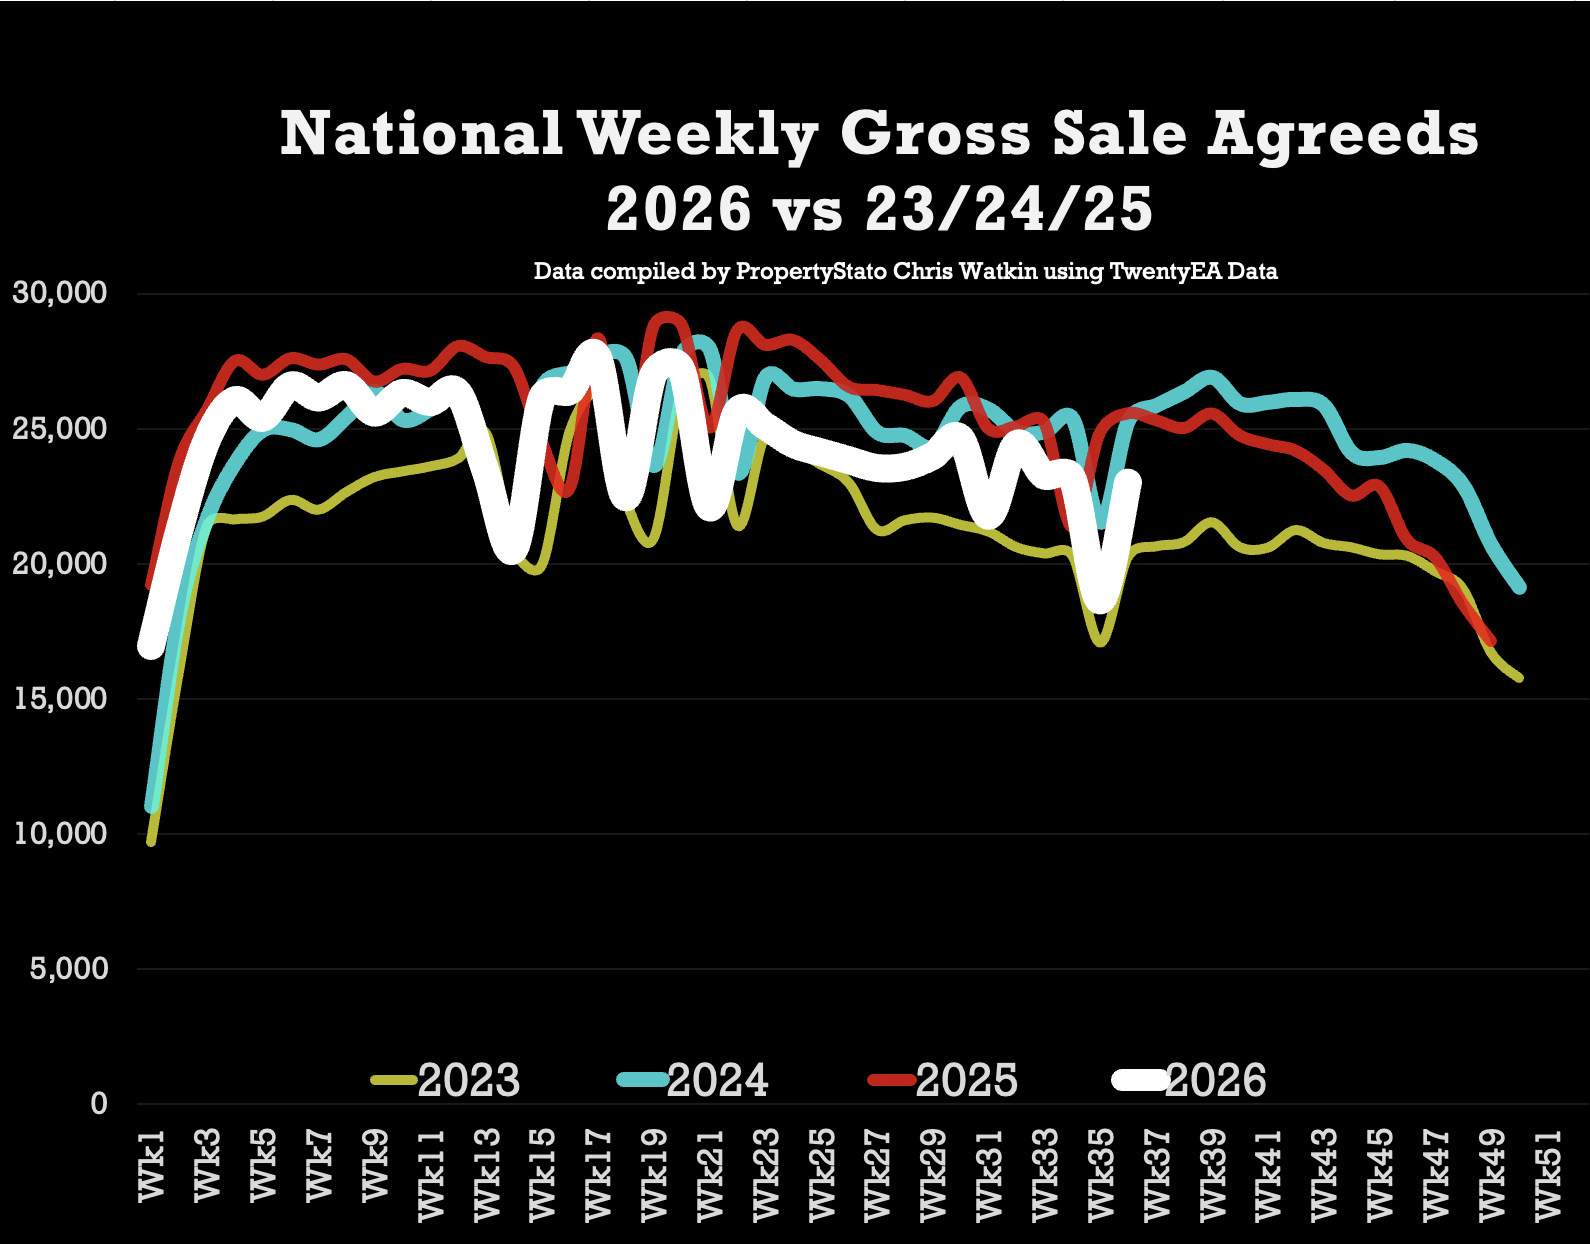
23k homes sold stc this week 33 (18.7k last week)
(Dont forget last week (wk 35) was a Bank Holiday)
10 year week 36 average : 24.5k
2026 weekly average : 24.3k.
Year to Date for house sales
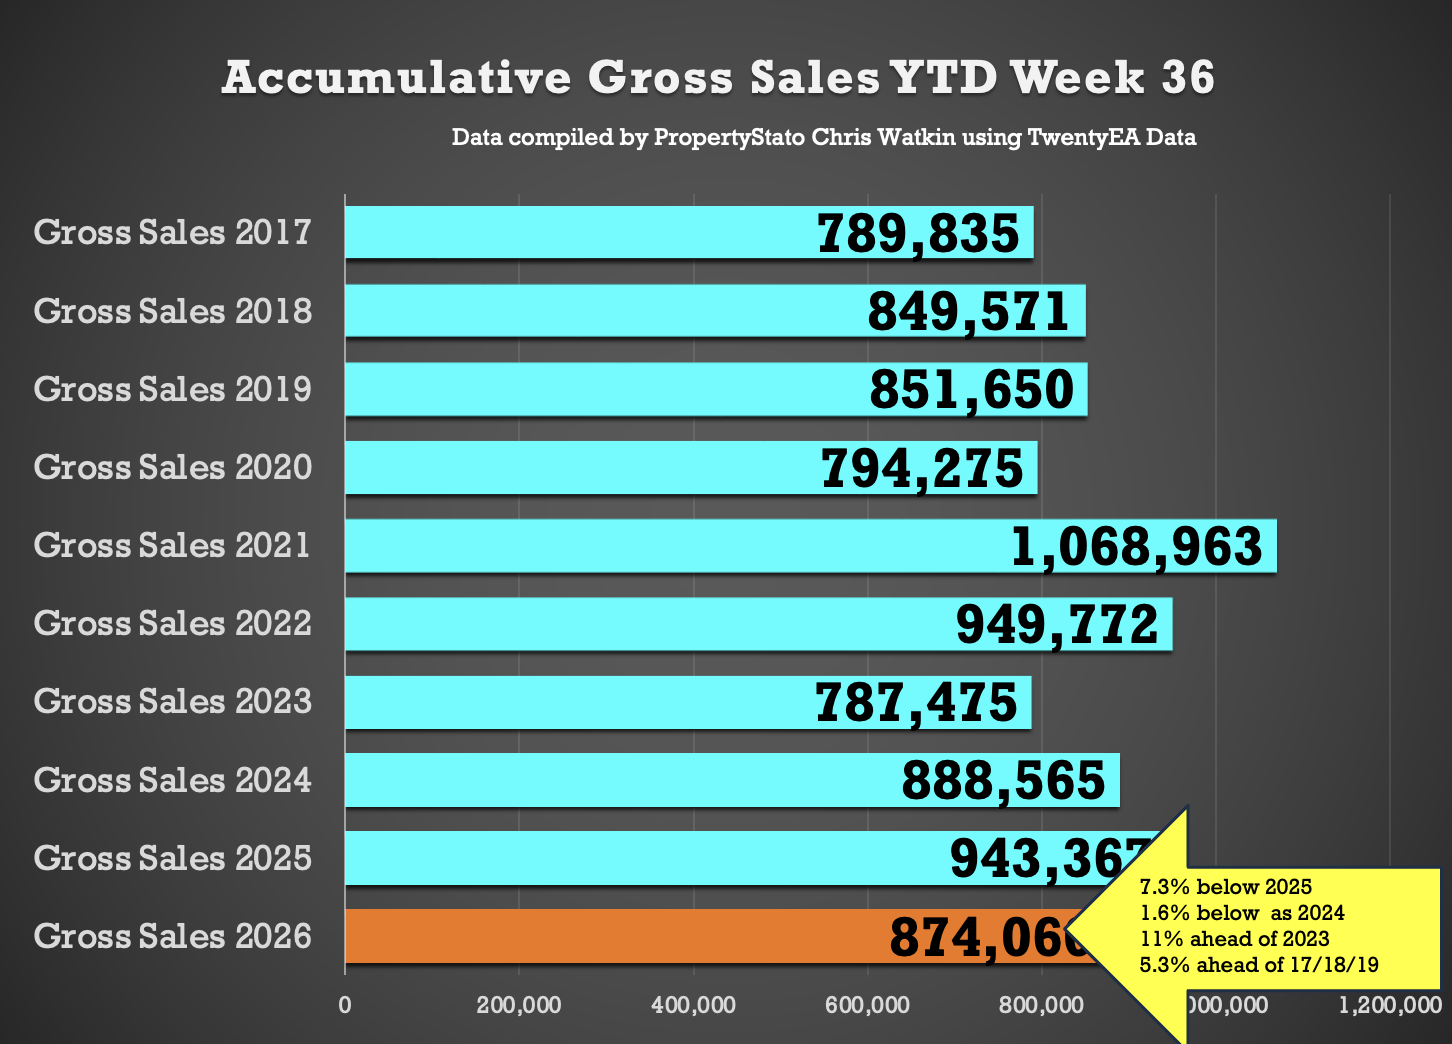
874k UK homes sold stc YTD, which is …
7.3% lower than 2025 YTD (943k)
1.6% lower to 2024 YTD (889k)
11% higher than 2023 YTD (787k)
5.3% higher above pre Covid 2017-19 years (830k).
The last decade average – 880k YTD.
🟩 UK Net Resi Sales YTD
(Net Sales being Gross Sales less Sale Fall Thrus).
Week 36
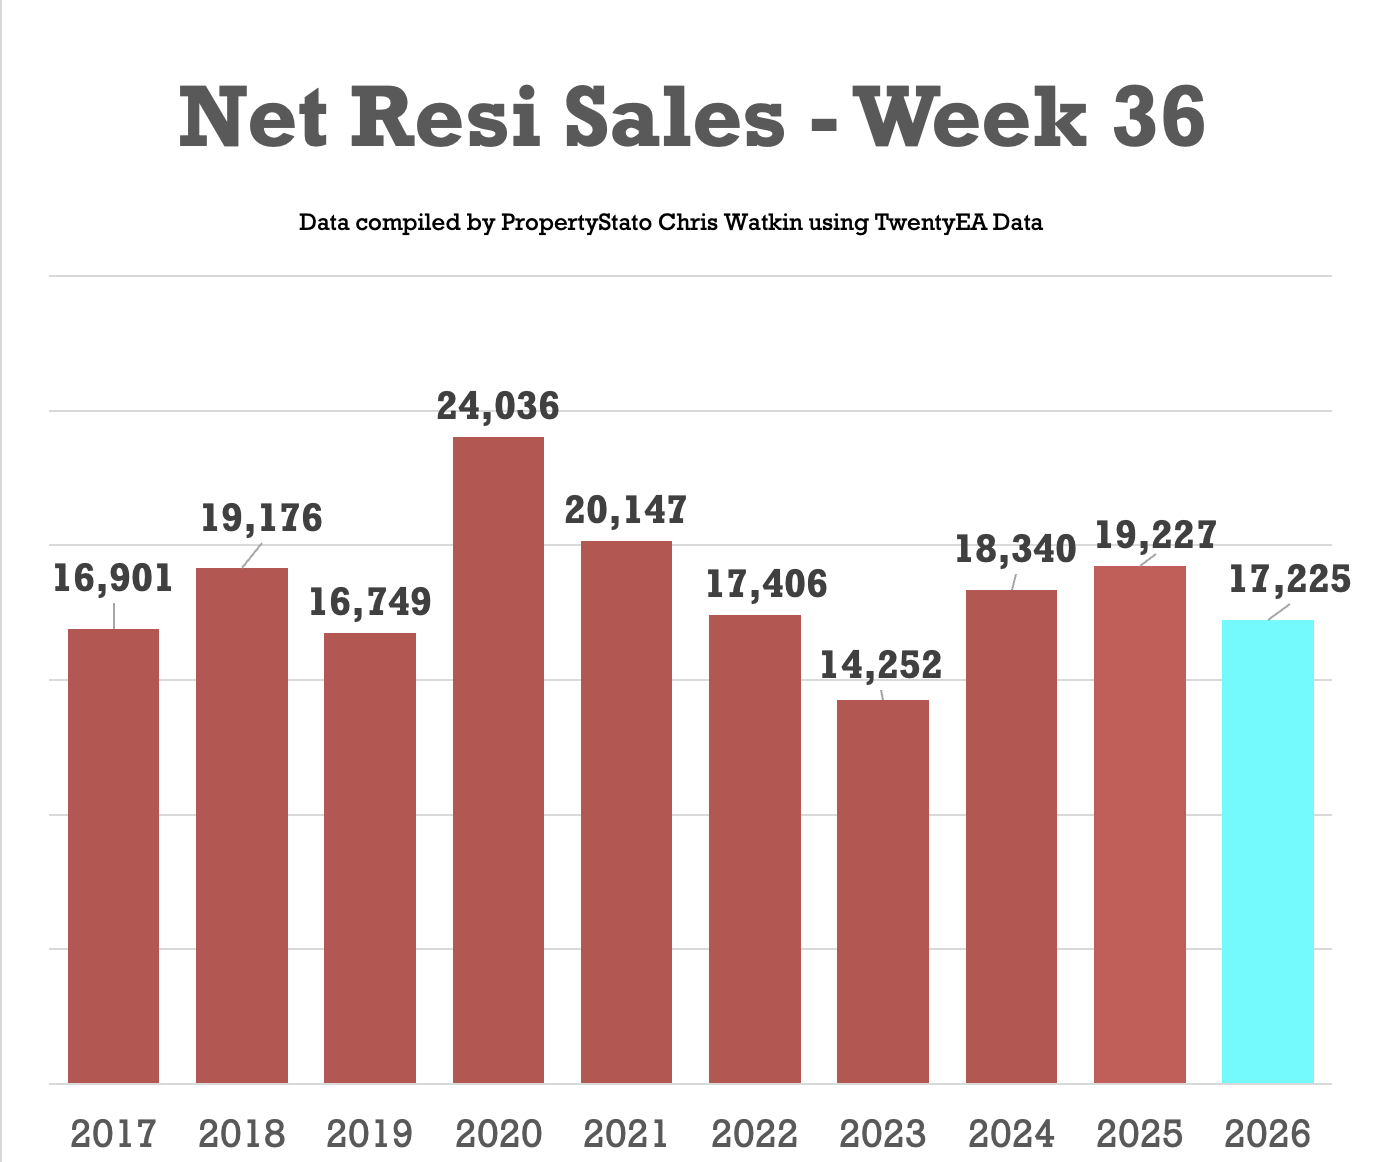
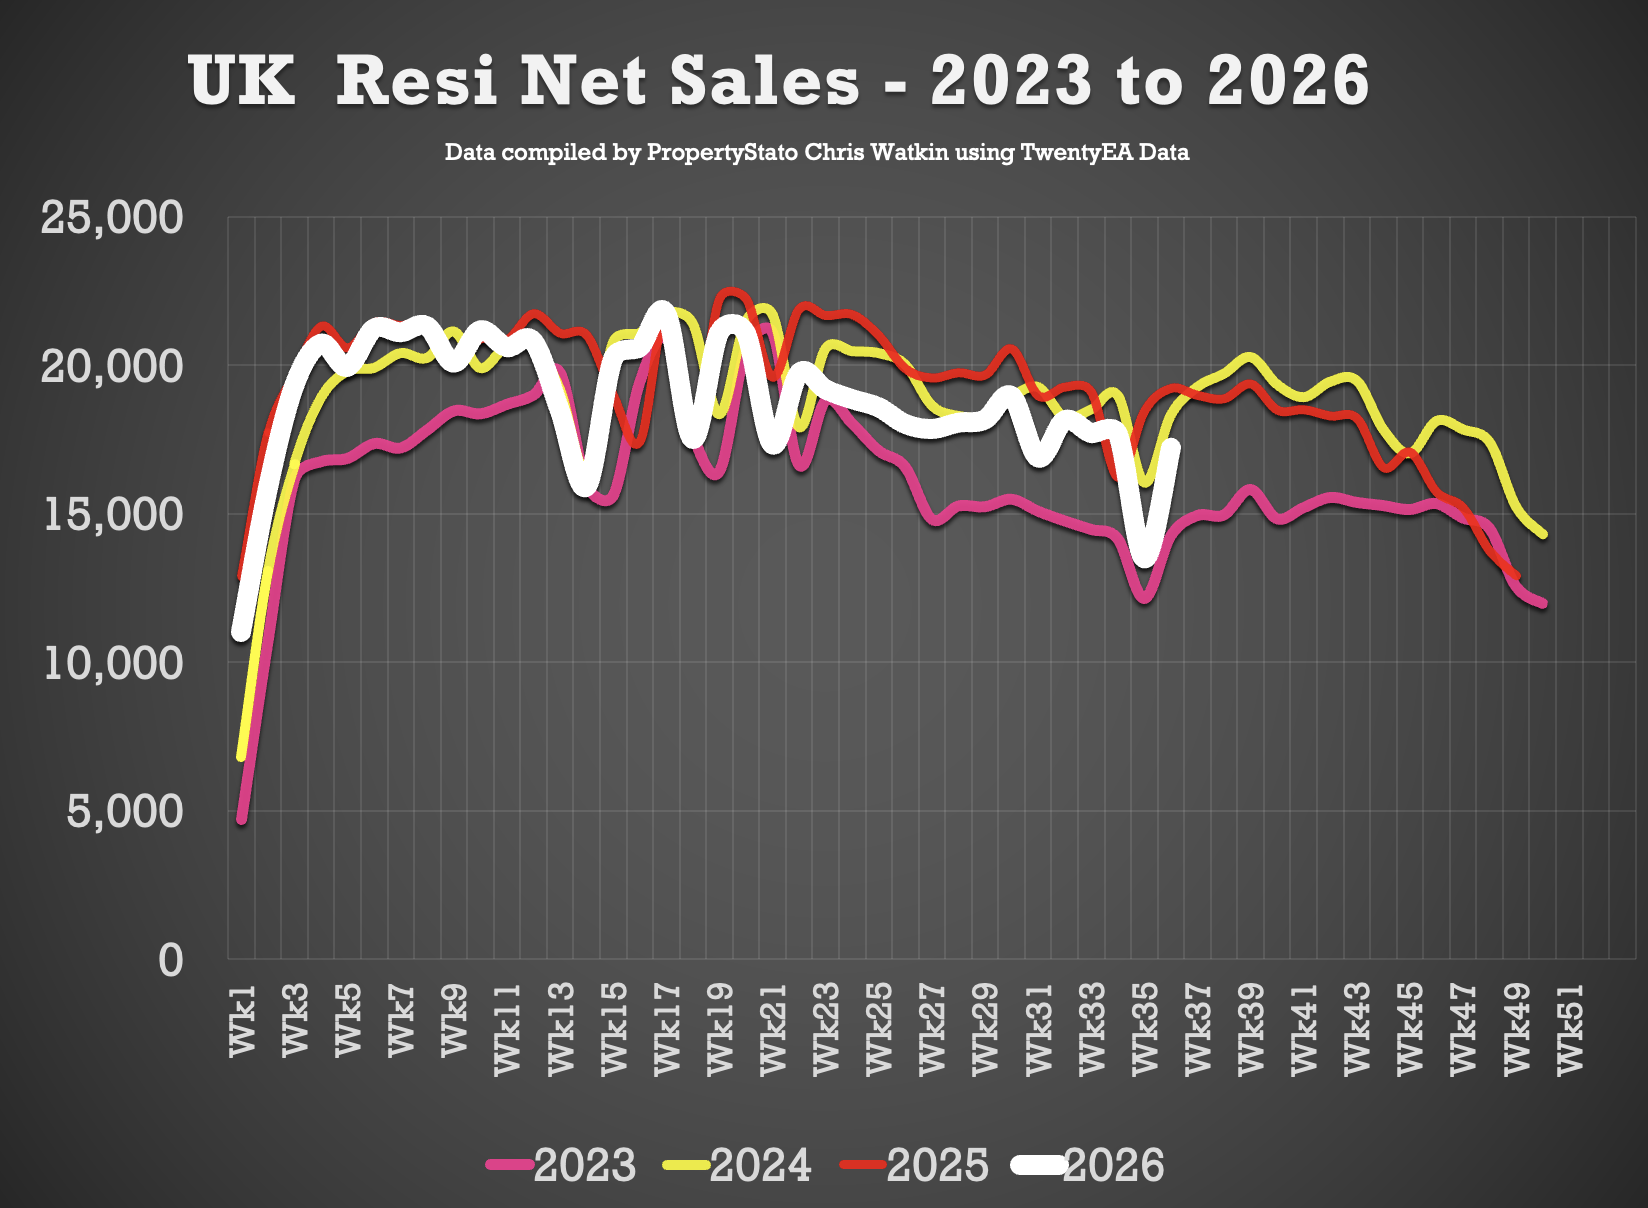
17.7k Net Sales (13.5k last week)
(Dont forget last week (wk 35) was a Bank Holiday)
10 year Week 36 average: 18.3k.
Weekly average for 2026: 18.8k.
Year to Date
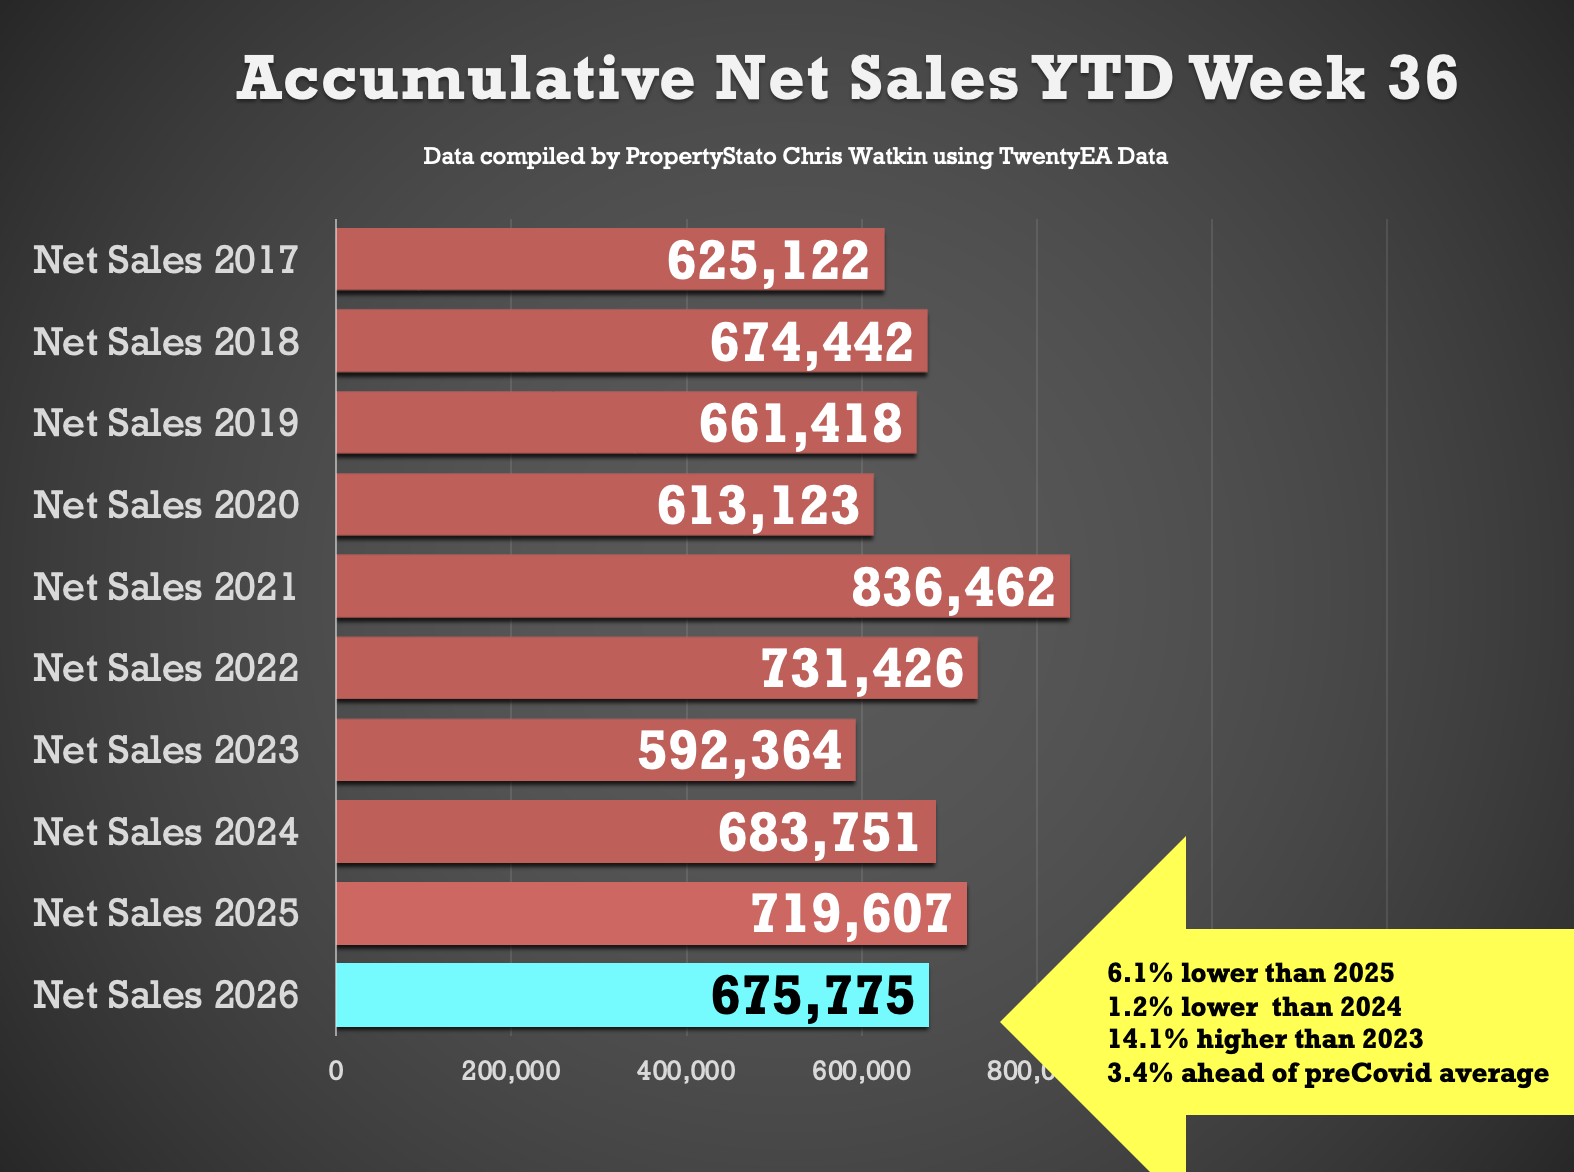
676k UK net home sales YTD, which is …
6.1% lower than 2025 (720k),
1.2% lower than 2024 (684k),
14.1% ahead of 2023 (592k)
3.4% above the 2017/18/19 average (654k).
🟩 Exchanges & Withdrawals
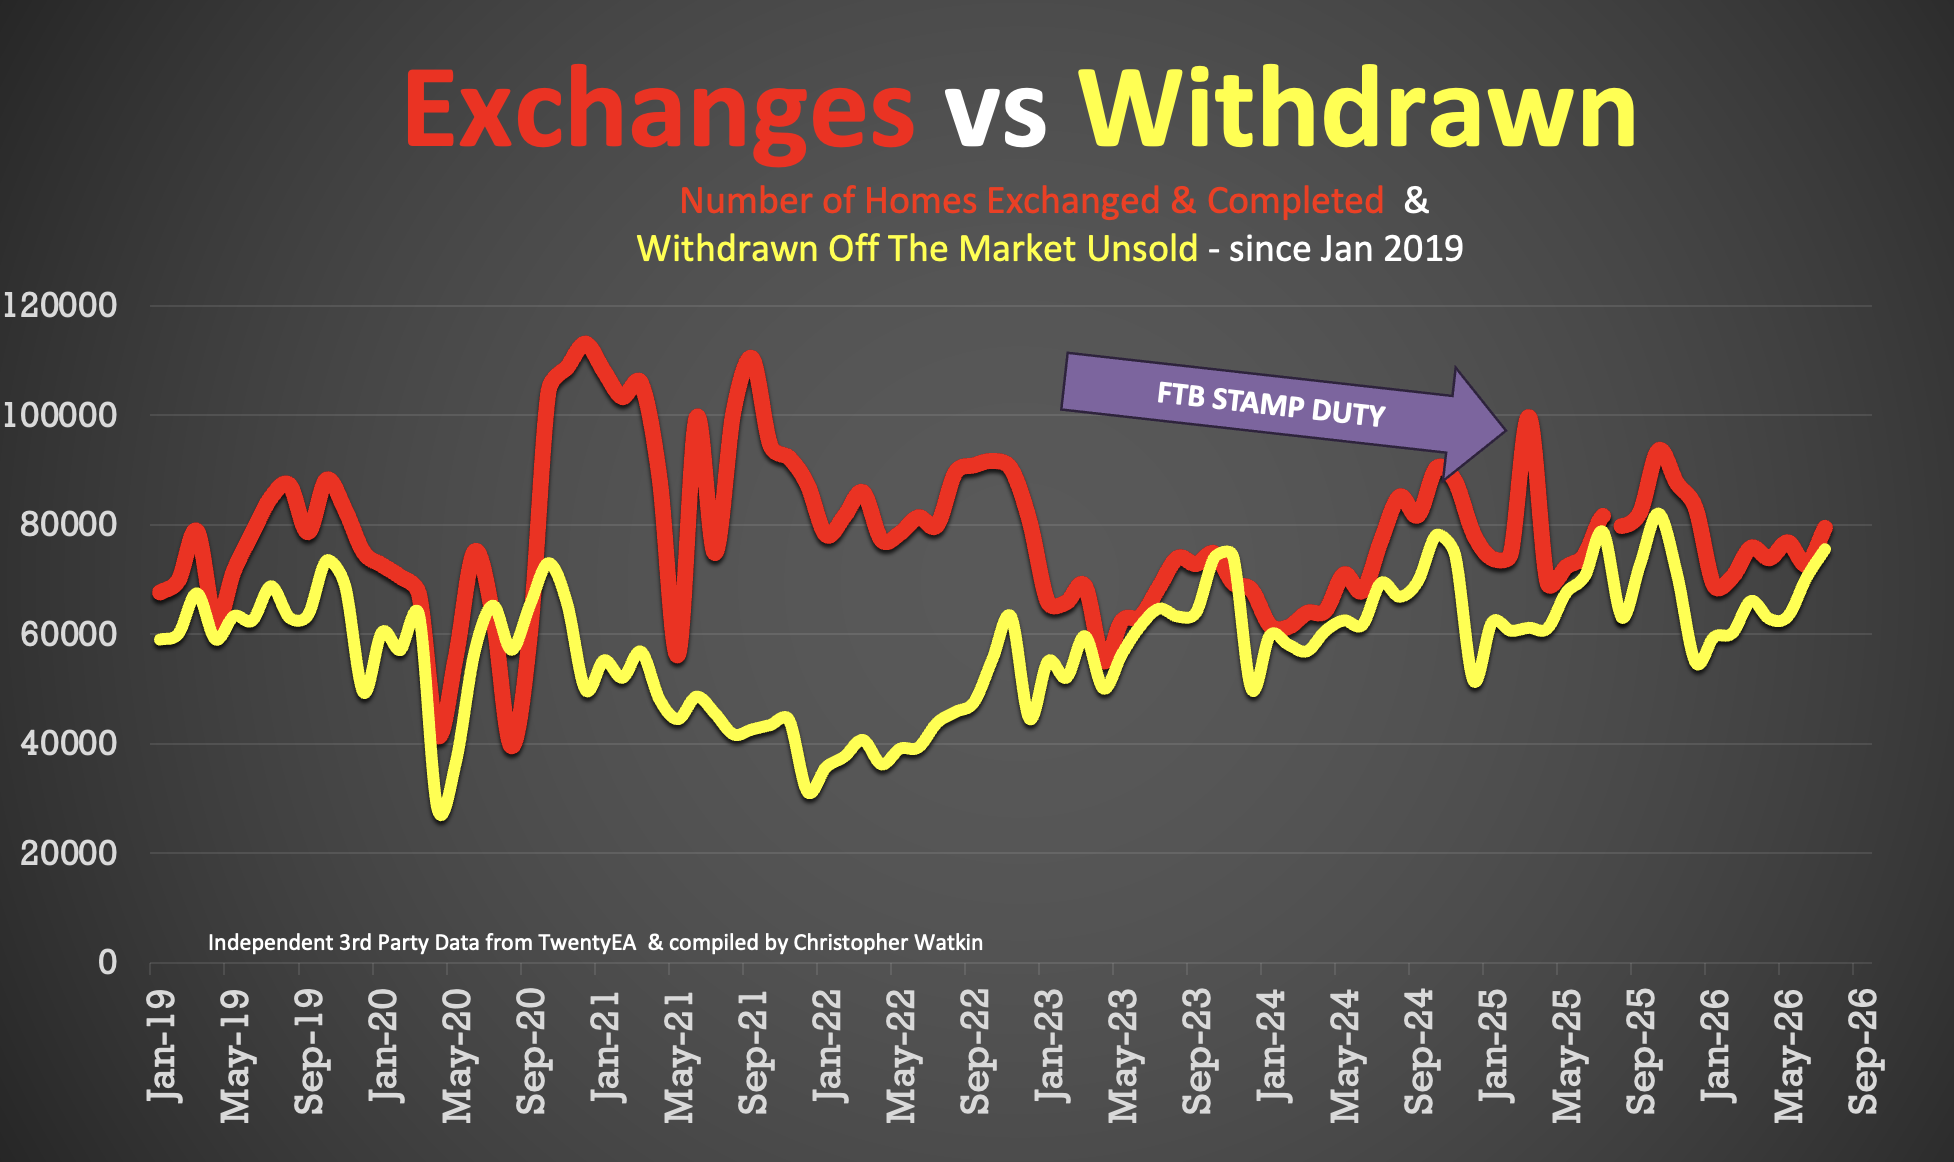
• 77.1k Exchanges in August 2026
• 63.2k Withdrawals in August 2026
(Note these numbers will change slightly as more stats from August come in)
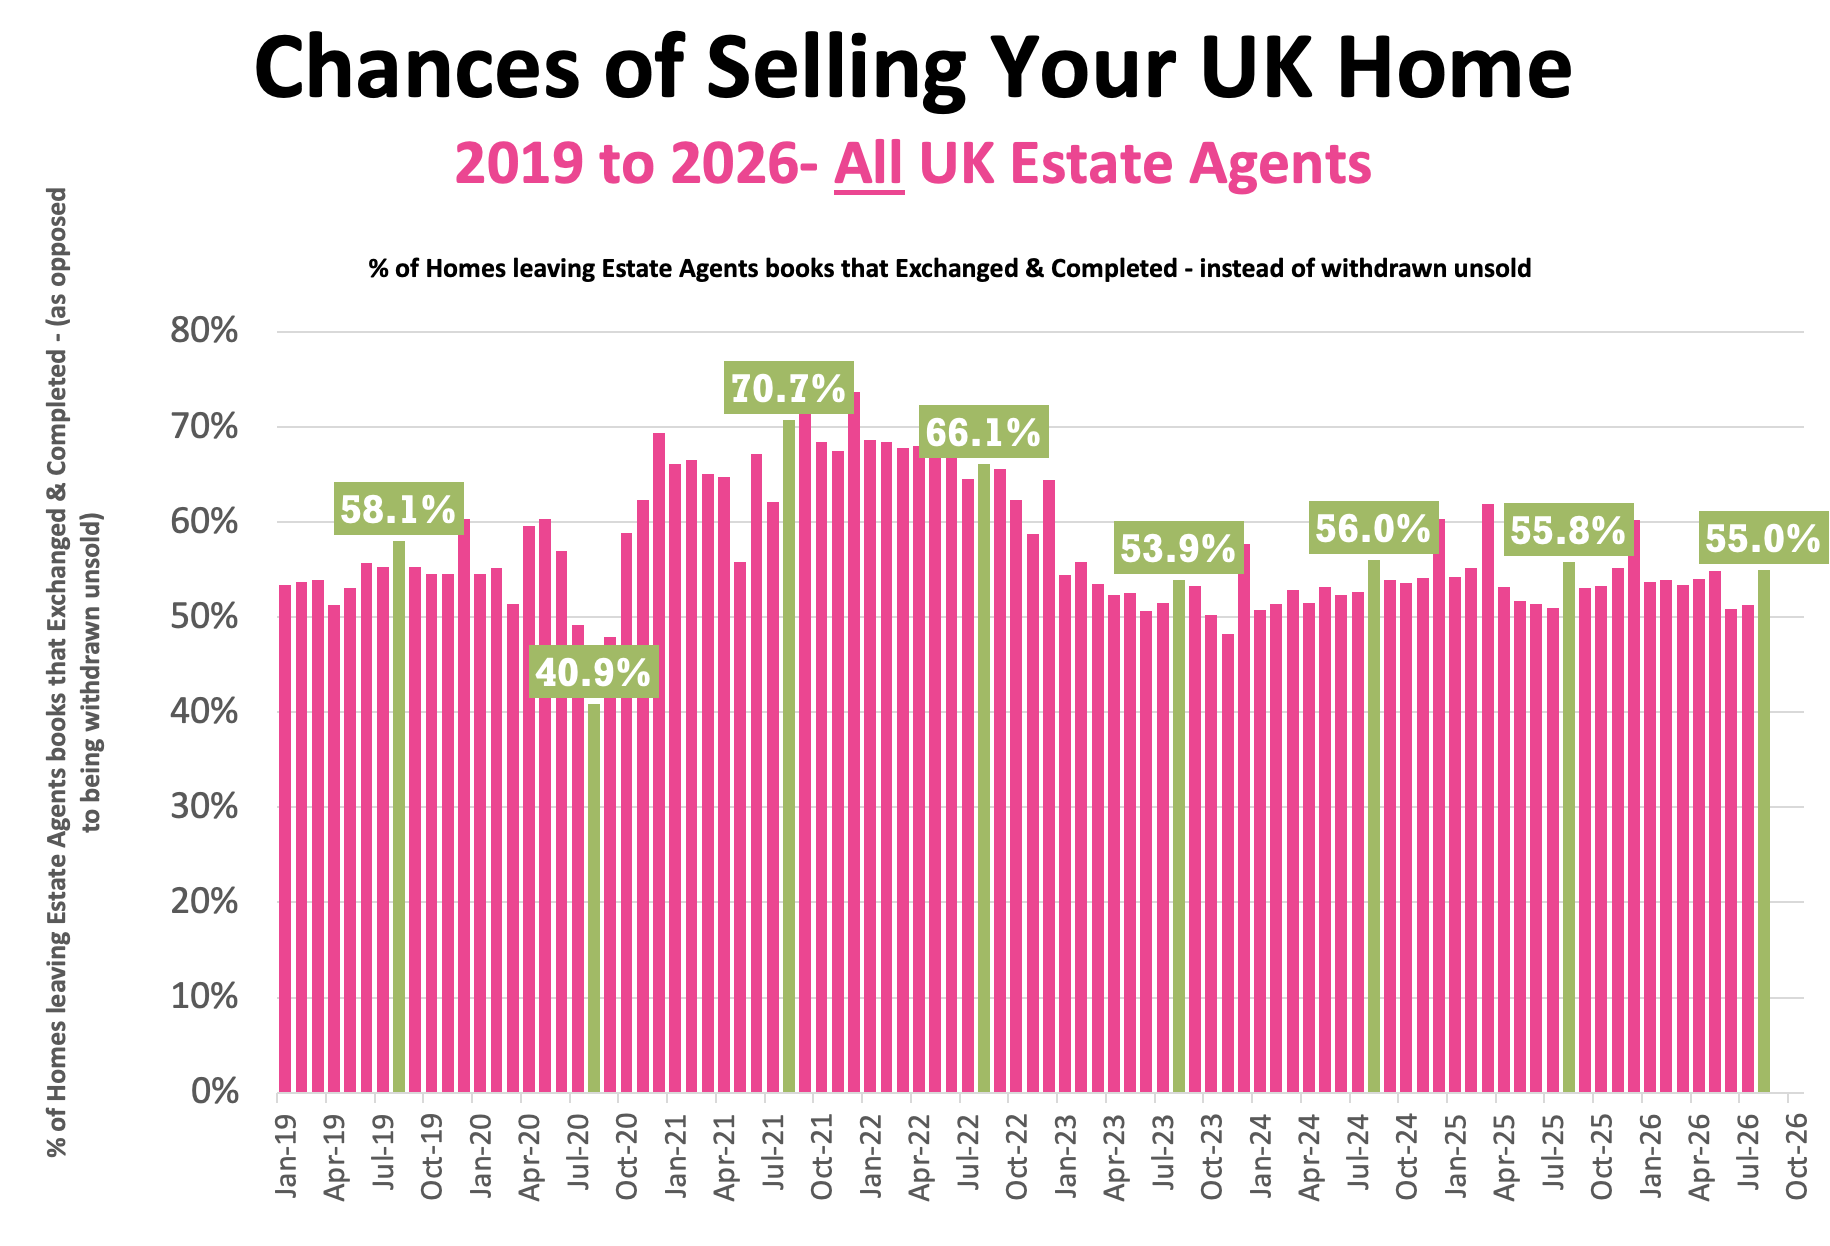
• Therefore, in August 2026, just 55% of homes that left agents’ books exchanged & completed in July (the rest – 45% withdrew, unsold)
• 57.6% is the 7 year average exchange to listings ratio (which includes the crazy years post lockdown 18 months).
Additional info …
🟥 Price Reductions
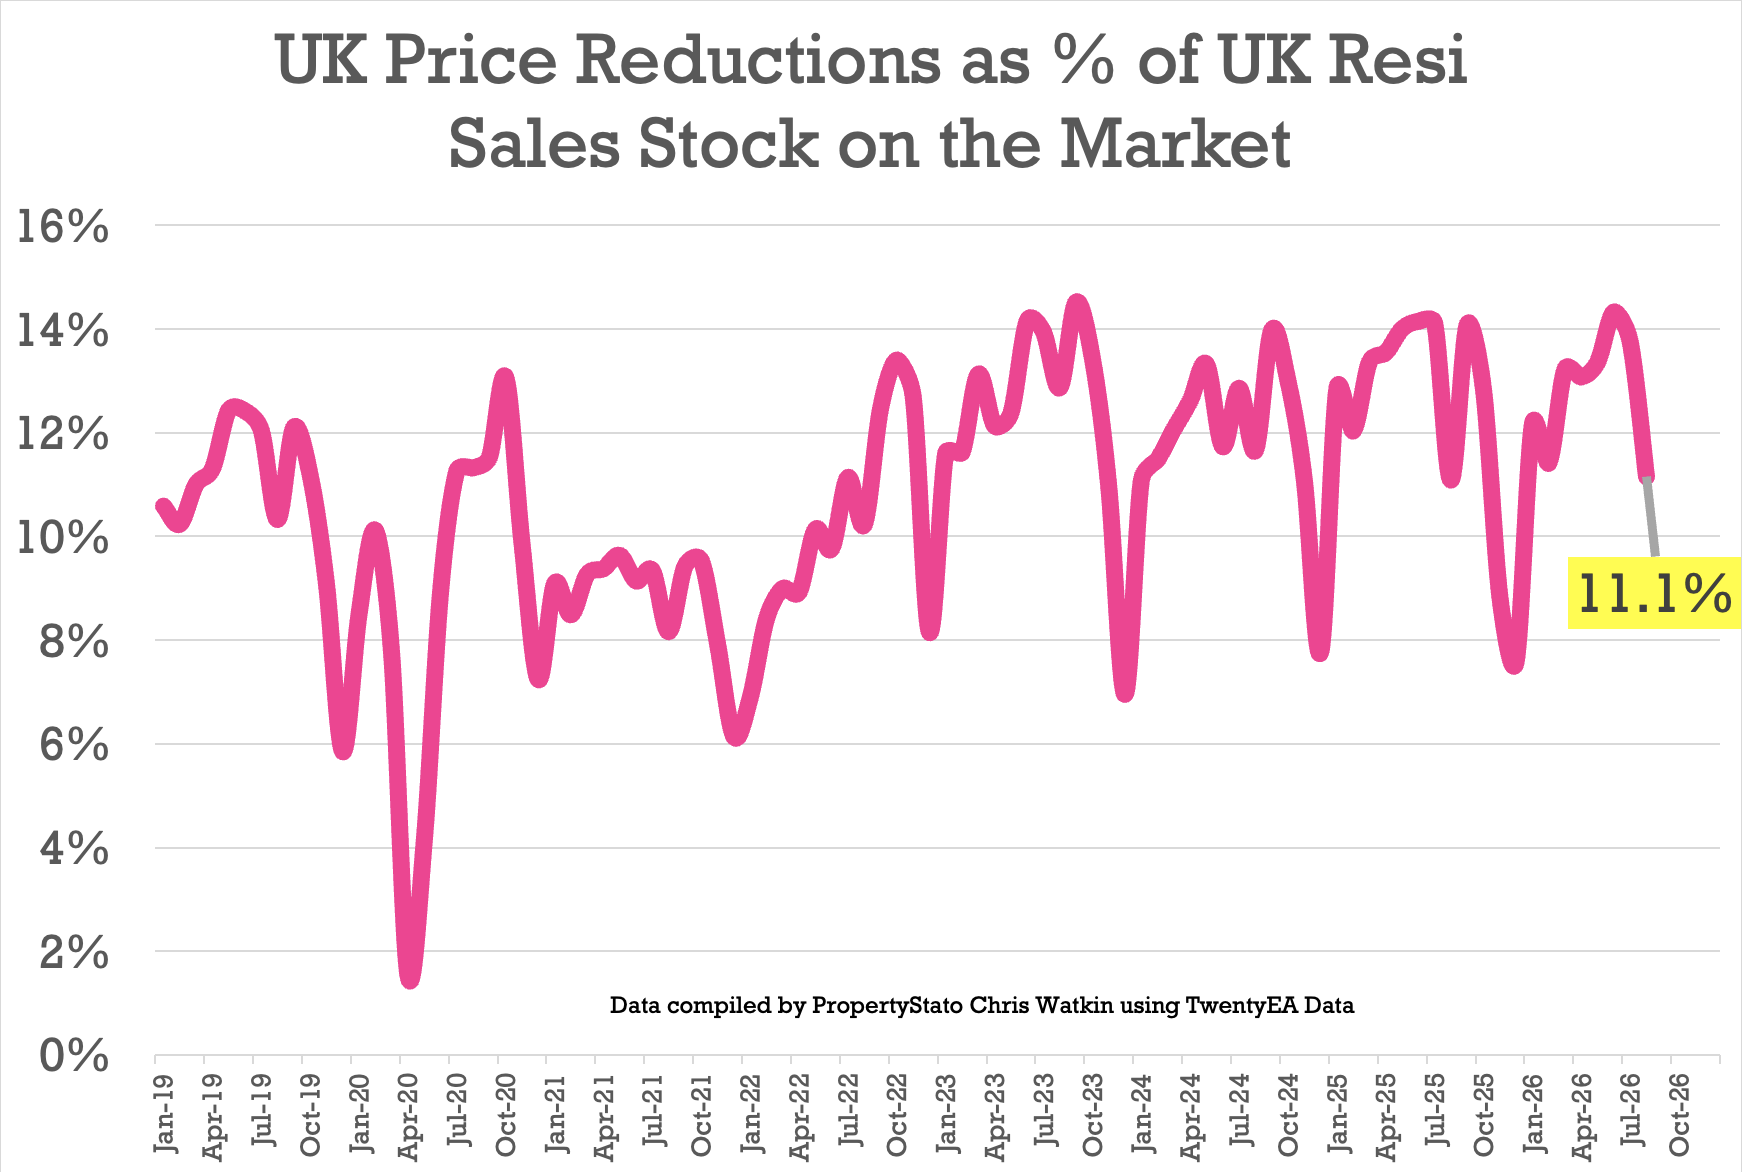
• 28.1k reductions this week on 742k UK homes for sale
• 11.1% of UK homes for sale were reduced in August (down from 13.7% in July)
• 2026 YTD average 12.8%, versus the 6 year long term average of 10.9%.
🟥 August Regional Resi Gross Sales Analysis
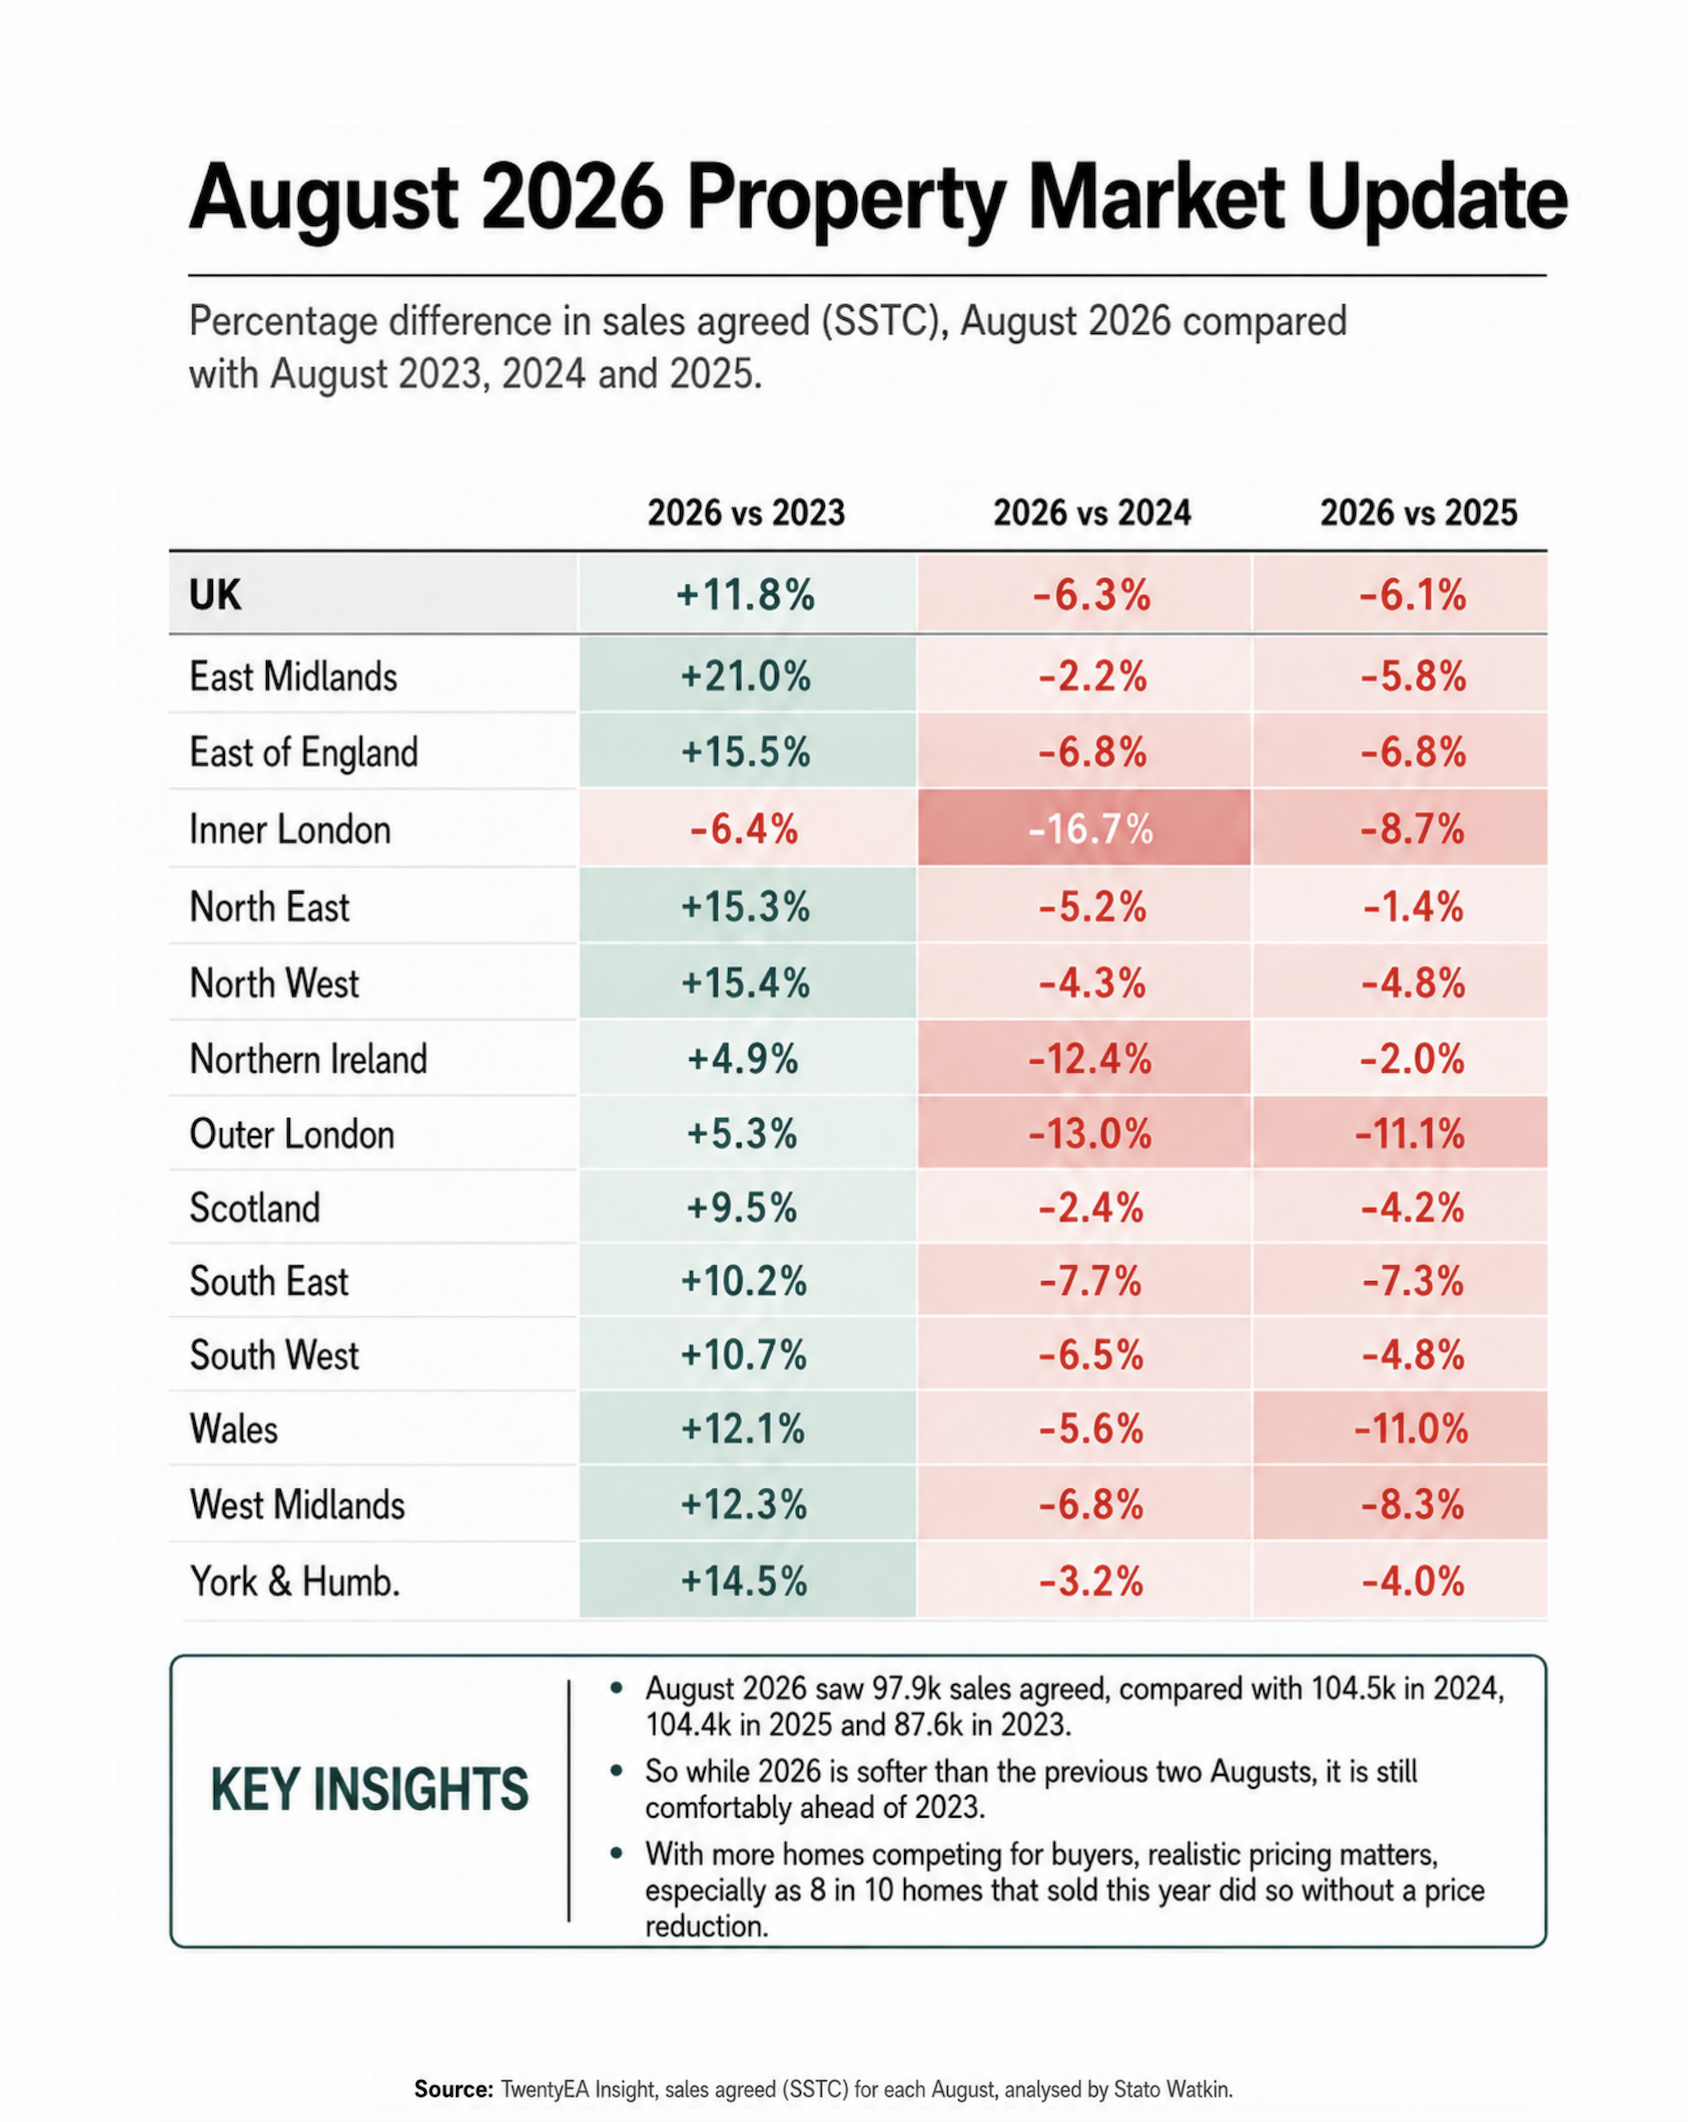
Regional Breakdown of August 2026 for Gross Resi Sales vs Aug 23/ 24 / 25 for all the regions.
🟥 Price Difference between Asking Price of Listings & Asking Price of those Homes that go Sold stc
• Week 36 – 29.2% difference (long term 10 year average is 16% to 17%). (£456k ave Listing Ave Asking price vs £353k Sale Agreed ave Asking price)
🟥 Sell-Through Rate
• 13.3% of homes on agents’ books went SSTC in August ’26 (compared to 14.2% in July ’26 & 13.8% in June ’26).
• Pre-Covid average: 15.5%.
🟥 Sale Fall-Thrus
• Week 36 Fall-thru rate 25.1%
• Decade average: 24.5%
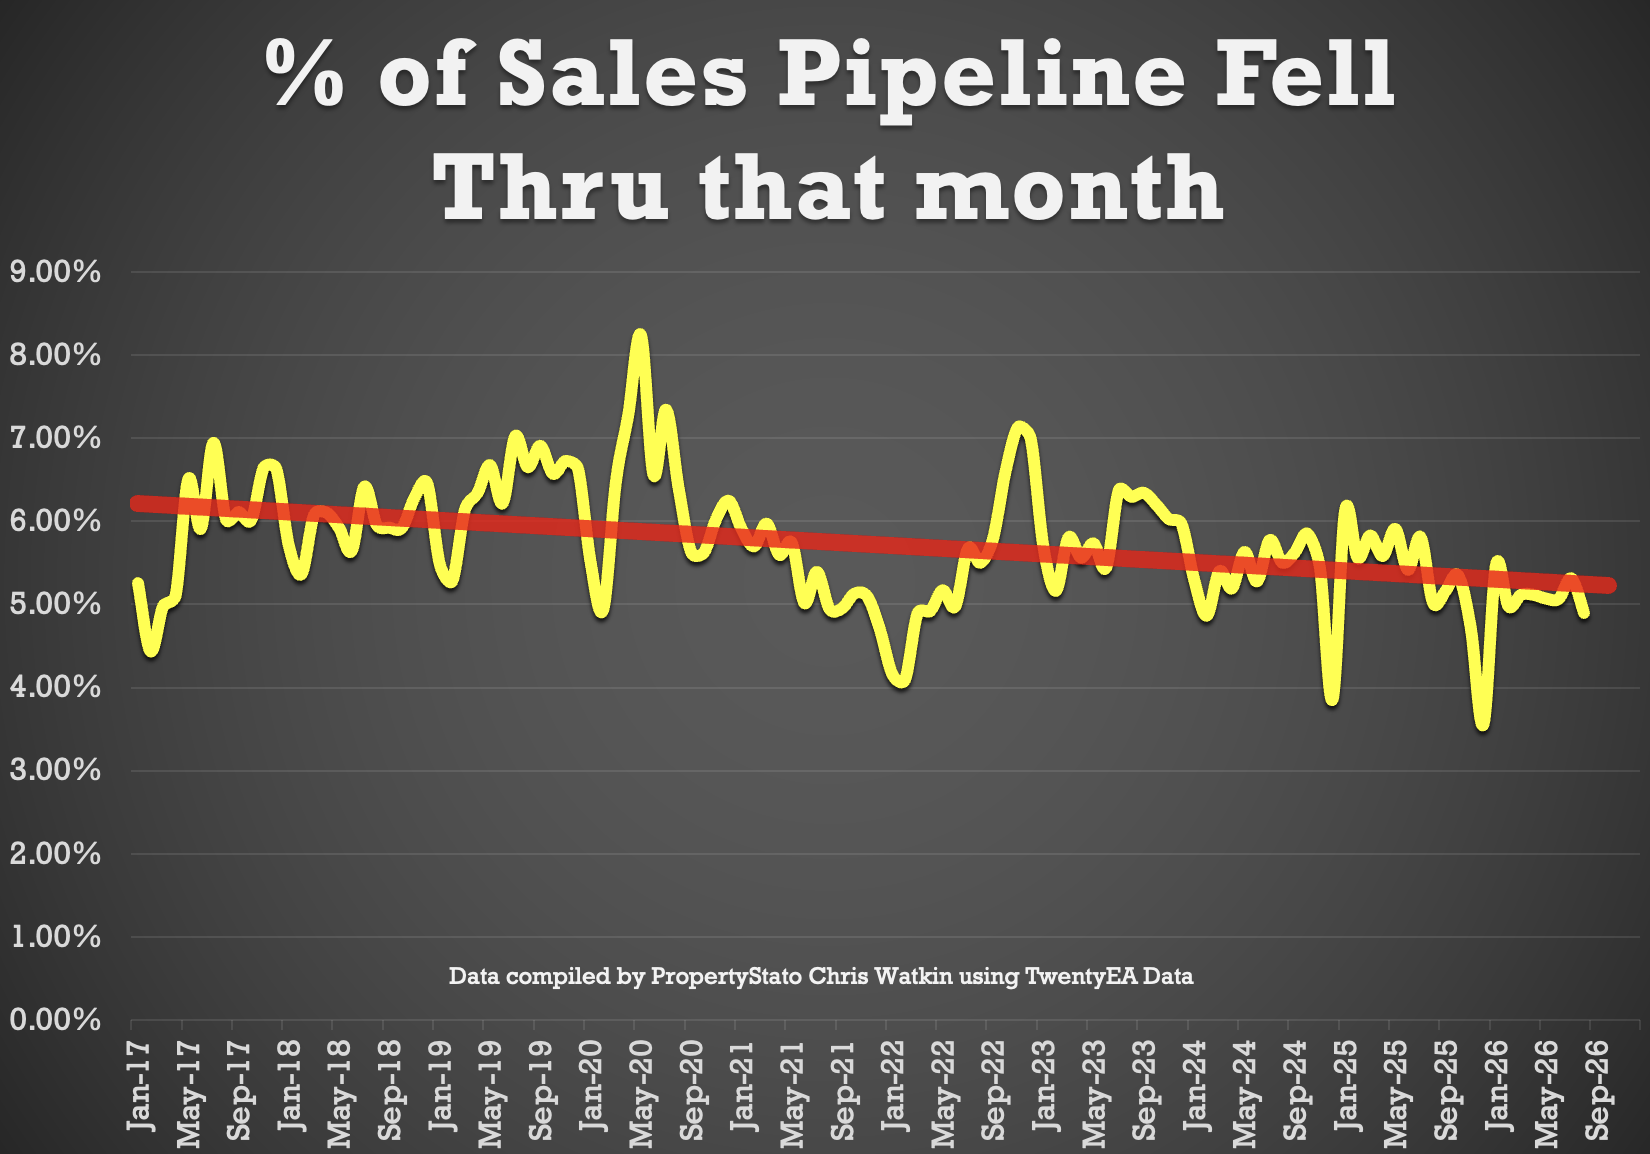
• 4.9% of homes sold STC fell thru in August 2026. Interesting when compared with the 2026 YTD average of 5.1% and 2025 average of 5.3% and the 10 year average of 5.7%.
🟥 Stock Levels
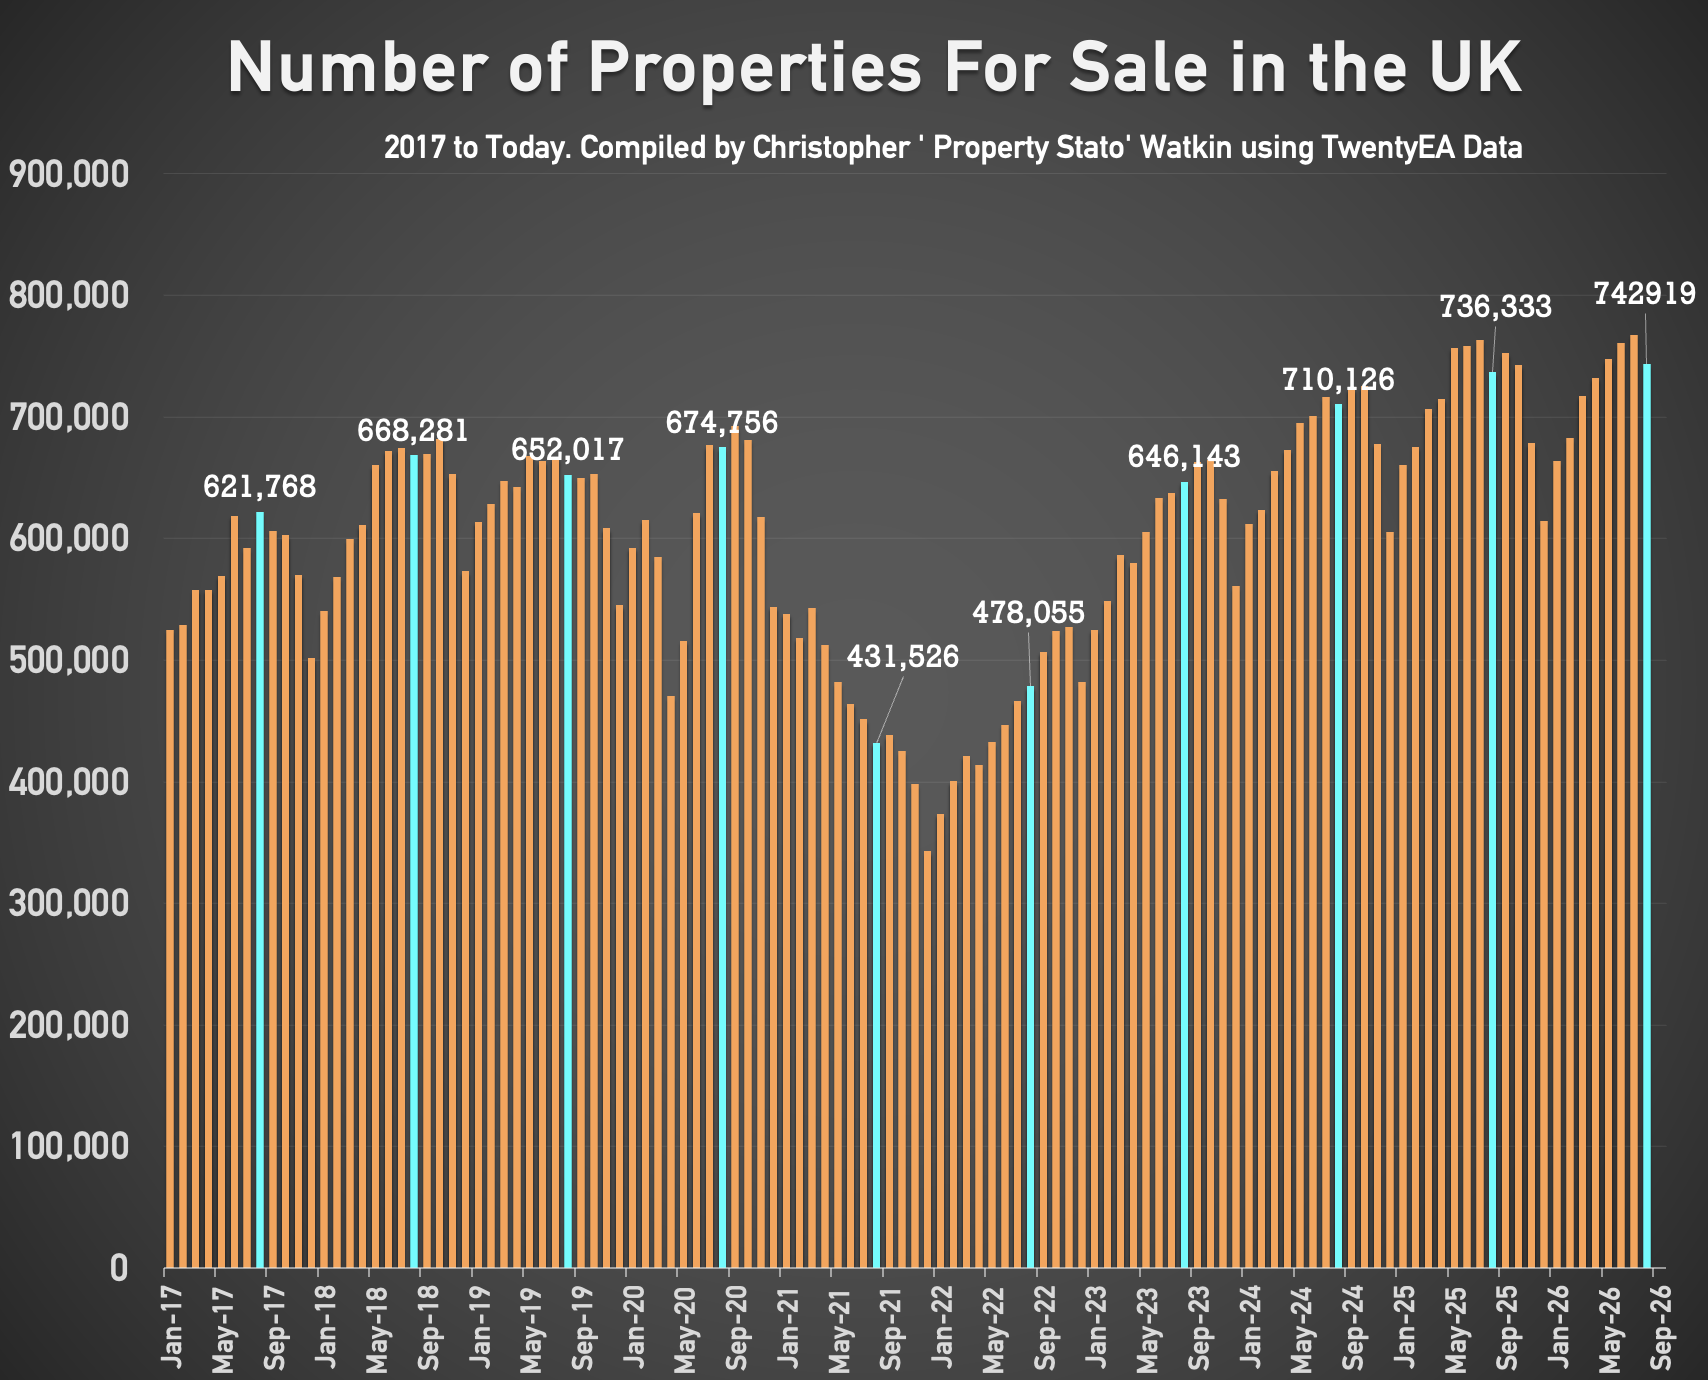
• 742k homes on the market on the 1st of Sept ’26 (767k the month before and 736k 12 months ago)
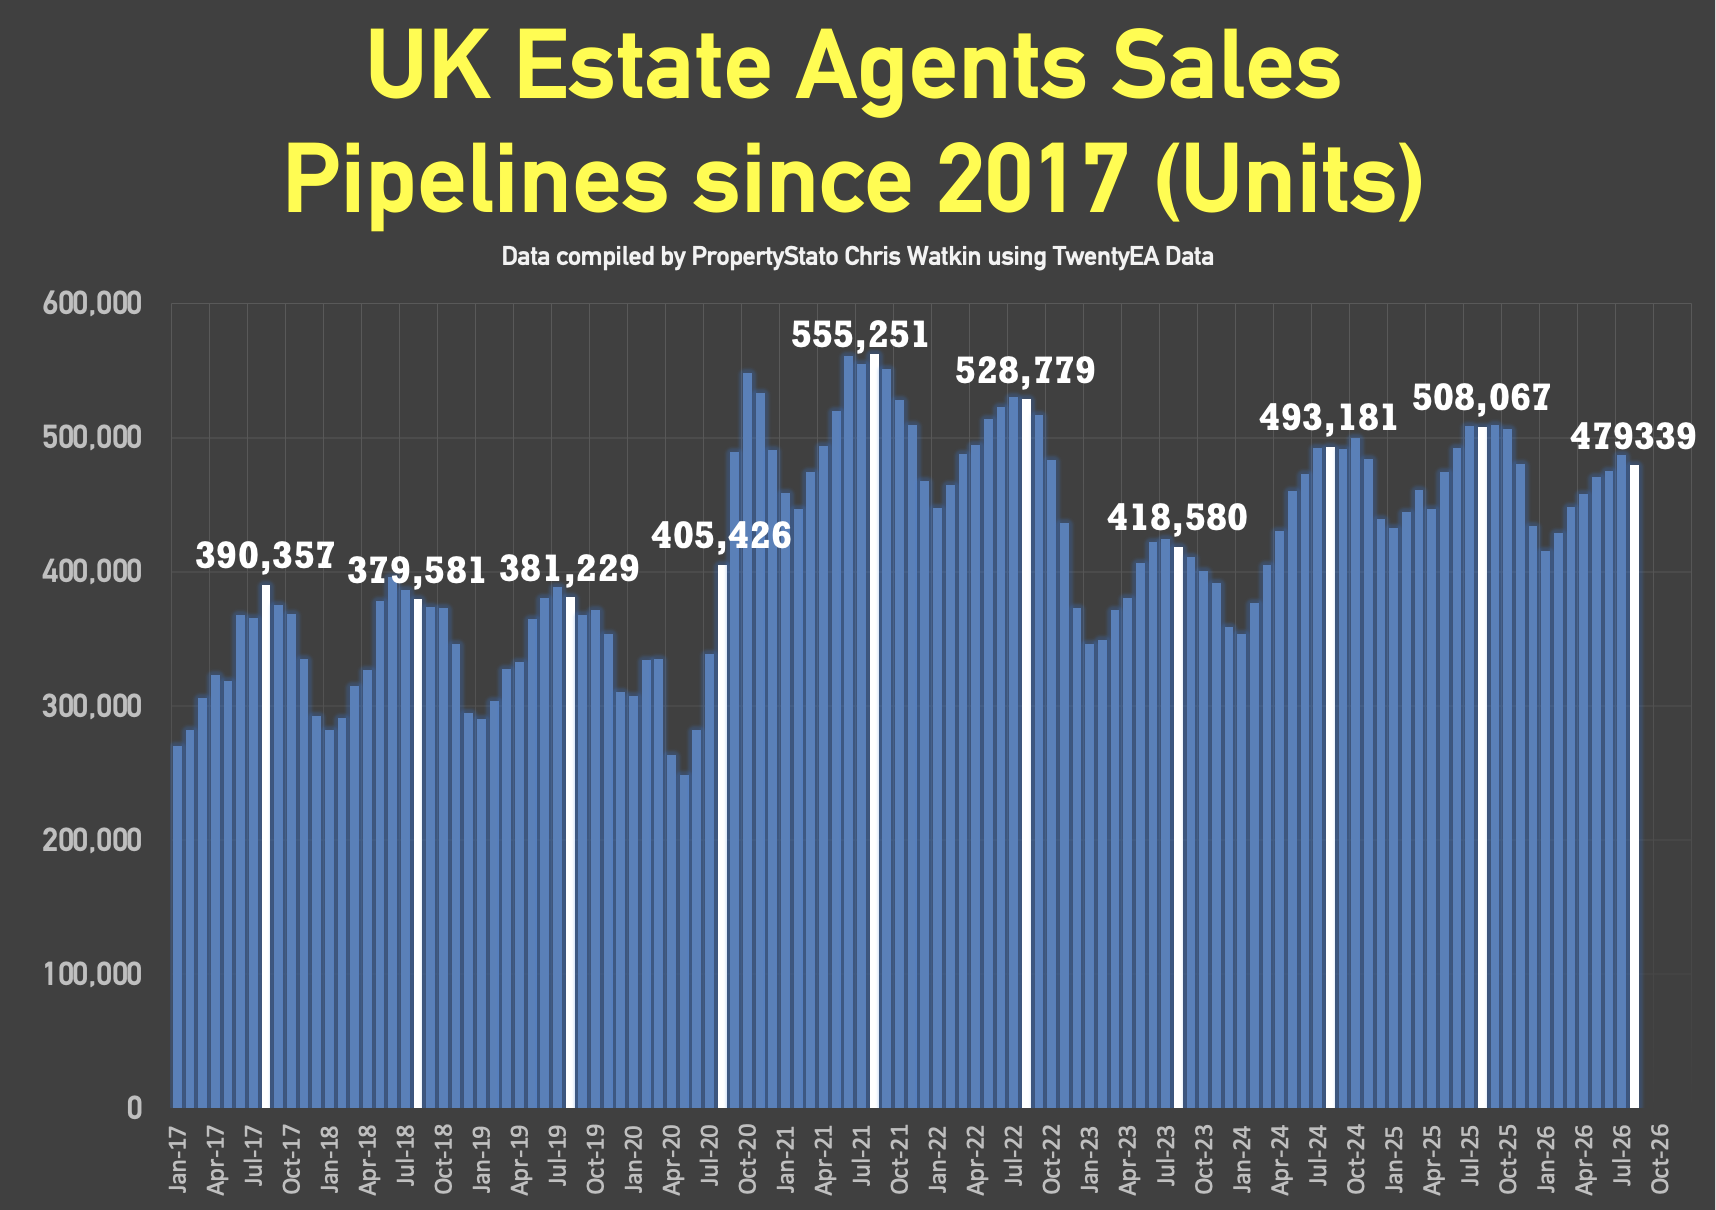
• 479k homes in agent’s sales pipeline on the 1st Sept 2026, lower than 12 months ago on 1st Sept ’25 (508k).
🟥 House Prices (£/sq.ft)
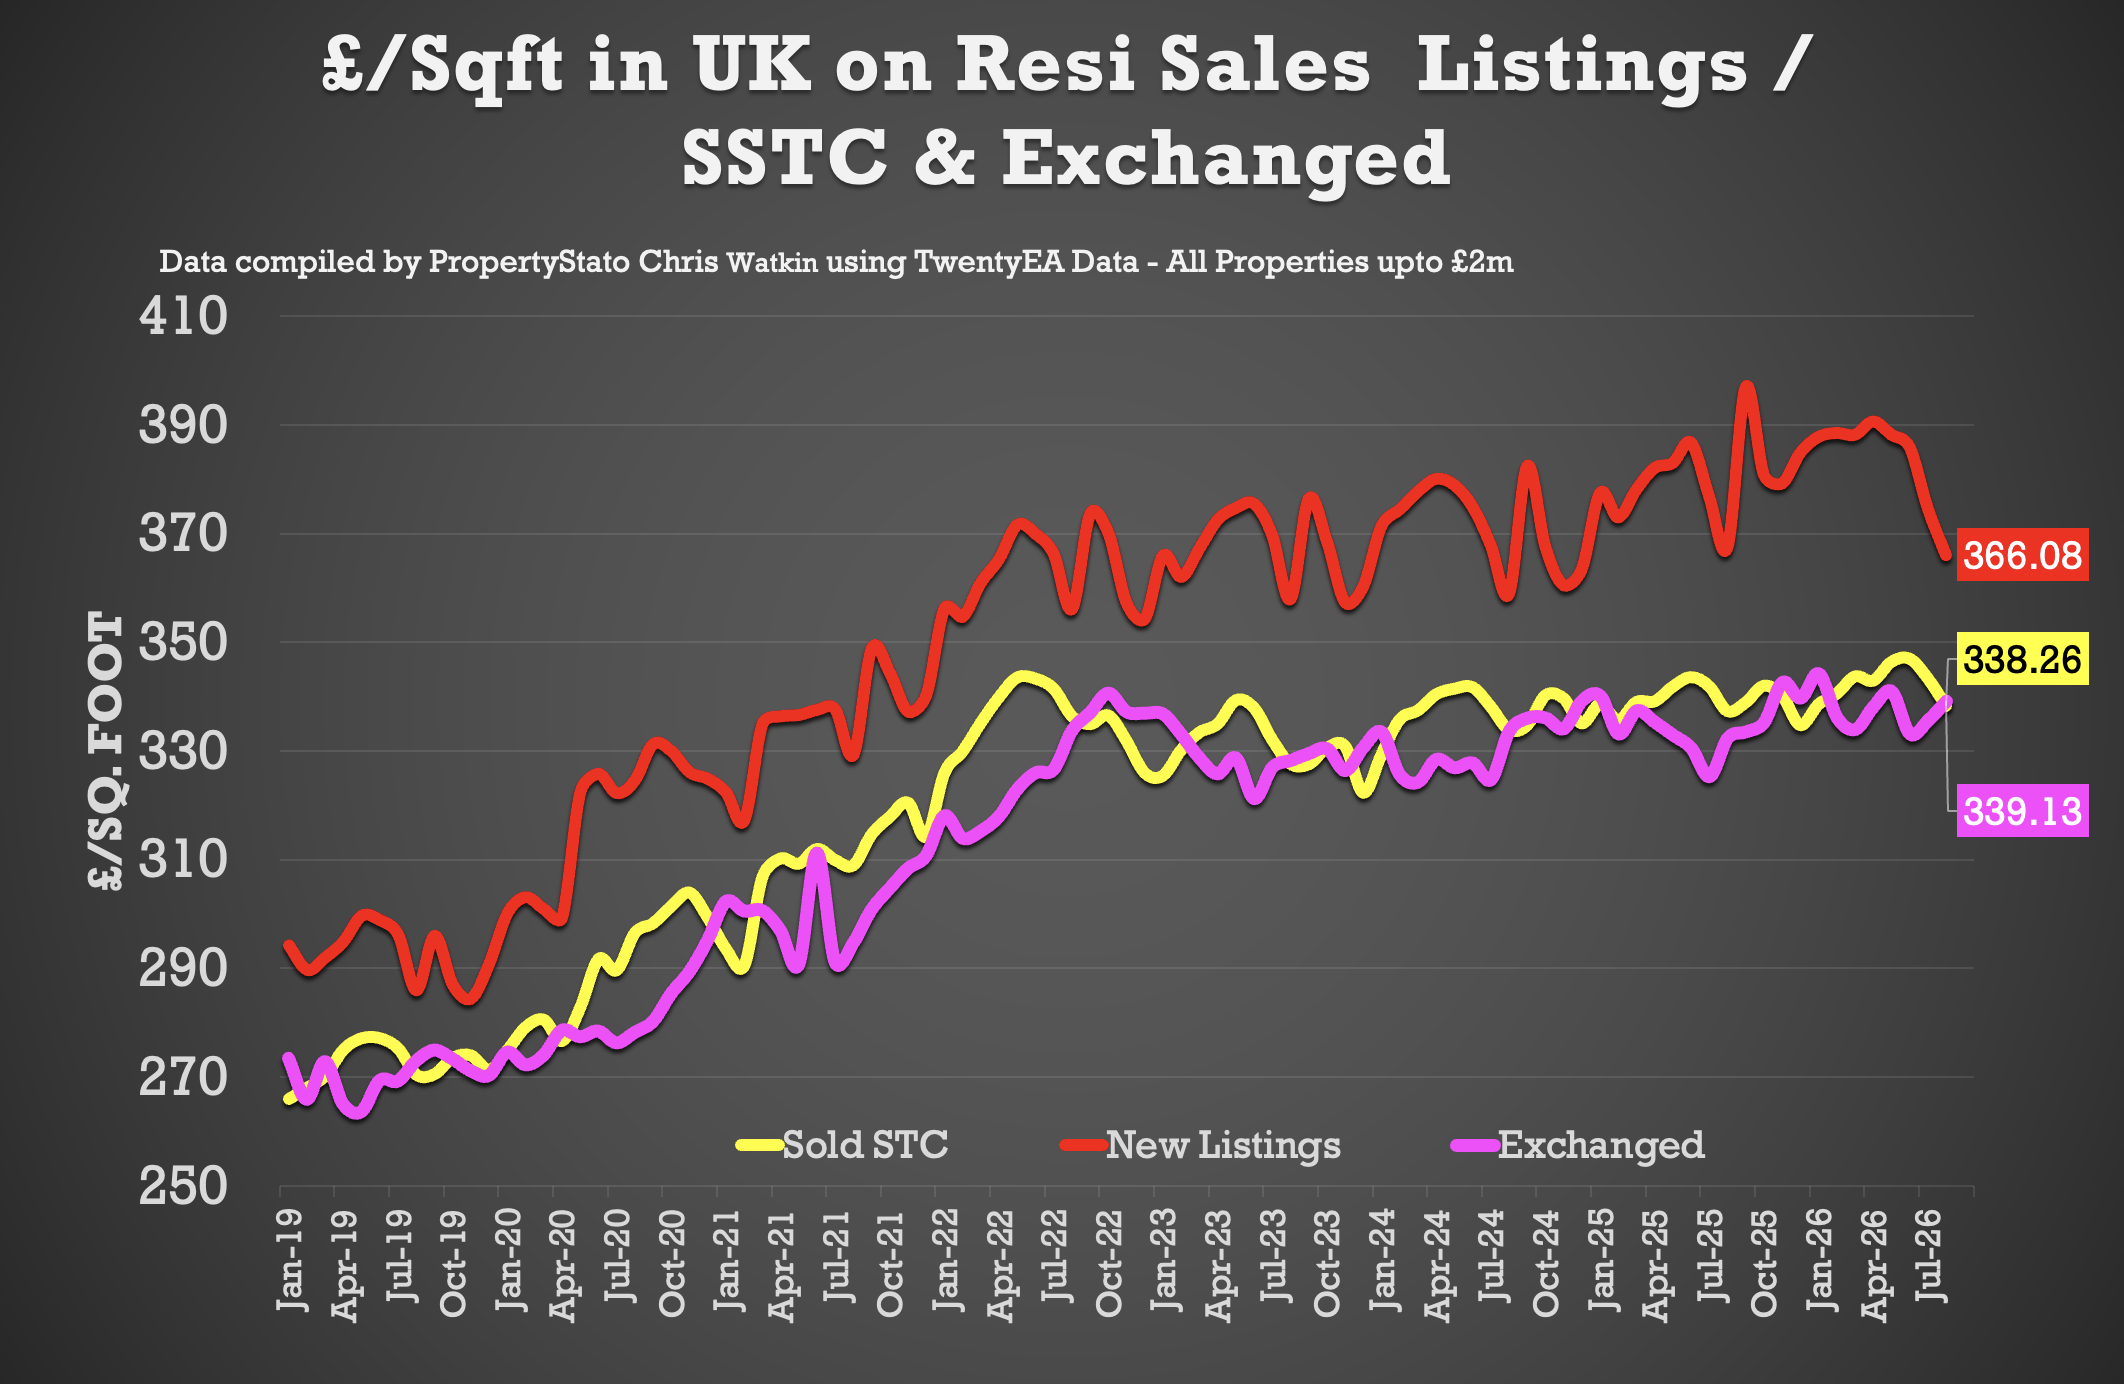
• August ’26 agreed sales averaged £338.41 per sq.ft. 0.3% higher than 12 months ago (£337.28) and 9.5% than 5 years ago (£308.91). The £/sqft at sale agreed matches the HM Land Registry Index with a 98% accuracy, 5 months in advance. That is why it is so important.
🟥 UK Rental Data
• Average Rent in Wk 36 – £1,794 pcm
• Average Rent in Sept 2026 – £1,766 pcm
• Average Rent in Sept 2025 – £1,791 pcm
• Average Rent in Sept 2021 – £1,390 pcm
• Average Rent in YTD 2026 – £1,765 pcm
• 302k UK Rental Stock available to rent in Sept 26 (357k in August 2025)
• New Rental Properties coming onto the market in August 2026 – 120,100. (115,584 in August 2025 & 106,982 in August 2022)
🟥 Local Focus this week in the Show
Weymouth