

The number of properties listed for sale with estate agents has dropped by a fifth in the last year, new research show.
 In January 2021, estate agents across England and Wales had an average of 33 properties on their books. This included both available properties and those sold subject to contract. Last month, that figure had fallen to an average of 26 properties.
The figures, which are based on more than 4,000 market appraisals, also recorded the percentage of properties on the market that were sold subject to contract.
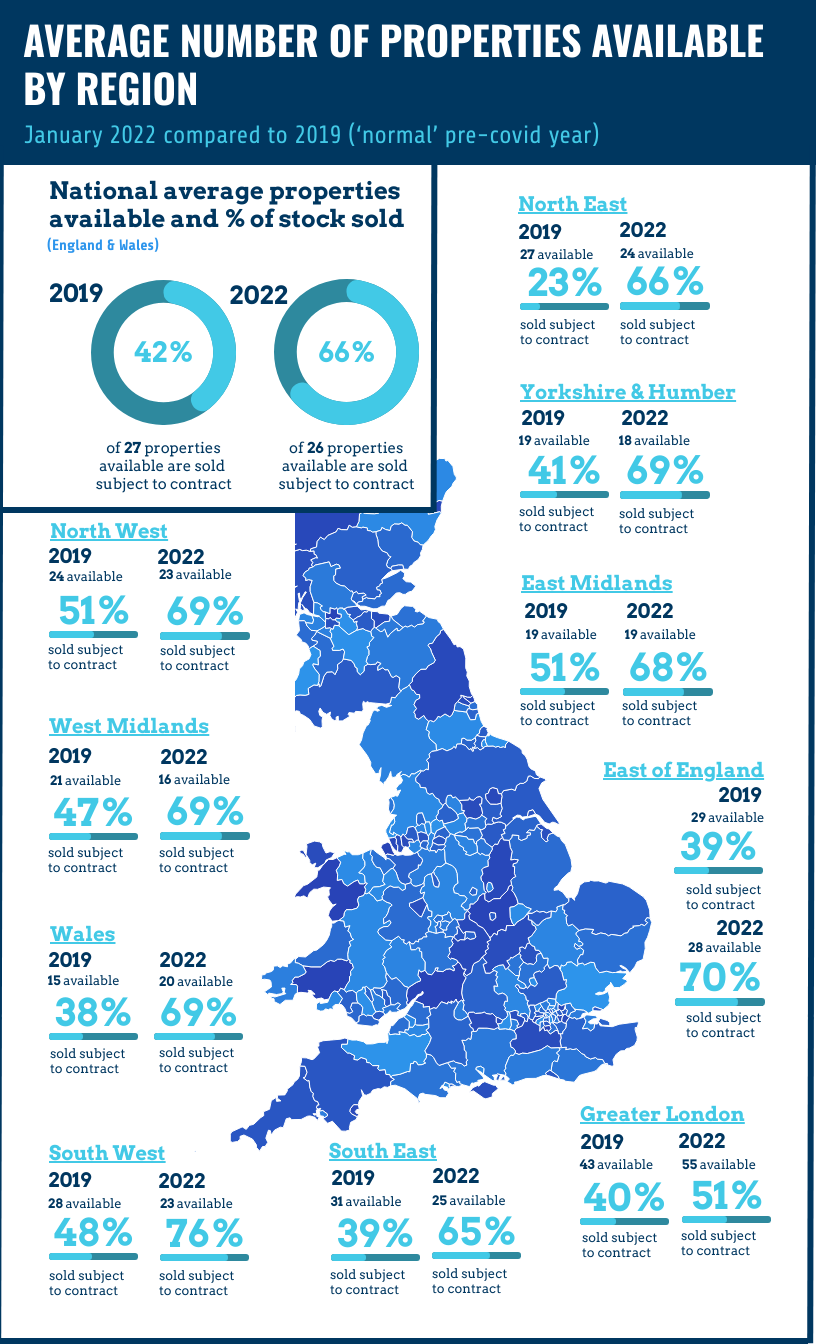
In January 2019, an average of 42% of properties were sold subject to contract. In January 2022, that figure had risen to 66%; a rise of 24 percentage points.
Danny Luke, from Quick Move Now, which provided the data, said: “These figures tell a really interesting story about what is happening in the property market in England and Wales.
“We intentionally compared the most recent figures with those from January 2019, as an example of a ‘normal’ pre-Covid year, to measure the impact that the pandemic and its resulting measures have had on market conditions.
“As you can see from the figures, the number of properties coming to the market has fallen significantly in most areas, and nationally we’ve seen a fall of 21%.
“Every region of England and Wales has seen significant rises in the percentage of housing stock that is sold subject to contract. This demonstrates high demand for property, despite rising interest rates, rising property prices and significant increases in the cost of living.
“Many property experts predicted a stabilising of property prices or perhaps even a slight fall in prices in the first part of this year, but that price correction is yet to materialise, despite mounting external pressures.”
Average number of properties on the market per estate agent (including those sold subject to status)
| Region | Average number of properties on market
January 2019 |
Average number of properties on market
January 2022 |
Change |
| East of England | 29 | 28 | -3% |
| East Midlands | 20 | 17 | -15% |
| Greater London | 43 | 55 | +28% |
| North East | 25 | 24 | -4% |
| North West | 24 | 23 | -4% |
| South East | 31 | 25 | -19% |
| South West | 28 | 23 | -18% |
| Wales | 15 | 20 | +33% |
| West Midlands | 21 | 16 | -24% |
| Yorkshire and the Humber | 19 | 18 | -5% |
Percentage of properties that are sold subject to status
| Region | % of stock SSTC January 2019 | % of stock SSTC
January 2022 |
% Difference |
| Whole of England and Wales | 42% | 66% | +24 percentage points |
| East of England | 39% | 70% | +31 percentage points |
| East Midlands | 51% | 68% | +17 percentage points |
| Greater London | 40% | 51% | +11 percentage points |
| North East | 23% | 66% | +43 percentage points |
| North West | 51% | 69% | +18 percentage points |
| South East | 39% | 65% | +26 percentage points |
| South West | 48% | 76% | +28 percentage points |
| Wales | 38% | 69% | +31 percentage points |
| West Midlands | 47% | 69% | +22 percentage points |
| Yorkshire and the Humber | 41% | 69% | +28 percentage points |

“We intentionally compared the most recent figures with those from January 2019, as an example of a ‘normal’ pre-Covid year, to measure the impact that the pandemic and its resulting measures have had on market conditions.”
Why compare apples with grapes? Or anything with anything that are fundamentally different for that matter?
The figures of January 2019 bear no relation whatsoever to the figures of January 2022. And they say they wanted a “pre-Covid year” – so why didn’t they look at January of 2020 for their (still-unreliable) yardstick?
Without numbers, this all means nothing. How many Agents (branches, I assume they mean…)? How many properties?
Let’s look at “numbers”. According to the above, at the end of 2022 Agents had one less property on their books per branch than they did at the end of January 2019. On first look that represents a “fall” of less than four percent from what is suggested to be a normal market’ – sorry but this is hardly earth-shattering news.
But of course it’s the unknown factors that are the real key here. Without knowing how many Estate Agents were counted, or the total number of properties they had divvied equally between them to spout the numbers, there is no way whatsoever of knowing how much better or worse the market really is. For example:
2019 – 27 properties per branch x 20,000 branches equates to a total of 540000 properties
2022 – 26 properties per branch x 20,000 branches equates to a total of 520000 properties. So hardly comparing a feast and a famine – 20k properties spread over the UK is less than one property per forty streets! – and a literal drop in the ocean in a nation where there is a total housing stock of over 24.5 million dwellings.
But – aren’t there more Agents now than there were in 2019? According to last week’s news on EYE, some 5600 ‘new’ Agencies sprung up last year. So that’s 5600 x 26 – 145,600 properties to add to the 2019 total, plus/minus any change in the numbers during 2020.
Statistics do one thing and one thing only – satisfy the agenda of the person, company or body quoting them. This is nothing but prima facie proof of that pudding.
You must be logged in to like or dislike this comments.
Click to login
Don't have an account? Click here to register