
Apparently, someone has put a ‘Closed until further notice’ sign in the window of the UK property market. Yet the buyers must have missed the sign as they are still agreeing sales in serious numbers.
Mind you, that is little comfort when you have spent six weeks holding a chain together, it falls apart on Thursday and that money was going to pay the negs’ wages next month.
It also takes some nerve to sit in a homeowner’s living room, tell them what their house is likely to fetch and then drive past it a week later with another estate agent’s board outside. Especially when the only thing that agent did differently was promise them £25,000 more.
I understand the temptation to be the agent who promises the extra £25k next time. But what are you going to say to that homeowner twelve weeks later? Its really tough at the moment being an agent at the moment, yet lets be frank, when hasn’t it been?
In the show I tell agents like it is. Some might say tough love. Some might say disrespectful. I say you need
someone to understand your pain, yet also someone willing to risk your anger by telling you the truth. It’s tough, but you make things better, but that has to start with you. I can show some tried and tested techniques that cost nothing to do and are guaranteed to work to get you called out to more free vals and stop you losing listings to overvaluing & cheap fees.
This week in the show, Rob Smith, boss of Hunters and Northwood joins me on the UK Property Market Stats Show. We look at how many homes are going under offer/ sale agreed across the UK and ask a question worth putting to anyone who says the market is to blame for a quiet month.
How much of estate agents problems are to do with the market and how much is within our control? The Budget and the headlines about the Gulf give buyers plenty to think about. But neither explains why we cut our fee before the homeowner even asked. Or why, after three weeks without a viewing, every Neg in the branch knows the asking price needs discussing, yet the Lister has gone into Witness Protection and wont contact the home seller to get the price down. Winning the instruction feels good. Selling the bl**dy house is what the homeowner hired us for!
If you have had a tough month, watch this week’s show with Rob and myself on YouTube. Then have a look down your stock list and ask yourself one question.
Which homeowner would be better off if I picked up the phone today?
Here are the Stats for week 45 (Week ending Sunday 15th November 2026).
🟩 Listings
Week 45 ..
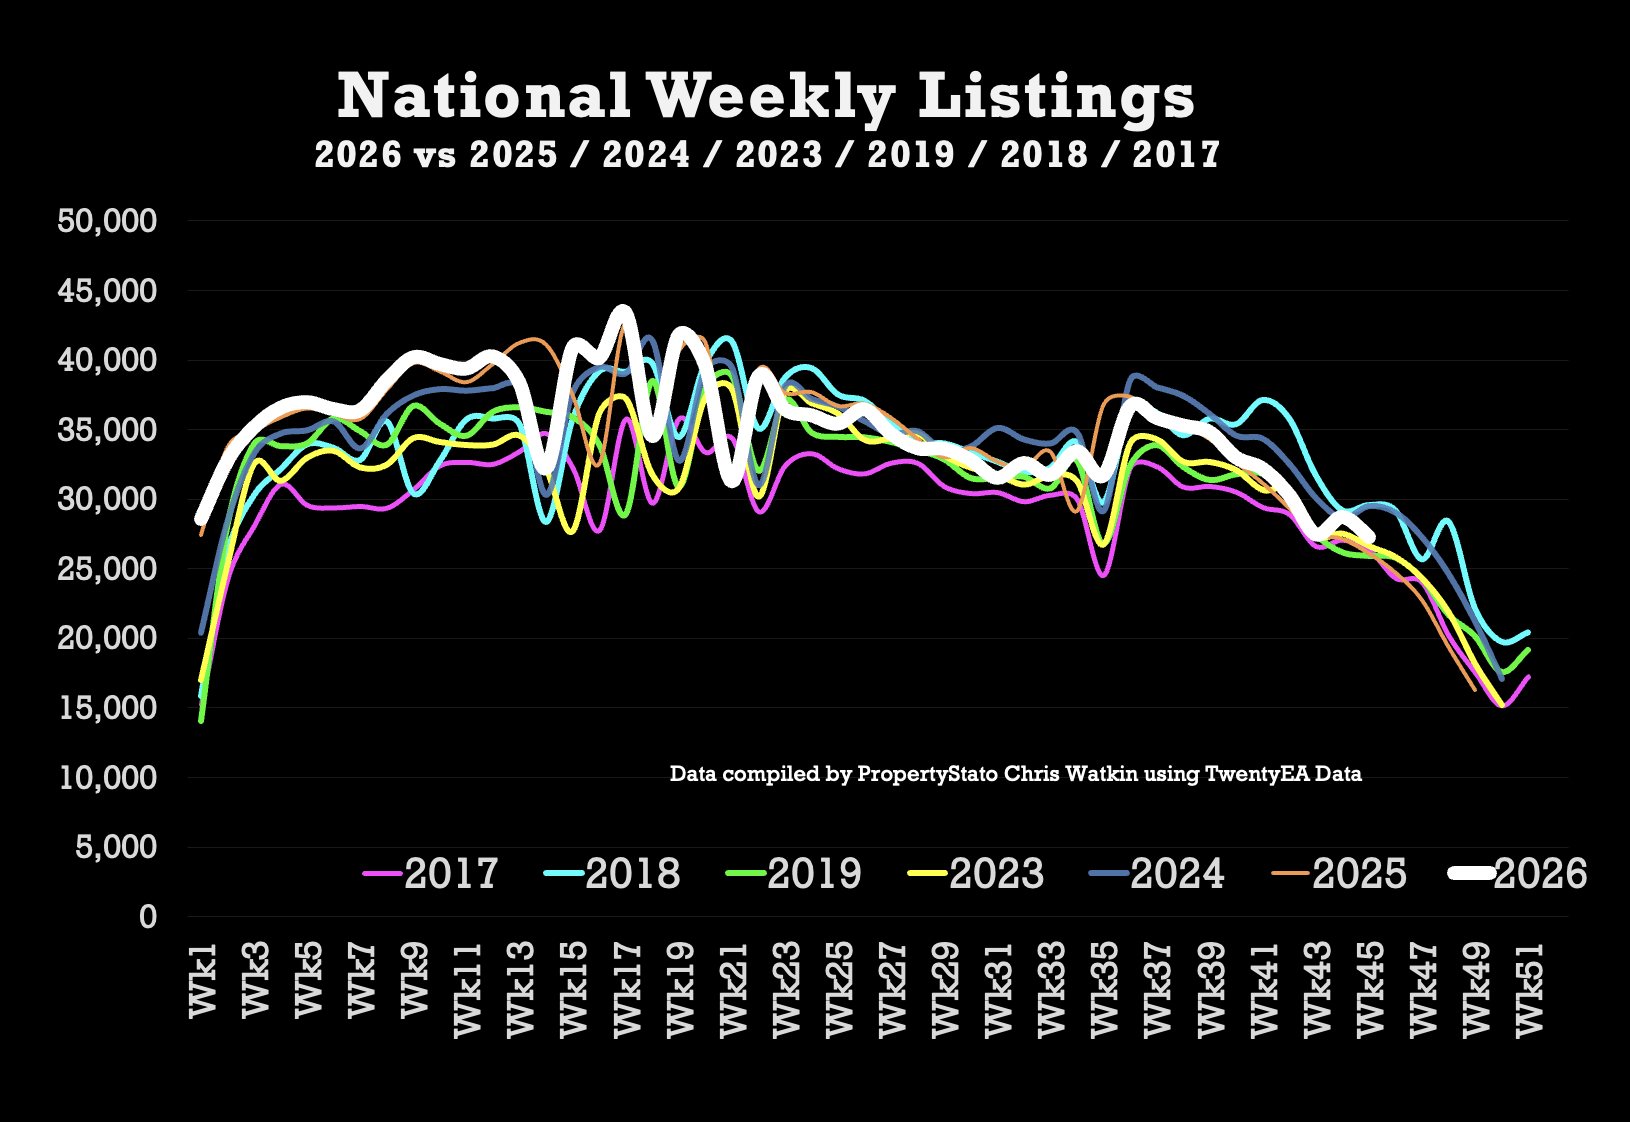
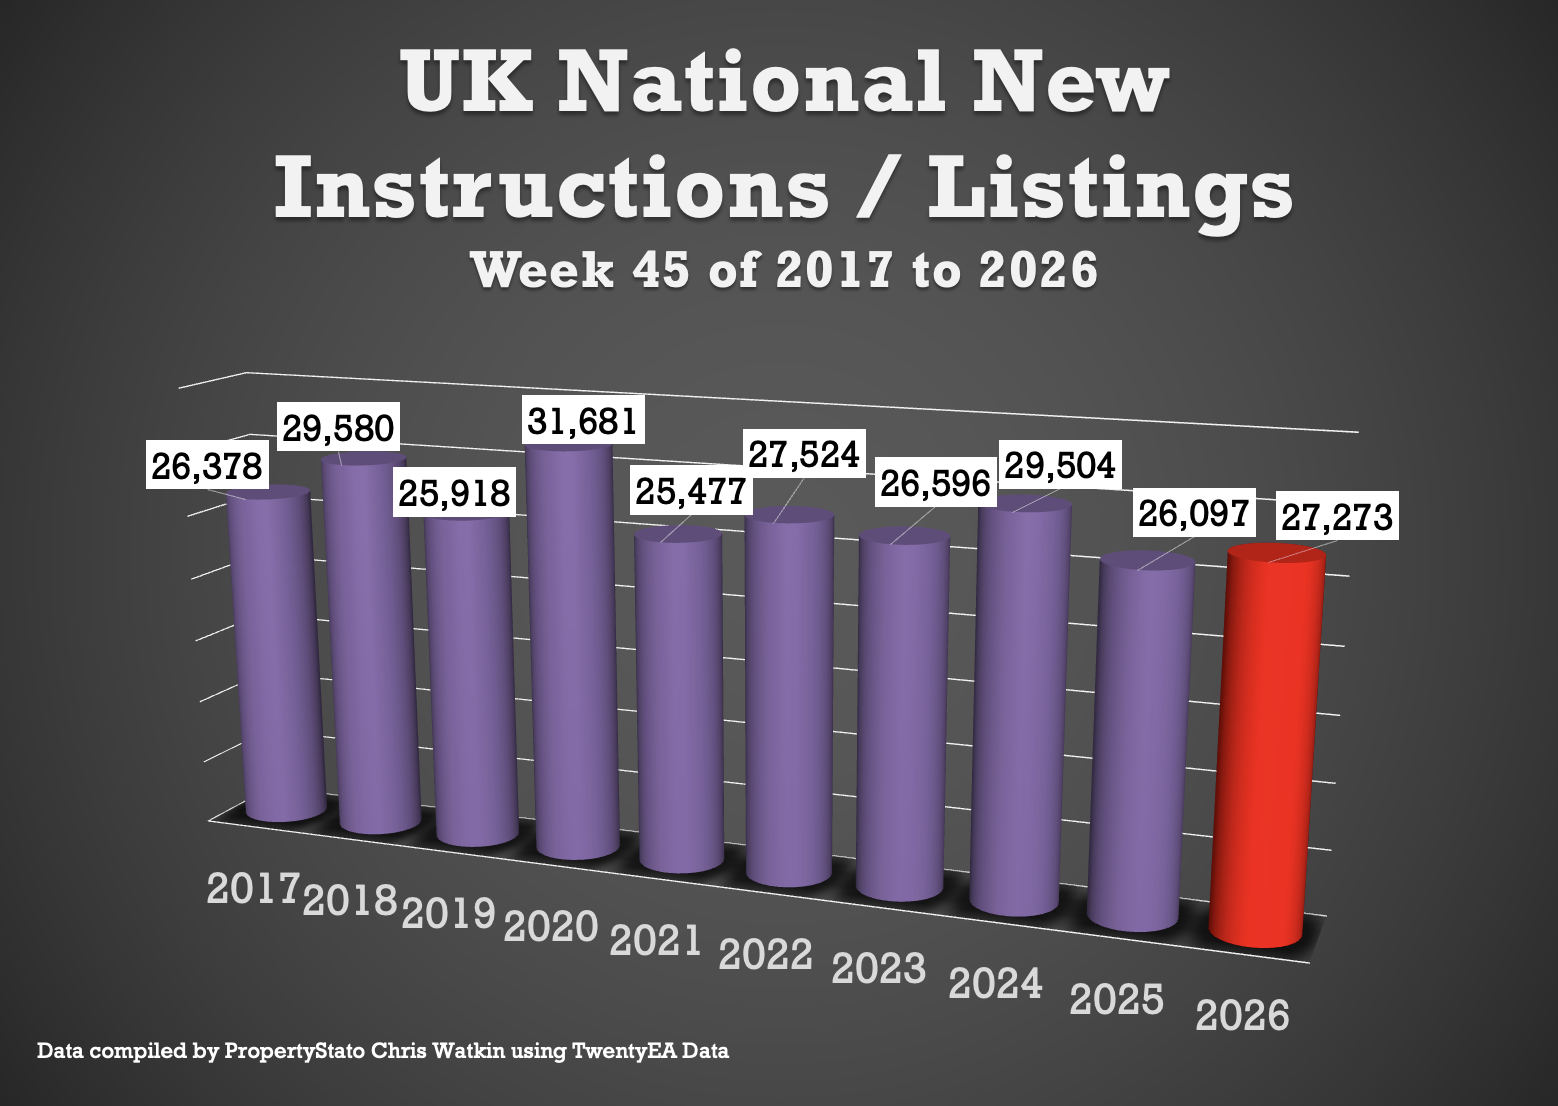
27.3k new listings this week, (28.7k last week).
Weekly 2026 average : 35.2k.
10 year week 46 average : 27.6k
Year to Date
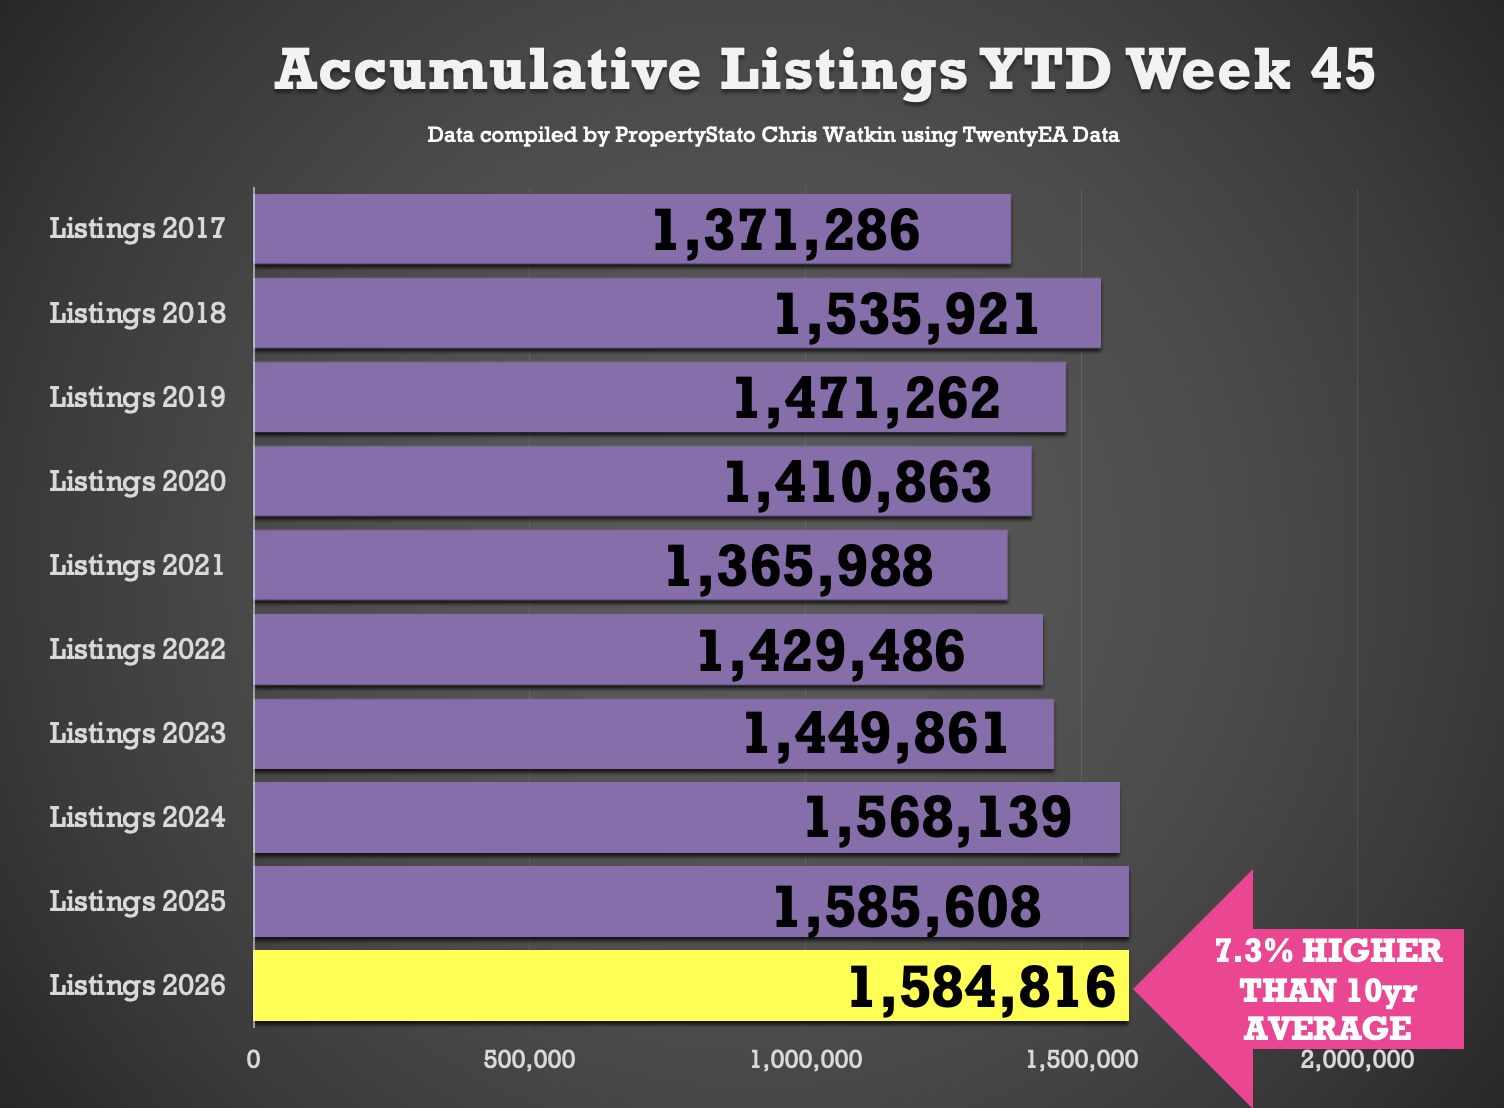
1.584m new listings YTD, which is …
Same as 2025 YTD (1.586m)
1.1% higher of 2024 YTD (1.586m)
8.6% higher of 2023 YTD (1.450m)
8.8% higher than the 2017–19 average YTD (1.423m).
7.3% higher than last decade YTD average – (1.447m).
🟩 UK Gross Resi Sales
Week 45 ..
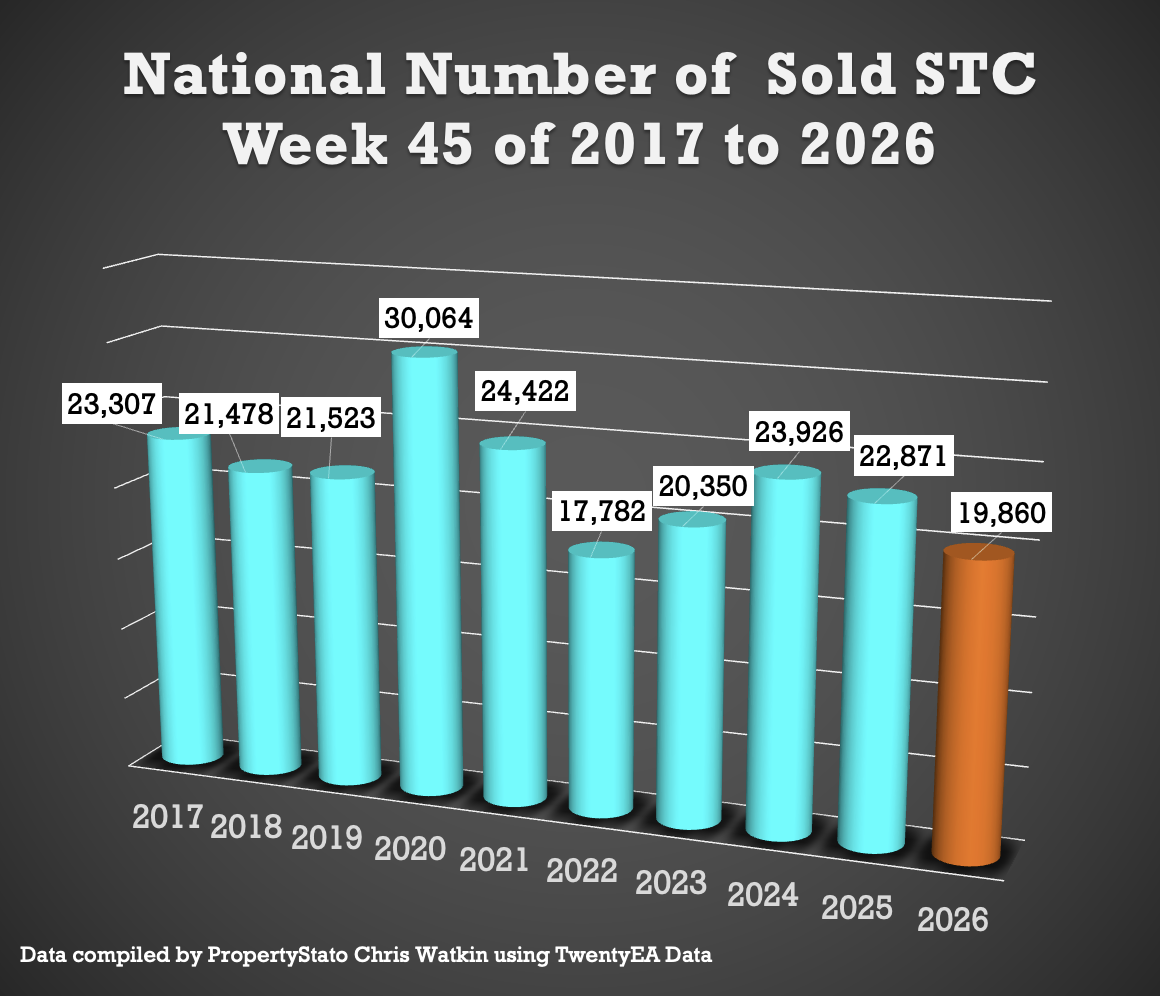
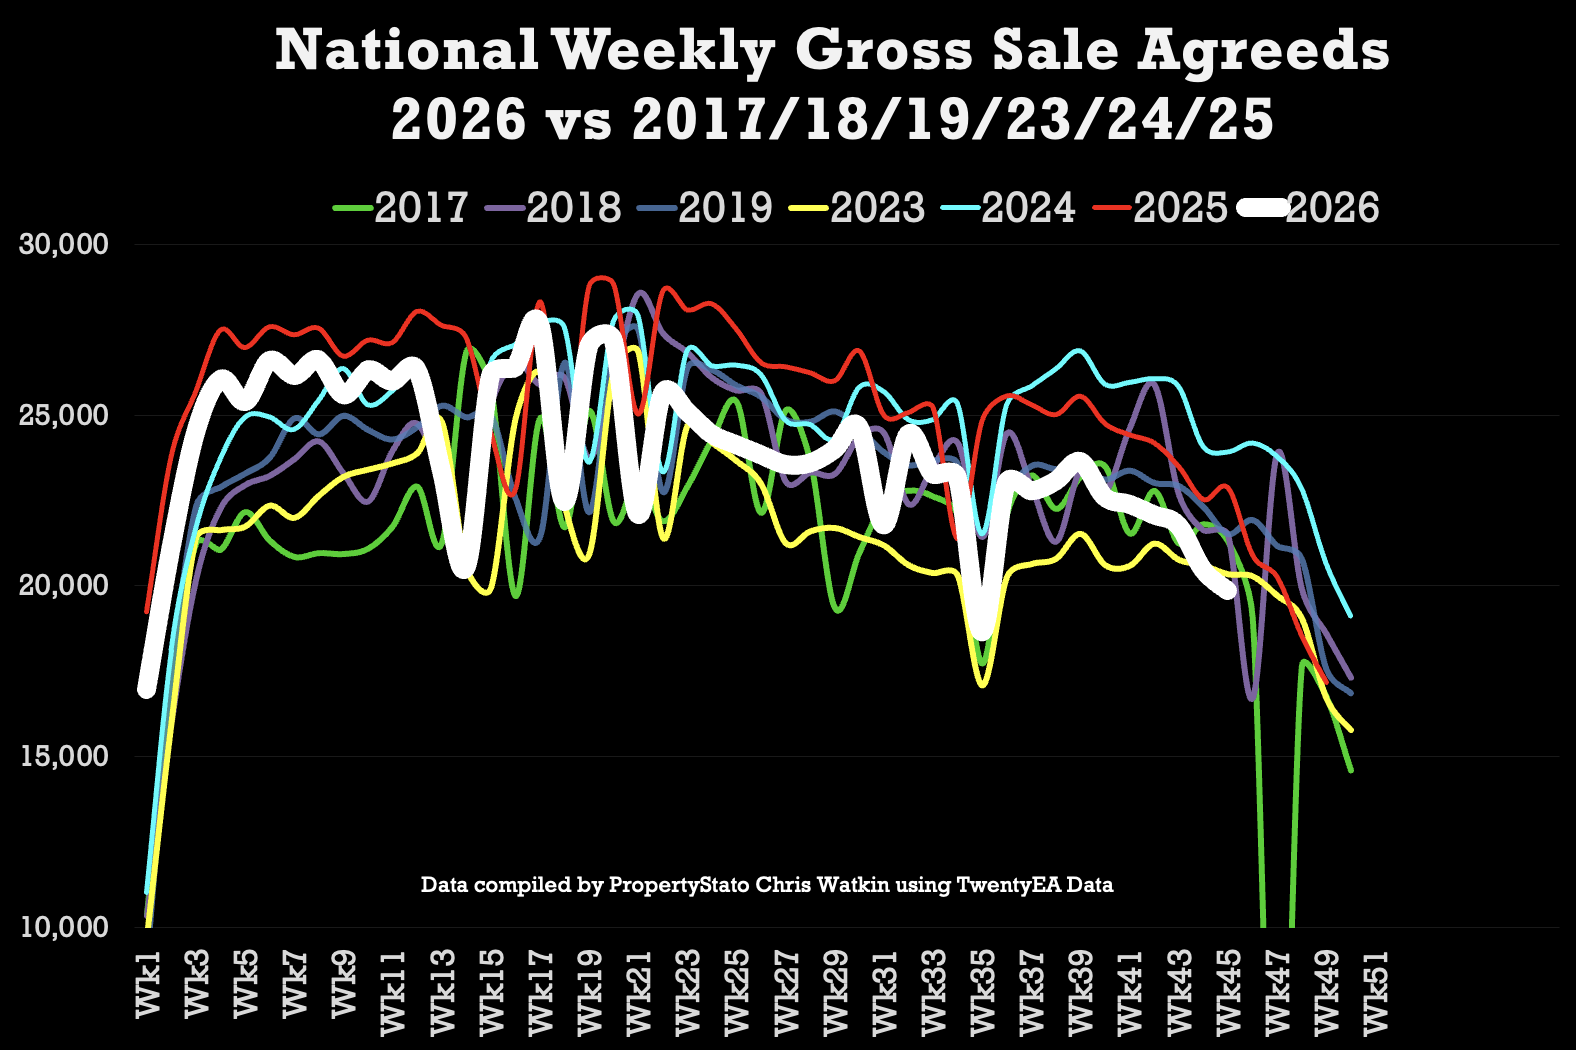
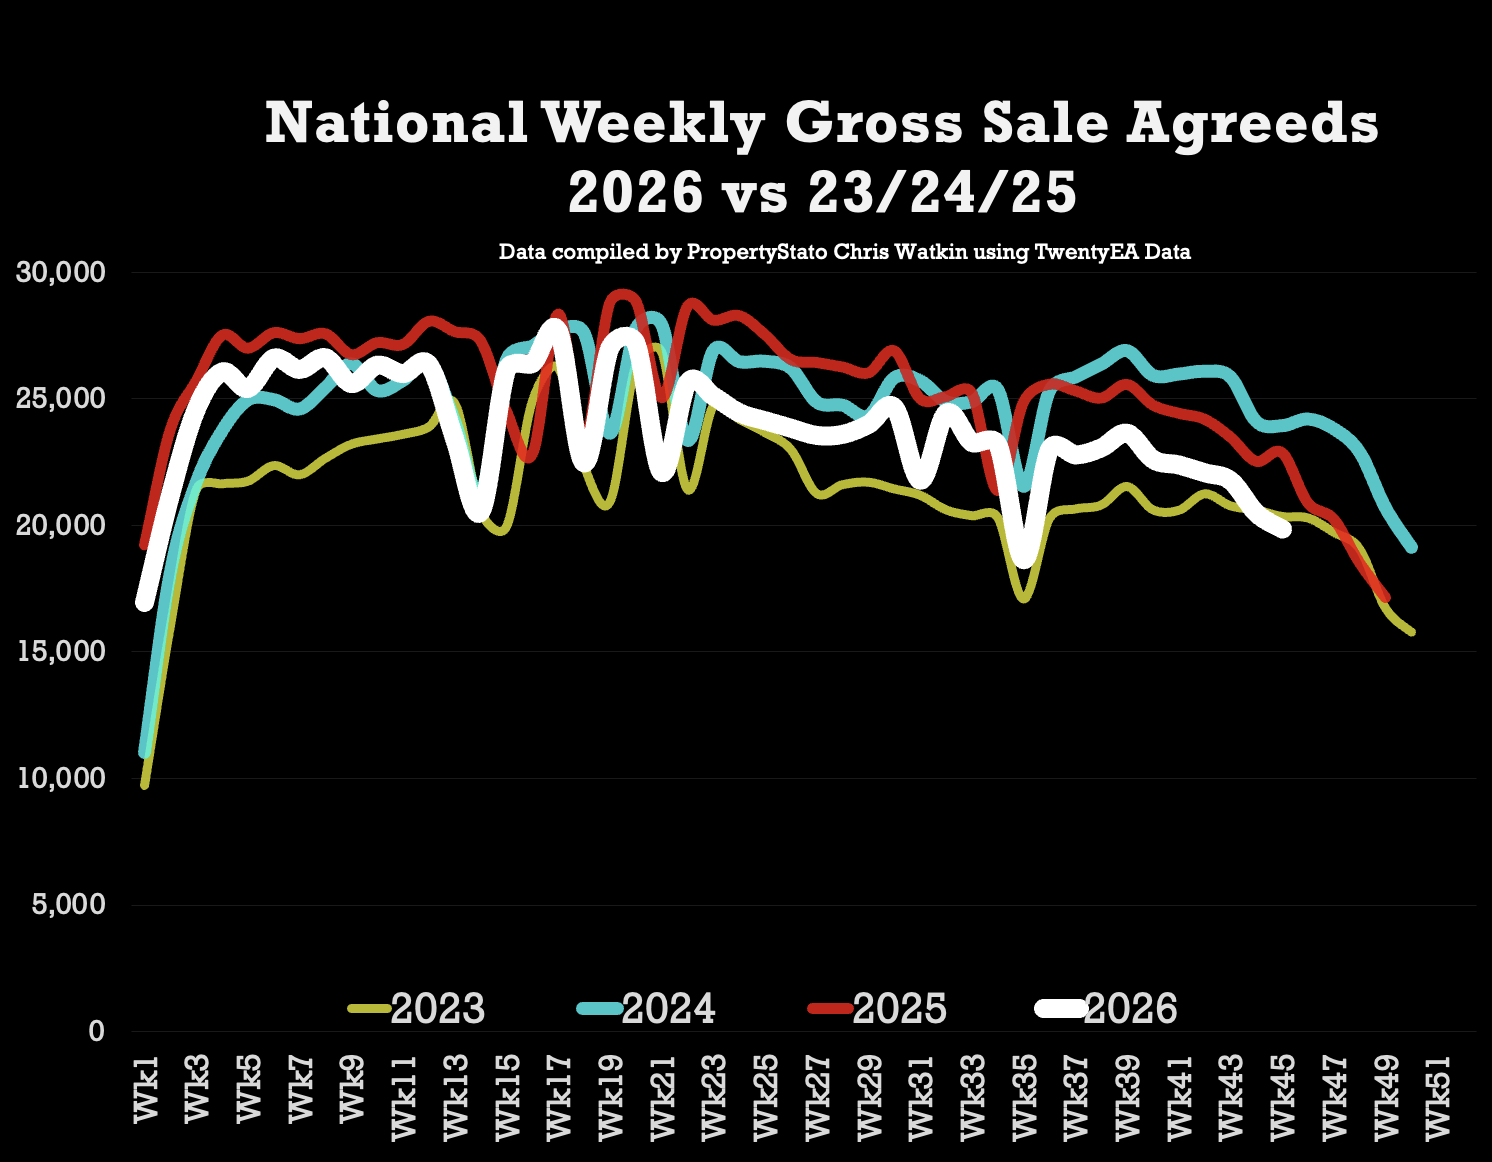
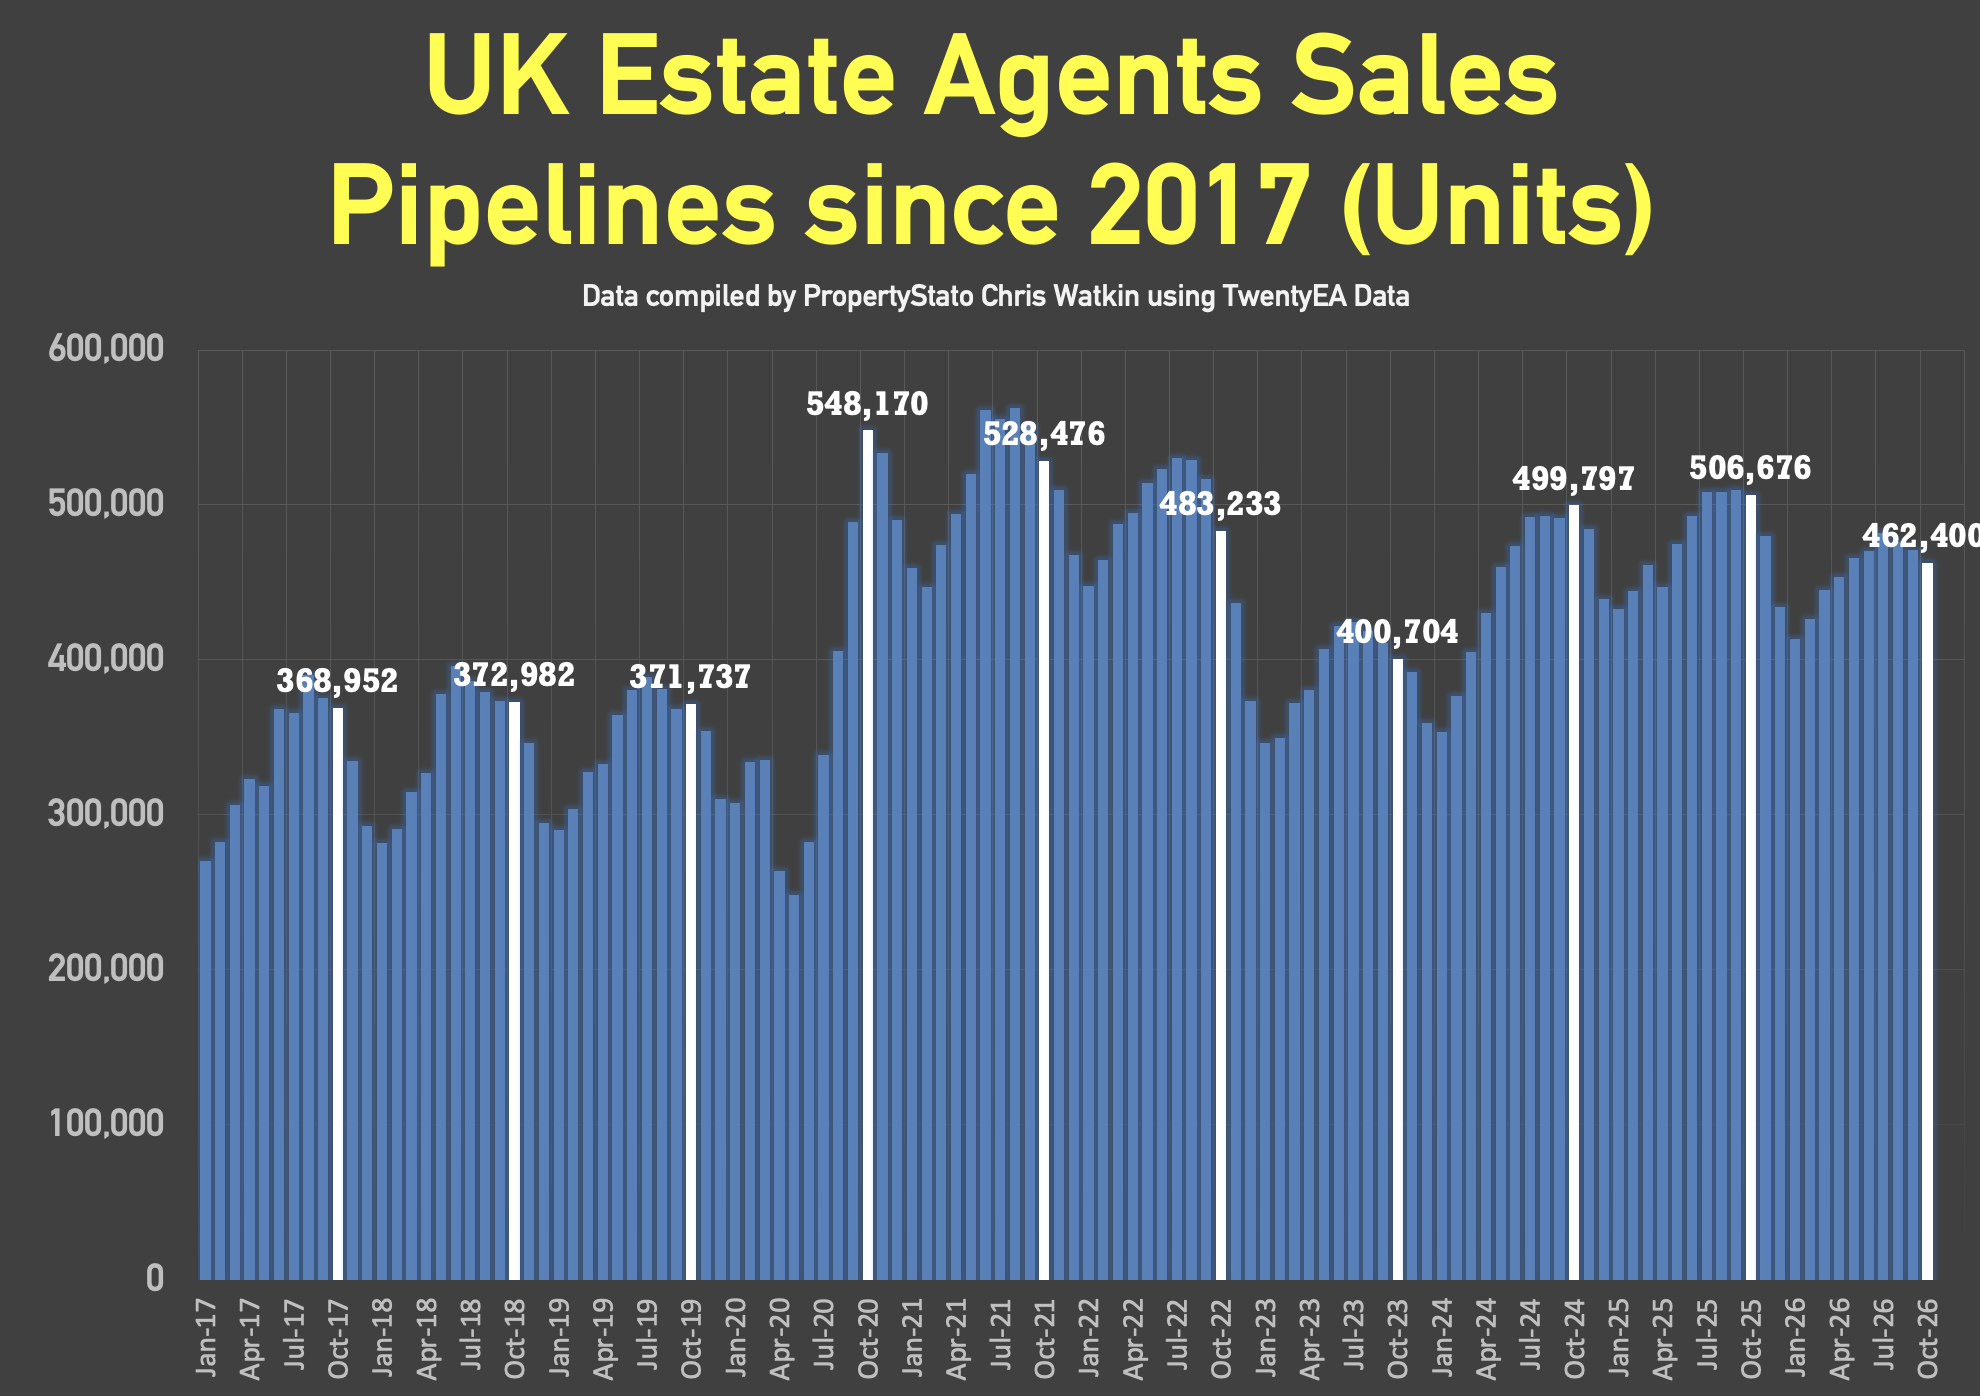
19.9k homes sold stc this week 45 (20.5k last week) –
A drop of 3% from last week (week 44)
Decade Average Drop from week 44 to 45 is 1.4%
10 year week 45 average : 22.6k
2026 weekly average : 23.8k.
Year to Date for house sales
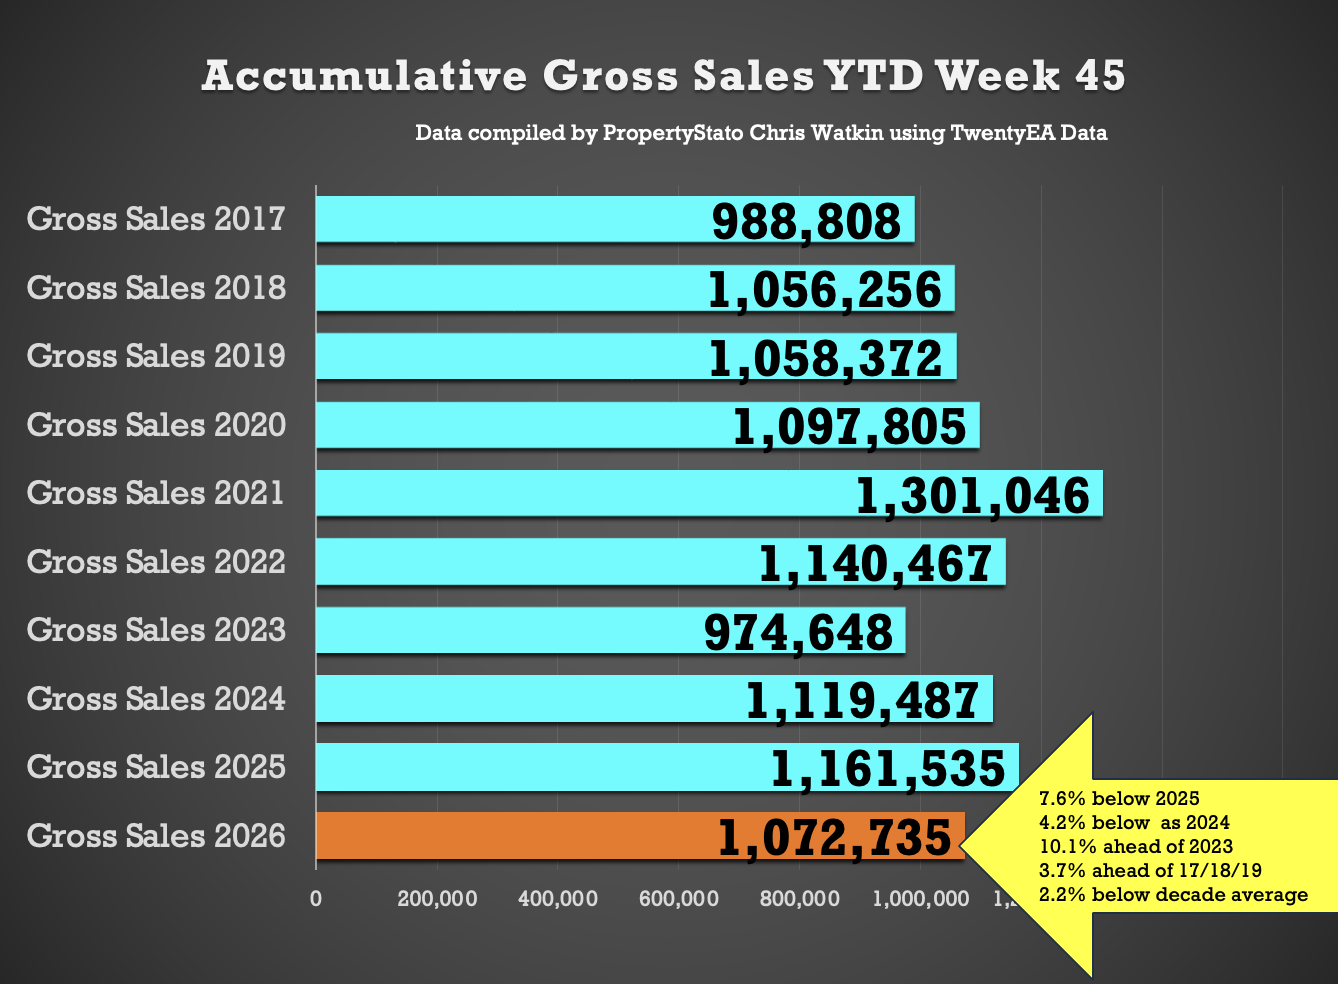
1.073m UK homes sold stc YTD, which is …
7.6% lower than 2025 YTD (1.162m)
4.2% lower to 2024 YTD (1.119m)
10.1% higher than 2023 YTD (975k)
3.7% higher above pre Covid 2017-19 years (1.034m).
2.2% lower than the decade YTD average (1.075m).
🟩 UK Net Resi Sales YTD
(Net Sales being Gross Sales less Sale Fall Thrus).
Week 45
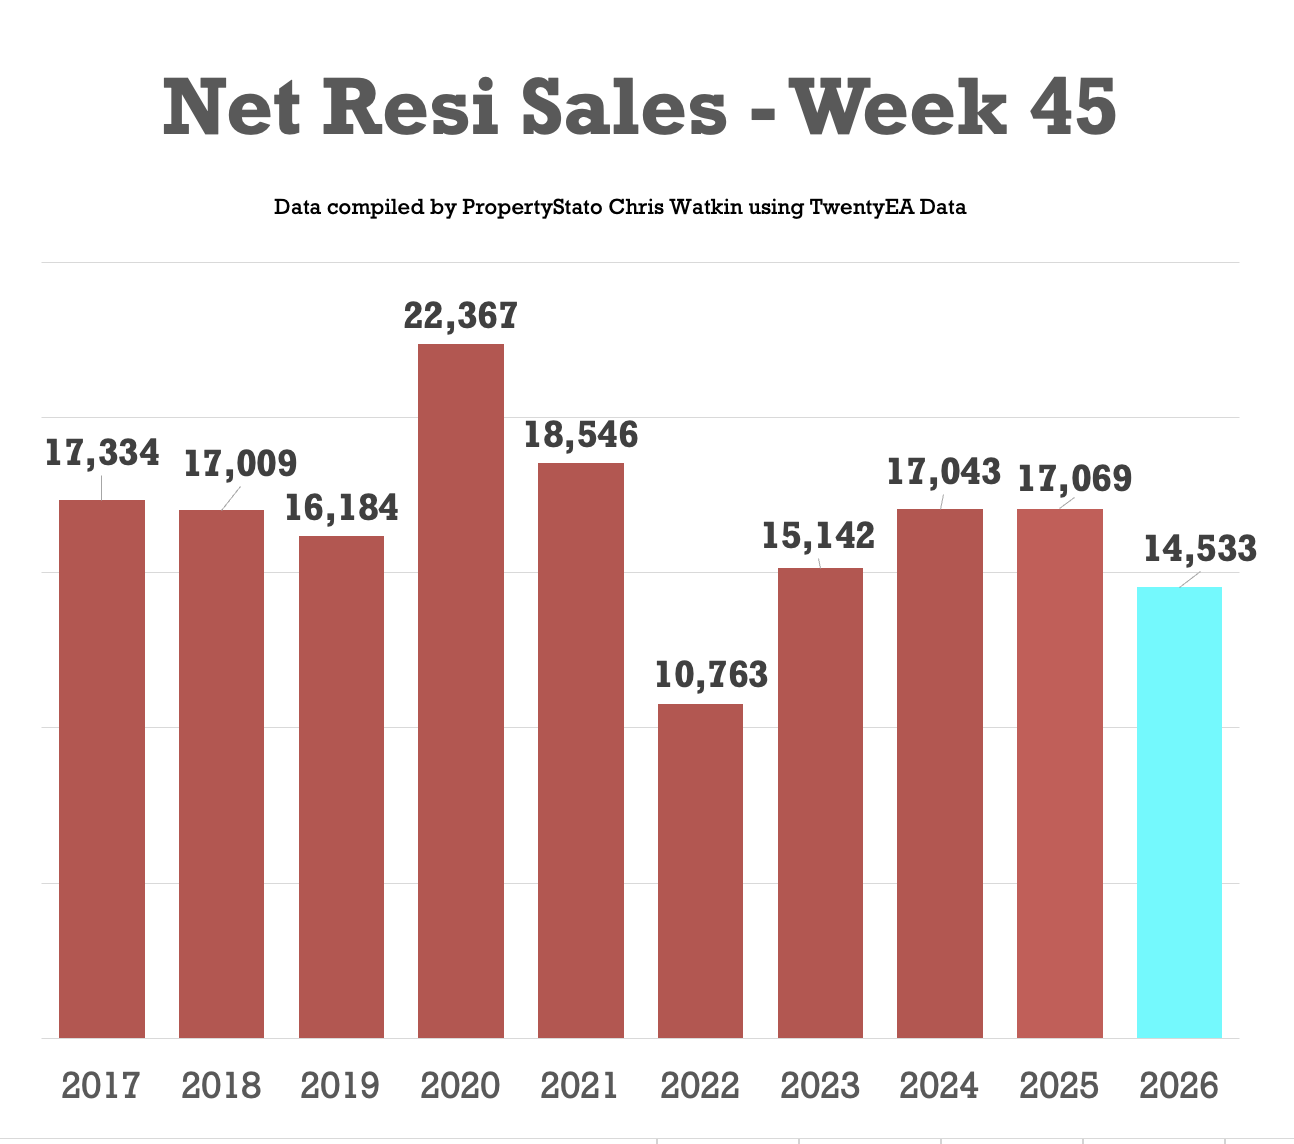
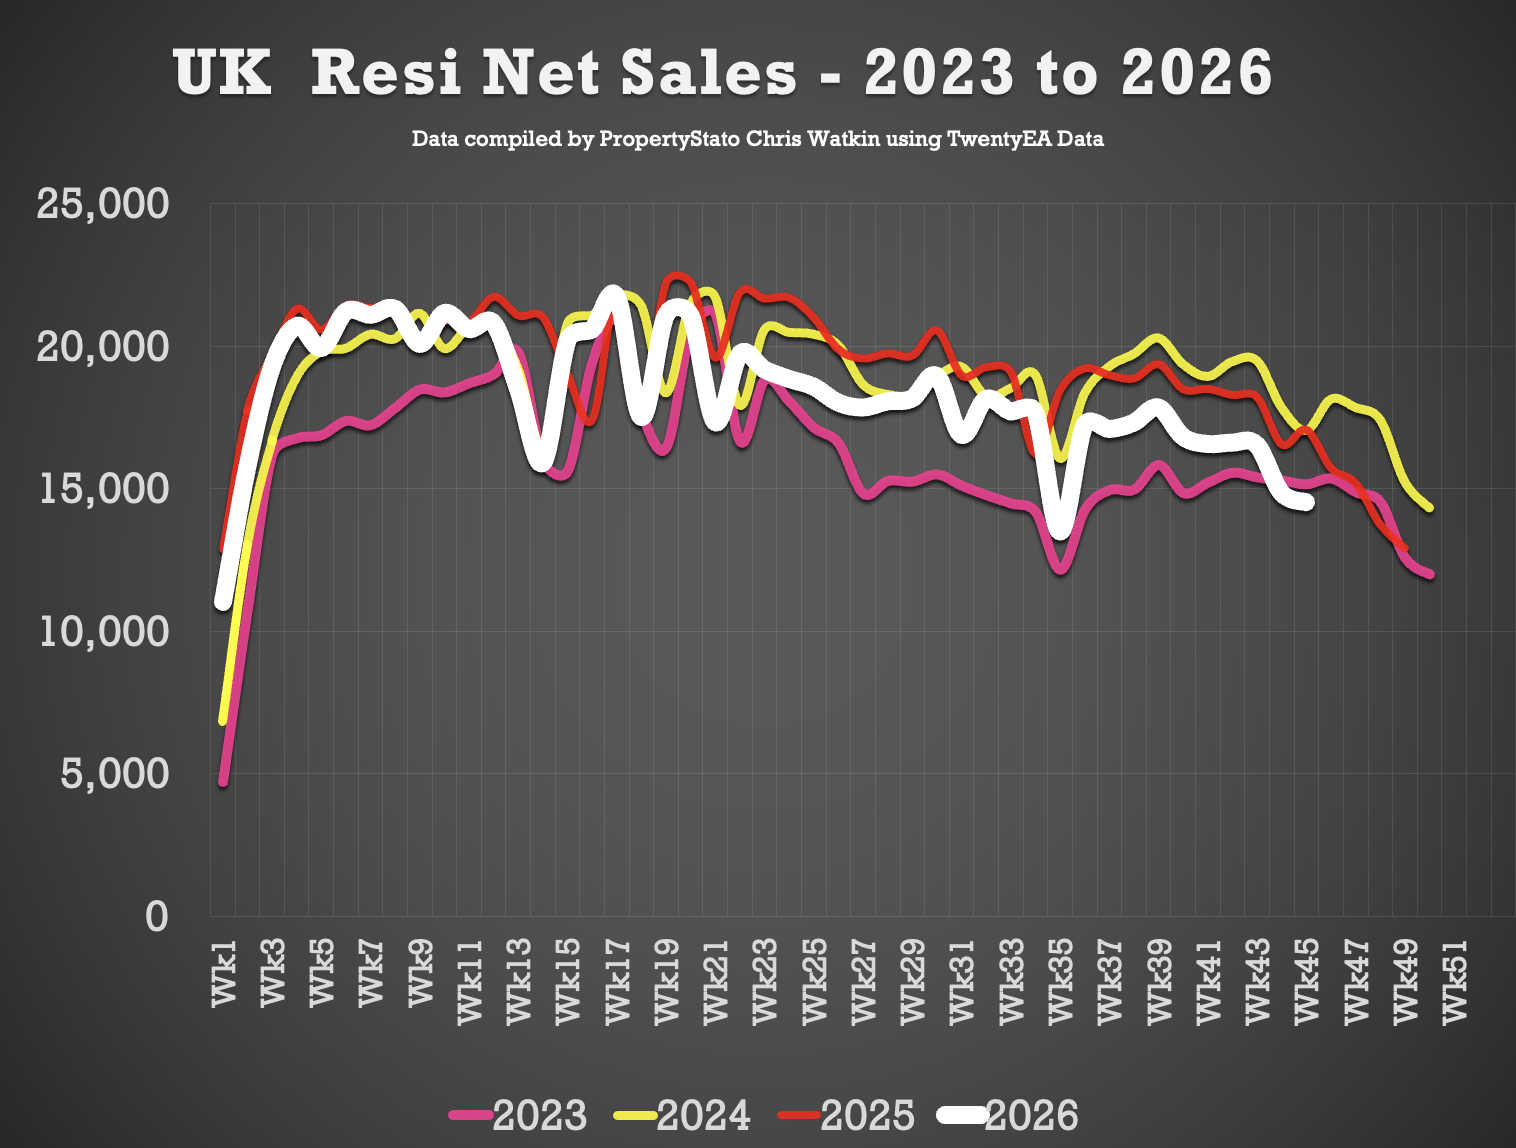
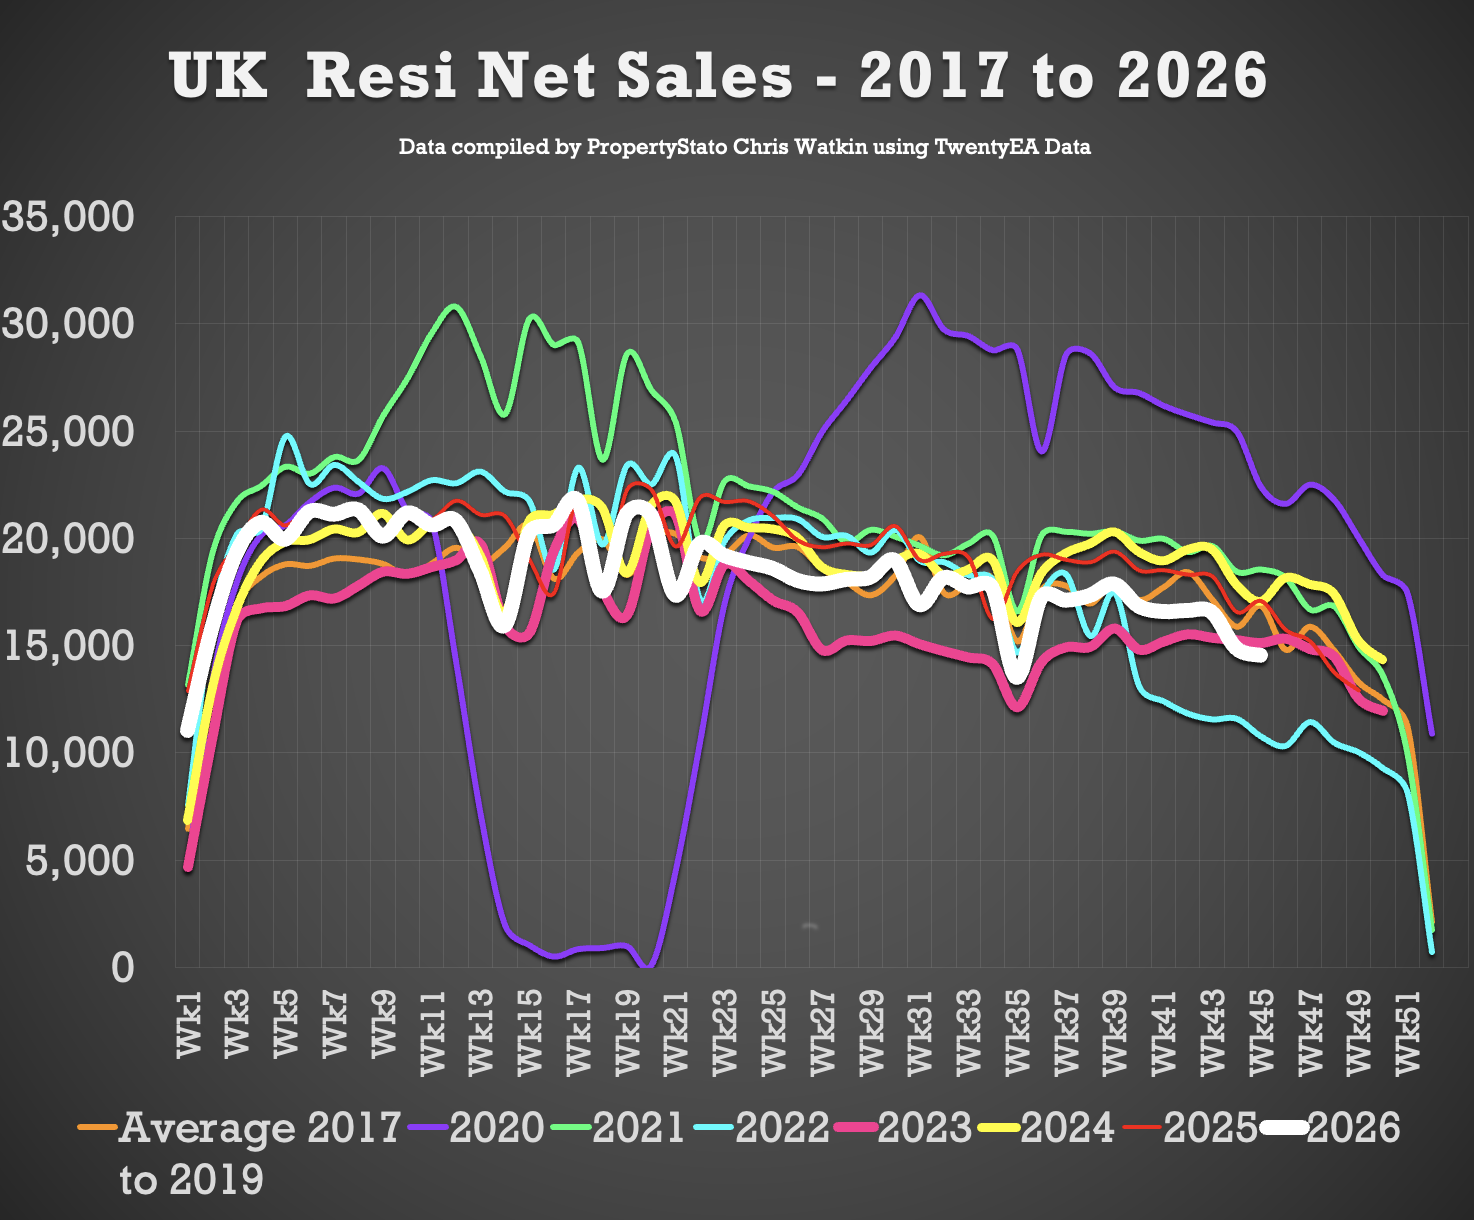
14.5k Net Sales (14.9k last week)
A drop of 2.2% from last week (week 44)
Decade Average Drop from week 44 to 45 is 3.1%
10 year Week 45 average: 16.6k.
Weekly average for 2026: 18.3k.
Year to Date
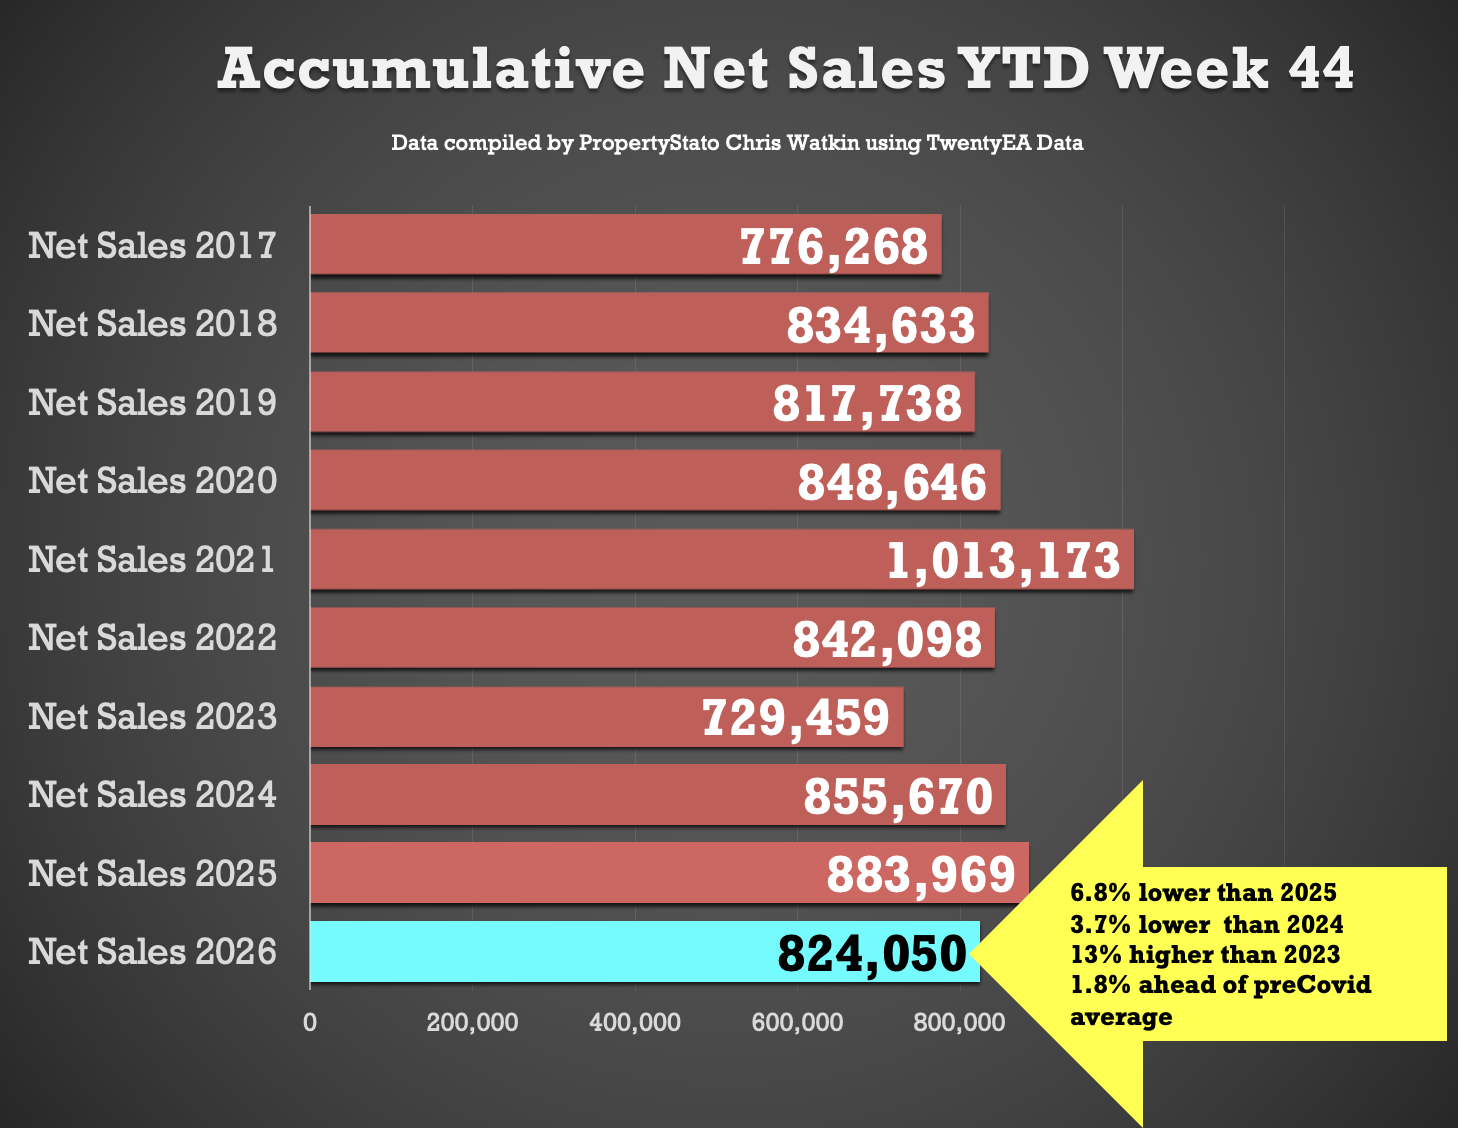
824k UK net home sales YTD, which is…
6.8% lower than 2025 (884k),
3.7% lower than 2024 (856k),
13% ahead of 2023 (729k)
1.8% above the 2017/18/19 average 810k).
🟩 Exchanges & Withdrawals
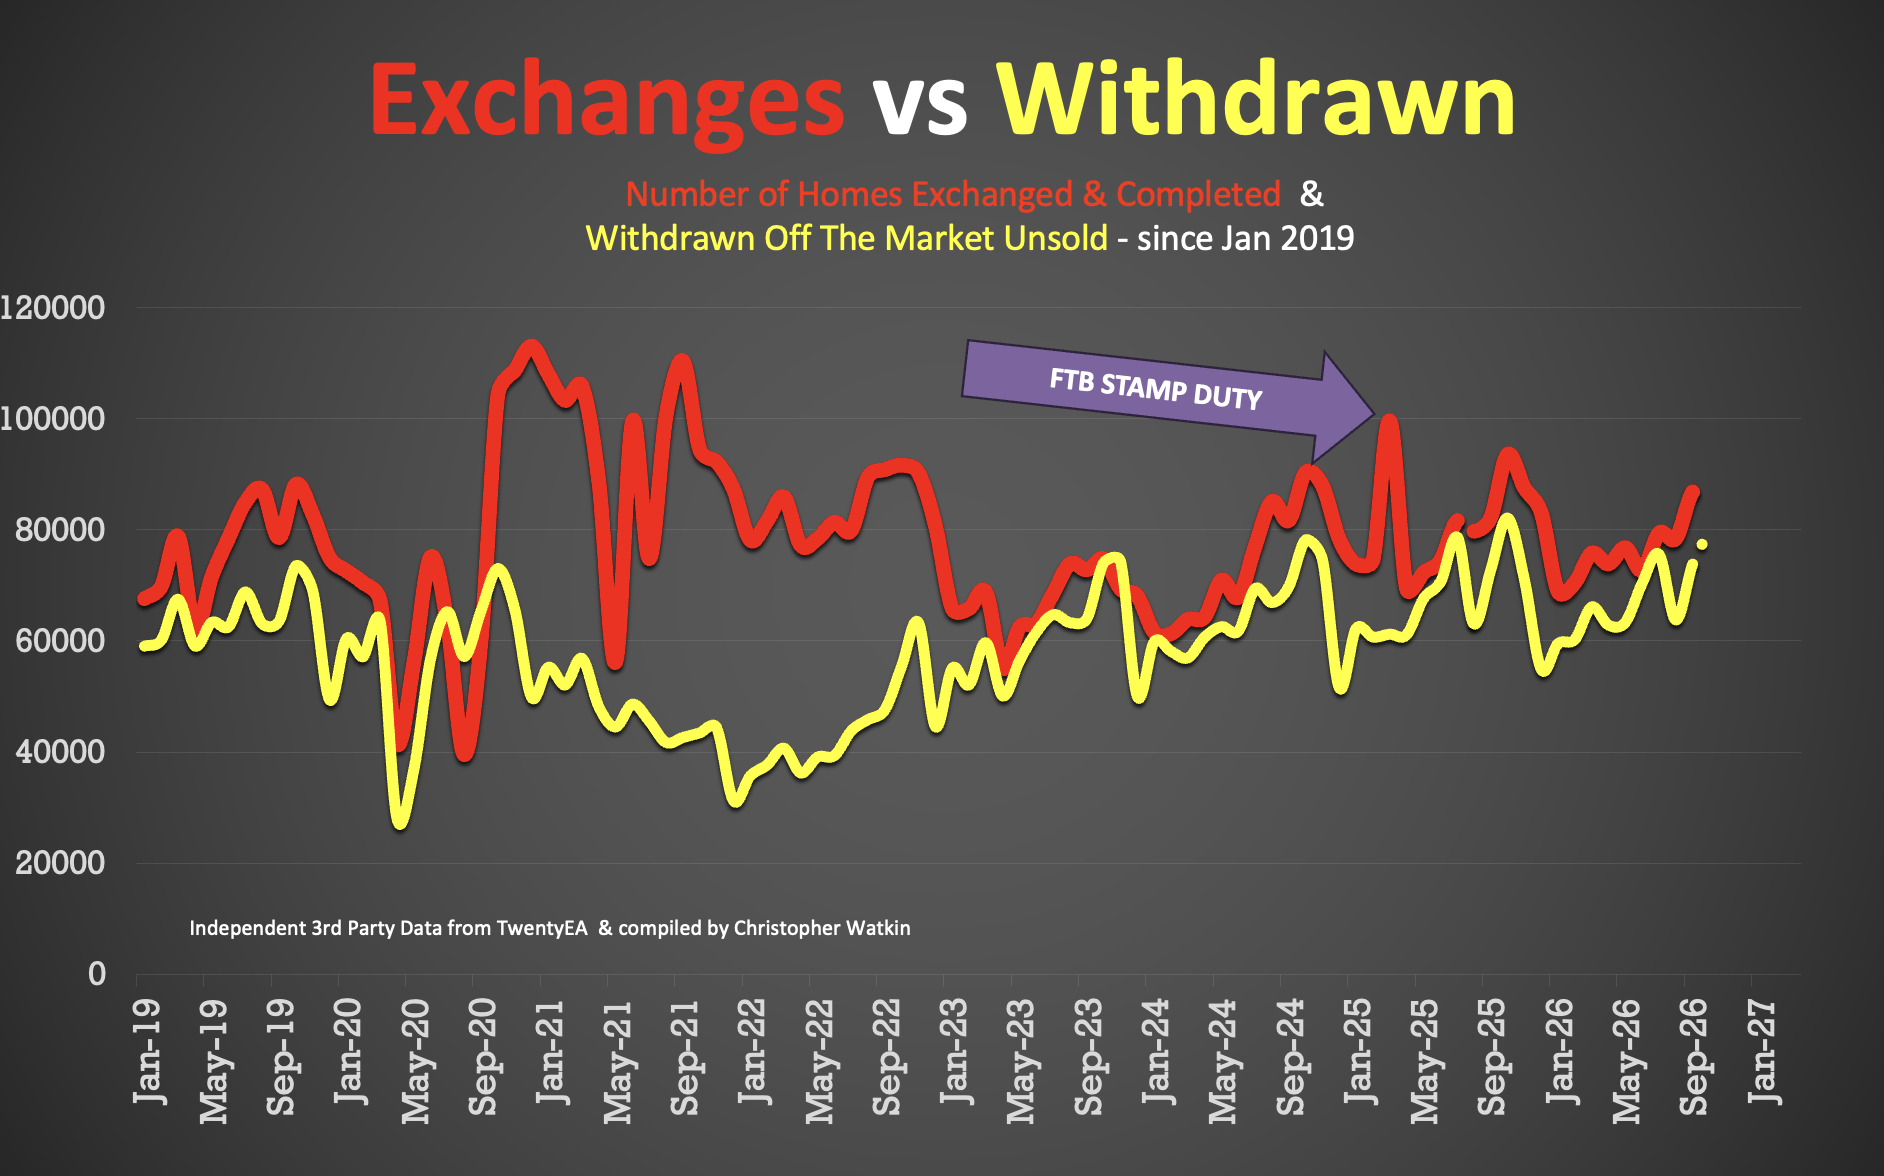
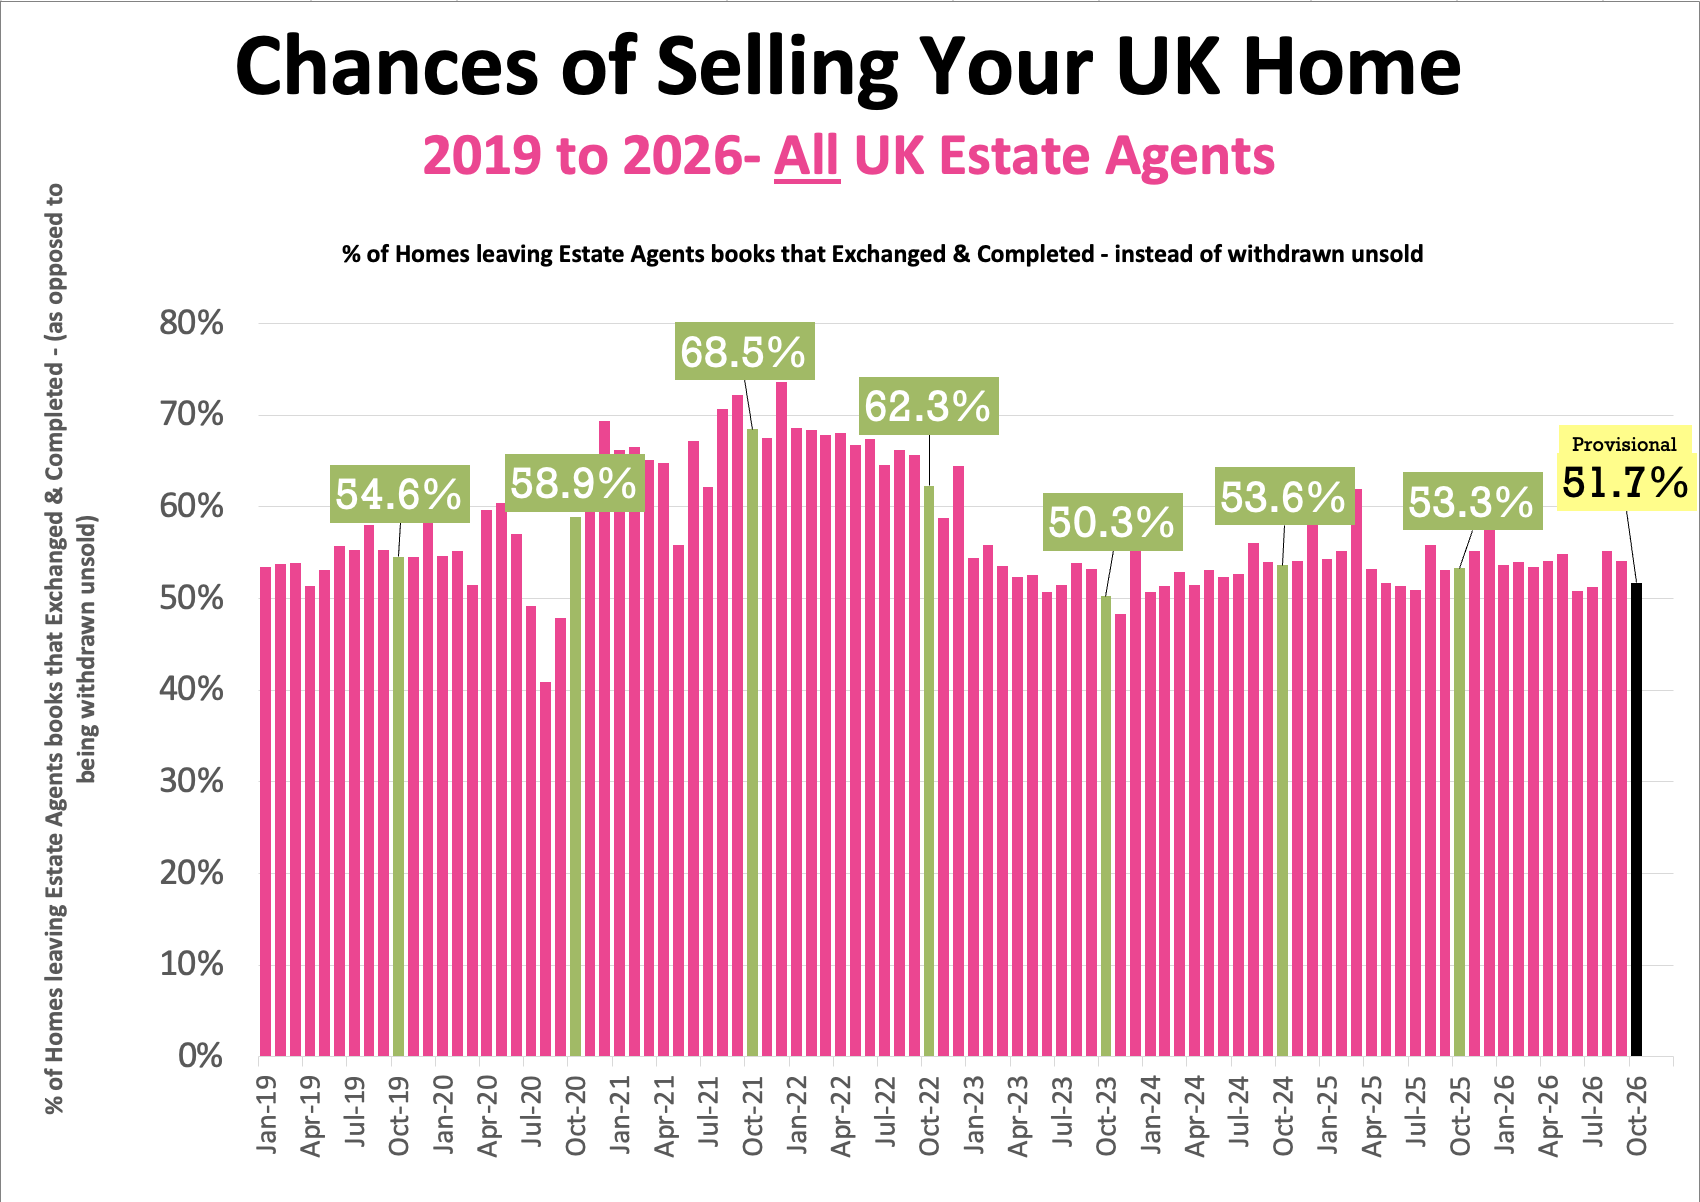
• 85.6k Exchanges in Oct 2026
• 79.9k Withdrawals in Oct 2026
(Note these numbers will change as more exchanges/ withdrawals from October come in during the first few weeks of November)
• Therefore, in October 2026, just 51.7% of homes that left agents’ books exchanged & completed in October (the rest – 48.3% withdrew, unsold)
• 57.6% is the 7 year average exchange to listings ratio (which includes the crazy years post lockdown 18 months).
Additional info …
🟥 Price Reductions
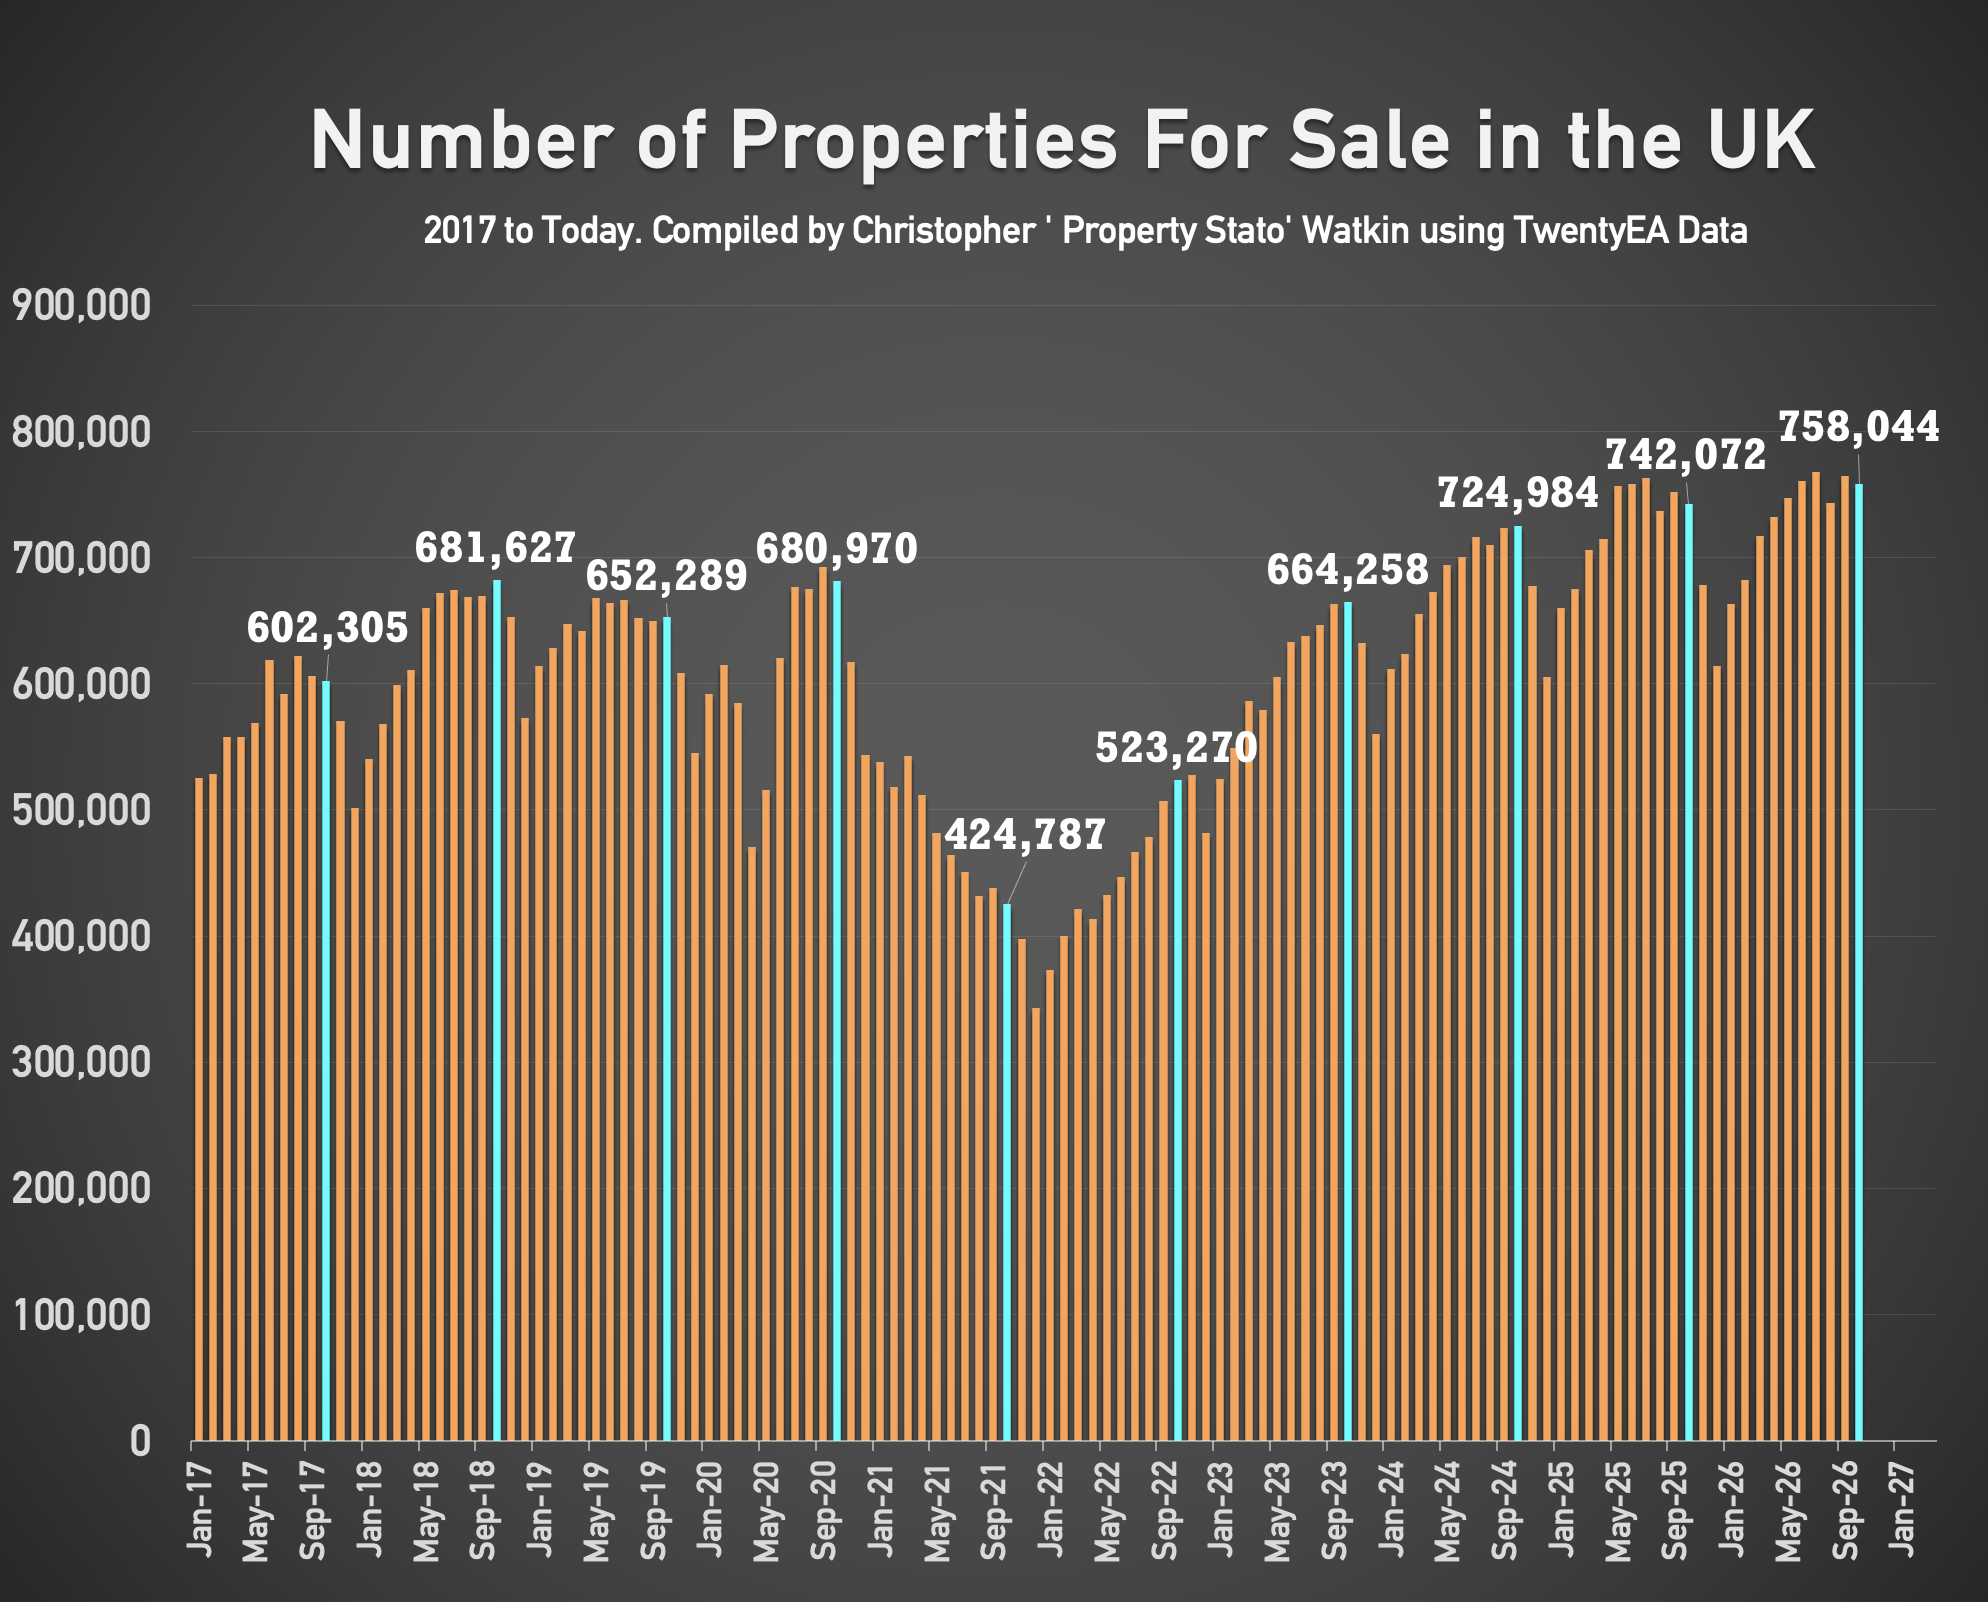
• 21.5k reductions this week on 758k UK homes for sale
• 13.7% of UK homes for sale were reduced in October (down from 14.7% in September)
• 2026 YTD average 13.1%, versus the 7 year long term average of 11%.
🟥 Price Difference between Asking Price of Listings & Asking Price of those Homes that go Sold stc
• Week 45 – 6.8% difference (long term 10 year average is 16% to 17%). (£392k ave Listing Ave Asking price vs £367k Sale Agreed ave Asking price)
🟥 Sell-Through Rate
• 13.4% of homes on agents’ books went SSTC in October ’26 (compared to 14.7% in Sept, 14.7% in August ’26 & 13.8% in June ’26).
• Pre-Covid average: 15.5%.
🟥 Sale Fall-Thrus
• Week 45 Fall-thru rate 26.8%
• Decade average: 24.5%
• 5.42% of homes sold STC fell thru in October 2026. Interesting when compared with the 2026 YTD average of 5.1% and 2025 average of 5.3% and the 10 year average of 5.7%.
🟥 Stock Levels
• 758k homes on the market on the 1st of November ’26 (742k on Nov 25, 724k on Nov 24, 664k in Nov 23).
🟥 Transaction Times
• 76 days from Listing to Sale Agreed
• 122 days from Sale Agreed to Completion
(Rolling 12 month stat)
🟥 UK Rental Data
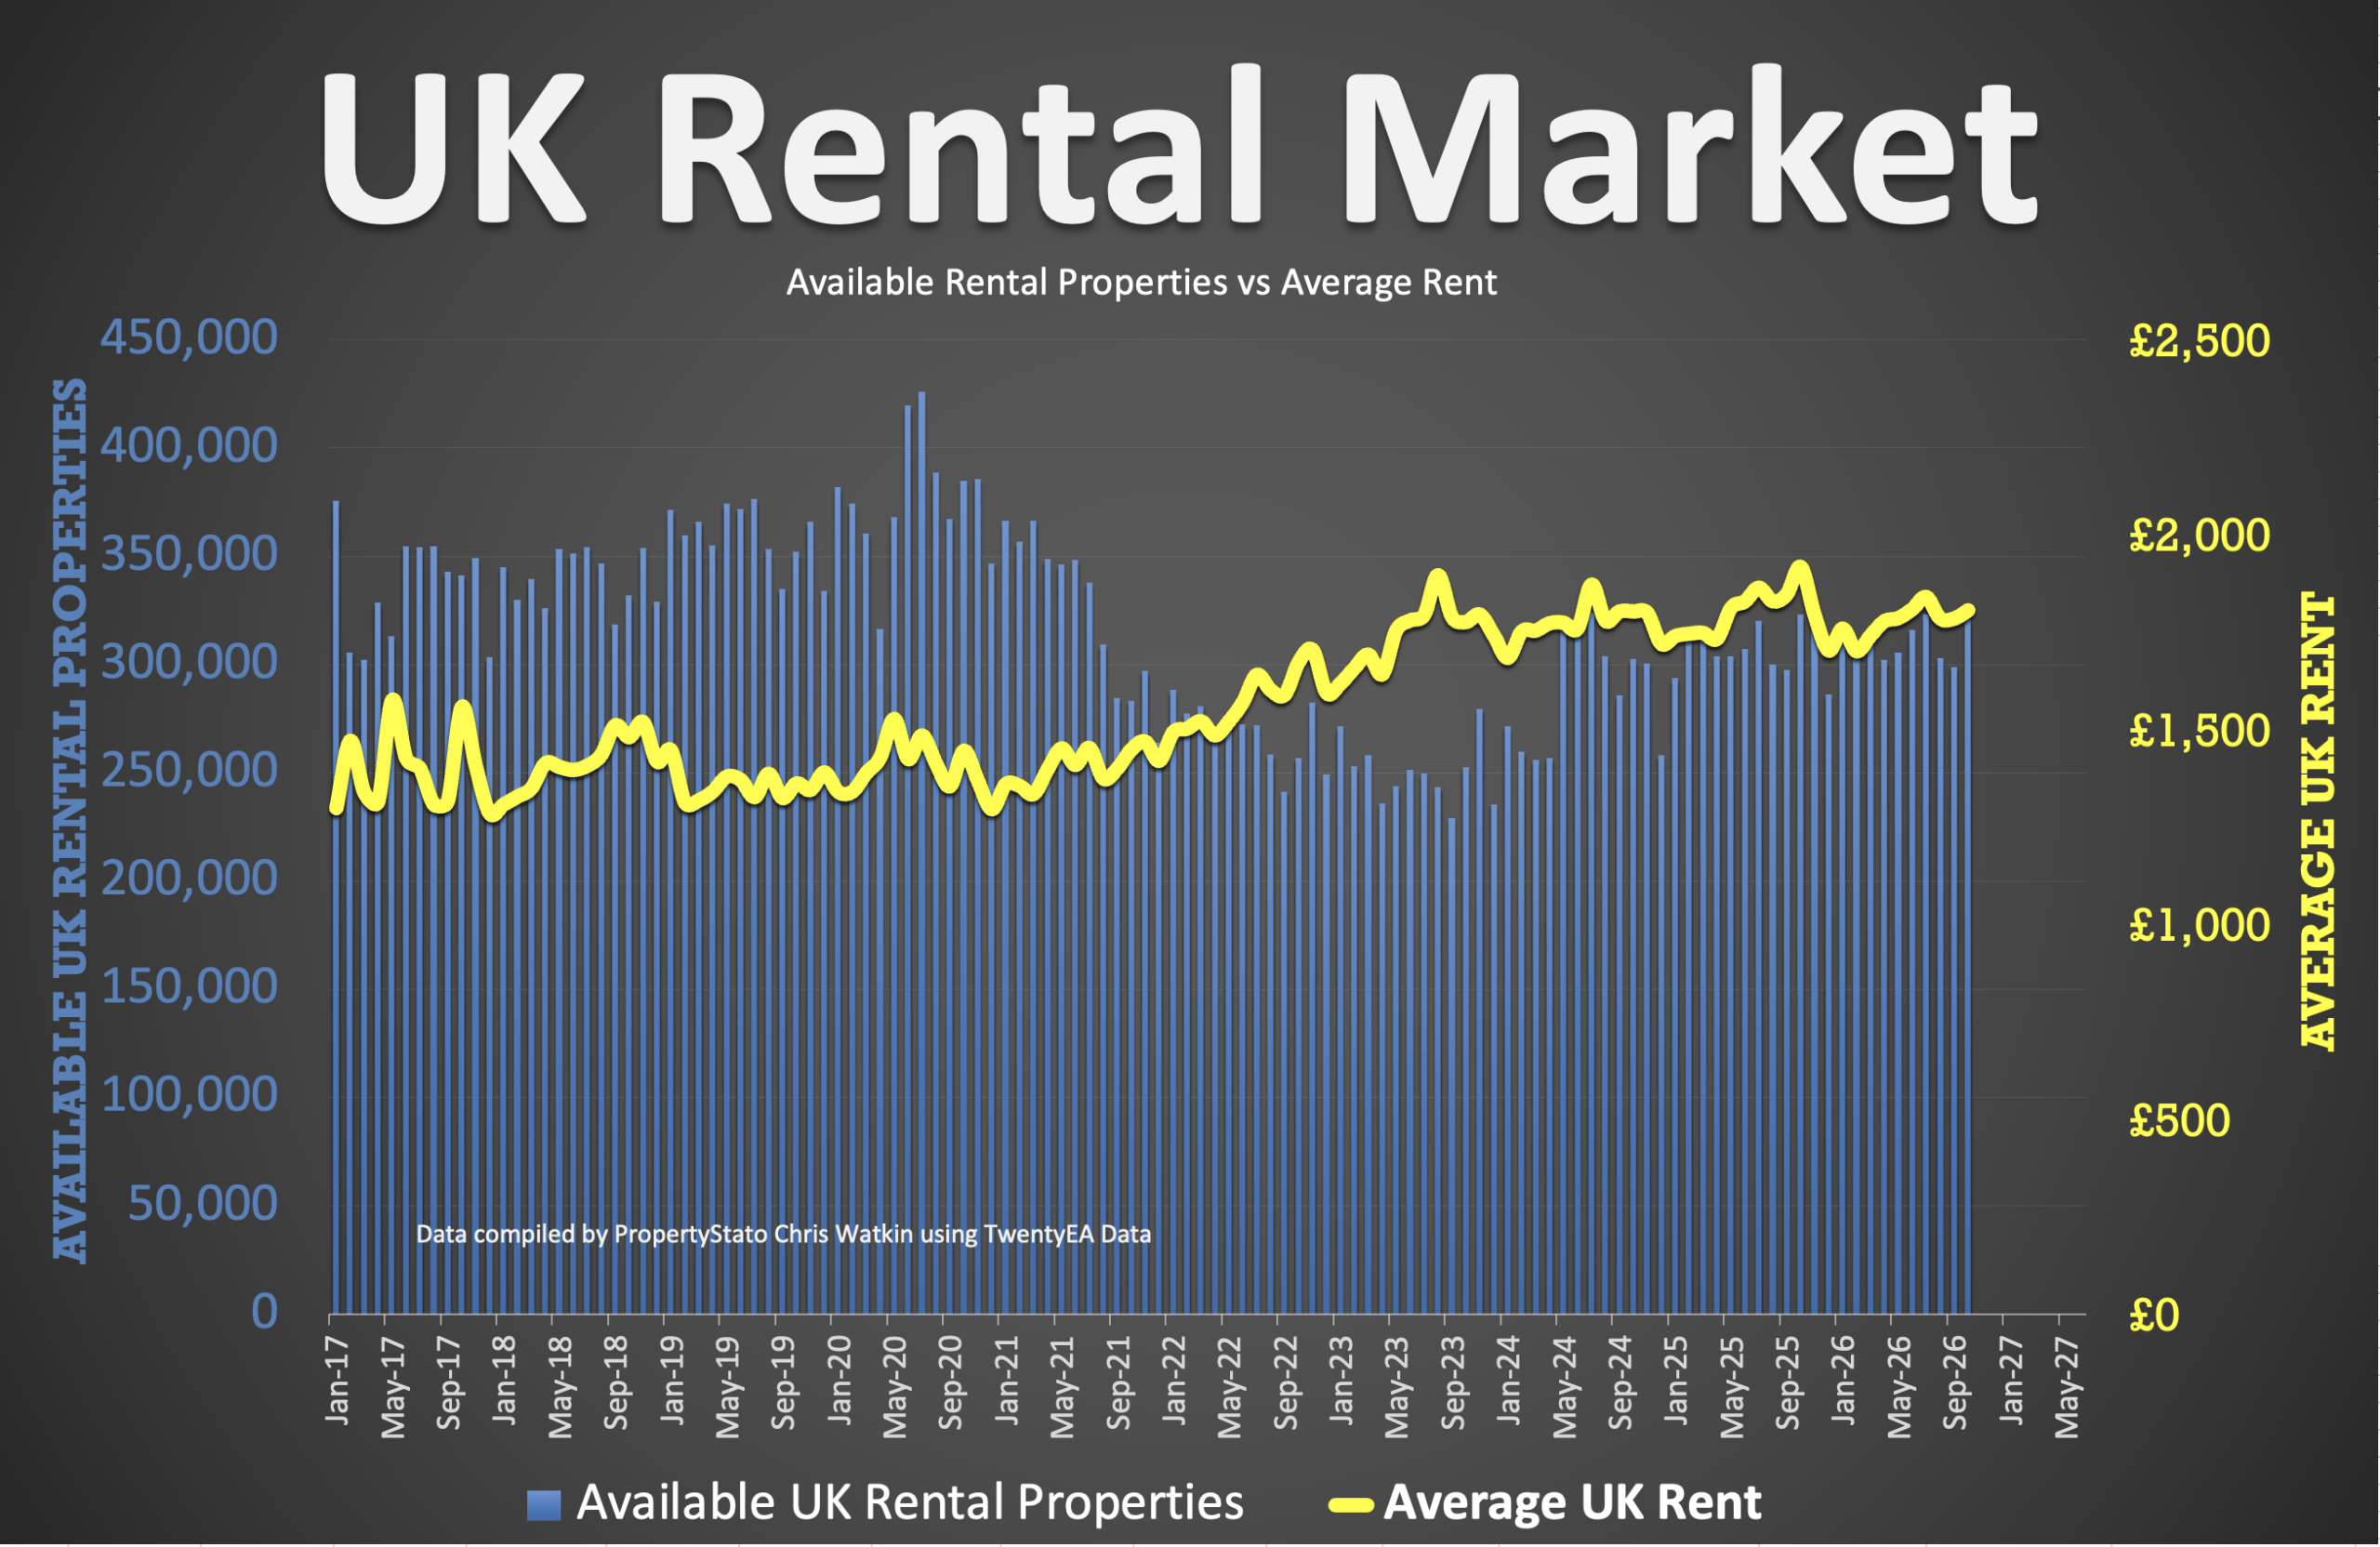
• Average Rent in Wk 45 – £1,799 pcm
• Average Rent in MTD November 2026 – £1,824 pcm
• Average Rent in November 2025 – £1,769 pcm
• Average Rent in November 2021 – £1,449 pcm
• Average Rent in YTD 2026 – £1,767 pcm
• 320k UK Rental Stock available to rent on 1st Nov 26 (323k on 1st Nov 2025)
• New Rental Properties coming onto the market in Oct 2026 – 149.7k (153k in Oct 2025 & 116k in Oct 2022).
🟥 House Prices (£/sq.ft)
• Sept ’26 agreed sales averaged £339.07 per sq.ft. 0.8% lower than 12 months ago (£341.95) and 12.5% higher than 6 years ago (£301.40).
The £/sqft at sale agreed matches the HM Land Registry Index with a 98% accuracy, 5 months in advance. That is why it is so important.
🟥 Local Focus this week in the Show
Horsham