
 The housing market may be showing the first signs of stabilising after several subdued months, with the latest figures indicating that the slowdown in sales has eased during July.
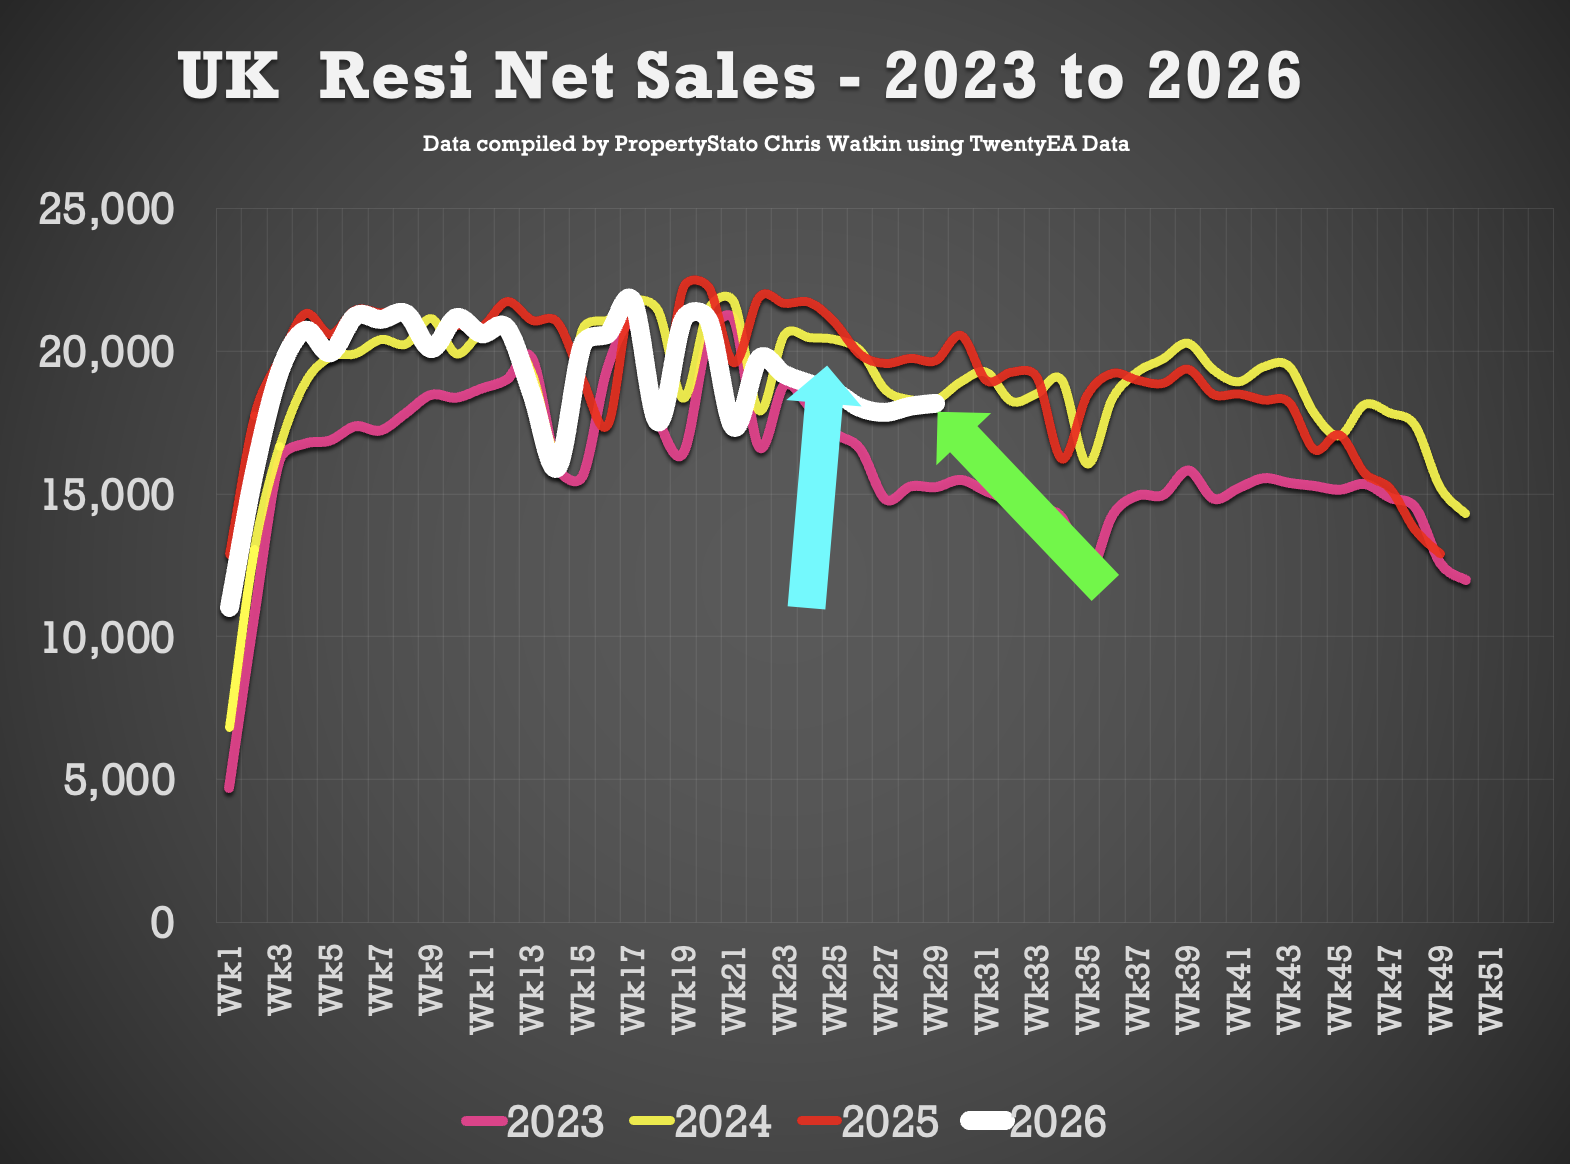
After running around 10% behind 2025 levels since Easter, the monthly gap in agreed sales narrowed to 5.2% last month. Net sales – which account for fall-throughs – have also strengthened over the past fortnight, bucking the seasonal trend of activity slowing during the summer.
Whether this marks the start of a sustained recovery, a so-called ‘Burnham bounce’, or simply reflects a stronger spell following the World Cup remains unclear. However, the latest data suggests the market’s direction may be shifting.
Estate agent Ben Madden joins me to examine the figures in the latest edition of the UK Property Market Stats Show, exploring whether the recent improvement represents a genuine turning point or a temporary uptick.
🟩 Listings
Week 29 ..
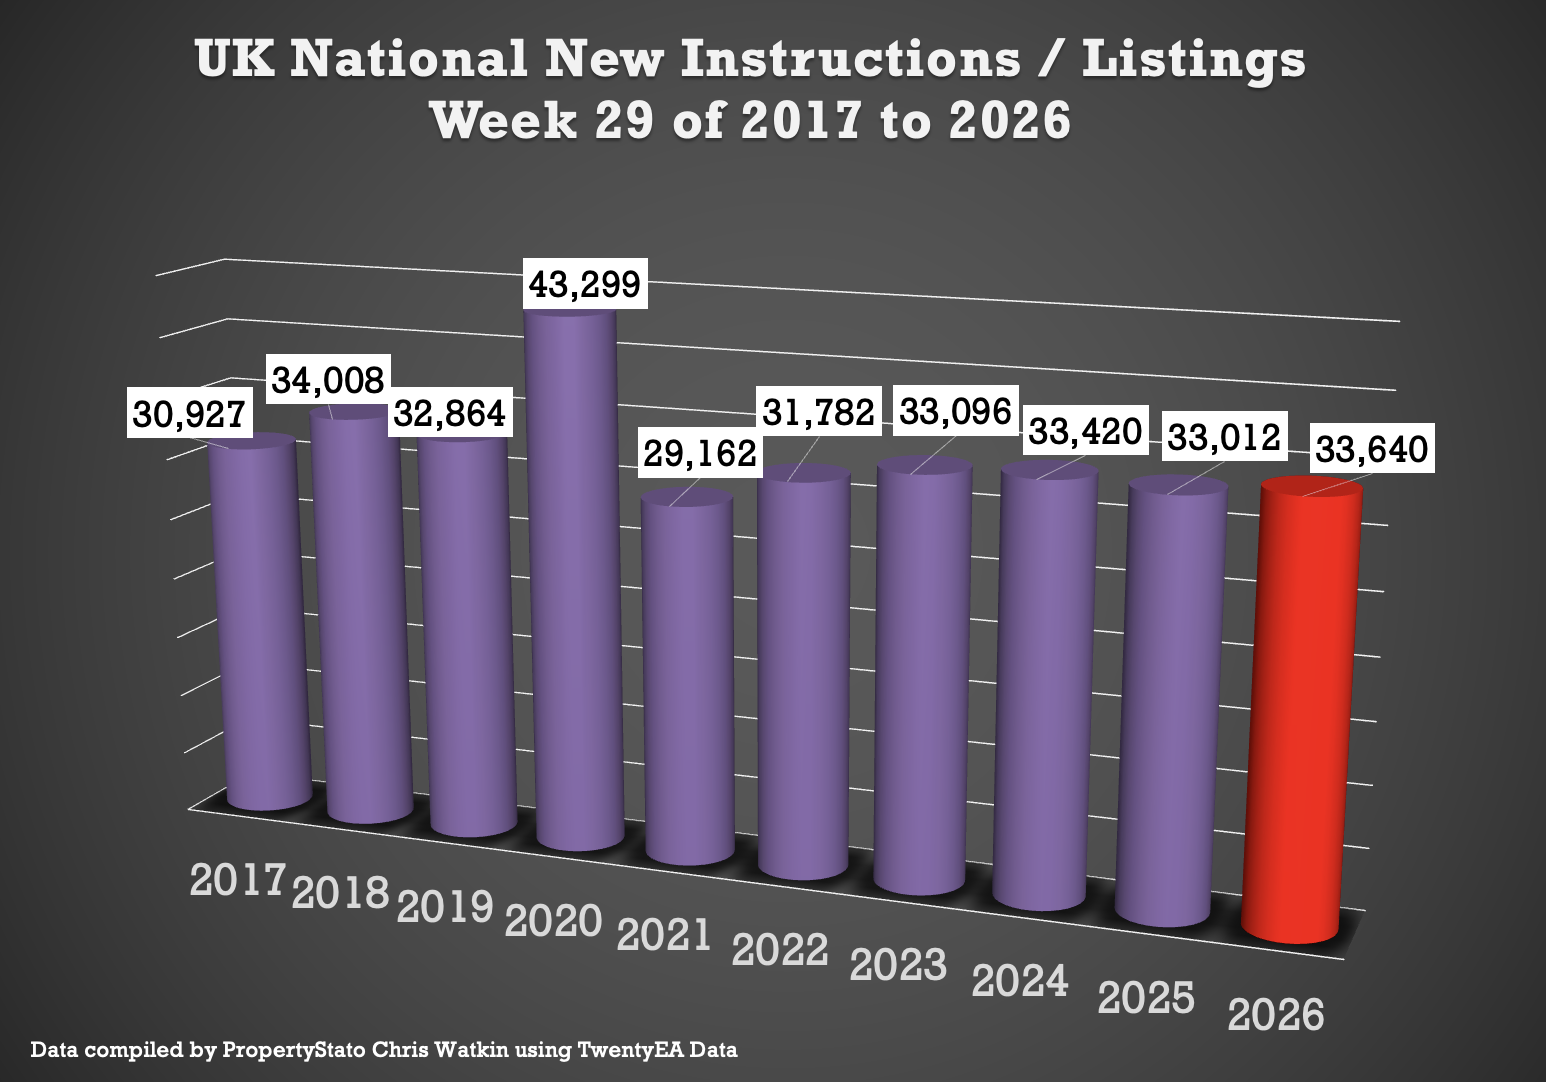
33.6k new listings this week, (33.8k last week).
Weekly 2026 average : 36.9k.
10 year week 28 average : 33.5k
Year to Date
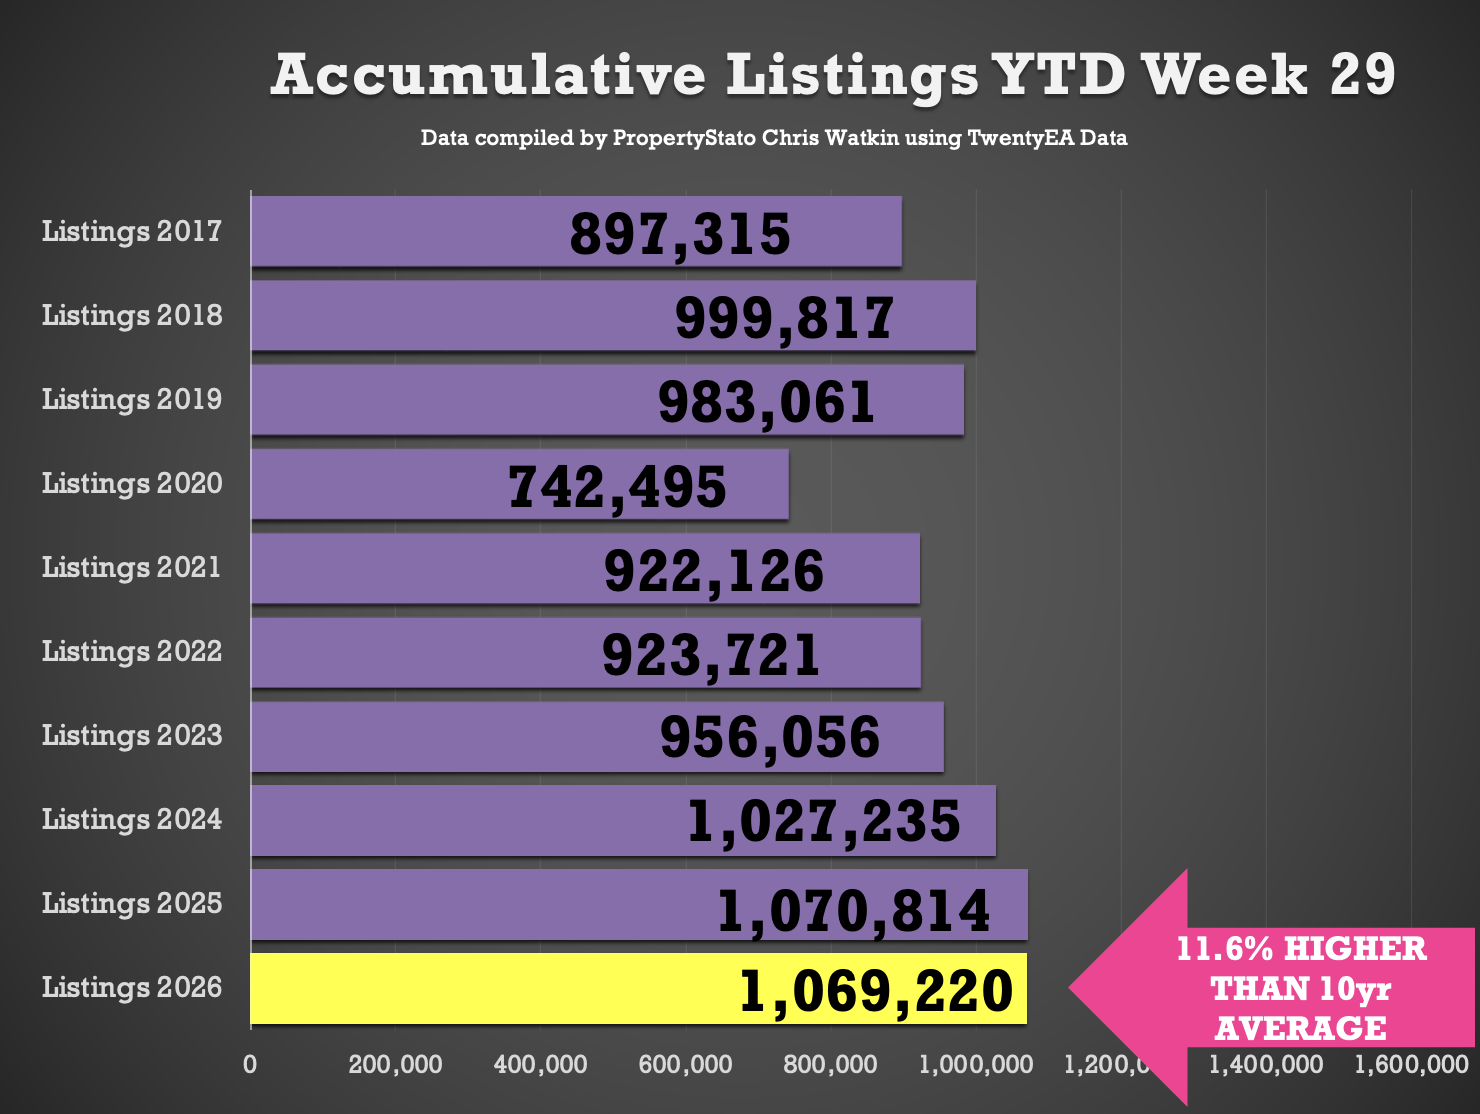
1.069m new listings YTD
Identical to 2025 YTD
4.1% ahead of 2024 YTD (1.027m)
11.4% higher than the 2017–19 average YTD (959k).
🟩 UK Gross Resi Sales
Week 29 ..
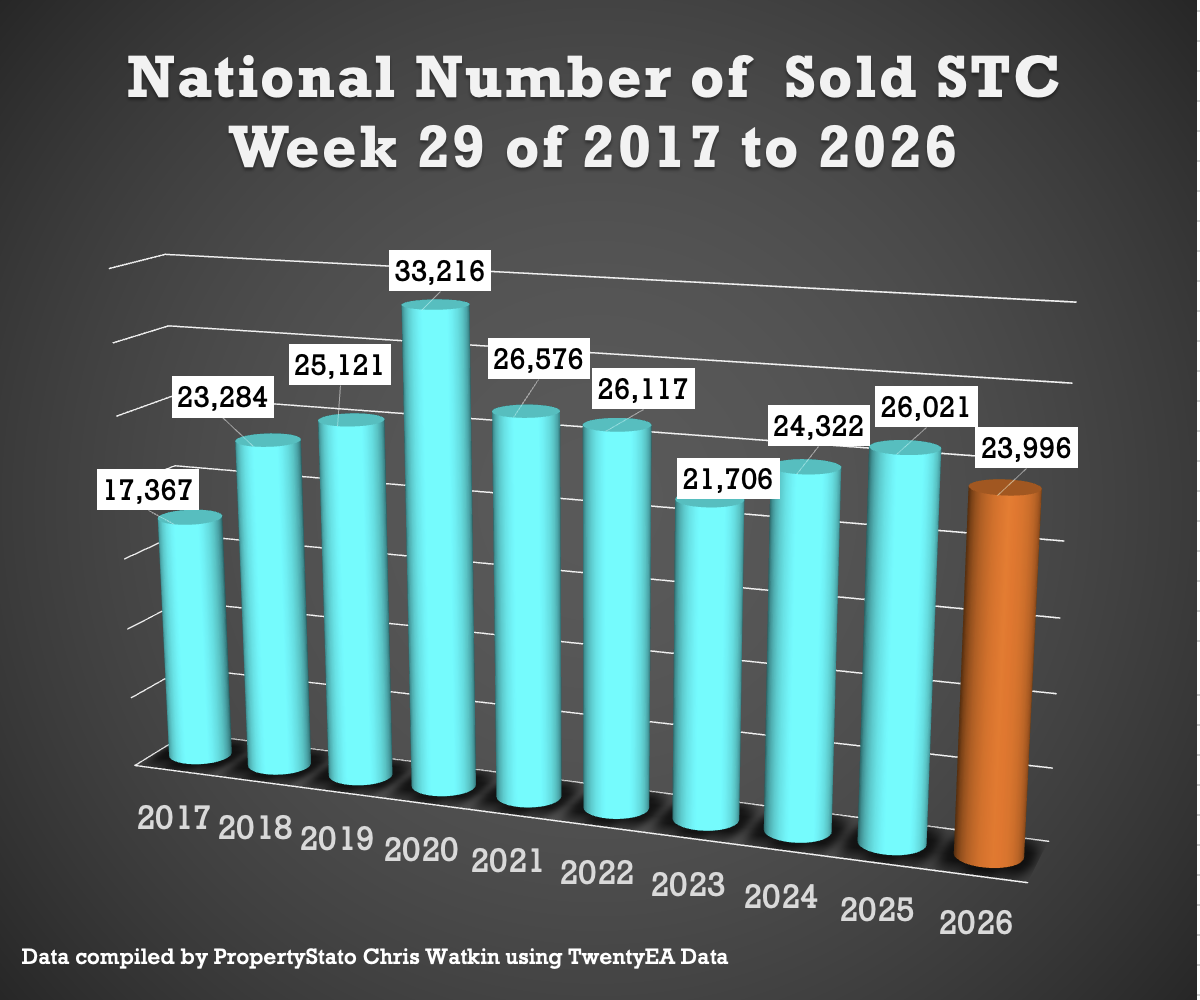
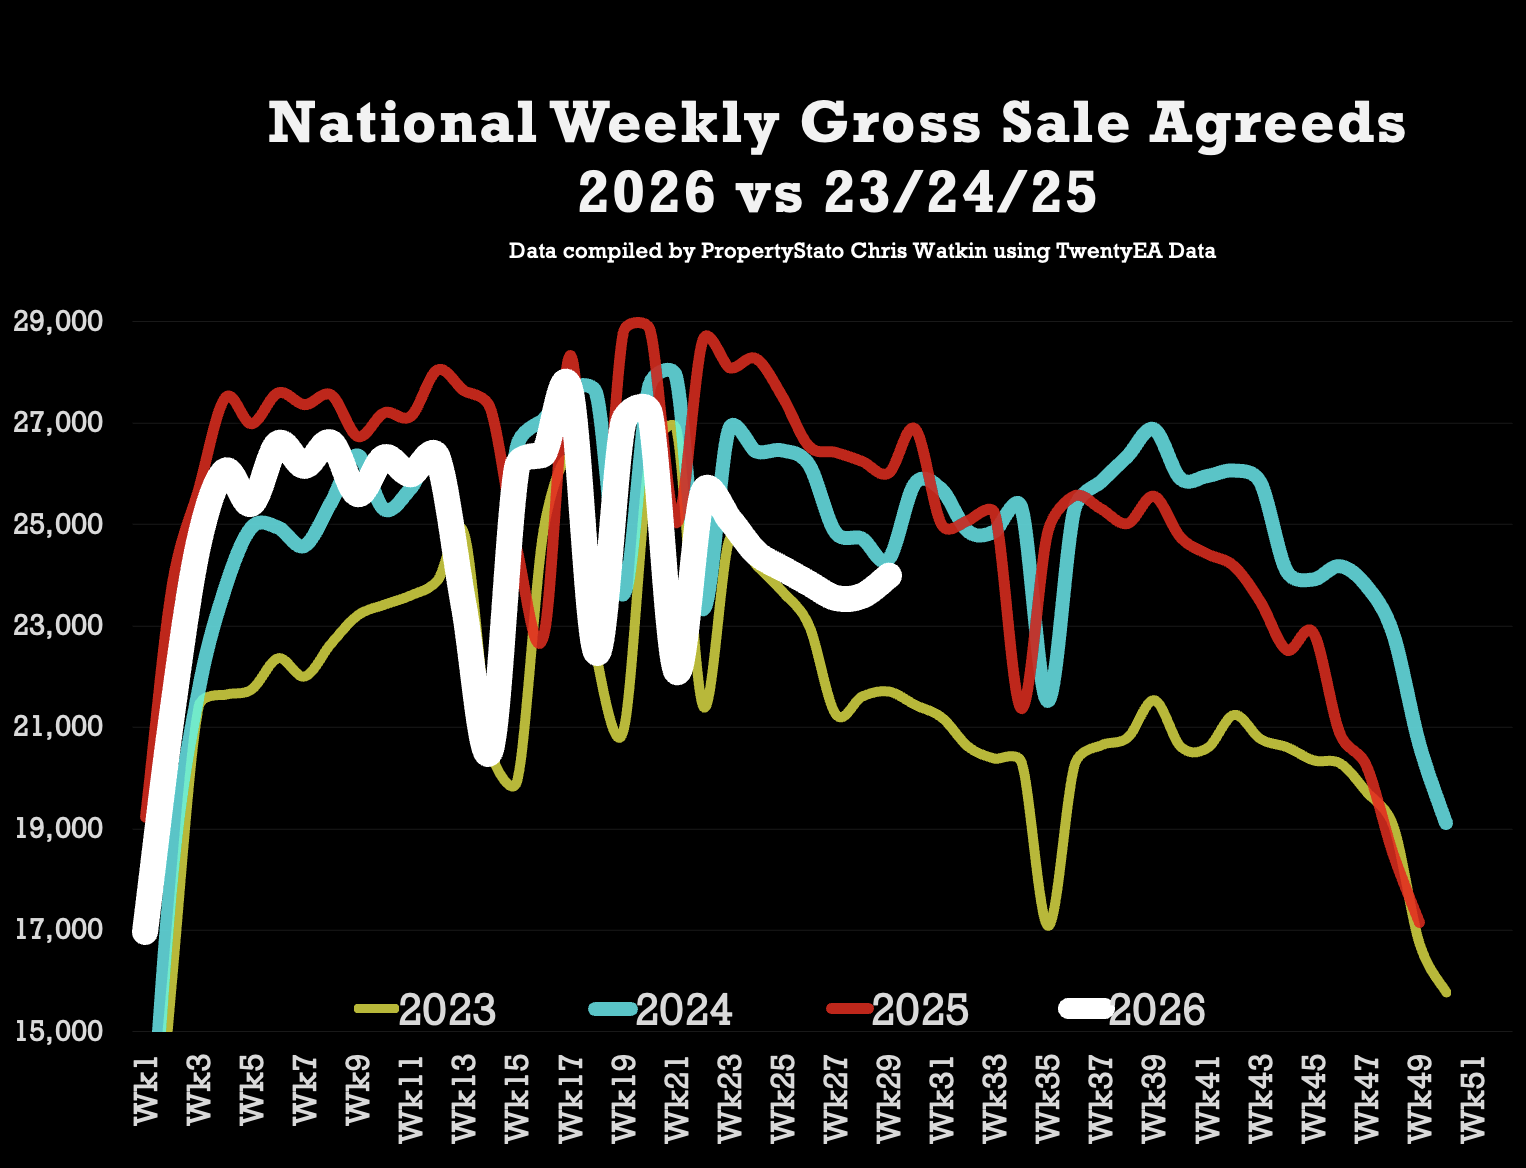
24k homes sold stc this week 28 (23.6k last week)
10 year week 29 average : 24.8k
2026 weekly average : 24.7k.
July Figures
The July property market figures tell two very different stories, depending on which year you choose for comparison.
Across the UK, the number of homes sold subject to contract was 5.2% lower than in July 2025. Yet sales were still 13.6% higher than in July 2023, when the property market was struggling with rapidly rising mortgage rates and weakened buyer confidence.
Here is how every region performed:
+ East Midlands: down 3.9% compared with July 2025, but up 20.3% compared with July 2023.
+ East of England: down 2.7% on 2025, yet up an impressive 21.1% on 2023, the strongest three-year improvement of any region.
+ London: down 4.4% against 2025 and only 5.6% ahead of 2023, making the capital the clear laggard.
+ North East: down 4.4% year on year, but still 12.3% higher than in 2023.
+ North West: down 9.5% compared with 2025, the largest annual fall, although activity remained 15.3% above 2023.
+ Scotland: up 0.3% against July 2025 and up 15.7% compared with 2023. It was the only region to record annual growth.
+ South East: down 5.9% year on year, but 12.9% ahead of 2023.
+ South West: down 3.1% compared with 2025 and up 11.5% against 2023.
+ Wales: down 4.9% year on year, while remaining 11.9% above July 2023.
+ West Midlands: down 6.0% against 2025, but up 14.4% compared with 2023.
+ Yorkshire and the Humber: down 7.4% year on year, although sales were still 11.0% higher than in July 2023.
+ Nationally: sales were down 5.2% compared with July 2025, but up 13.6% compared with July 2023.
So, is the property market improving or weakening?
The honest answer is that it has cooled from last year, but it is nowhere near the difficult conditions experienced in 2023.
Most regions are seeing fewer sales agreed than in July 2025. However, every region except Scotland is being compared with an unusually active 2025 market. Against 2023, every region is comfortably ahead. The biggest lesson is that national headlines rarely tell the whole story.
For homeowners, this means there are still buyers in the market, but they have more choice and are less forgiving when a home is launched at an unrealistic asking price. Properties that are well presented, marketed properly and sensibly priced are still attracting interest. Those that chase the market from behind may struggle.
The figures do not suggest a property market in crisis. They suggest a more selective market where preparation, presentation and pricing matter.
Year to Date for house sales
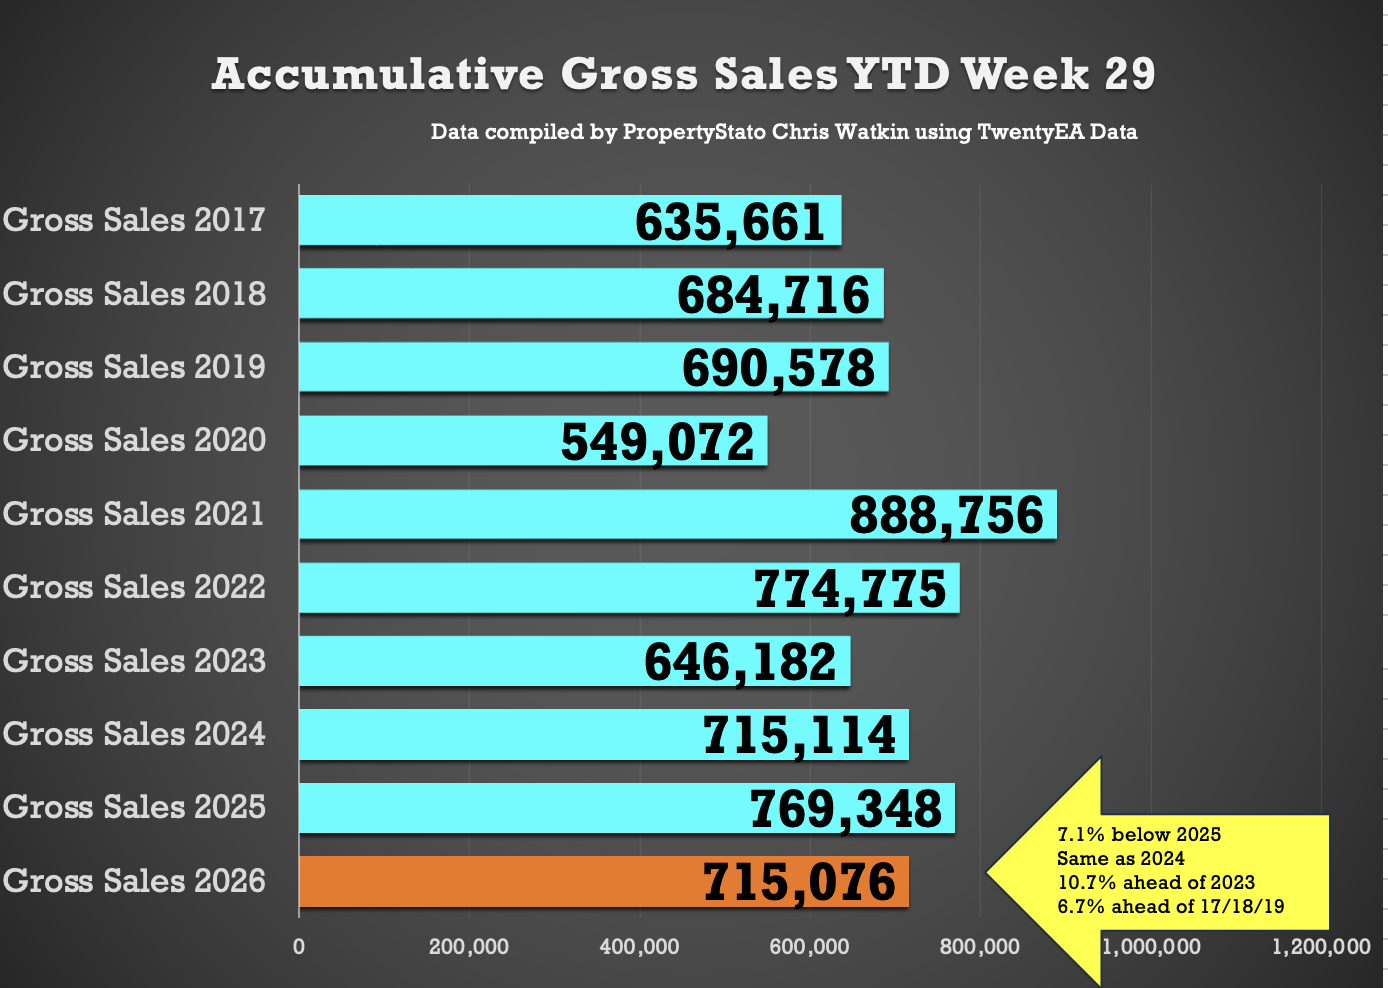
715k UK homes sold stc YTD
7.1% lower than 2025 YTD (769k)
Yet still Gross Sales YTD are still …
Identical to 2024 YTD (715k)
10.7% higher than 2023 YTD (646k)
6.7% higher above pre Covid 2017-19 years (670k).
Decade average – 707k YTD.
🟩 UK Net Resi Sales YTD
(Net Sales being Gross Sales less Sale Fall Thrus).
Week 28
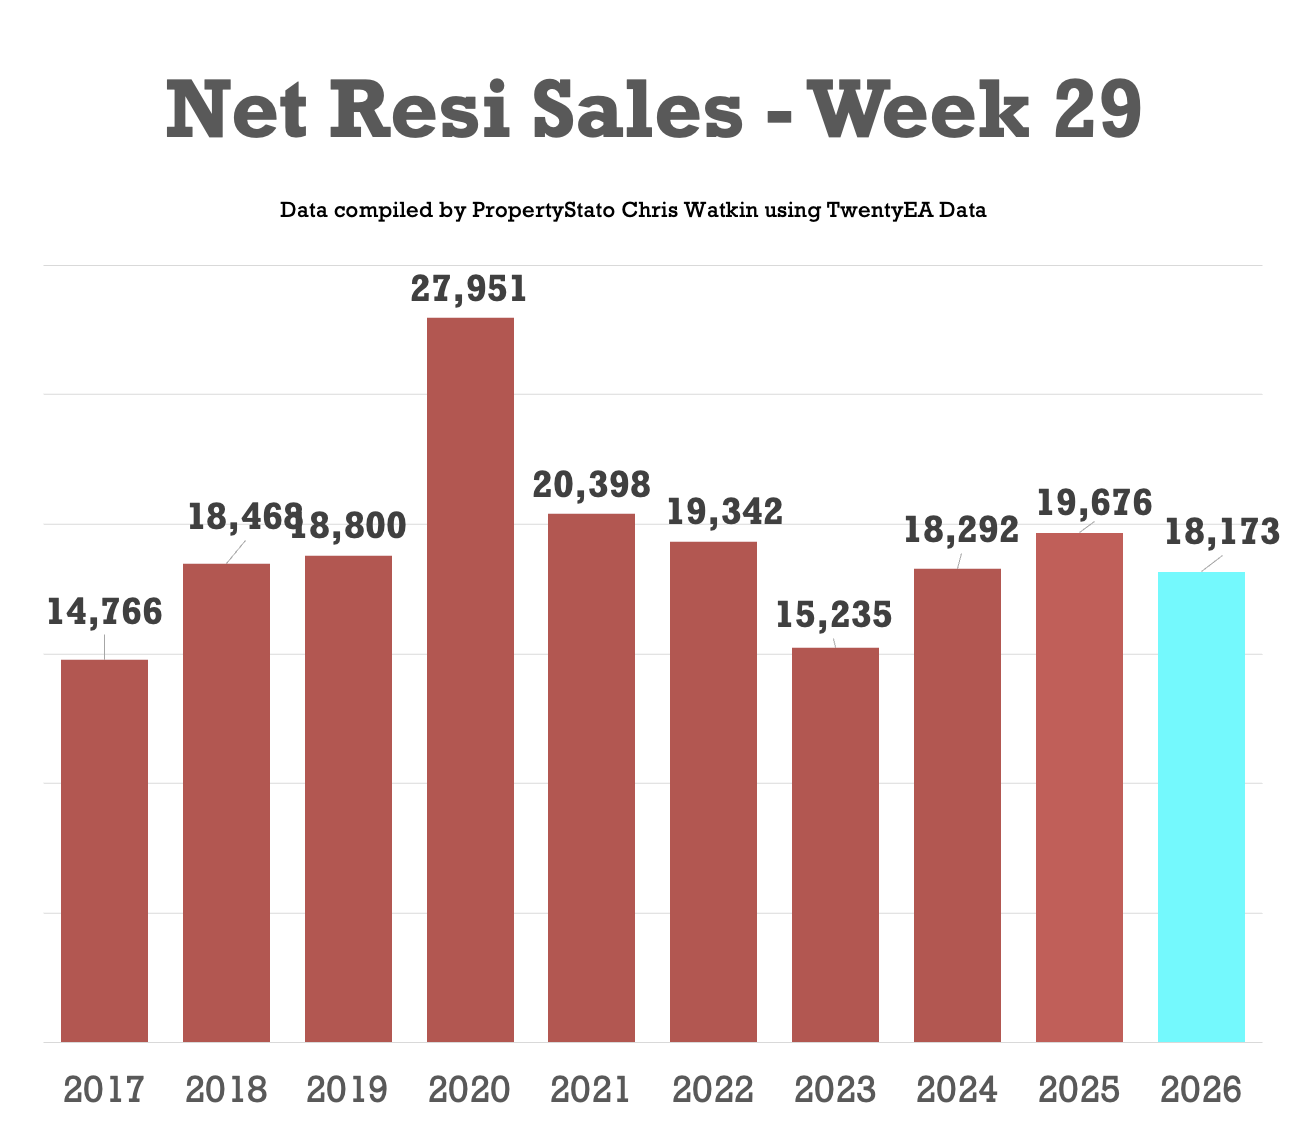
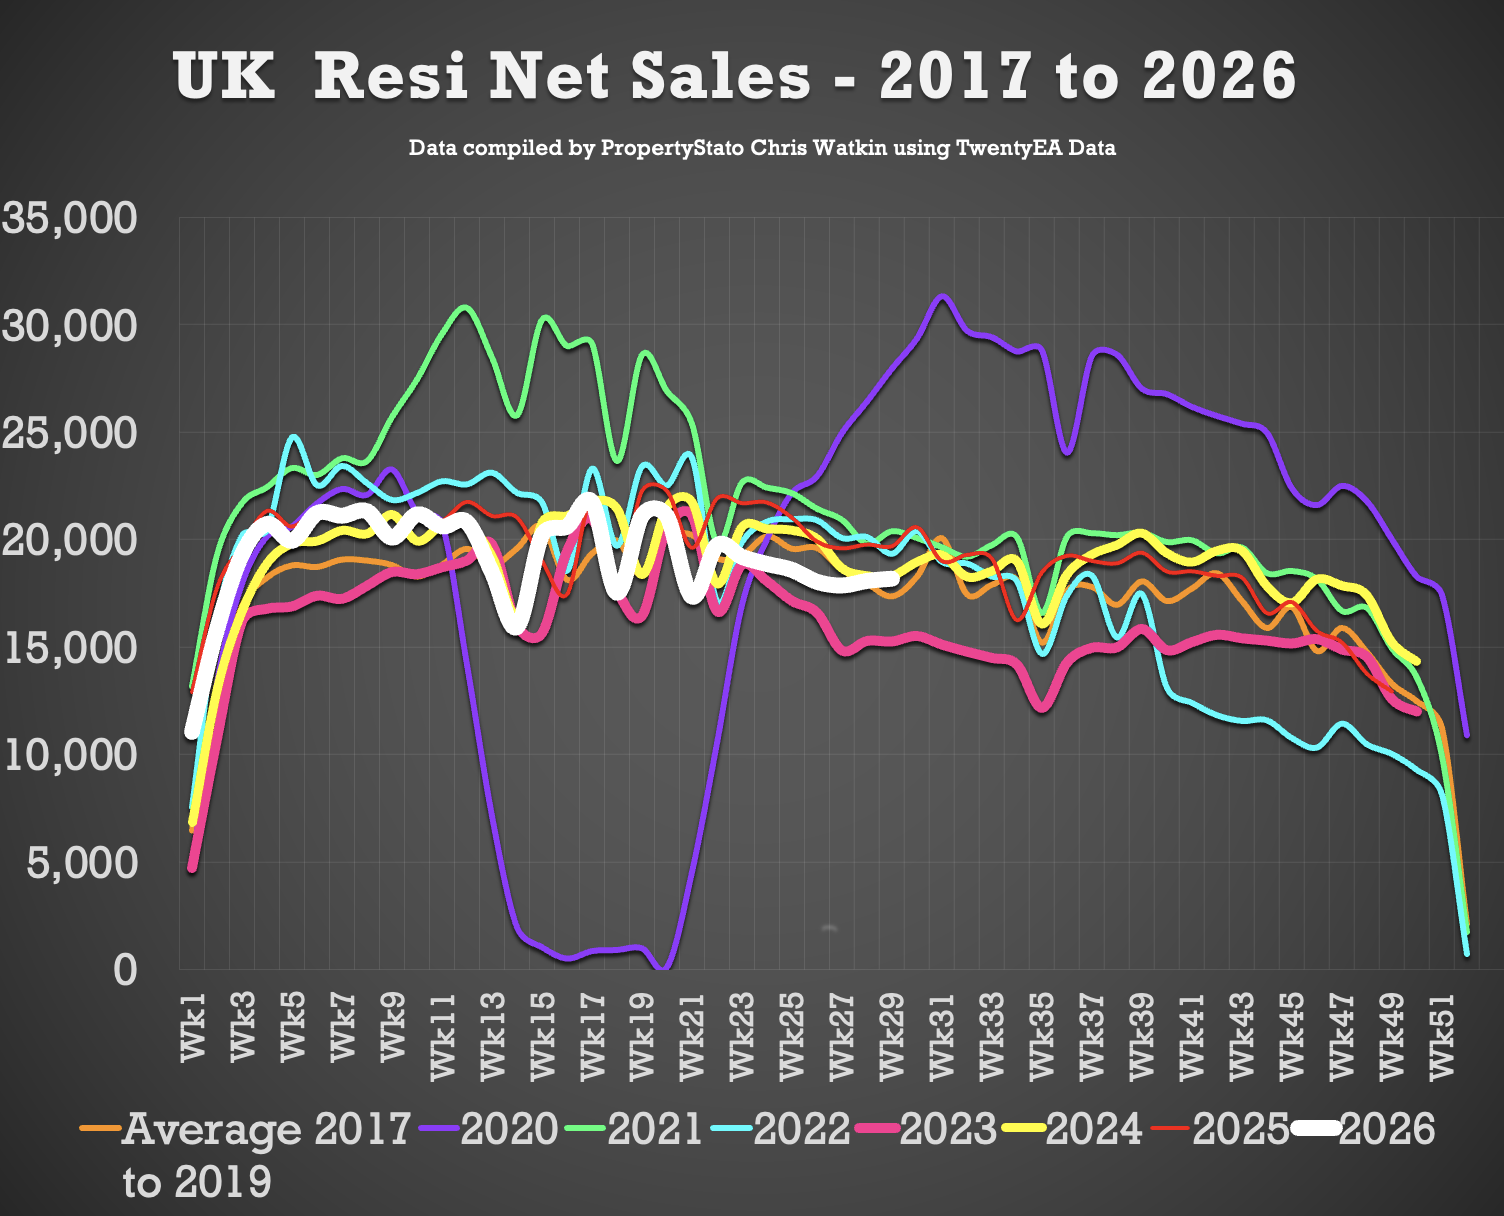
18.2k Net Sales (18.1k last week)
10 year Week 28 average: 19.1k.
Weekly average for 2026: 19.2k.
Year to Date
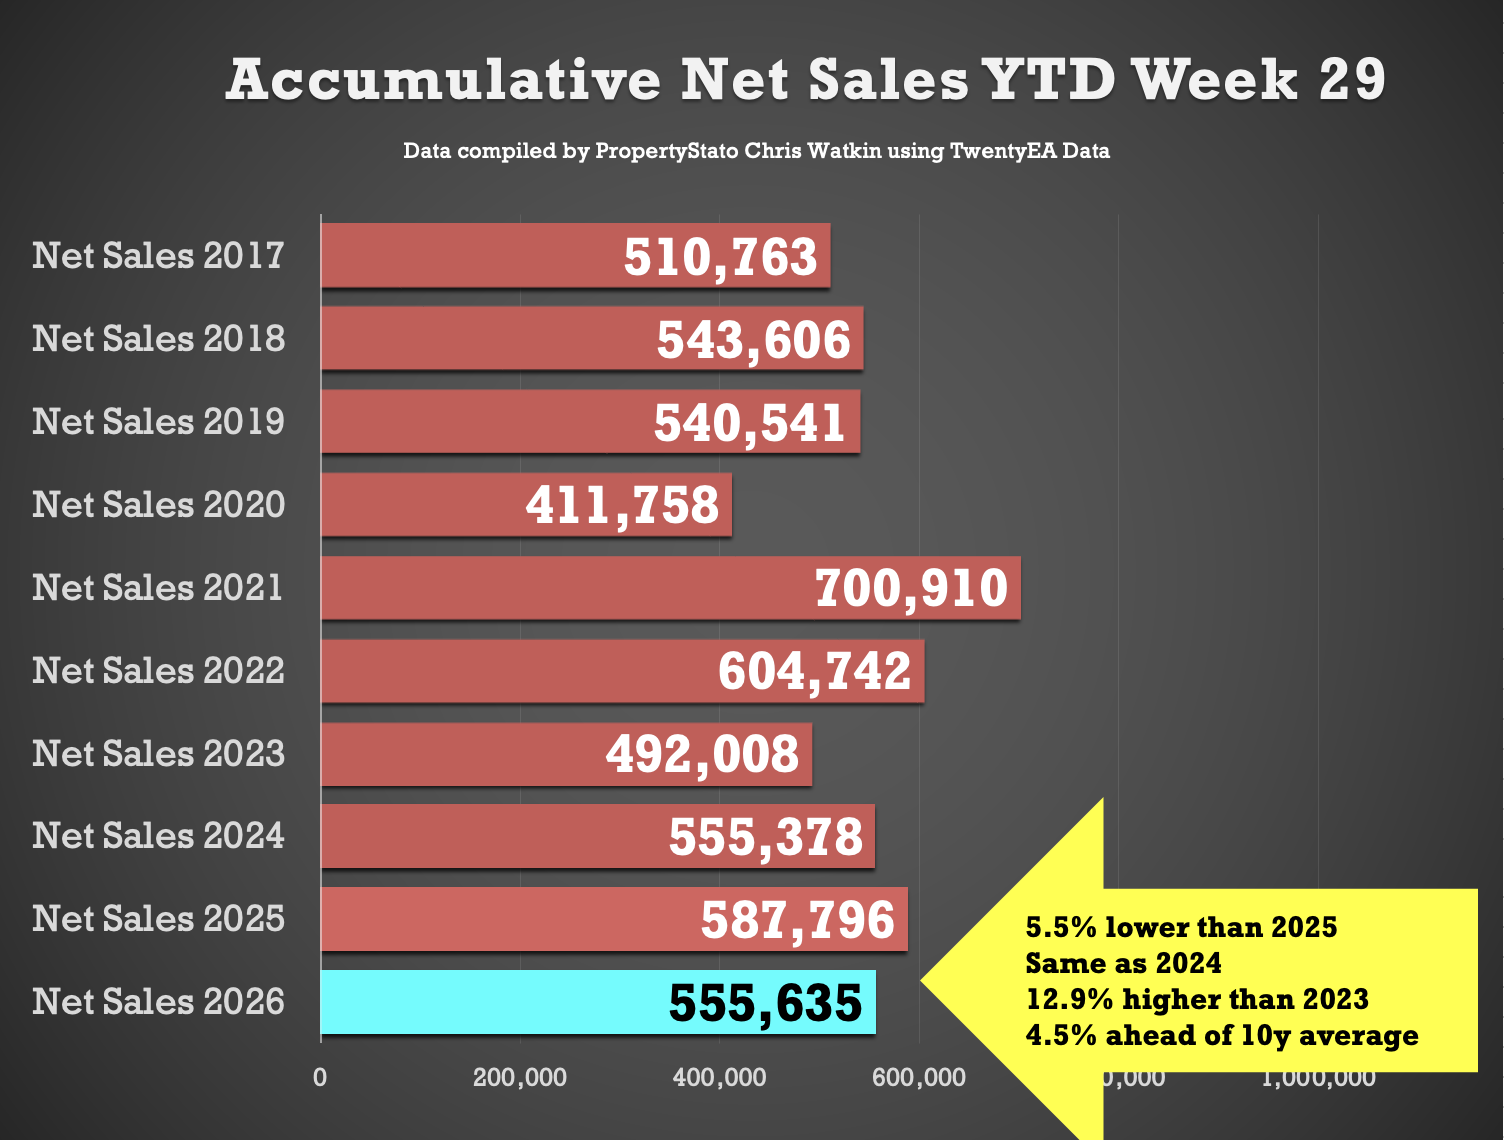
556k UK net home sales YTD
5.5% lower than 2025 (588k),
Same as 2024
12.9% ahead of 2023 (492k)
4.5% above the 2017–19 average (532k).
🟩 Exchanges & Withdrawals
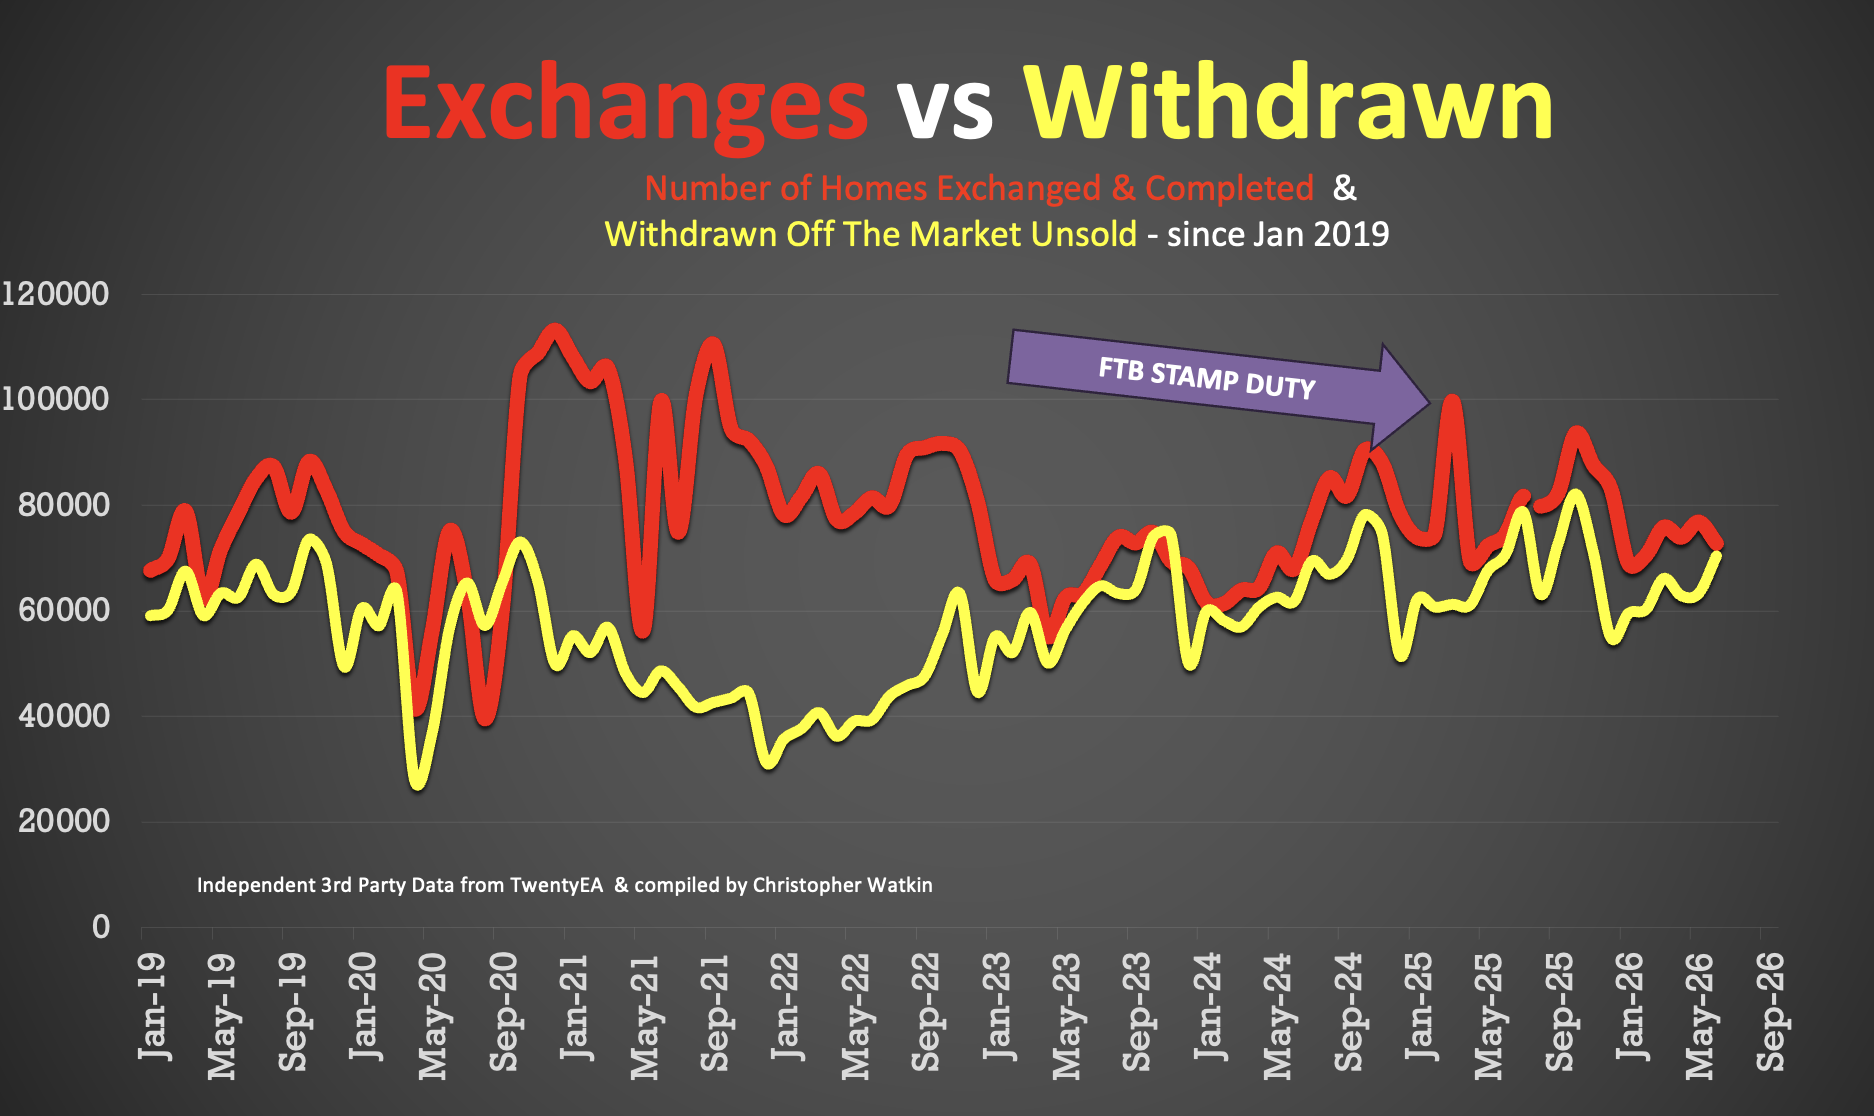
• 72.7k Exchanges in June 2026 (note this figure will rise during July as more exchanges get reported. On past trends, expect that to end on late 70k’s
• 70.4k Withdrawals in June 2026 – again, this figure will increase as more June withdrawals come thru the system throughout July
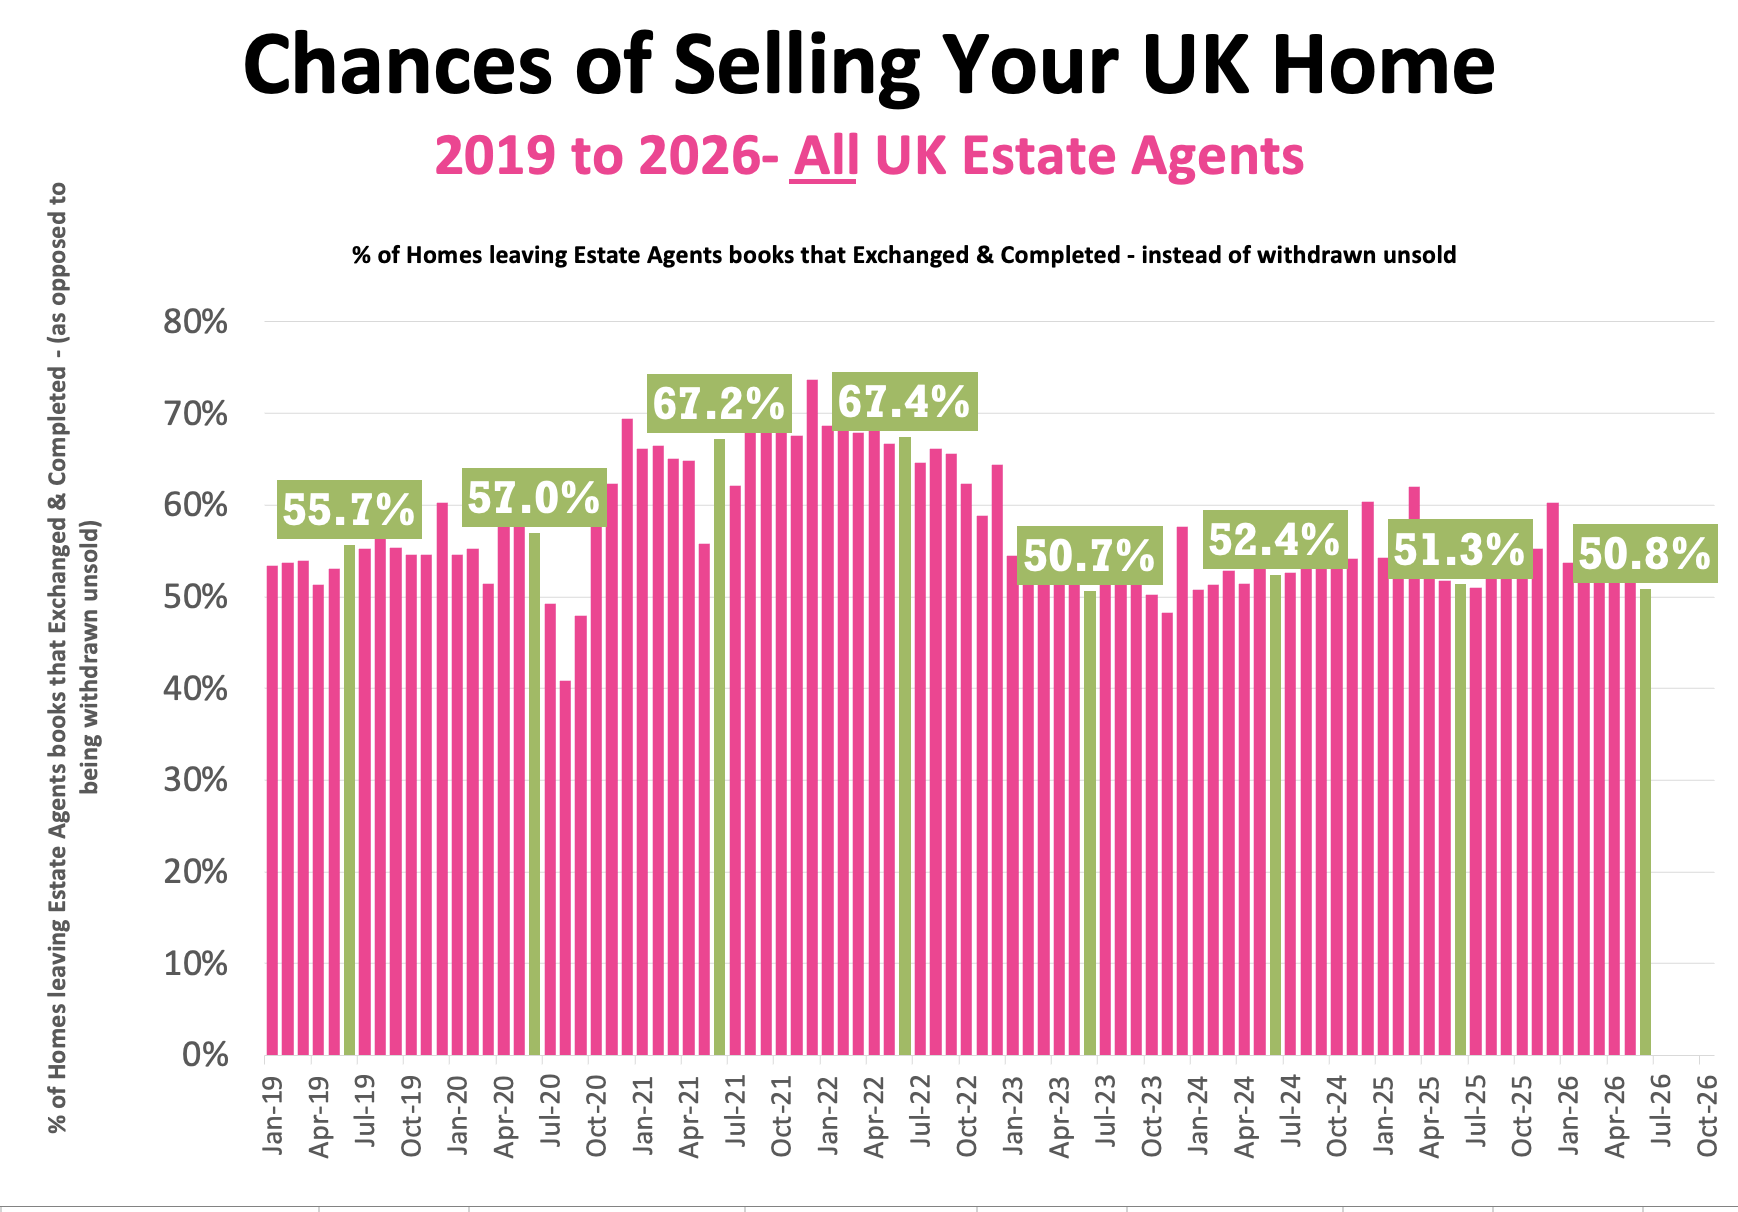
• Therefore, in June 2026, only 50.8% of homes that left agents’ books exchanged & completed in June (the rest – 49.2% withdrew, unsold)
• 57.6% is the 7 year average exchange to listings ratio (which includes the crazy years post lockdown 18 months). Graph 28 Graph 29
🟩 Additional info …
🟥 Price Reductions
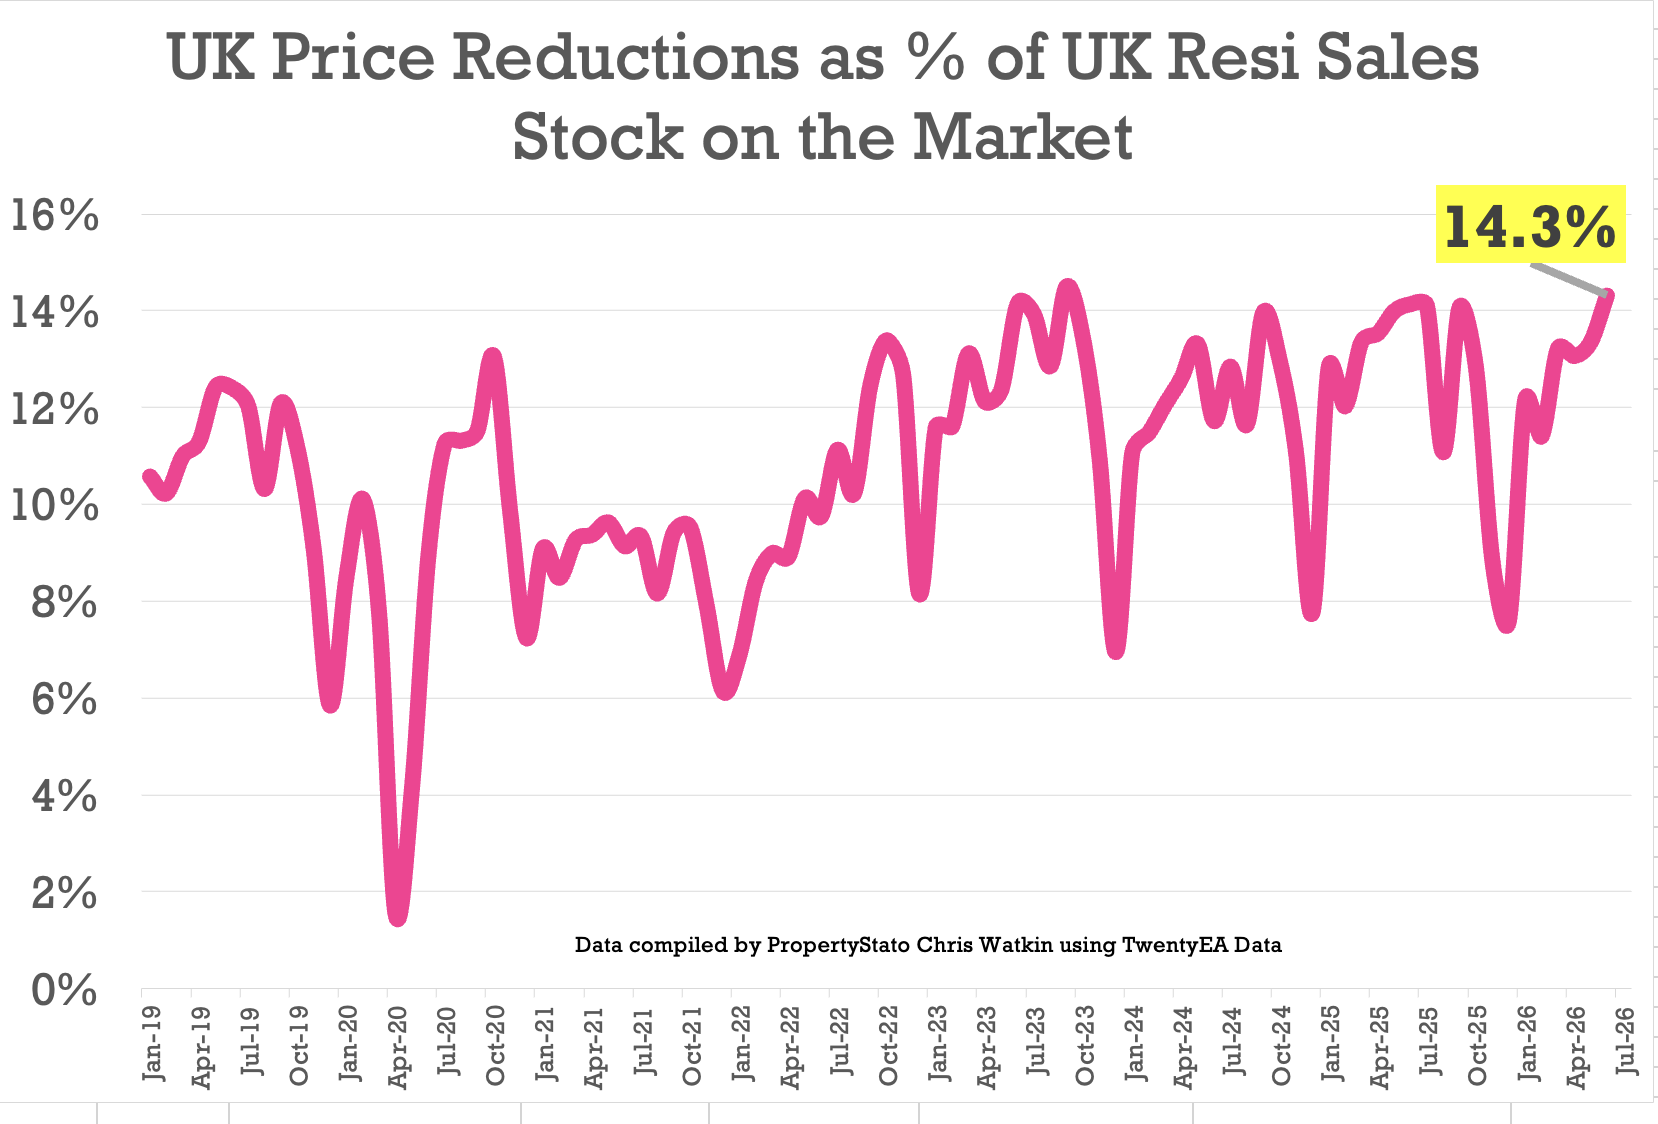
• 24.7k reductions this week on a 760k UK homes for sale
• 14.3% of UK homes for sale were reduced in June (up from 13.4% in May)
• 2026 YTD average 12.9%, versus the 6-year long-term average of 10.7%.
🟥 Price Difference between Asking Price of Listings & Asking Price of those Homes that go Sold stc
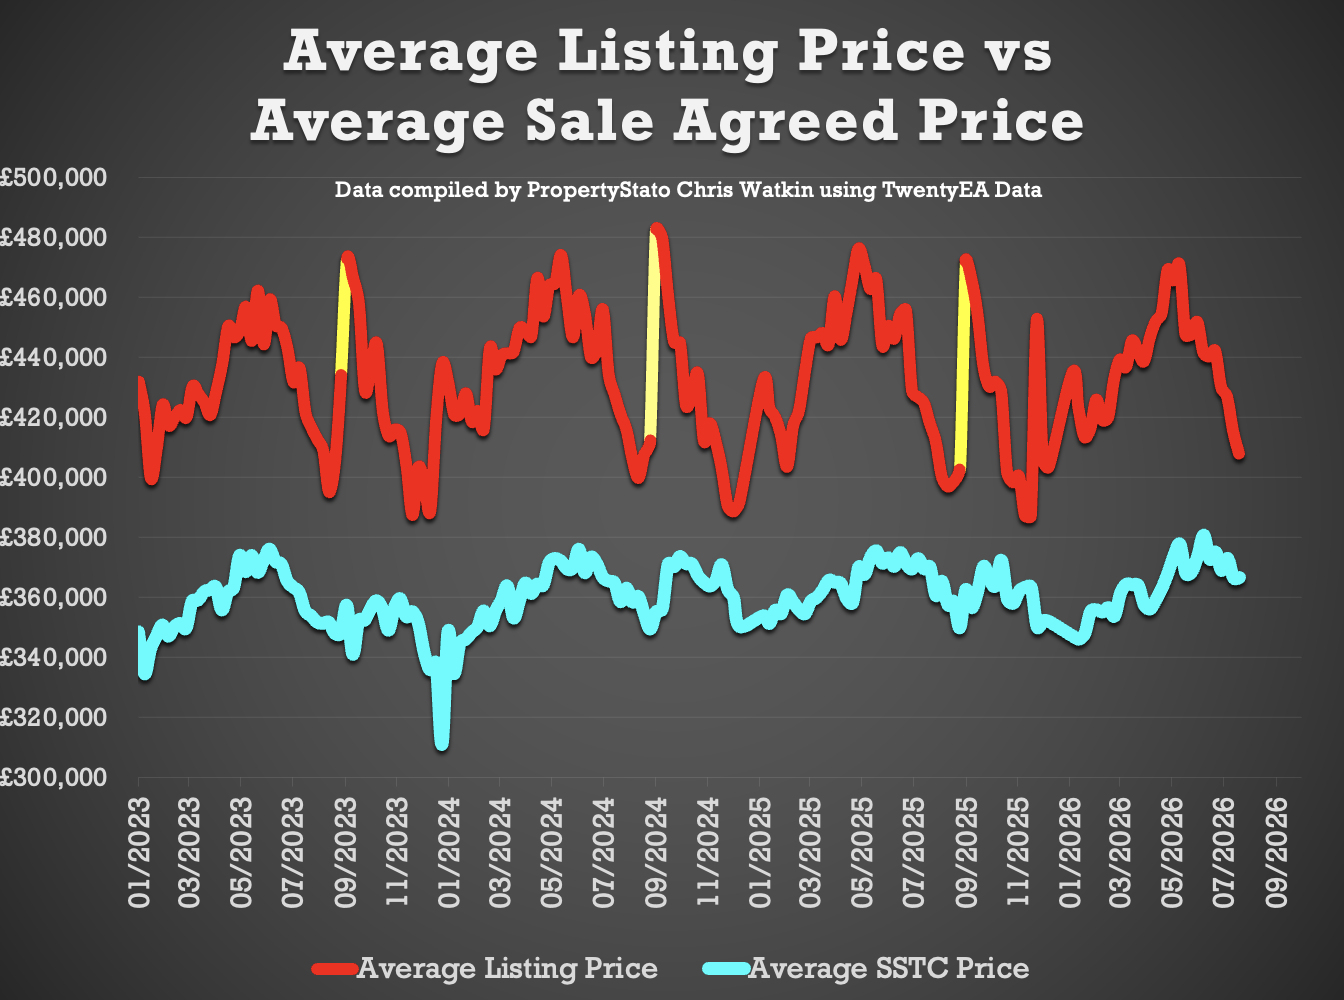
• 11.3% difference (long term 10 year average is 16% to 17%). (£408k ave Listing Ave Asking price vs £367k Sale Agreed ave Asking price).
🟥 Sell-Through Rate
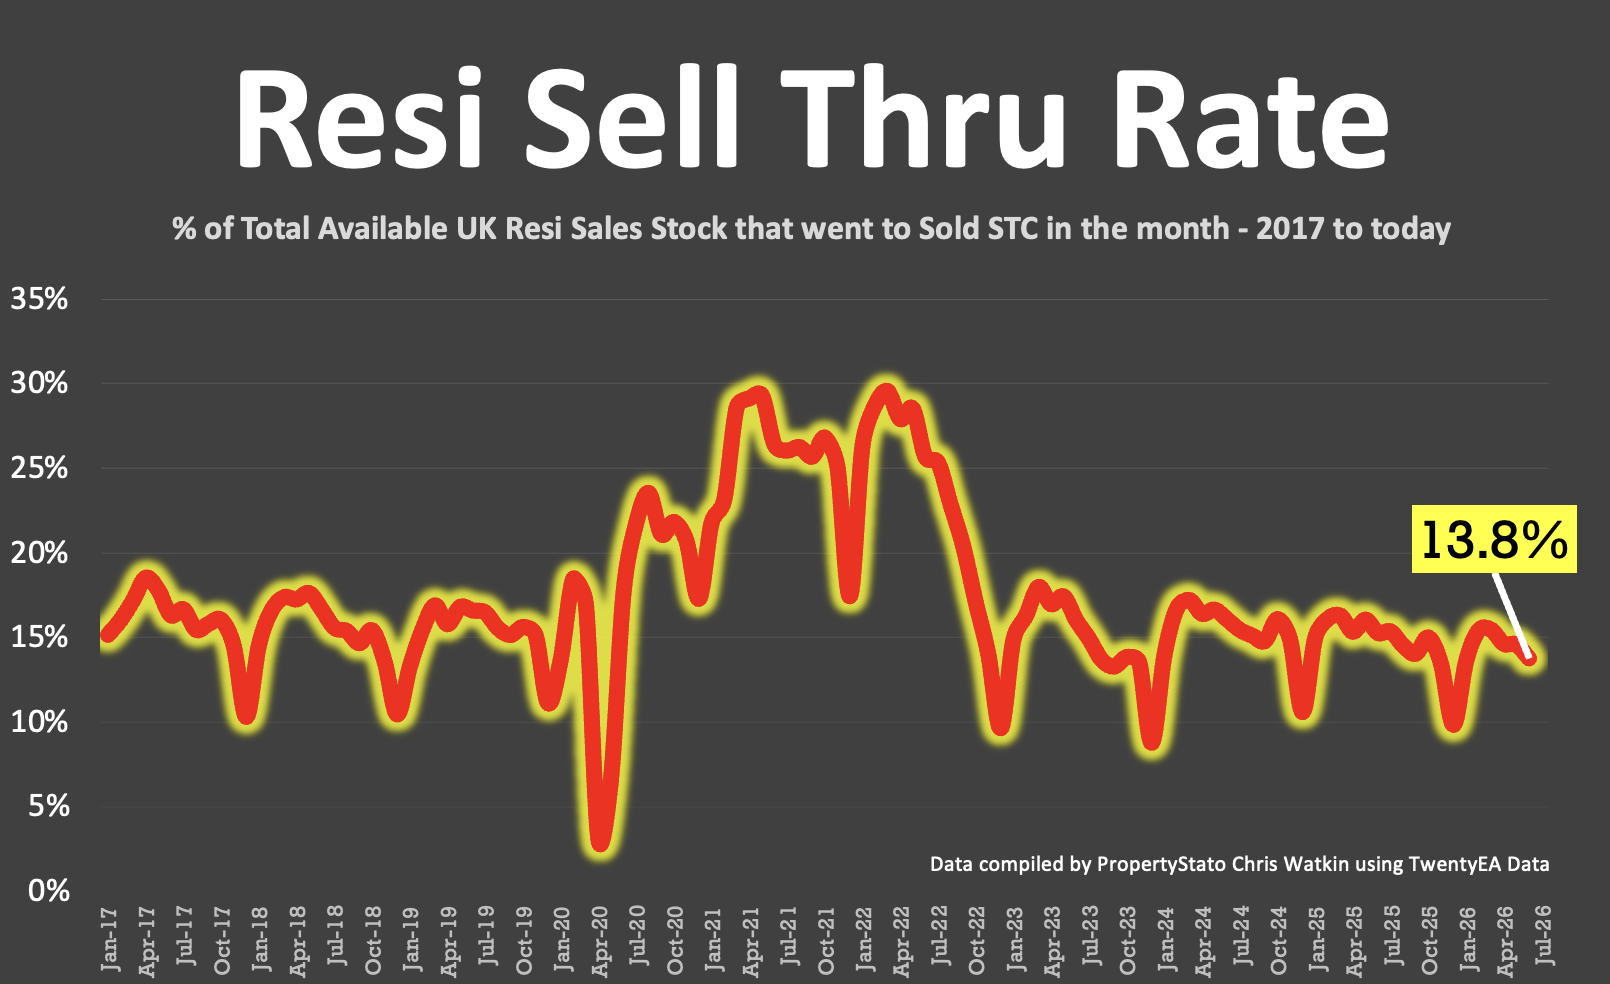
• 13.8% of homes on agents’ books went SSTC in June ’26 (compared to 14.6% in May ’26).
• Pre-Covid average: 15.5%.
🟥 Sale Fall-Thrus
• Fall-thru rate 24.3%
• Decade average: 24.5%
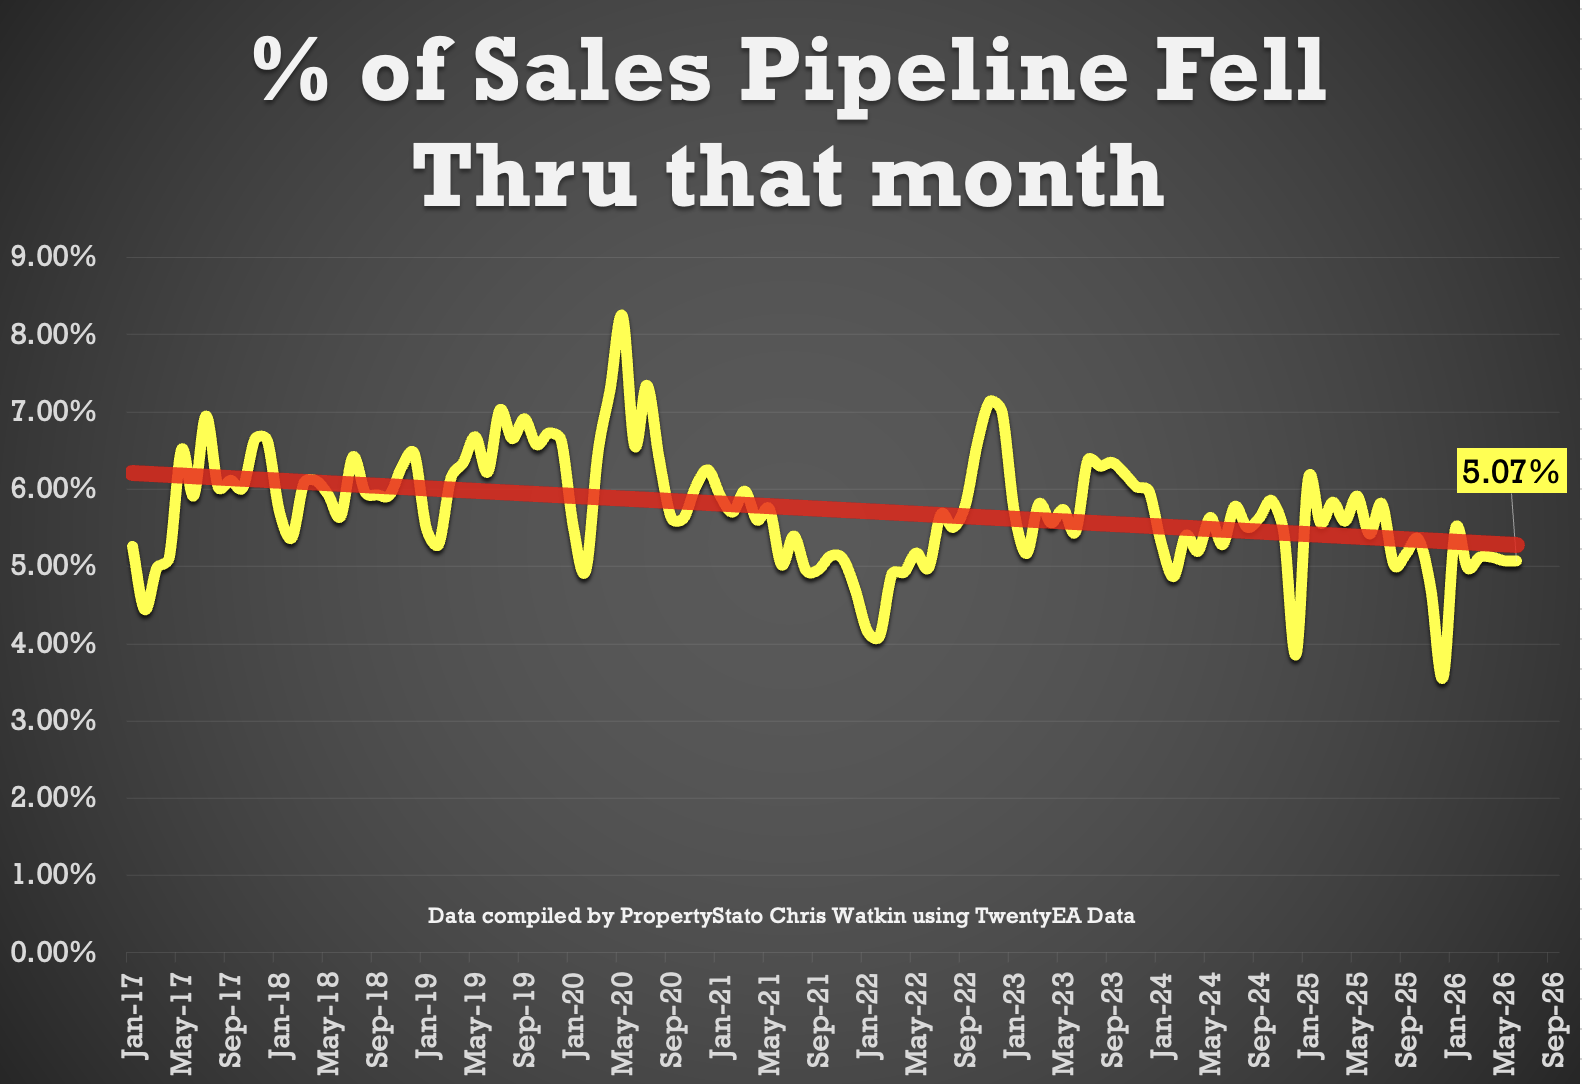
• 5.07% of homes sold STC fell thru in June 2026, below both the 2025 average of 5.3% and the 10 year average of 5.8%.
🟥 Stock Levels
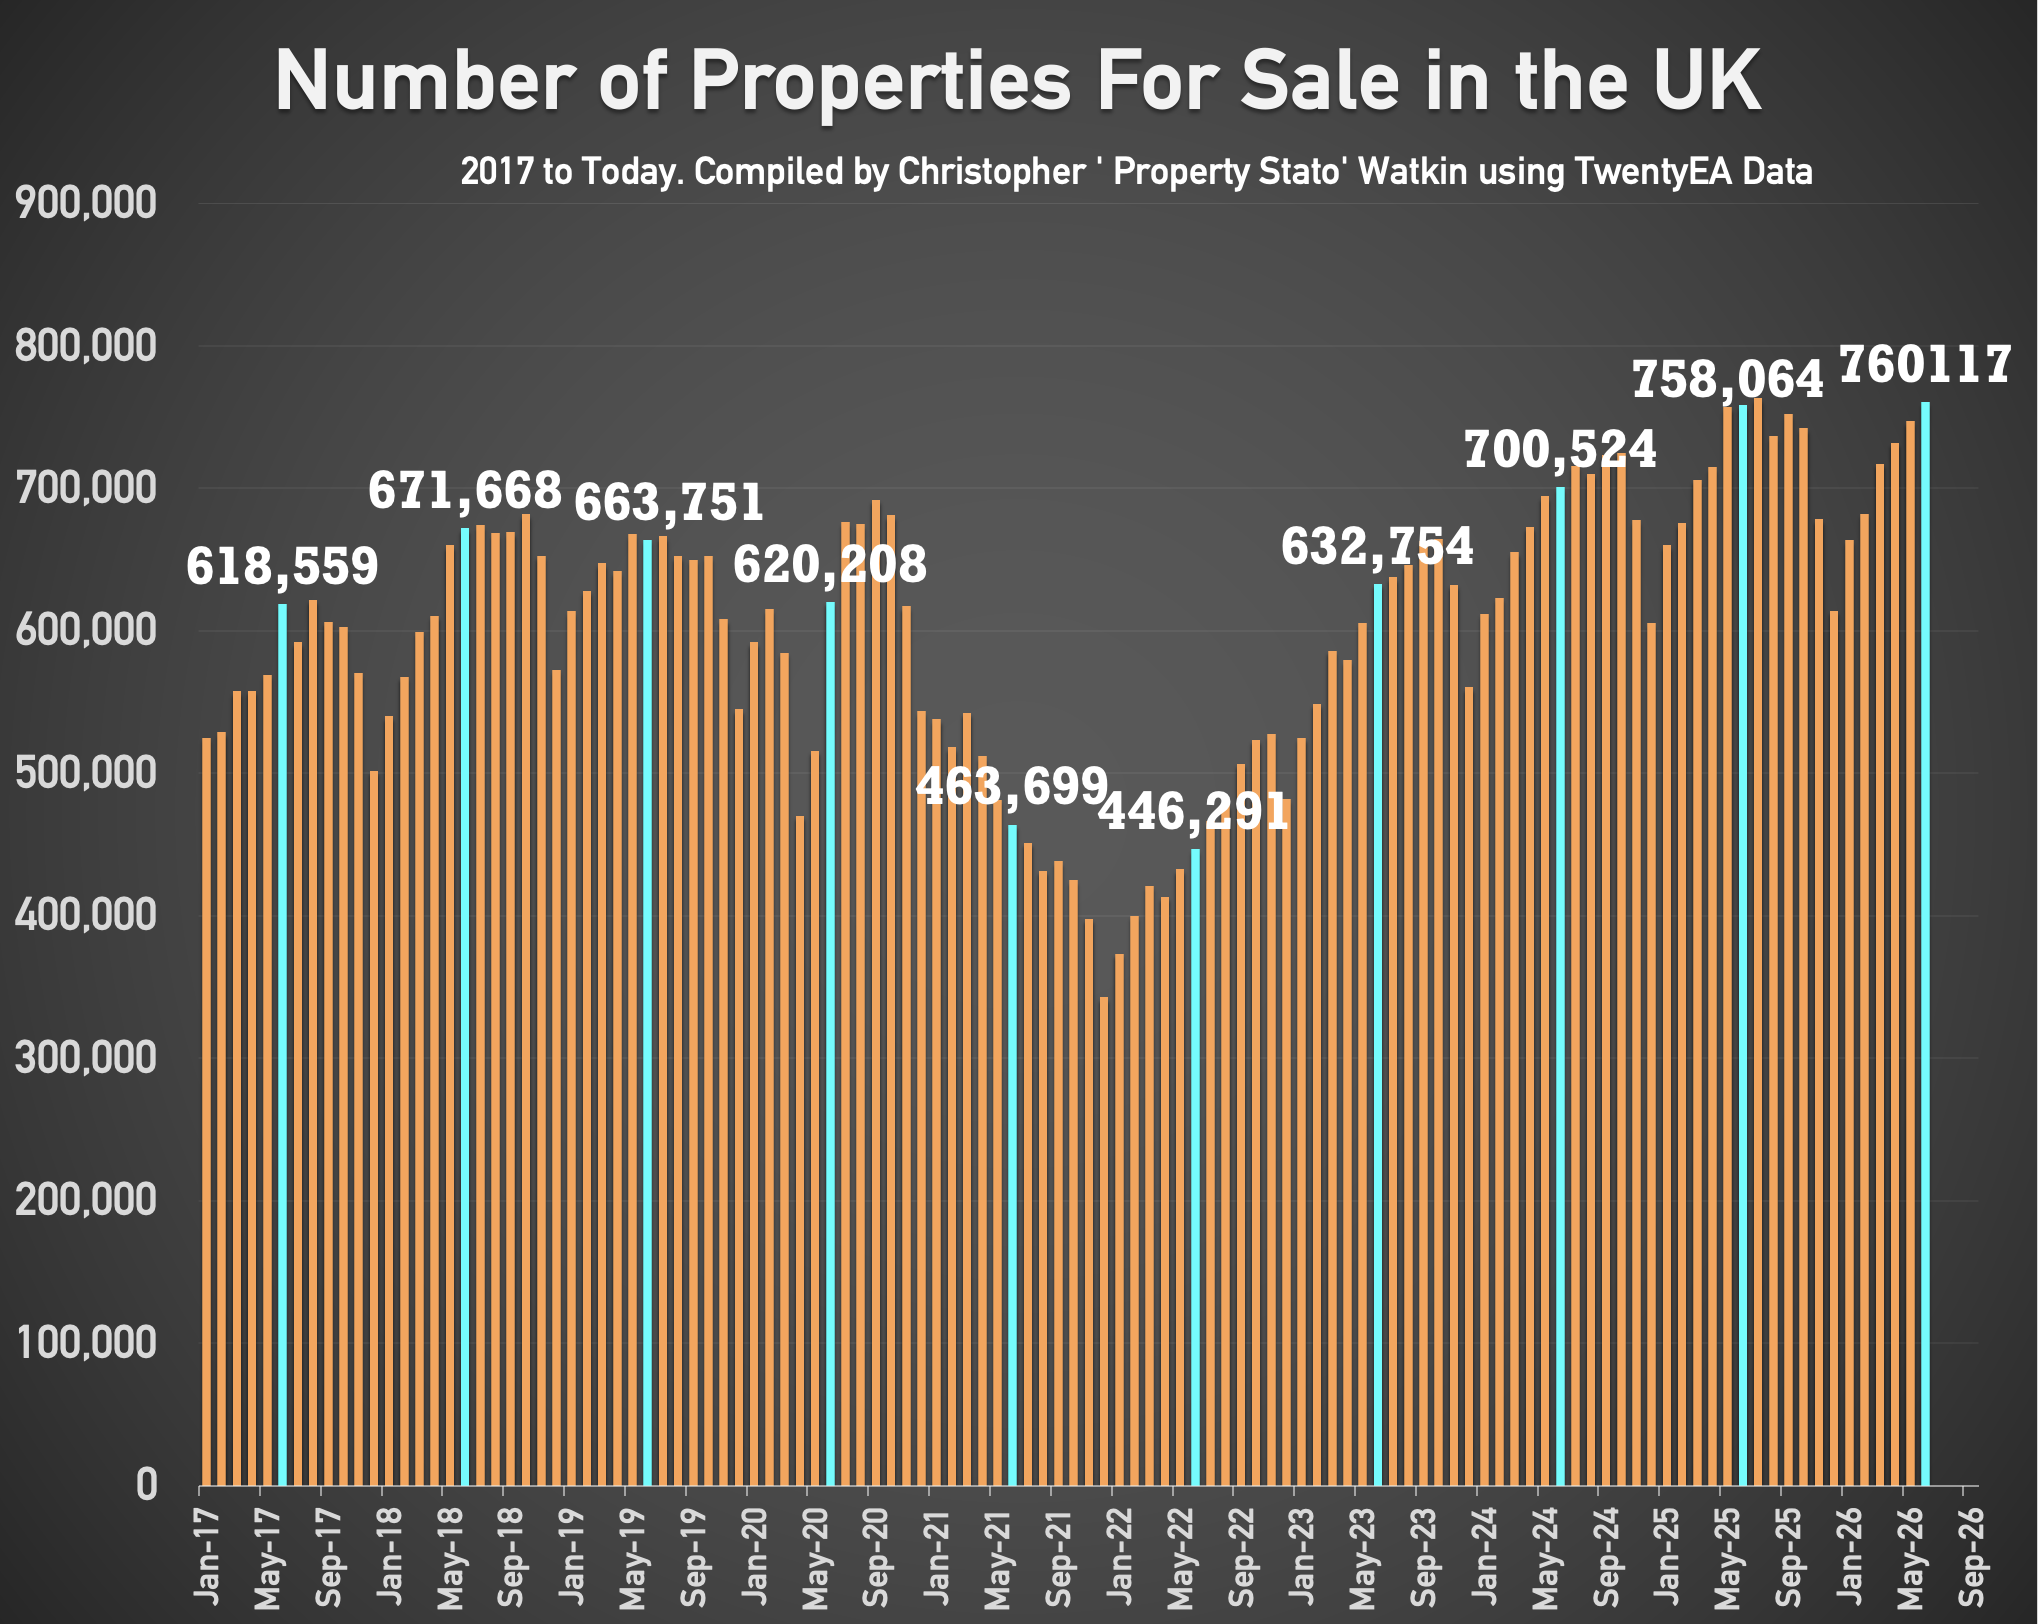
• 760k homes on the market on the 1st of July ’26 (747k the month before and 763k 12 months ago)
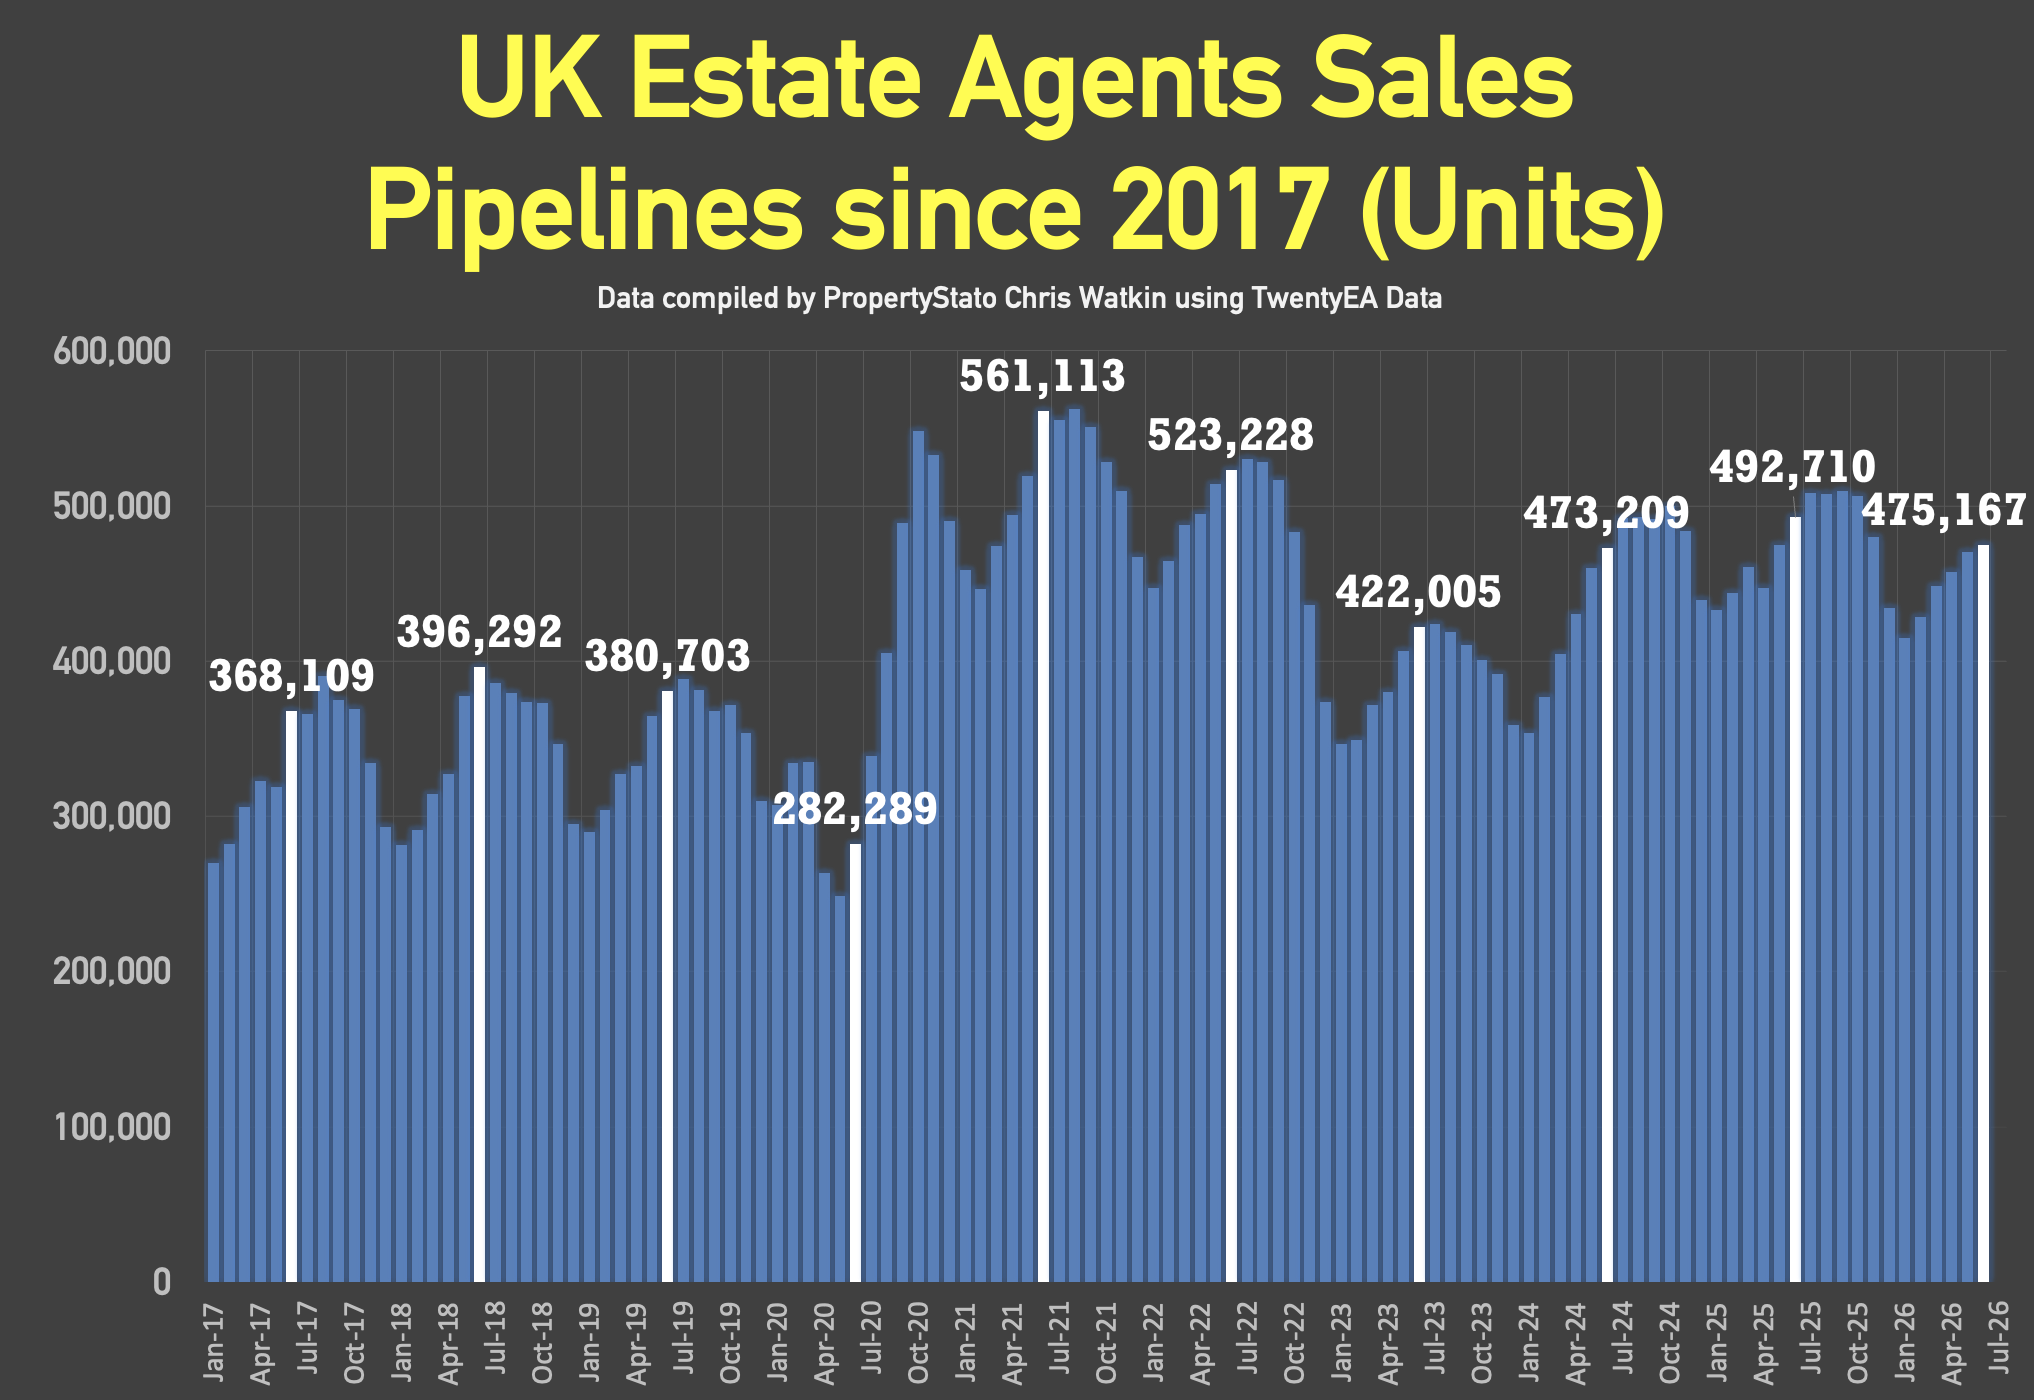
• 475k homes in agent’s sales pipeline on the 1st July 2026, lower than 12 months ago on 1st July ’25 (493k). Graph 38 Graph 39
🟥 House Prices (£/sq.ft)
• June ’26 agreed sales averaged £350.22 per sq.ft. 1.94% higher than 12 months ago (£343.54) and 12.3% than 5 years ago (£311.93). The £/sqft at sale agreed matches the HM Land Registry Index with a 98% accuracy, 5 months in advance. That is why it is so important.

🟥 UK Rental Data
• Average Rent in Wk 29 – £1,783 pcm
• Average Rent in July 2026 – £1,840 pcm
• Average Rent in June 2026 – £1,808 pcm (£1,791 in June 25)
• Average Rent in YTD 2026 – £1,758 pcm
• 315k UK Rental Stock available to rent in June 26 (307k in June 2025)
🟥 Local Focus this week in the Show
In the second half of the YouTube Stats Show, myself and Ben Madden analyse whom is the best Estate & Letting Agent in Luton







Comments (6)
Load of waffle. Market still crap
Kensal Preperties … how do you account for the cold hard facts in the graphs???
I know it might not feel like it, yet July was a much better month in the UK Property Market when compared to April, May & June.
In July, the housing market showed the first signs of stabilising & improving after several subdued months, with the latest figures indicating that the slowdown in sales has eased during July.
After running around 10% behind 2025 levels since Easter, the monthly gap in agreed sales narrowed to 5.2% last month. Net sales (which account for fall-throughs) have particularly strengthened over the past fortnight, bucking the seasonal trend of activity slowing during the summer (see the graphs and the video from minute 13)
Nope.
So how would you explain the uplift in gross and net sales shown in the graphs and discussed in the video? Do let us know, Sussex Idler ???
Nope.