
House prices were static in April, edging down just 0.1% on March’s figures, the Halifax has reported.
It puts the “seasonally adjusted” average sales figure for April at £219,649 – up 3.8% on a year ago.
Martin Ellis, Halifax economist, said: “House prices have stagnated over the past three months.
Housing demand appears to have been curbed due to a deterioration in housing affordability, driven by the sustained period of rapid house price growth during 2014-2016.
“Signs of a decline in the pace of job creation and the beginnings of a squeeze on households’ finances as a result of increasing inflation may also be constraining the demand for homes.”
Separately, Miles Shipside of Rightmove has responded to the Agent Provocateur column by Ed Mead last week, in which Mead queried the enormous differences in house prices given by some indices and the new asking price index issued by Rightmove.
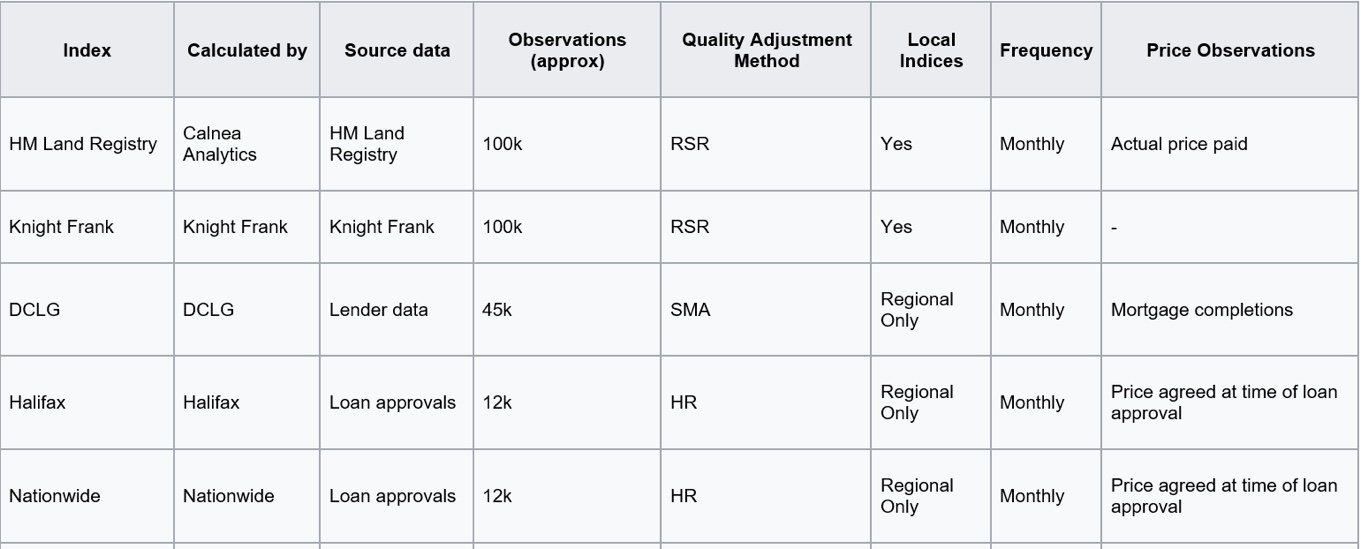
Shipside said: “Many of the indices not only measure prices at different timescales in the process, as you are aware, but also have different methodology to add to the confusion.
“Prices are therefore apple and pear comparisons in some cases so prices cannot be cross-referenced. The trend in price rises/falls can be compared amongst all, but some are leading indicators, some lagging ones, and some small sample sizes.
“Rightmove has the biggest sample of over 100,000 new listings, but is a lead price indicator. We remove approx 10,000 outliers every month to avoid distortions.
“Rightmove, Acadametrics and DCLG have the same methodology (and very similar prices), whilst other indices use one of two other methodologies.
“The big ‘gap’ in prices is not to do with multi-listings or online agents over-pricing, or the gap between asking and ‘sale agreed’, but purely down to mathematical calculation issues.
“On price gaps, we match properties on Rightmove with the Land Registry on individual properties where we have full address (but we do not publish this data), and the gap between final listed asking price and Land Registry varies between an average of 2% and 7% over the years depending on the state of the market.
“The Land Registry have quite a few issues on data accuracy, according to agents I speak to, and our analysis (as well as their methodology differences), so none of the indices are the complete article.
“But they are useful for trends and specifics in their speciality area.”








Comments (1)
Looking at that analysis our system of transaction average analysis seems to give us the edge. We are based on Land registry but with now over 160,000 detectable errors and duplications removed on a monthly basis we have all 22,000,000+ transactions back to 1995. It is searchable down out code and partial code and full postcode level. Ours is free from bias or influence or seasonal adjustment, we are simply reporting fact down to a microscopic local level with trendline analysis of volume and prices.
We’re busy working on linking transaction data with our clear view of agent portal activity so we can build an incorruptible agency rating system that’s based on fact rather than manipulated listings data and artificial reviews.
As for RSR,(repeat sales regression) that’s the biggest distortion of transaction average values; discounting properties that have sold once in the analysis period favours the high volume sales; the cheaper 1st and 2nd homes that get bought and sold more often than the aspirational larger detached stuff and places people retire to and stay put. We’ve estimated RSR eliminates about 64% of all transactions.
Our current transaction average price is currently about £280,000, that’s within a haggle of Rightmove’s asking price analysis once valuation lag is taken into account.
Our quality adjustment method? experience and understanding
We have a couple of USP’s seemingly absent from other systems so I’m sat here taking a great deal of pride and satisfaction in what we’ve built.