Residential stamp duty land tax receipts across England increased by 1% to £8,420m in the year to April 2020 from £8,370m the year before.
The statistics released from the HMRC shows that the number of residential transactions dropped by 1% to 1,023,000 from 1,036,000 over the period.
Properties valued at £250,000 or less accounted for less than 10% of residential receipts, whilst properties over £1m accounted for 44% of the total.
Given that first-time buyers acquiring properties under £300,00 did not have to pay stamp duty but did have to pay 5% on any portion between £300,001 and £500,000, the stamp duty exemption saved this group of buyers an estimated £541m in the year to April 2020.
There were 222,700 transactions that benefited from first-time buyers’ relief, up from 218,900 a year earlier.
Next year’s transaction figures however are likely to show a very different picture.
Nick Leeming, Chairman of Jackson-Stops, commented: “Currently, hundreds of thousands of buyers and sellers are rushing to beat the impending 31 March stamp duty holiday deadline.
“There’s no denying the stamp duty holiday has had its desired effect on the market – on the ground, we’ve seen a notable uptick in activity across every branch, with sales agreed last month amongst the highest on record across the Jackson-Stops network.
“The knock-on effect an active property market has on the wider economy is hugely significant, particularly at a time when businesses need people to spend.
“Yet, with latest data from Zoopla showing that 140,000 more buyers are presently waiting to complete their property transactions compared to this time last year, this stampede of activity is now resulting in delays from mortgage advisors, with lenders and conveyancers coming under immense pressure.
“With a no-deal Brexit on the cards and both the stamp duty holiday and the current Help to Buy scheme soon coming to a close, there needs to be urgent measures put in place to prevent another cliff edge. Further support is needed from government to avoid a chaotic and abrupt halt in activity at the beginning of next year and keep the market moving at a time when the economy needs it the most.”
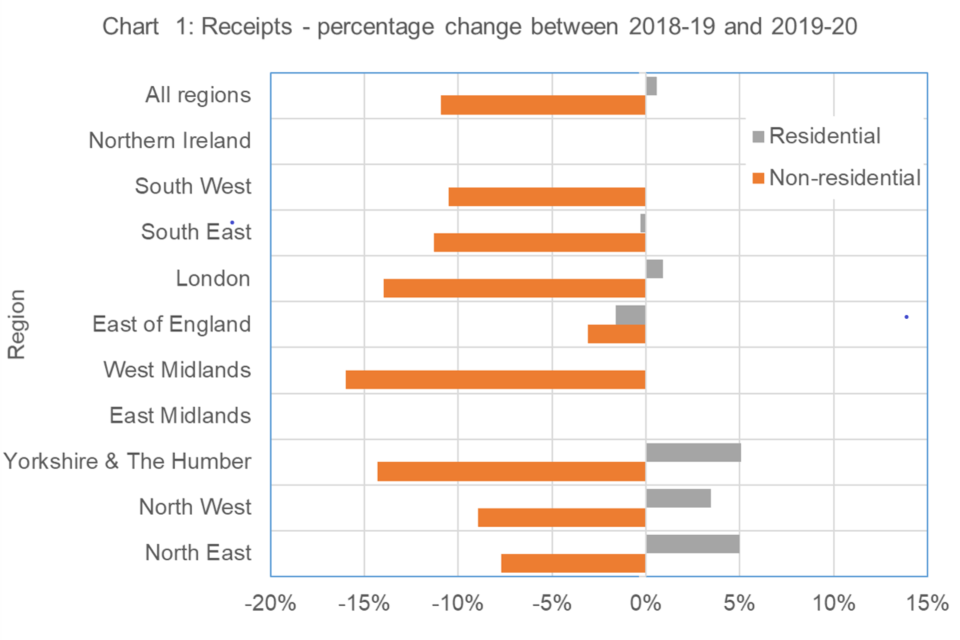
Percentage change in receipts by region between 2018 to 2019 and 2019 to 2020 by property type
This chart shows that receipts from residential transactions have stayed broadly the same apart from an increase of at least 3% in the North East, North West and the Yorkshire & The Humber regions.
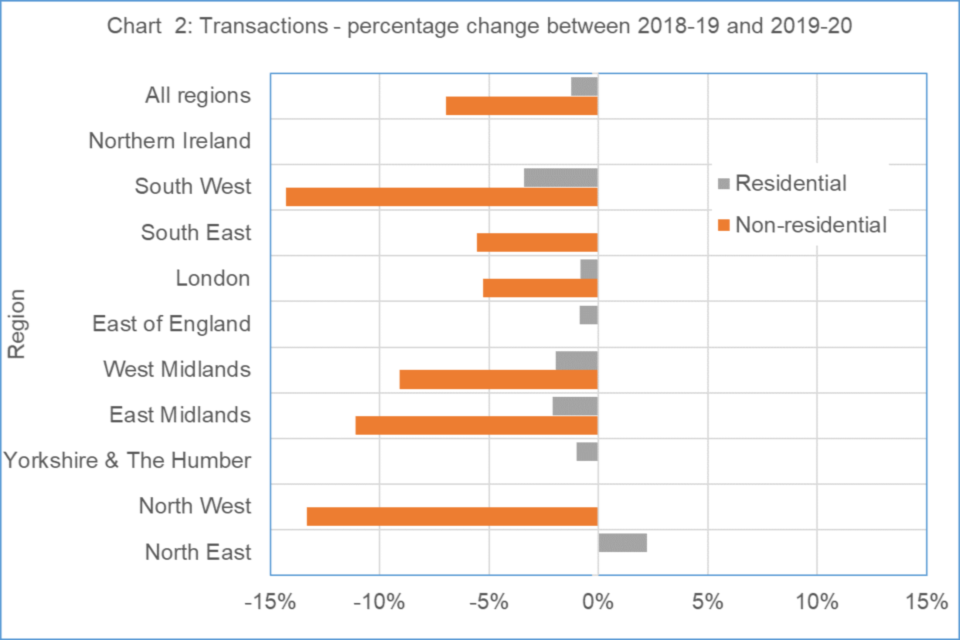
Percentage change in transactions by region between 2018 to 2019 and 2019 to 2020:
The chart below shows a breakdown of the percentage change in transactions by region, for both residential and non-residential transactions, between 2018 to 2019 and 2019 to 2020.
This chart shows that residential transactions have stayed the same or fallen slightly for all regions apart from the North East which has increased by 2% since 2018 to 2019.