

 The prime London housing market appears to be heading back to pre-pandemic times, the latest LonRes data reveals.
According to the latest figures, achieved prices in February were at similar levels to those recorded prior to the pandemic, while sales were just below their pre-pandemic average for February. However, the years leading up to the pandemic were not easy ones for the Prime London market as tax changes and political uncertainty hit confidence, prices, and activity. Whether this is the new normal for London’s prime markets, remains to be seen.
The Prime London housing market is showing signs of returning to pre-pandemic levels of activity. The latest data for February shows that while the number of properties sold during the month was 33% lower than last year, it was just 9.1% lower than the 2017-19 average (table 1). However, the number of properties under offer – a leading indicator for sales – was 10.5% higher than the pre-pandemic average. Meanwhile, the number of new instructions continued to rise: 14.0% higher than February last year and 23.6% higher than before the pandemic (table 1).
Table 1 – Monthly Prime Data – February
| Prime Sales | Prime Lettings | |||
| Annual
Change |
Change Since 2017-19 (pre-pandemic) | Annual
Change |
Change Since 2017-19 (pre-pandemic) | |
| Achieved prices/ rents | -2.8% | 1.7% | 8.4% | 19.0% |
| Properties sold/let | -32.9% | -9.1% | -29.5% | -59.4% |
| New instructions | 14.0% | 23.6% | -4.5% | -48.7% |
Source: LonRes
It is a similar story for prices across Prime London. Recent falls in prices are similar to those recorded by national indices such as Nationwide (chart 1). However, the Prime London market has recorded much lower price growth than the national market since 2015 when stamp duty changes hit the top-end of the housing market hardest.
Even the recent housing boom of 2020 – 2021, while having a bigger impact on activity at the top-end, boosted prices more in lower value markets. As such, the relative under-performance in prices relative to the national average has continued with Prime London prices in February just 1.7% above their pre-pandemic average (table 1) and still 5% below their 2015 peak.
There are multiple reasons for Prime London’s under performance in recent years but changes in taxation have been significant.
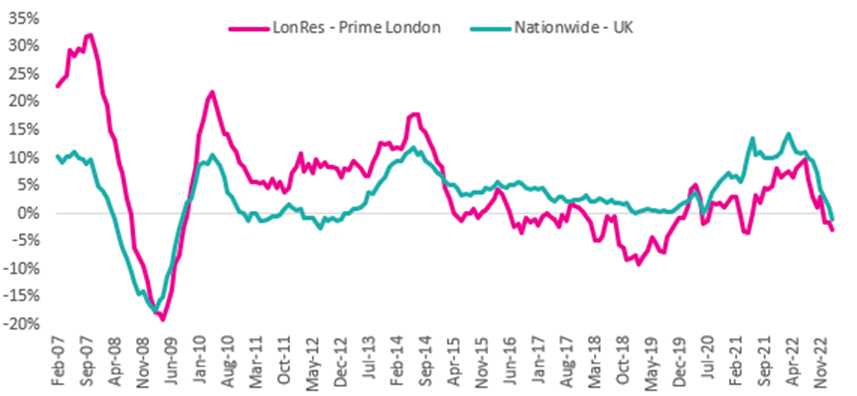
Chart 1 – Annual Change in House Prices
Source: LonRes, Nationwide
LonRes data shows that the national housing market has clearly weakened following the mini-budget chaos and the Prime London market is no exception. With higher interest rates and lower levels of activity, it is no surprise that prices have eased. The headline measure of achieved prices in prime London is only down 2.8% over the last year (table 1). However, it is the discount to asking price that really highlights how pricing reality has changed relative to expectations over the last few months.
As chart 2 shows, the average discount to asking prices in Prime London had increased in the years prior to the pandemic. As the market weakened and prices fell, it eventually hit its biggest discount since the financial crisis in February 2019 at -12.8%. The market then rebounded following the pandemic and this led to a gradual narrowing in the discount with a low of -4.7% recorded in July last year (chart 2). Since then, the discount has widened again and in February stood at -8.4%. This suggests that sellers are having to be much more realistic about pricing if they want to transact in this market.
Chart 2 – Prime London Average Discount to Asking Price
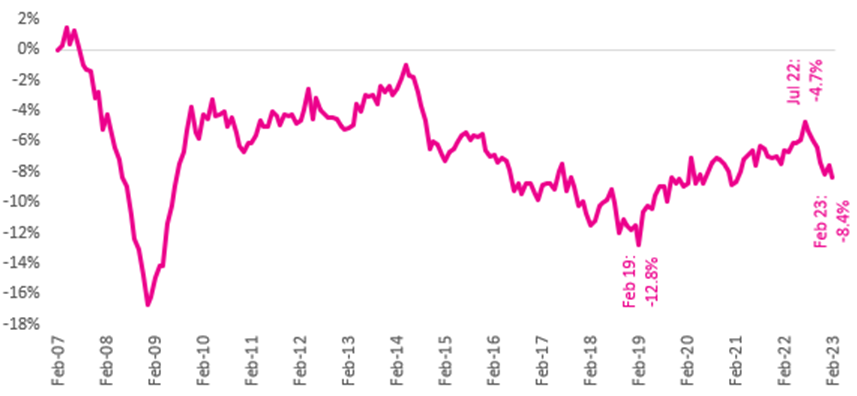
Source: LonRes
The need for realistic pricing is further highlighted by the average discount to asking price depending on how long it took for the property to sell. Chart 3 shows that, on average, the longer it takes to sell the bigger the discount to asking price is required.
In September last year, the average discount to asking price for homes selling in under three months was just -1.7% while the discount for homes taking between six and twelve months was -7.3% (chart 3). The analysis suggests that getting the pricing right at the start of the process is key to a quicker sale while a property that struggles to sell may end up having to accept a significant discount further down the line.
Getting the pricing right in the current market is even more important. The latest data for February shows the average discount to asking price has increased irrespective of the time it takes to sell – highlighting that the overall trend in chart 2 is driven by an increase in the discount rather than an increase in the time to sell. The current discount for homes selling in under three months is now -3.5% while the discount for those selling in six to twelve months is now -9.6% (chart 3).
Chart 3 – Prime London Discount to Asking Price by Time to Sell
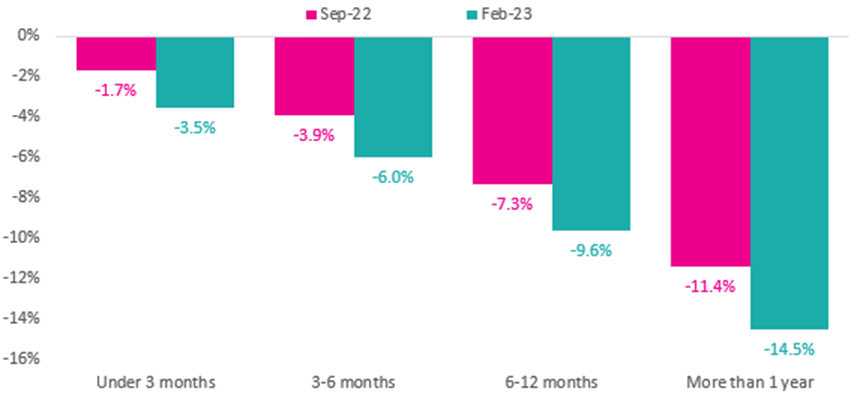
Source: LonRes
Rental market continues to suffer from a severe stock shortage…
The severe shortage of homes available to rent in prime London continues. Activity levels are well below normal levels and rents continue to rise. There are still no signs of any easing in the pressures on this market.
The lack of homes available to rent in Prime London is severe. In February, the number of new instructions was 49% below their pre-pandemic average while the number of under offers was 51% and the number of new lets was 59% lower (chart 4). This post-pandemic squeeze on activity shows no signs of abating and may be exacerbated by the current issues in the sales market as people are both forced or decide to hold off buying given the uncertainty in the housing and mortgage markets.
With stock in short supply, it is no surprise that average rents continue to rise. The latest data for February shows that they rose 8.4% over the last year and are now 19% above their pre-pandemic levels (table 1). That’s similar to last month’s figure of 8.2%. In most markets across the UK, affordability pressures should put an upper limit on rents. However, given the more international profile of the rental market in central London, it is less clear what mechanism could reverse this situation in the short term beyond an unexpected collapse in demand.
Chart 4 – Measures of Rental Activity in Prime London, Compared to Same Month in 2017/19
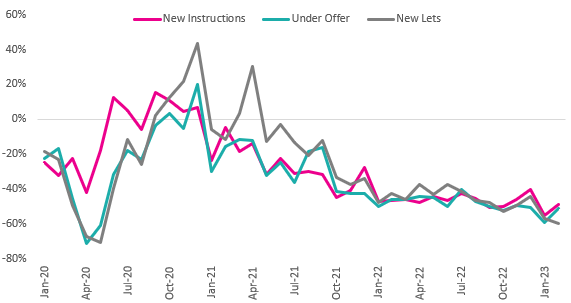
Source: LonRes
Anthony Payne, MD, LonRes, said: “We’re continuing to see a rise in new instructions coming to the market. In February they were 14% up on the same month last year and 23.6% higher than before the pandemic. This means there is more choice for buyers. And while there appears to be no let up in buyers looking to purchase, there also seems to be no urgency in them committing to a sale. For serious sellers out there, asking prices need to reflect the mood-change in the market.
“Meanwhile the prime London lettings market continues to suffer from lack of stock but no lack of tenants. Tax changes aimed at buy-to-let investors have undoubtedly impacted the sector. Build to rent schemes while part of the rental solution, take time to come on stream and until stock levels rise or demand level falls, it’s difficult to see how the situation across prime London is going to change.”

Comments are closed.