 Vendors, buyers and tenants all rose in the past week, with buyers rebounding on a slight fall the previous week. Following a previous surge, landlord enquiries were the only downturn, slipping 5%. Not put off by limited stock, buyers pushed hard rising 6%, and tenants also rose a full 11%, the latest data from the Yomdel Property Sentiment Tracker (YPST) showed.
In the week to midnight Sunday, activity across own-branded estate agent websites remained incredibly strong, and new enquiry levels across the board have hit a full three months at this ‘new normal level’, with web traffic still a huge 108% above the same week last year, and 40% up on 2019, the last “normal” pre-Covid year.
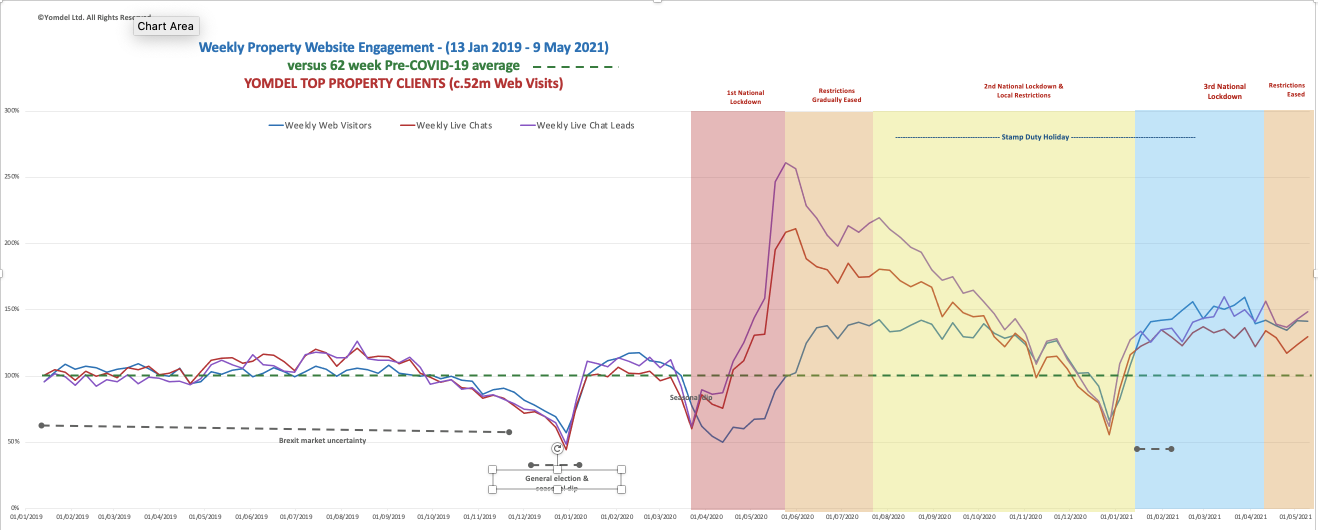
Yomdel provides 24/7 managed live chat services to 3,800 estate agent offices in the UK, handling more than a 2m chats per year. It has analysed the data and leads captured in live chat going back to January 2019, up until week ending 9 May 2021. The website visitor data is a sample across major estate agency groups in the UK and covers in excess of 52 million unique website visits back to January 2019.

“Competition for new properties coming to market is ferocious, and many agents are telling us they are seeing record timescales to offer and sale, with barely a chance to market properties before they are gone. All of which creates frustrated buyers, who are refusing to give up in their pursuit of a move,” said Andy Soloman, Yomdel Founder & CEO.
“Through all of this we are seeing agents’ own websites firmly established as the critical destination point for their potential clients to select and engage with them. Agents must prioritise their own sites for investment and be able to offer the very best experience if they are to remain on top,” he added.
The YPST methodology establishes a base line average shown as 100% or 100, calculated according to average engagement values over the 62 weeks prior to the first national lockdown on 23 March 2020, and plots movements from there according to the volumes of people engaging in live chat, their stated needs, questions asked, and new business leads generated. Data is measured over full 24-hour periods.
New vendors rose another 3.40%, or 4.68 points, to end the week on 142.19, some 42% above the average, 71% higher than the same week last year at the beginning of the initial lockdown, and 35% above the equivalent week 2019.
Buyers rebounded 5.53%, or 8.78 points, to close at 167.57, 68% above the pre-covid-19 average, 31% above the same week 2020 and 60% higher than the equivalent week 2019 before coronavirus hit.
Landlords fell 4.67%, or 5.41 points, to 110.45, some 10% above the average, 19% higher than the same week last year, and 2% higher than the same week 2019.
Tenants grew 11.39%, or 13.25 points, to close at 129.54 some 30% above the pre-covid-19 average, 34% lower than the same week last year, and 17% higher than the equivalent week 2019.
The following graph looks at the relationship between website visitor volumes, live chat volumes and the volume of leads generated. The data samples more than 52 million visitors to estate agent websites from Jan 2019 – 9 May 2021 and shows how web traffic (blue line) is 109% higher than the same week last year. The volume of people using live chat (red line) and the numbers of new business leads captured (purple line) are 1% and 6%, respectively, below the same week 2020 but 15% and 32%, respectively, above the same week 2019.