

 Welcome to the residential property industry’s weekly reality check on what is actually happening across the UK housing market.
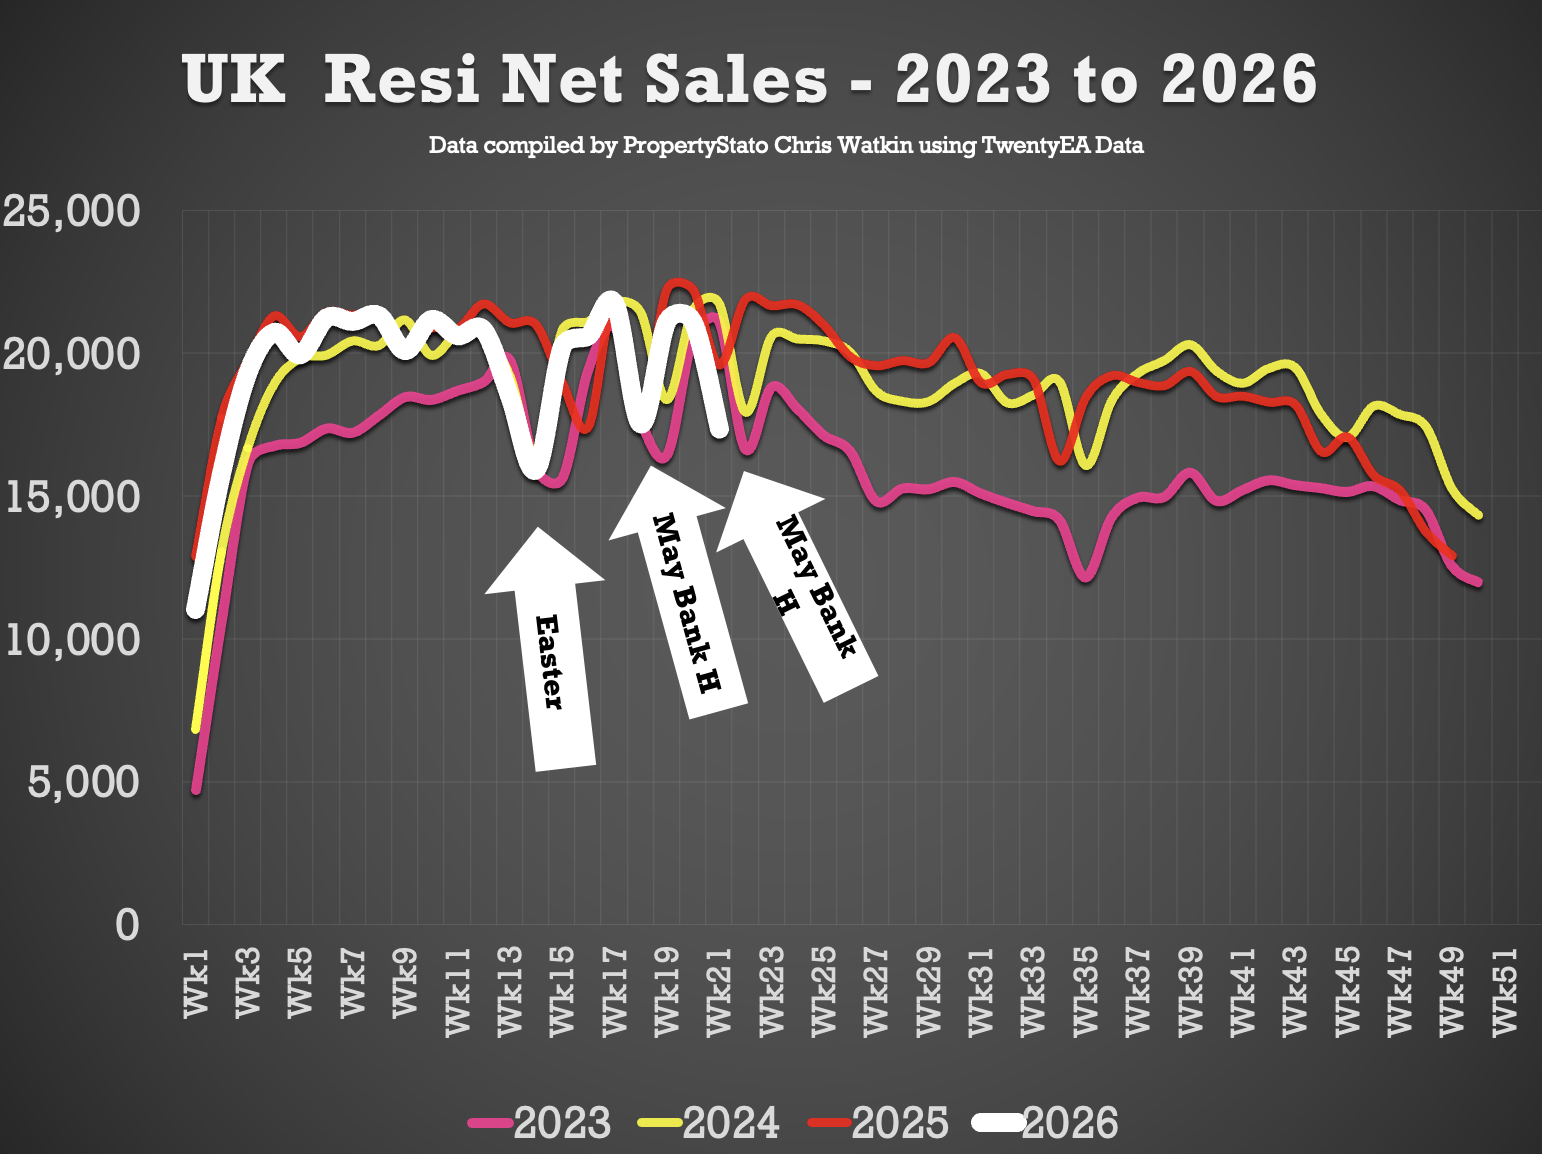
This week’s figures cover Week 21, ending 31 May 2026. As always, the focus is on market activity rather than sentiment, providing a snapshot of buyer demand, sales agreed, listings and other key indicators shaping the market.
It is worth noting that this was the late May Bank Holiday week, meaning activity levels across most metrics were around 20% lower than normal due to the shorter working week. As a result, comparisons should be viewed in that context.
Despite the seasonal dip, the market remained broadly steady, with no significant shifts in underlying trends.
There is no accompanying Stats Show this week due to external commitments, but normal service will resume next week.
🟥 Listings
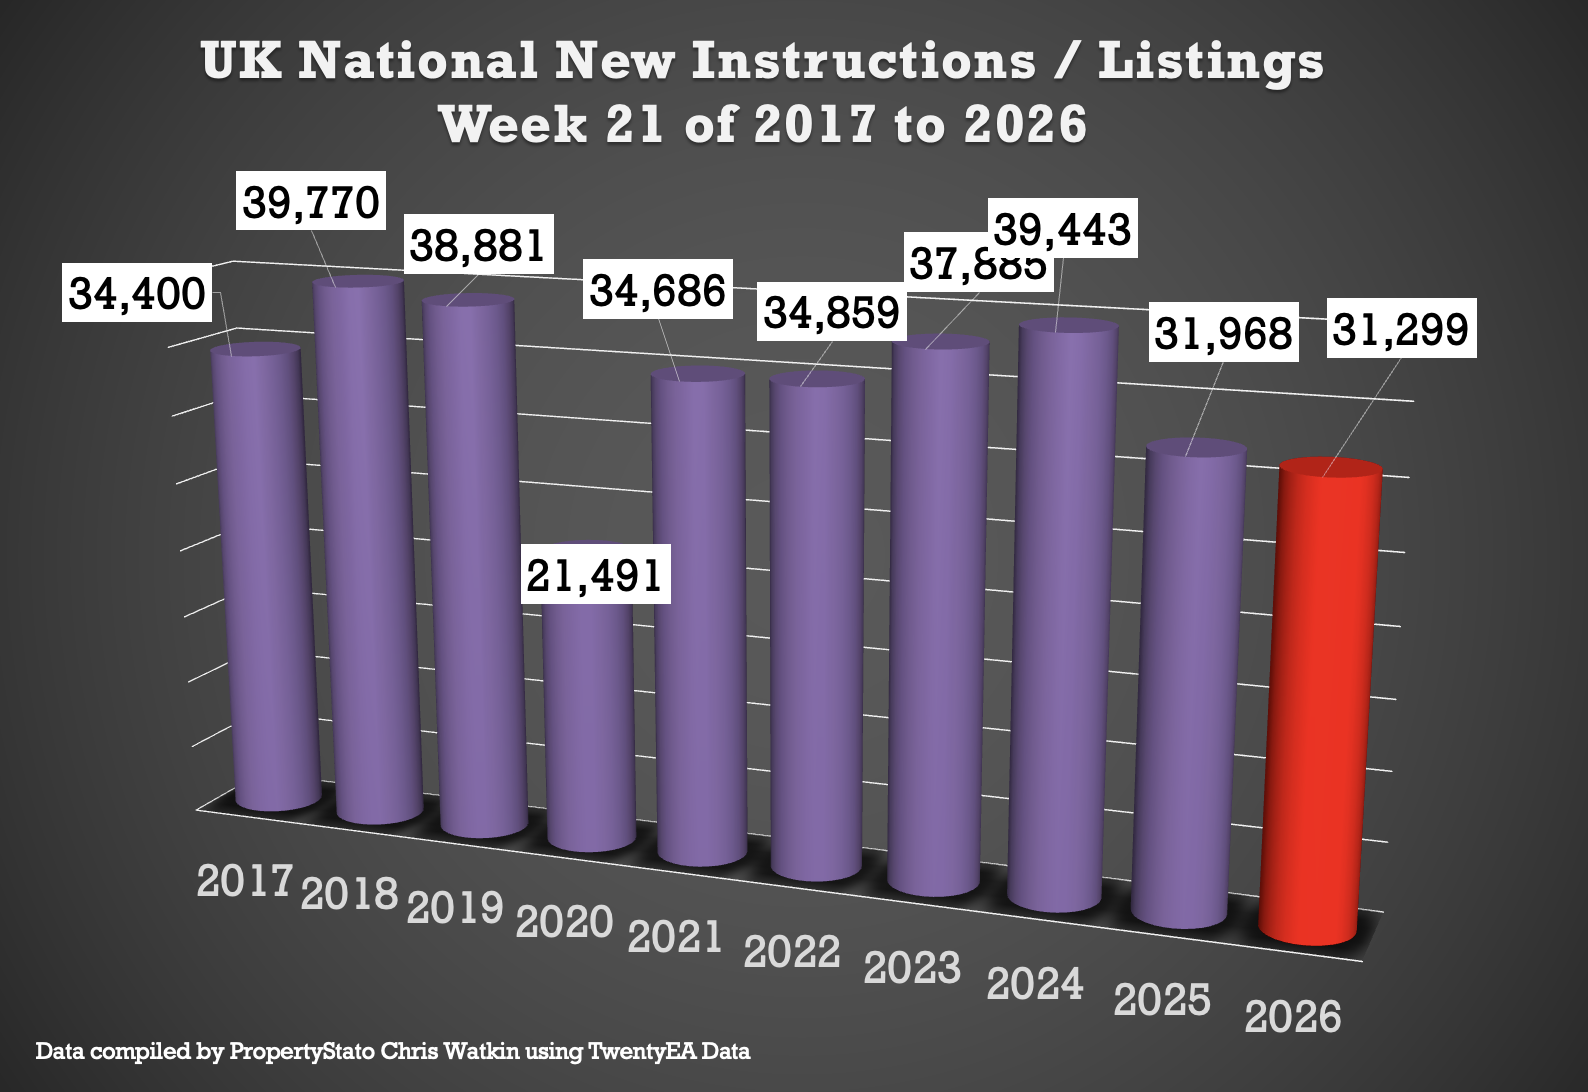
Week 21 ..
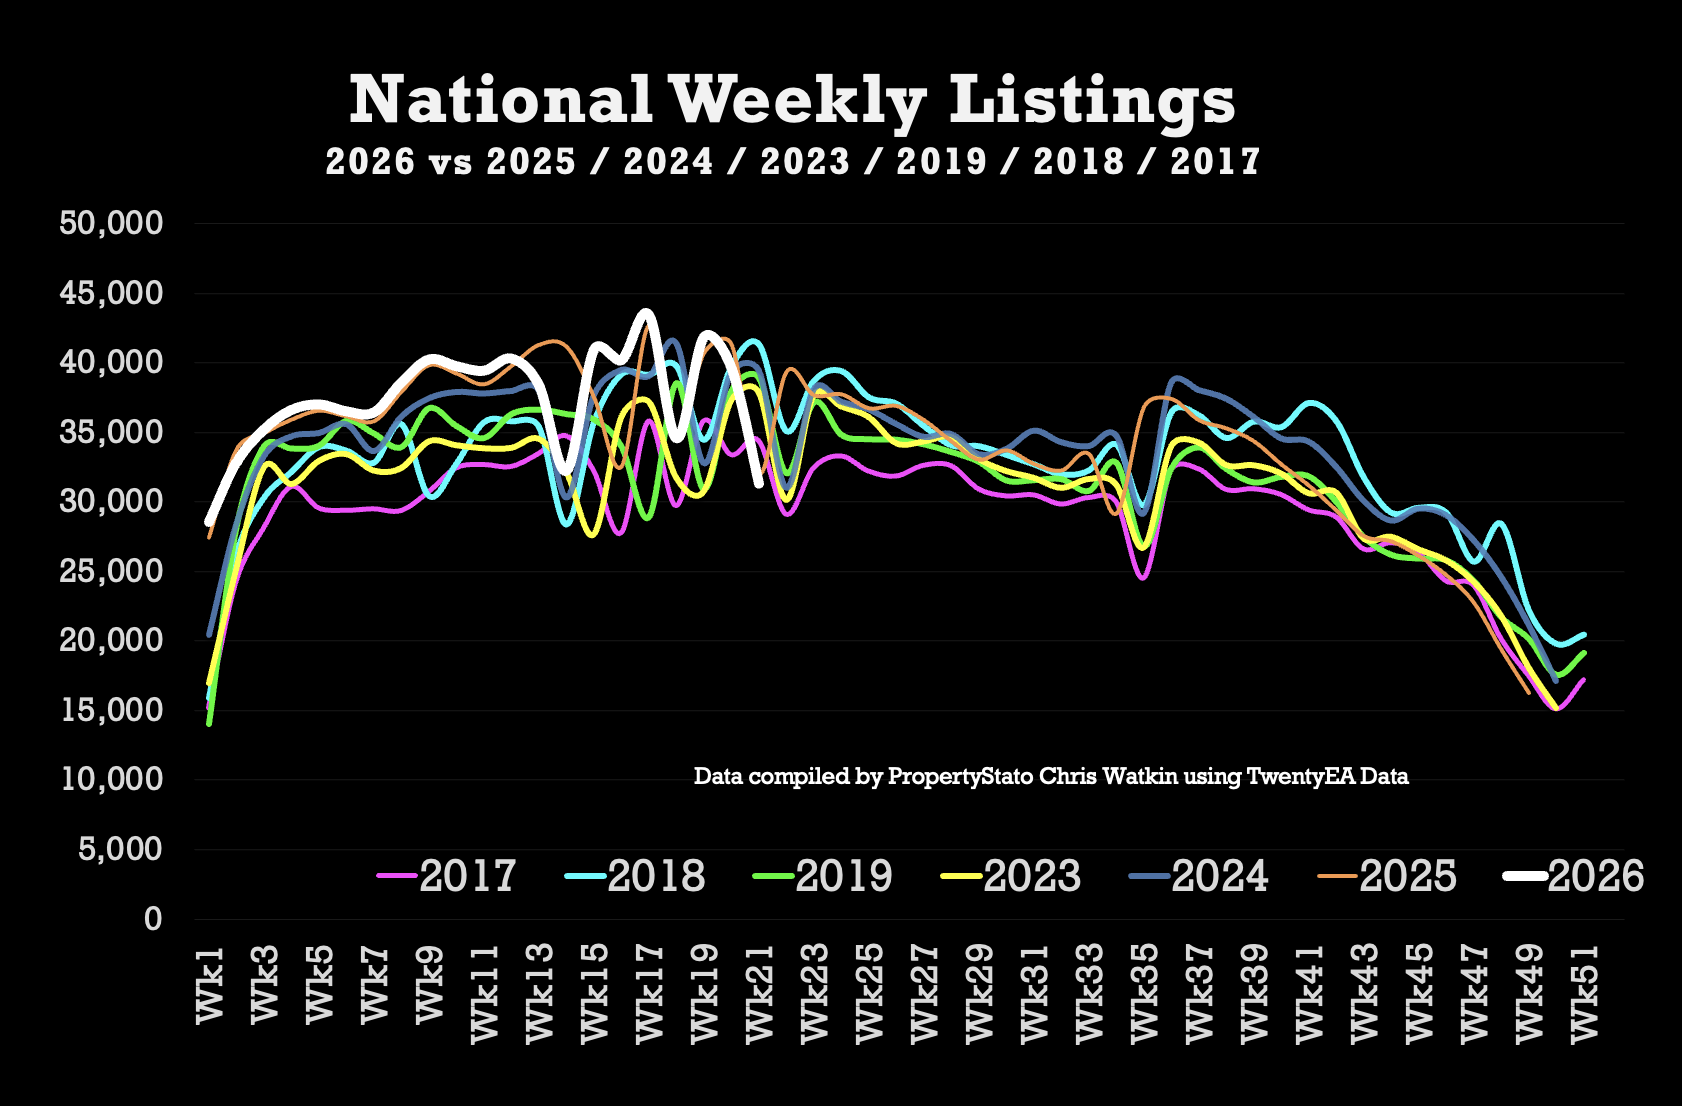
31.3k new listings this week, (39.6k last week).
Weekly 2026 average : 37.6k.
10 year week 21 average : 34.5k
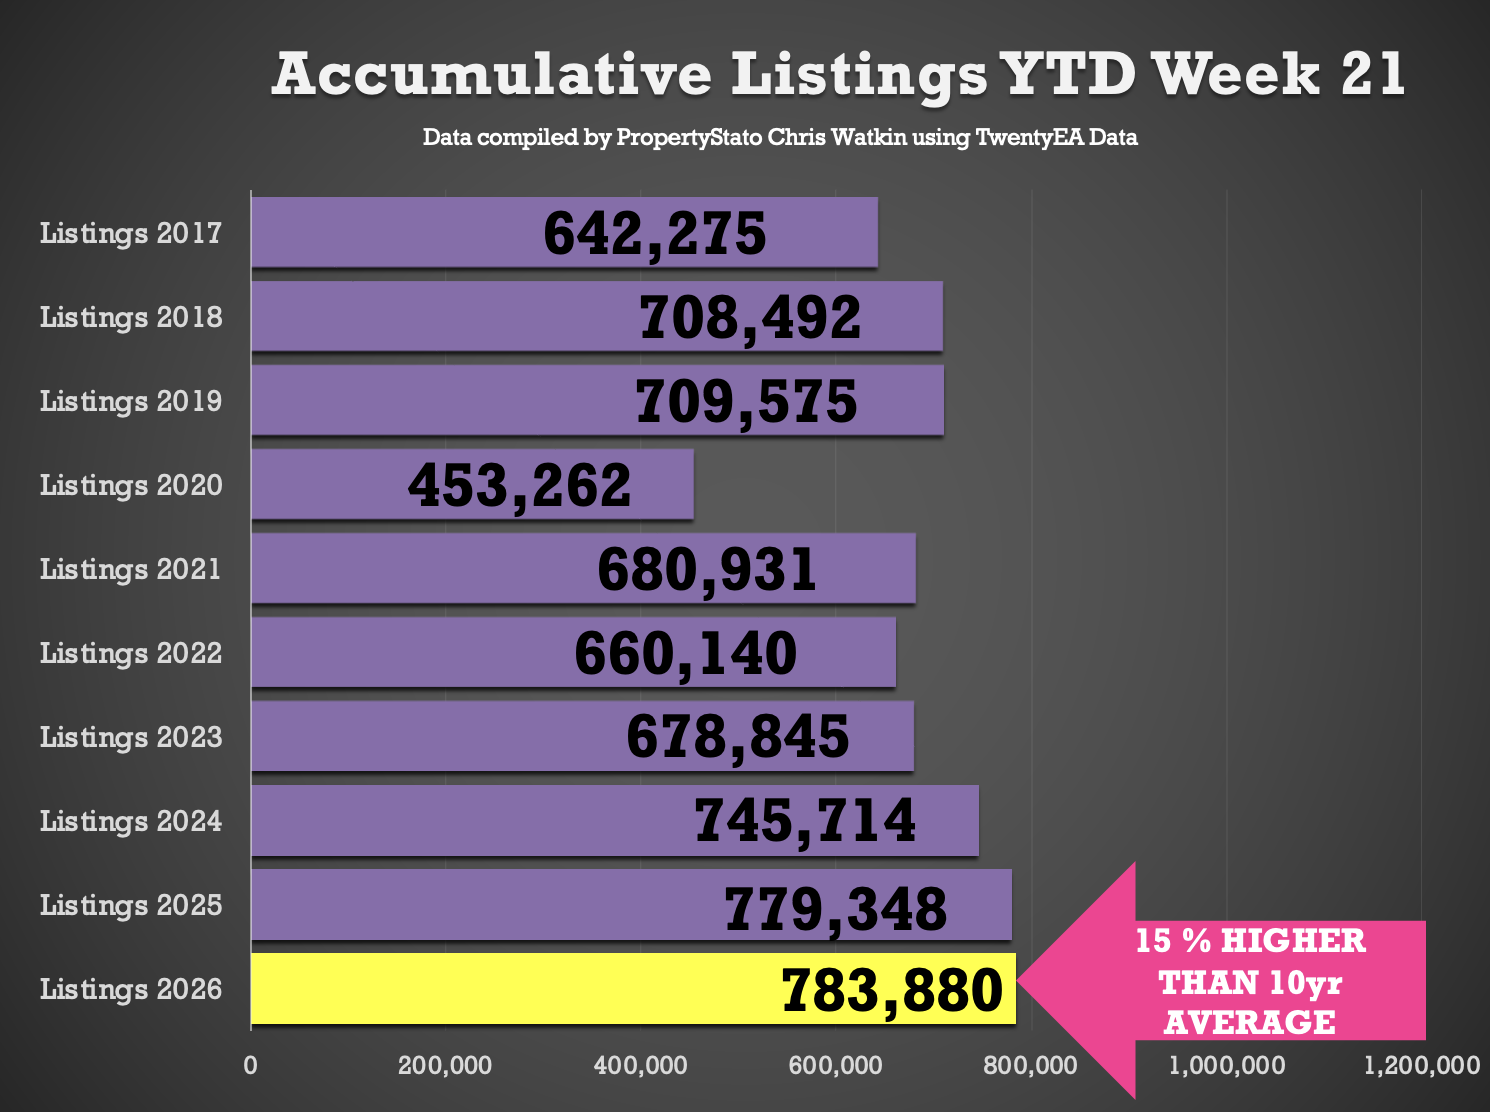
Year to Date
783k new listings YTD
0.6% ahead of 2025 YTD (779k)
5.1% ahead of 2024 YTD (746k)
14.1% higher than the 2017–19 average YTD (687k)
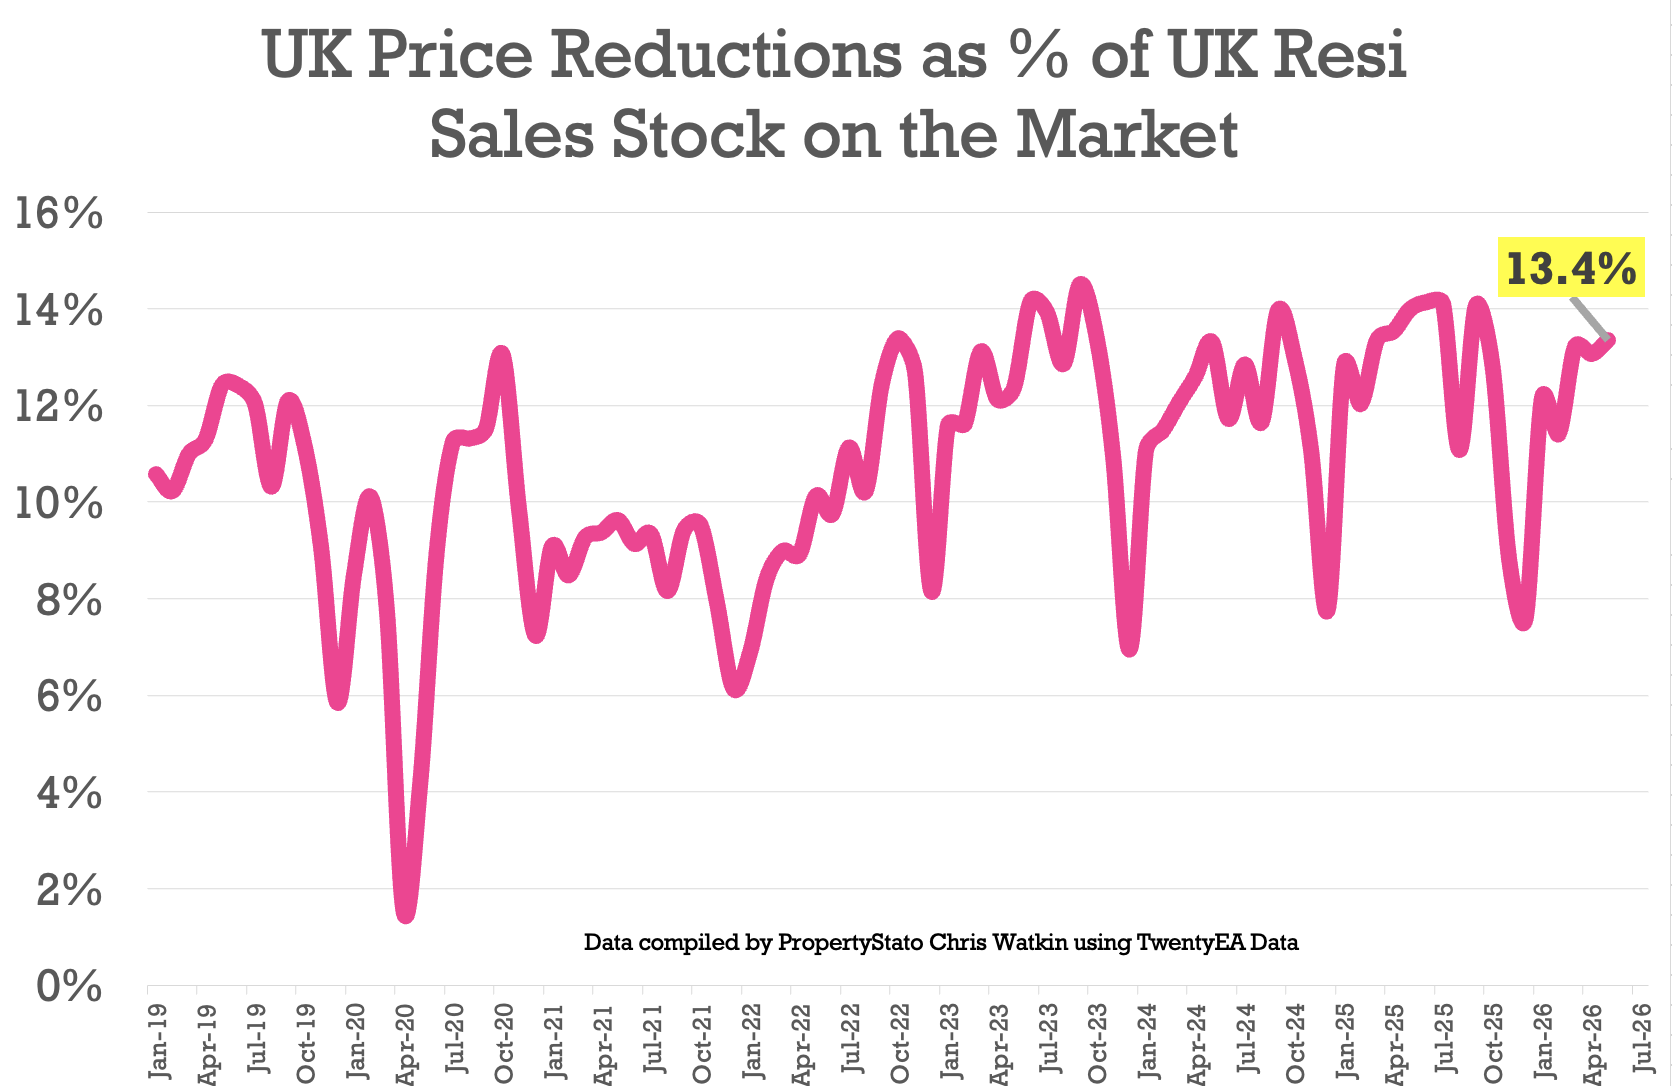
🟩 Price Reductions
• 21k reductions this week on a 747k UK homes for sale
• 13.4% of UK homes for sale were reduced in May.
• 2025 average 12.8%, versus the 6-year long-term average of 10.7%.
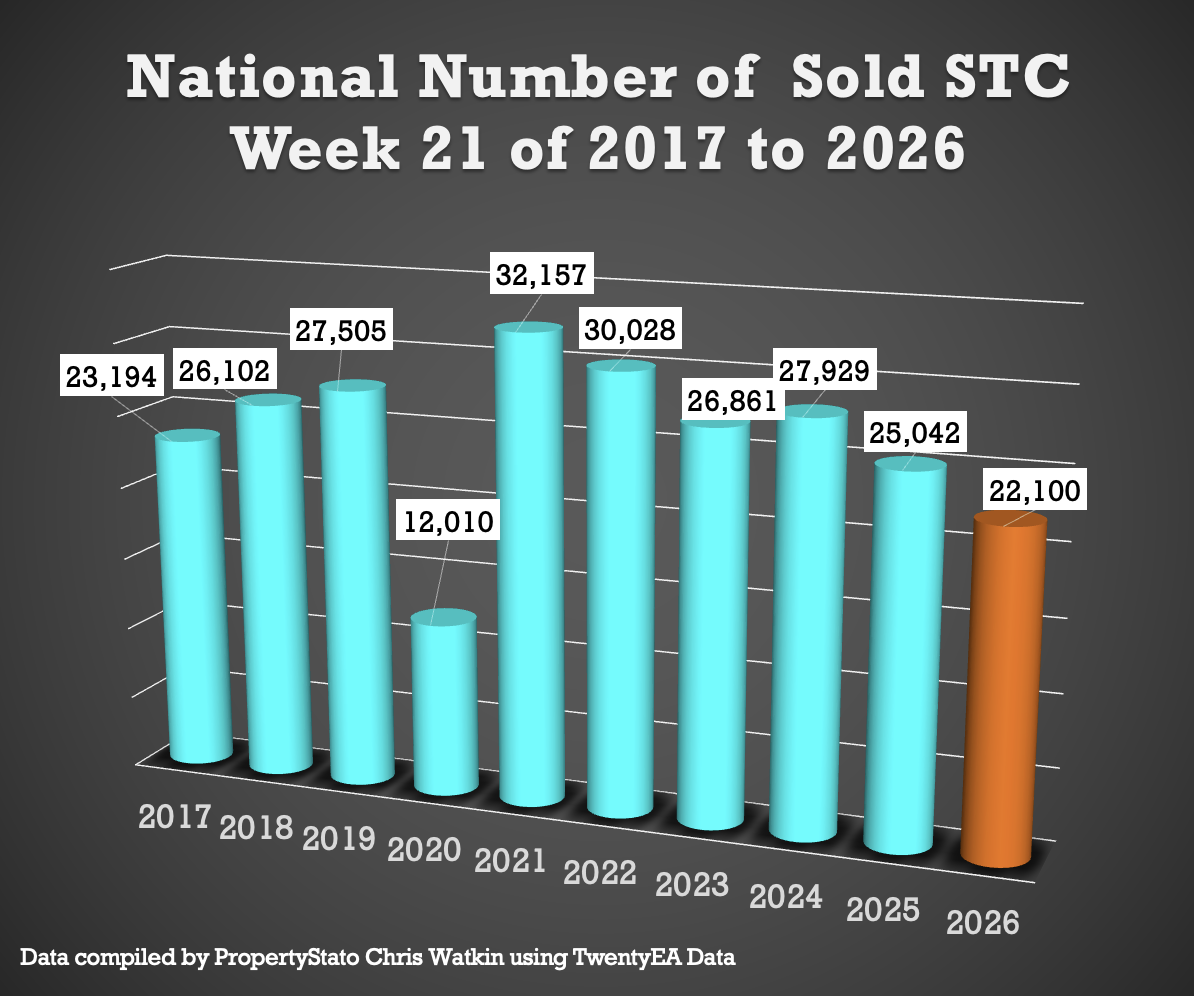
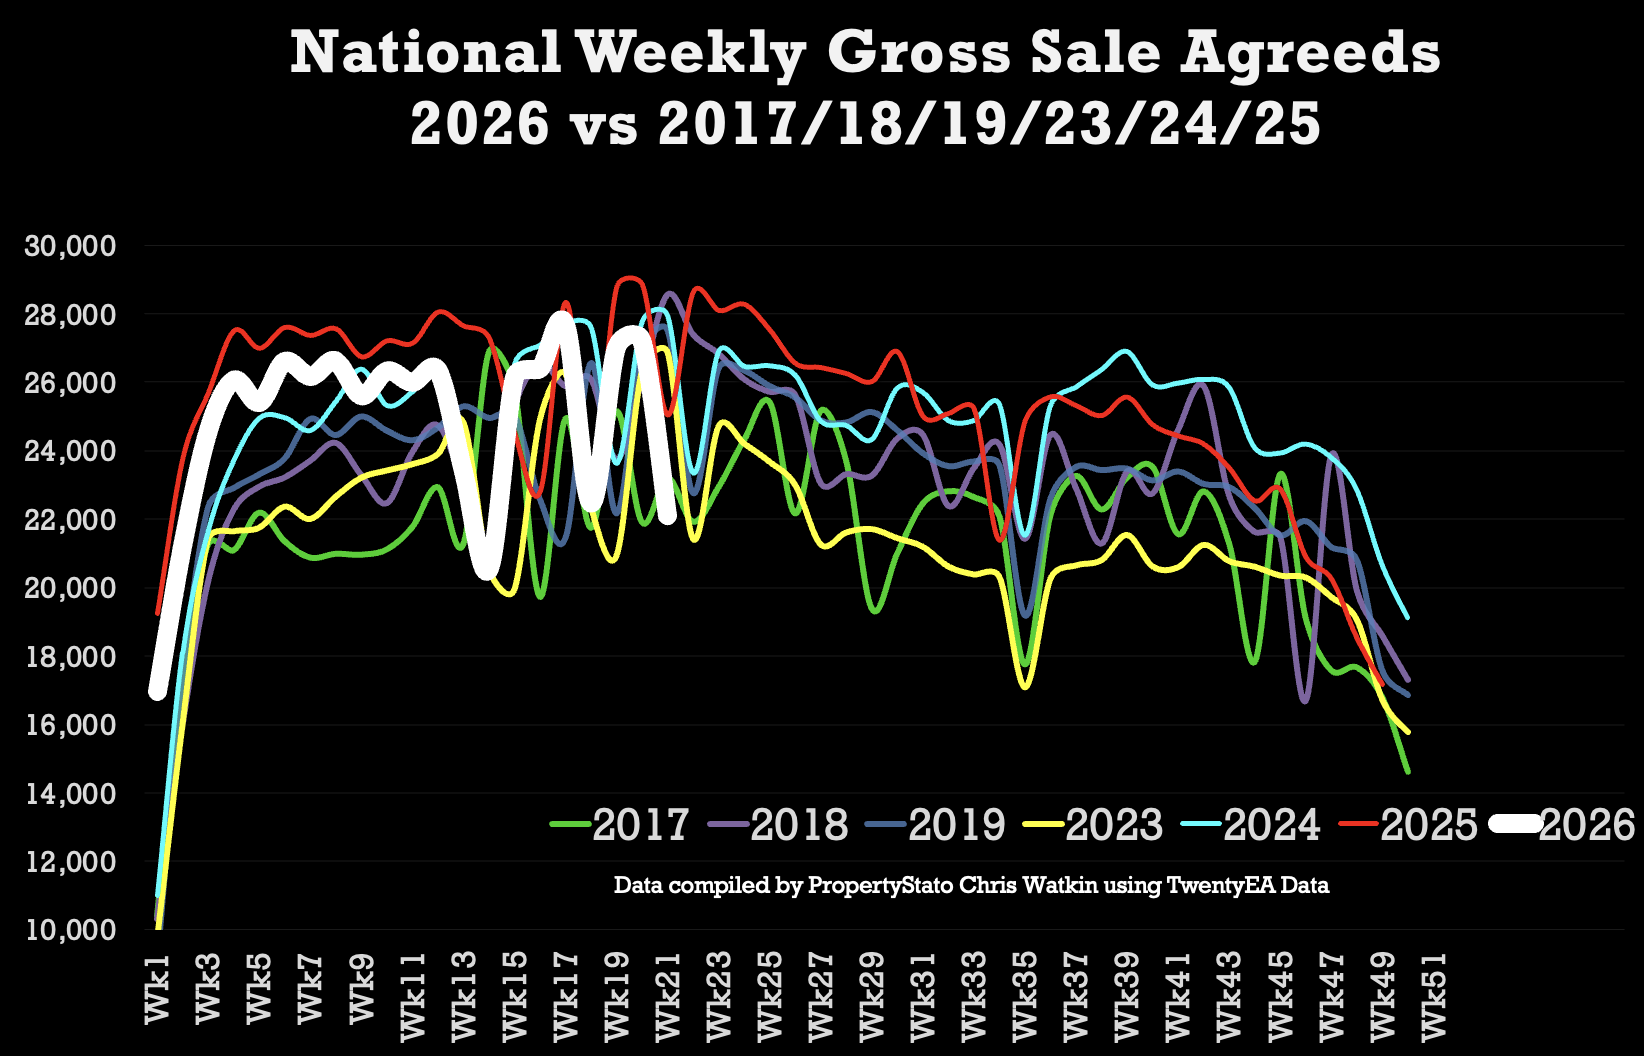
🟥 UK Gross Resi Sales
Week 21
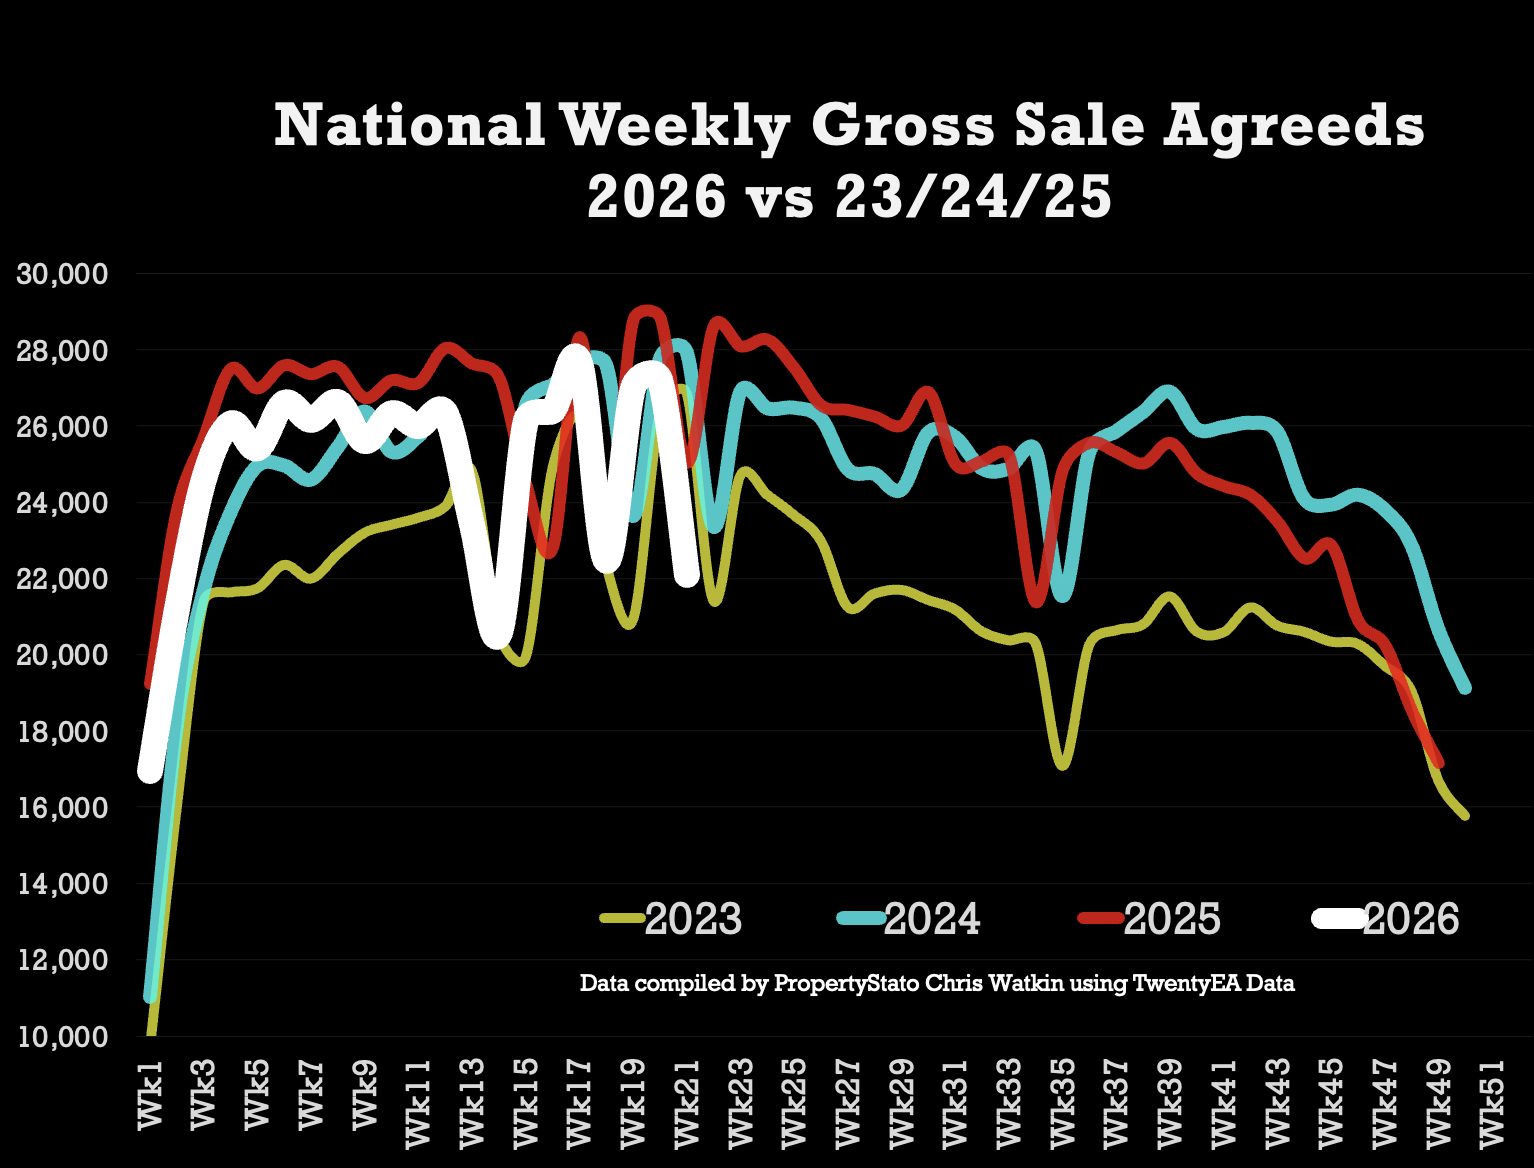
22.1k homes sold stc this week 21 (27.2k last week)
10 year week 21 average : 25.3k
2026 weekly average : 24.8k.
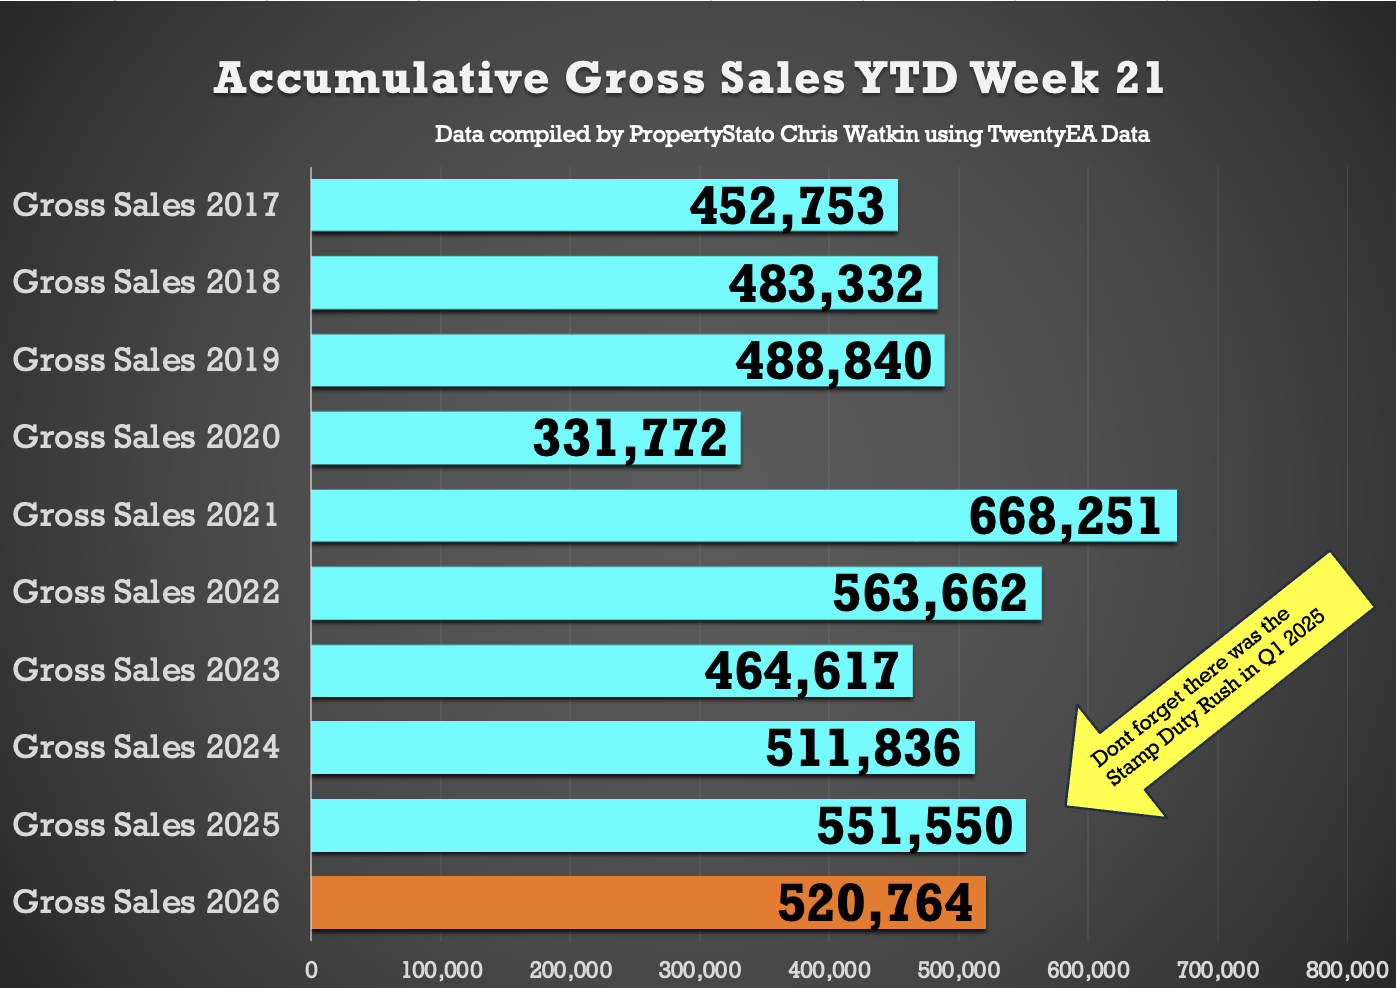
Year to Date
521k UK homes sold stc YTD
5.6% lower than 2025 YTD (552k)
1.7% higher than 2024 YTD (512k)
12.1% higher than 2023 YTD (464k)
9.6% higher above pre Covid 2017-19 years (475k).
🟩 Price Difference between Asking Price of Listings & Asking Price of those Homes that go Sold stc
• 21.5% difference (long term 10 year average is 16% to 17%). (£447k ave Listing Ave Asking price vs £368k Sale Agreed ave Asking price)
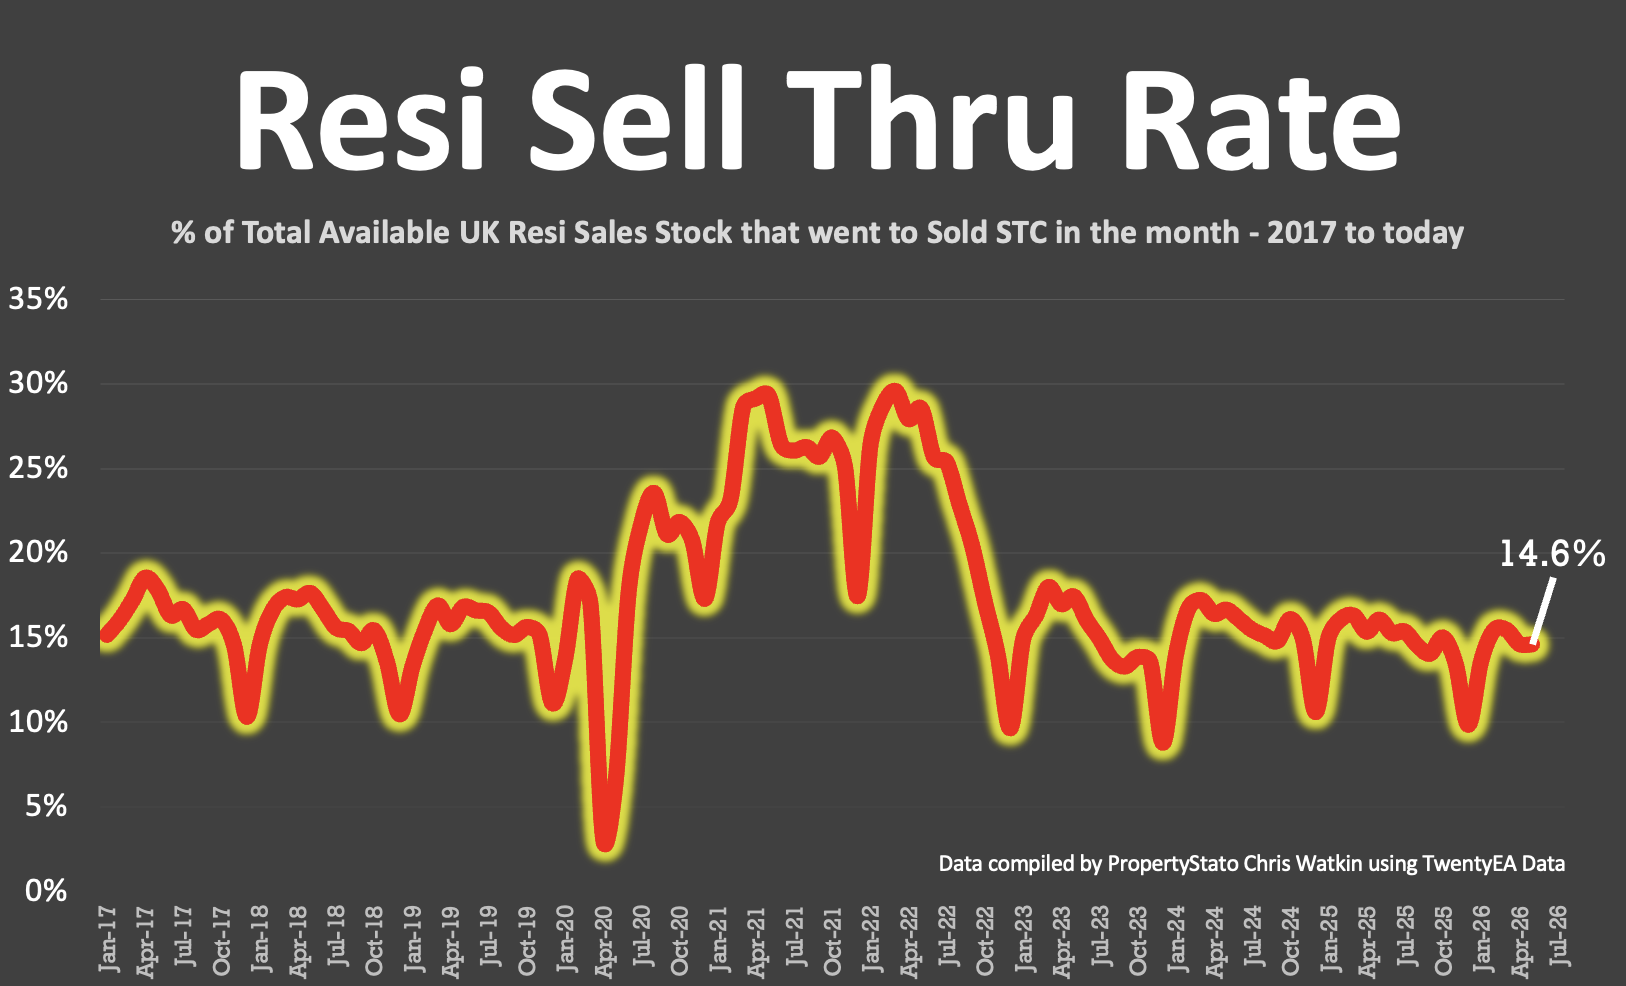
🟥 Sell-Through Rate
• 14.6% of homes on agents’ books went SSTC in May ’26.
• Pre-Covid average: 15.5%.
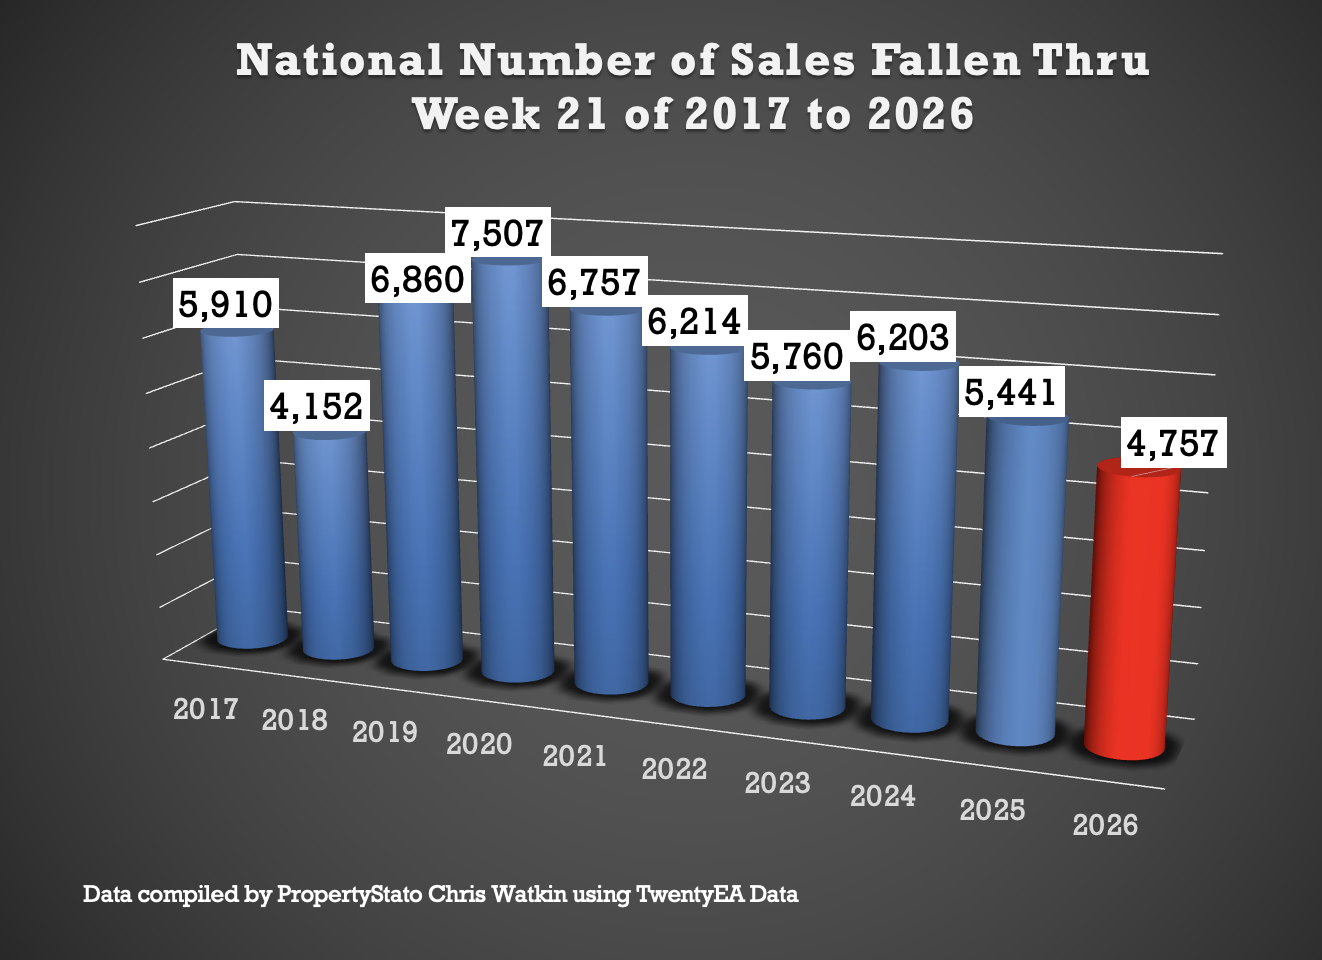
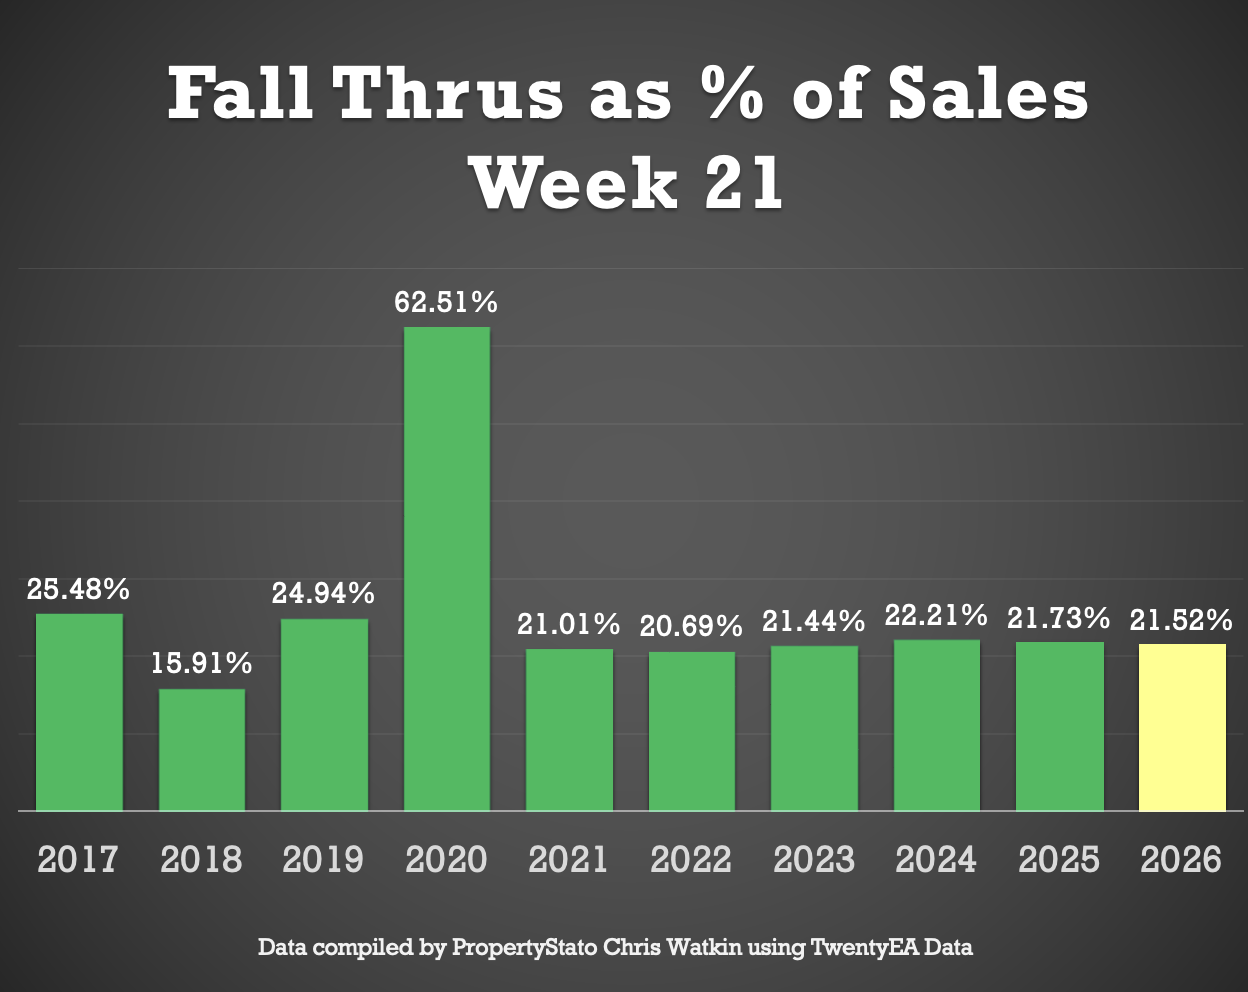
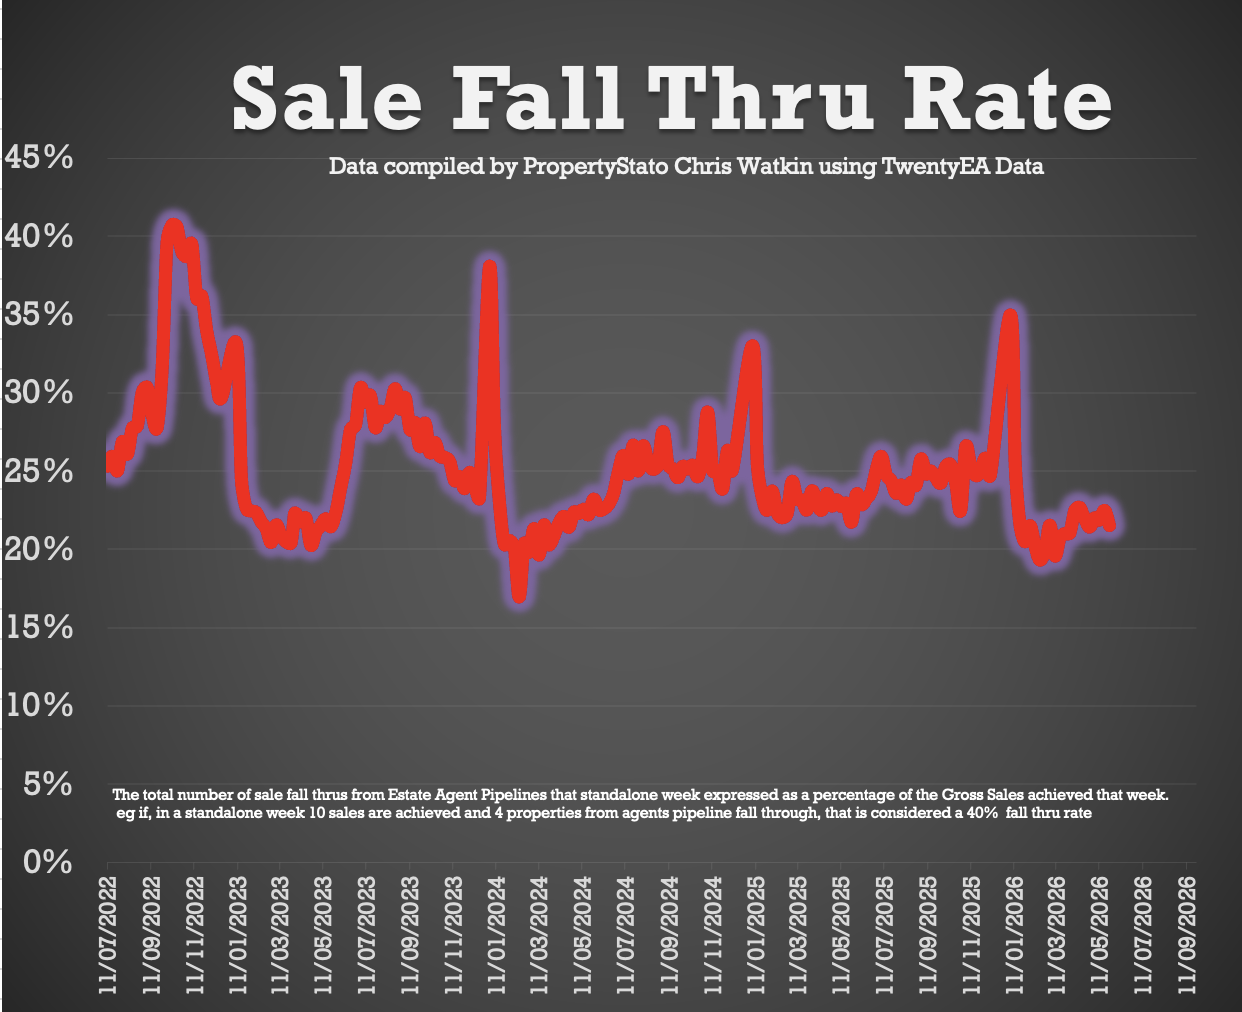
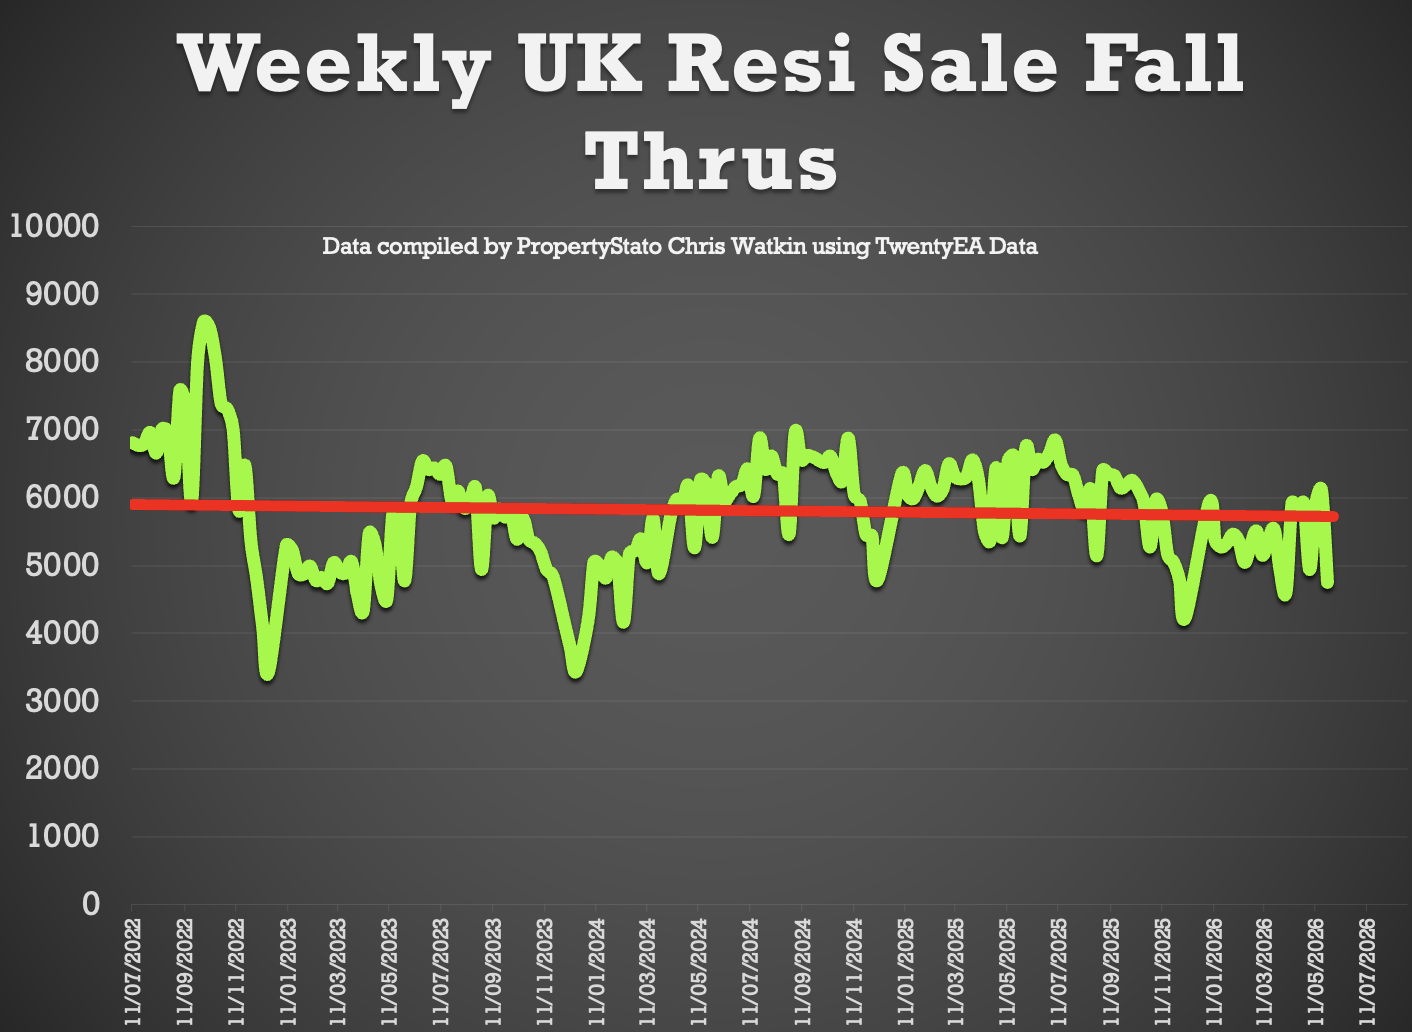
🟩 Sale Fall-Thrus
• Fall-thru rate 21.5%
• Decade average: 24.5%
• 5.1% of homes sold STC fell thru in April 2026, below both the 2025 average of 5.3% and the 10 year average of 5.8%. (May figures to follow next week)
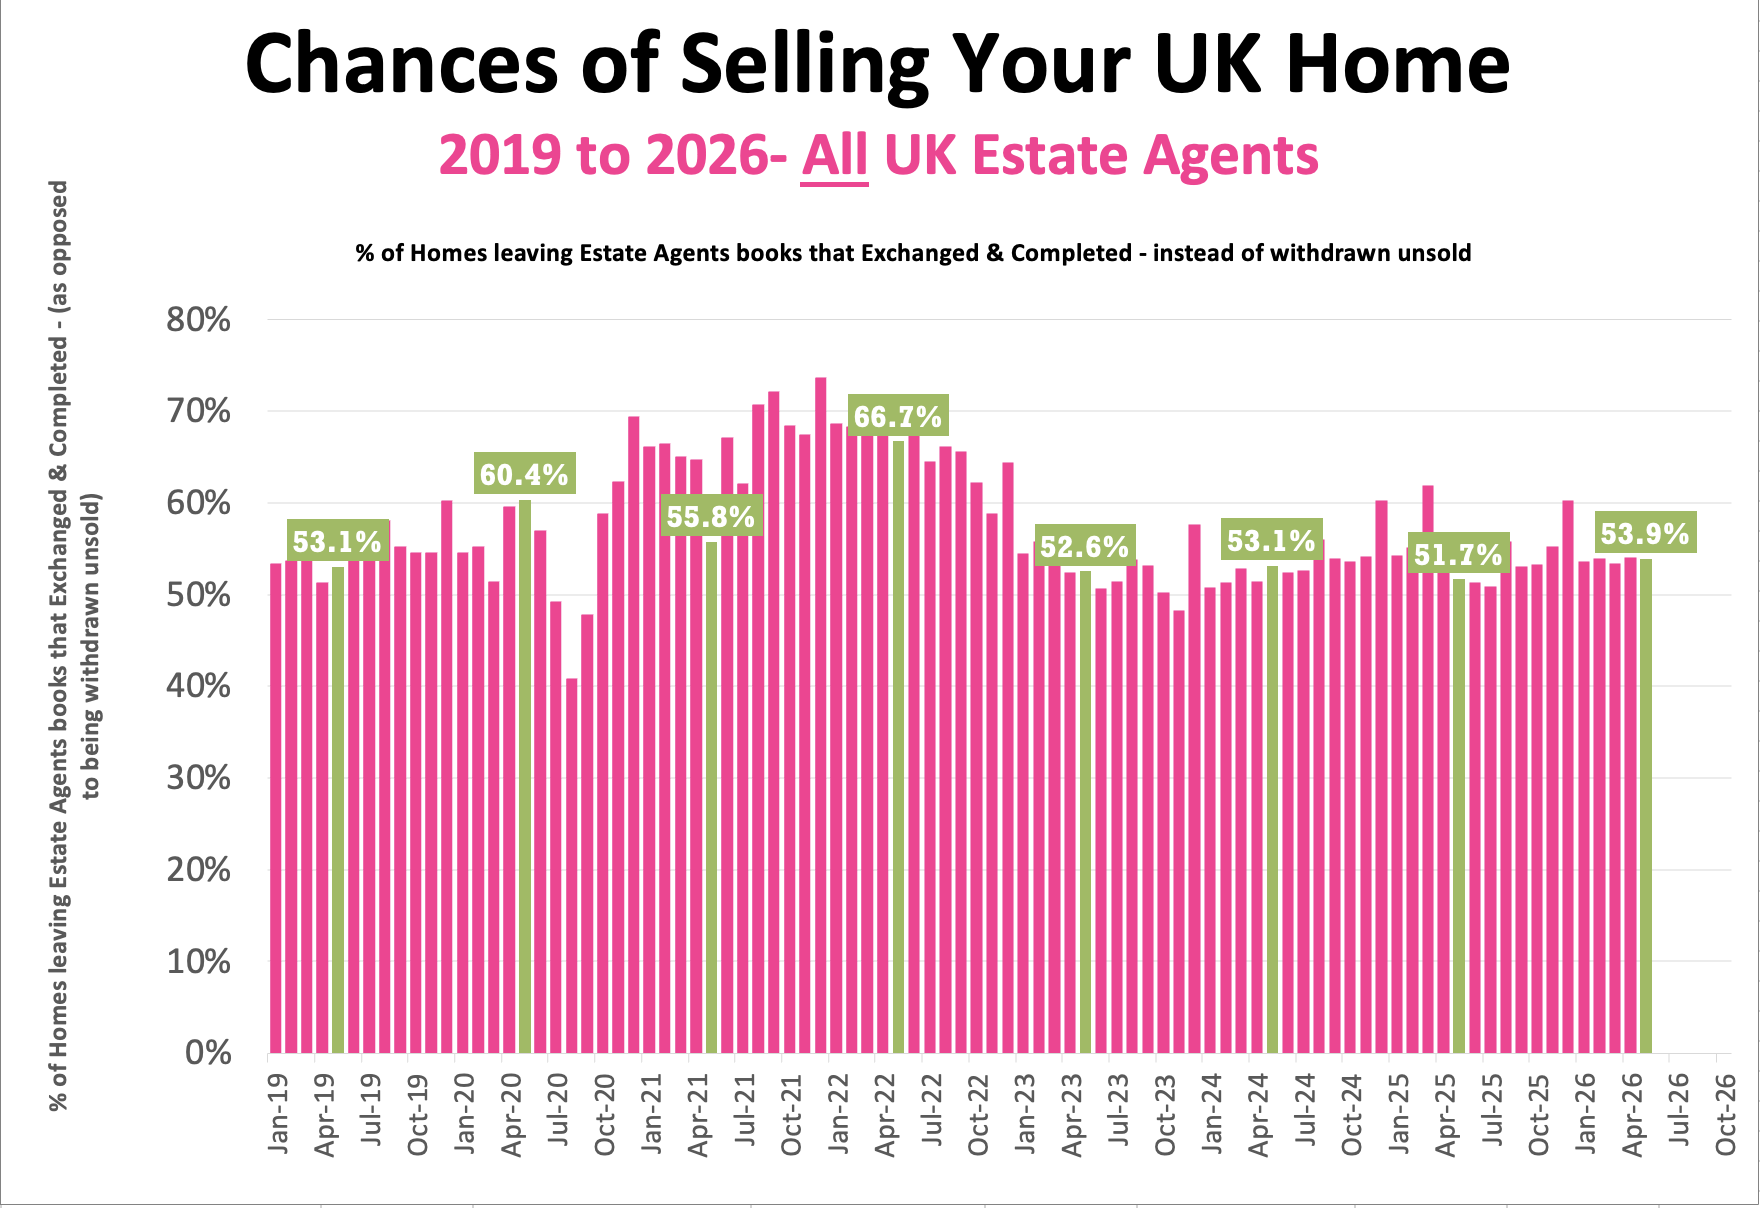
🟥 Probability of Selling (% that Exchange vs withdrawal)
• May 2026 Stats : 53.9% of homes that left agents’ books exchanged & completed in May. (Note this figure will change throughout the month as more May stats come in).
• 57.6% is the 7 year average (which includes the crazy years post lockdown 18 months).
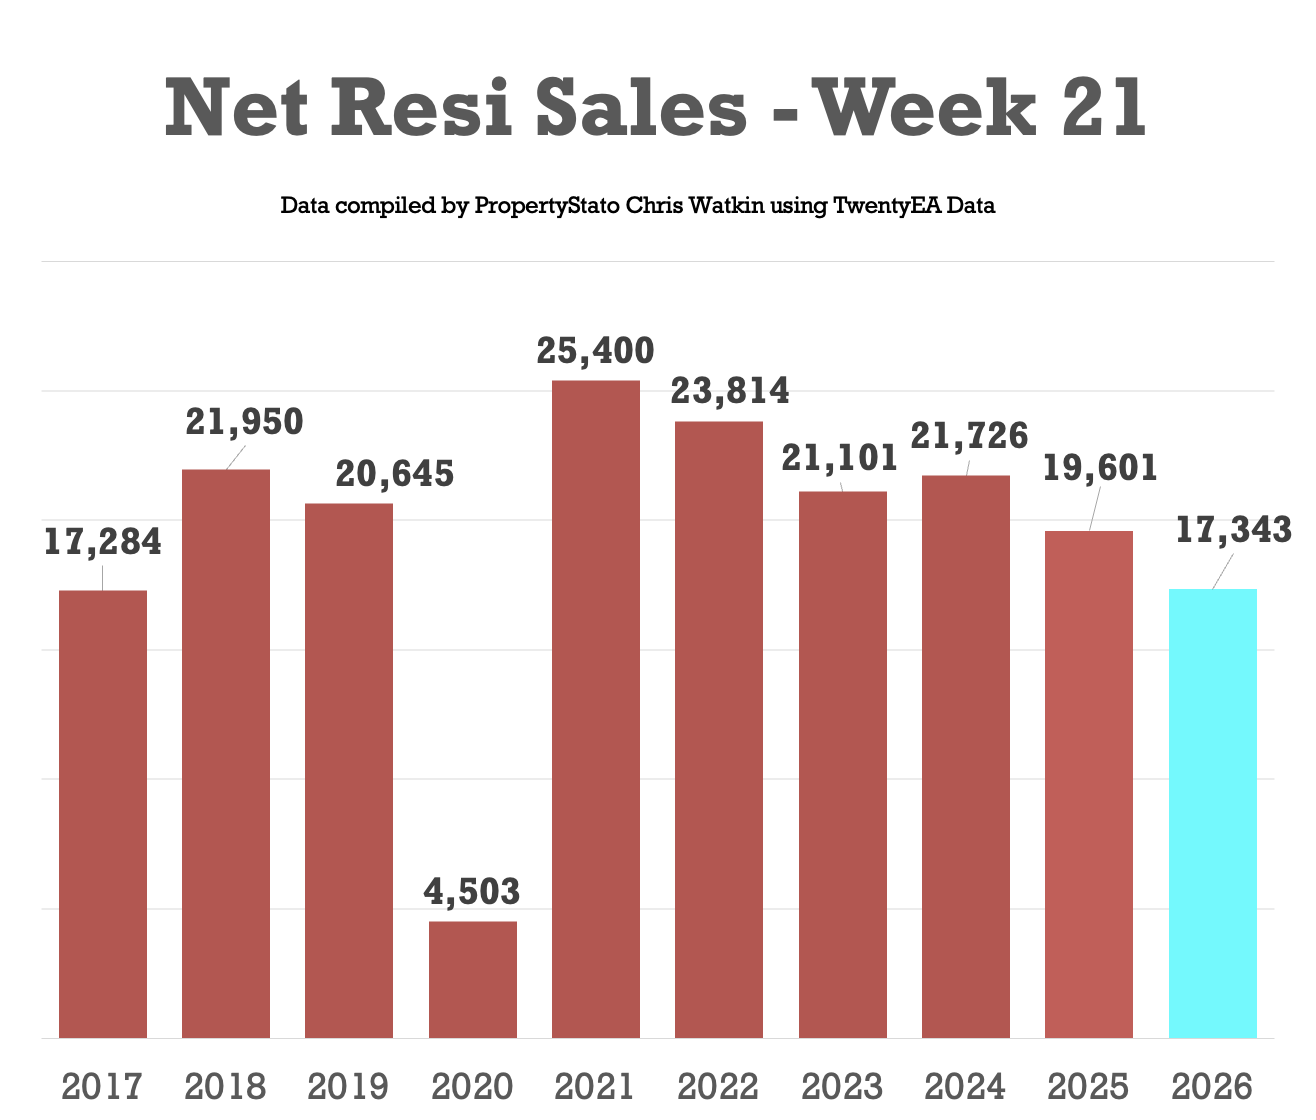
🟩 UK Net Resi Sales YTD
Week 21
17.3k Net Sales (21k last week)
10 year Week 21 average: 19.3k.
Weekly average for 2026: 19.5k.
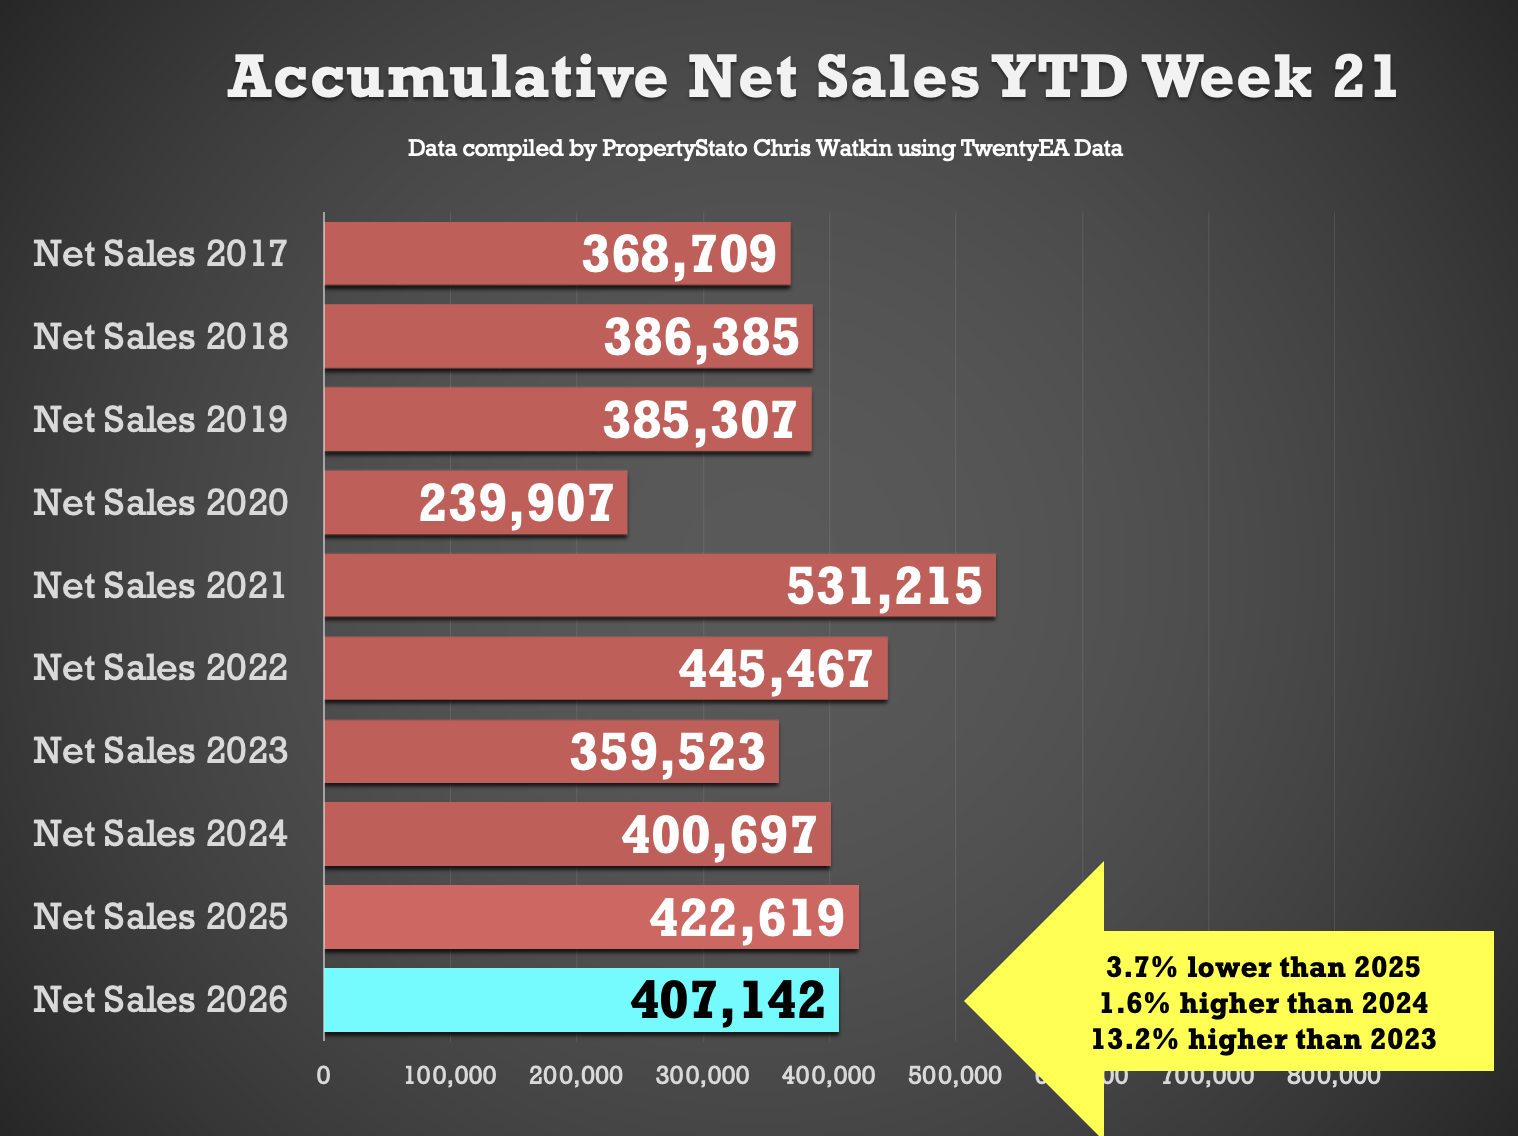
Year to Date
407k UK net home sales YTD
3.6% lower than 2025 (423k),
1.6% ahead of 2024 (401k),
13.2% ahead of 2023 (360k)
7.1% above the 2017–19 average (380k).
(Net Sales being Gross Sales less Sale Fall Thrus).
🟥 Exchanges
• May 2026 – 52.6k Exchanges – note this figure will increase as more May exchanges come thru the system throughout June
• 288k UK Exchanges YTD to end of April 2026. 8% lower than Jan to April 2025, when it was 314k.NB. There were more exchanges in Q1 2025 because of the stamp duty holiday which finished in April 2025
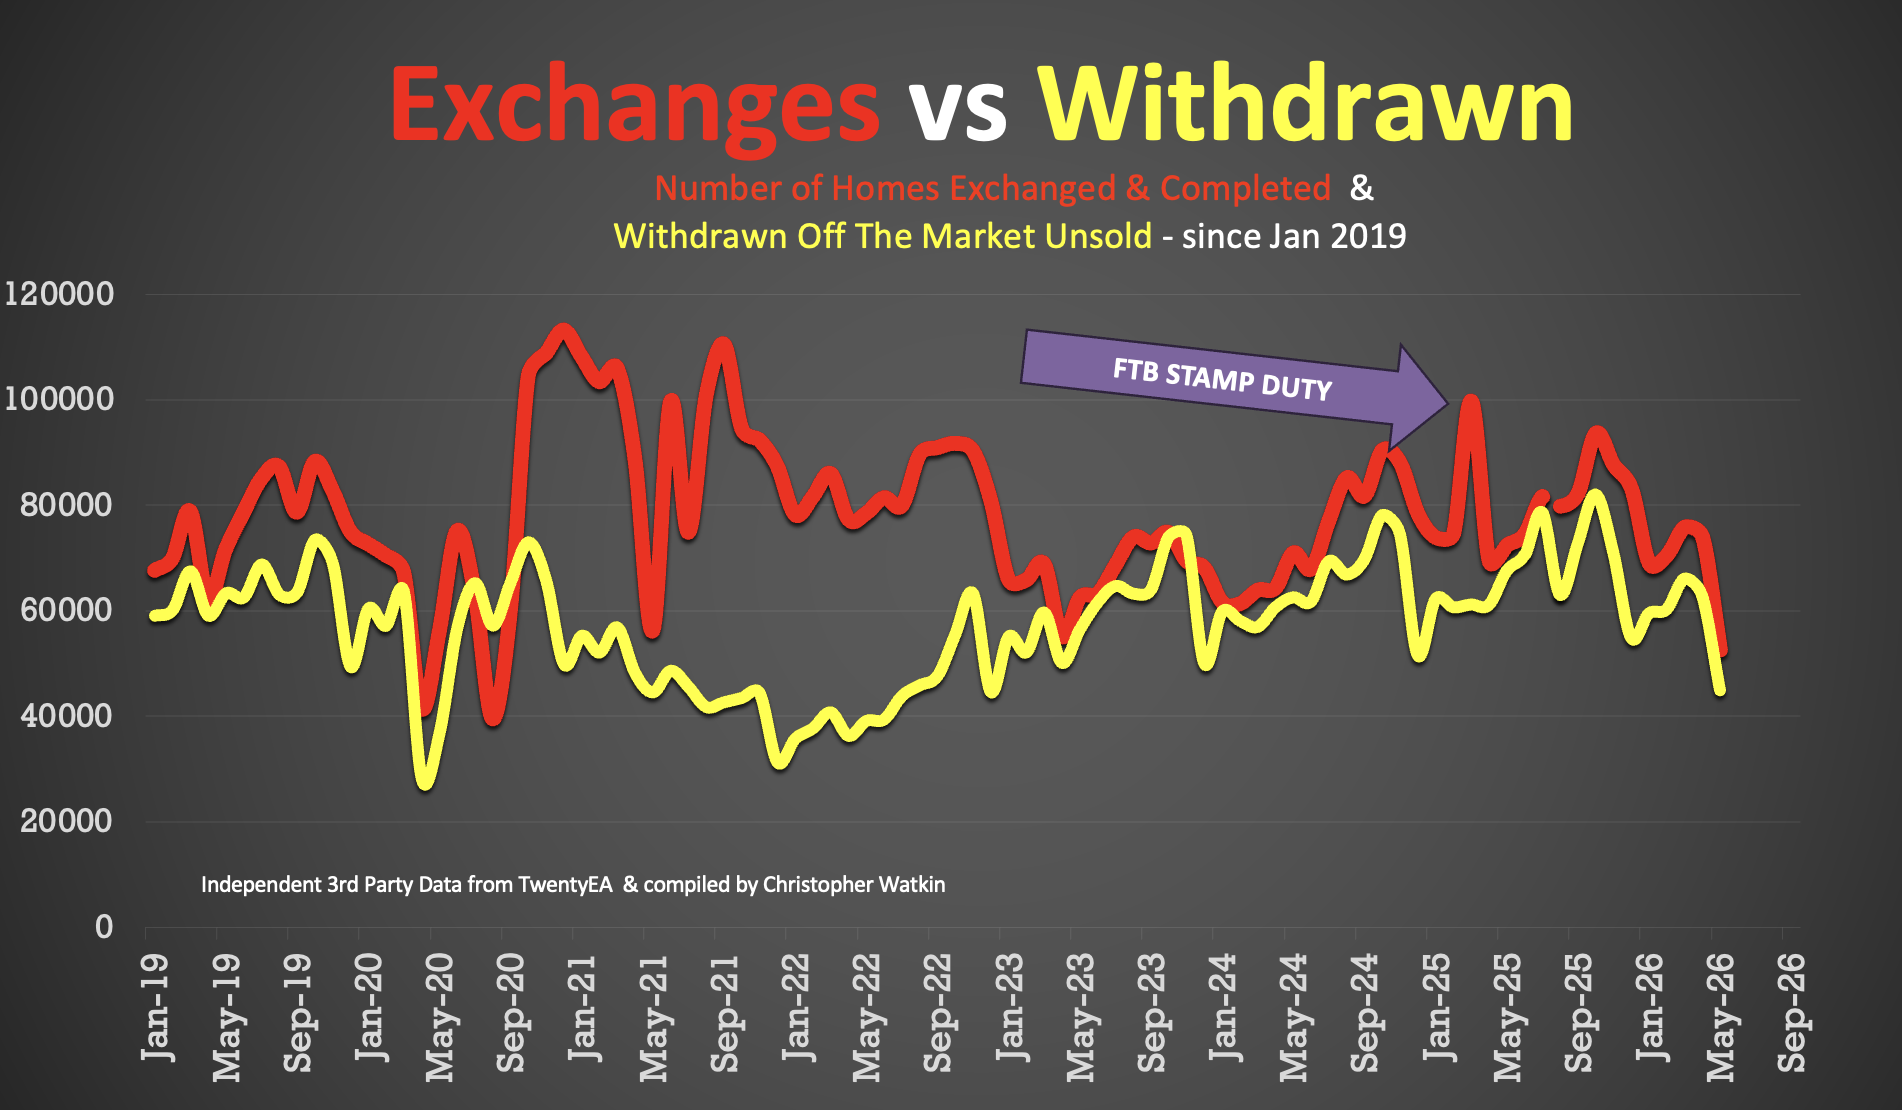
🟩 Withdrawals
• May 2026 – 44.9k Withdrawals – again, this figure will increase as more May withdrawals come thru the system throughout June
• That means that 46.1% of all homes that left UK Estate Agent books in May went unsold.
🟥 Stock Levels
• 747k homes on the market on the 1st of June ’26.
• IMPORTANT – Still to receive the May’s Sales pipelines figures .. so looking at the previous months figures … 461k homes in agent’s sales pipeline on the 1st May 2026, slightly higher than 12 months ago on 1st May ’25 (447k).
🟩 House Prices (£/sq.ft)
• May ’26 agreed sales averaged £349.64 per sq.ft. 1.9% higher than 12 months ago (£342.87) and 13.2% than 5 years ago (£308.94).
The £/sqft at sale agreed matches the HM Land Registry Index with a 98% accuracy, 5 months in advance. That is why it is so important.
🟥 UK Rental Data
• Average Rent in Wk 21 – £1,818 pcm
• Average Rent in May 2026 – £1,785 pcm (£1,779 in May 25)
• Average Rent in YTD 2026 – £1,743 pcm
• 305k UK Rental Stock available to rent in May 26 (311k in May 2025)
