

 In this week’s UK Property Market Stats Show, I review the housing market for the week ending Sunday 22 March 2026 (week 11), alongside Rob Smith of TPFG.
The second part of the programme focuses on estate and letting agent performance in Chelsea.
The episode also looks at how agents can use data tools to demonstrate performance, address overvaluing in the market and justify their fees.
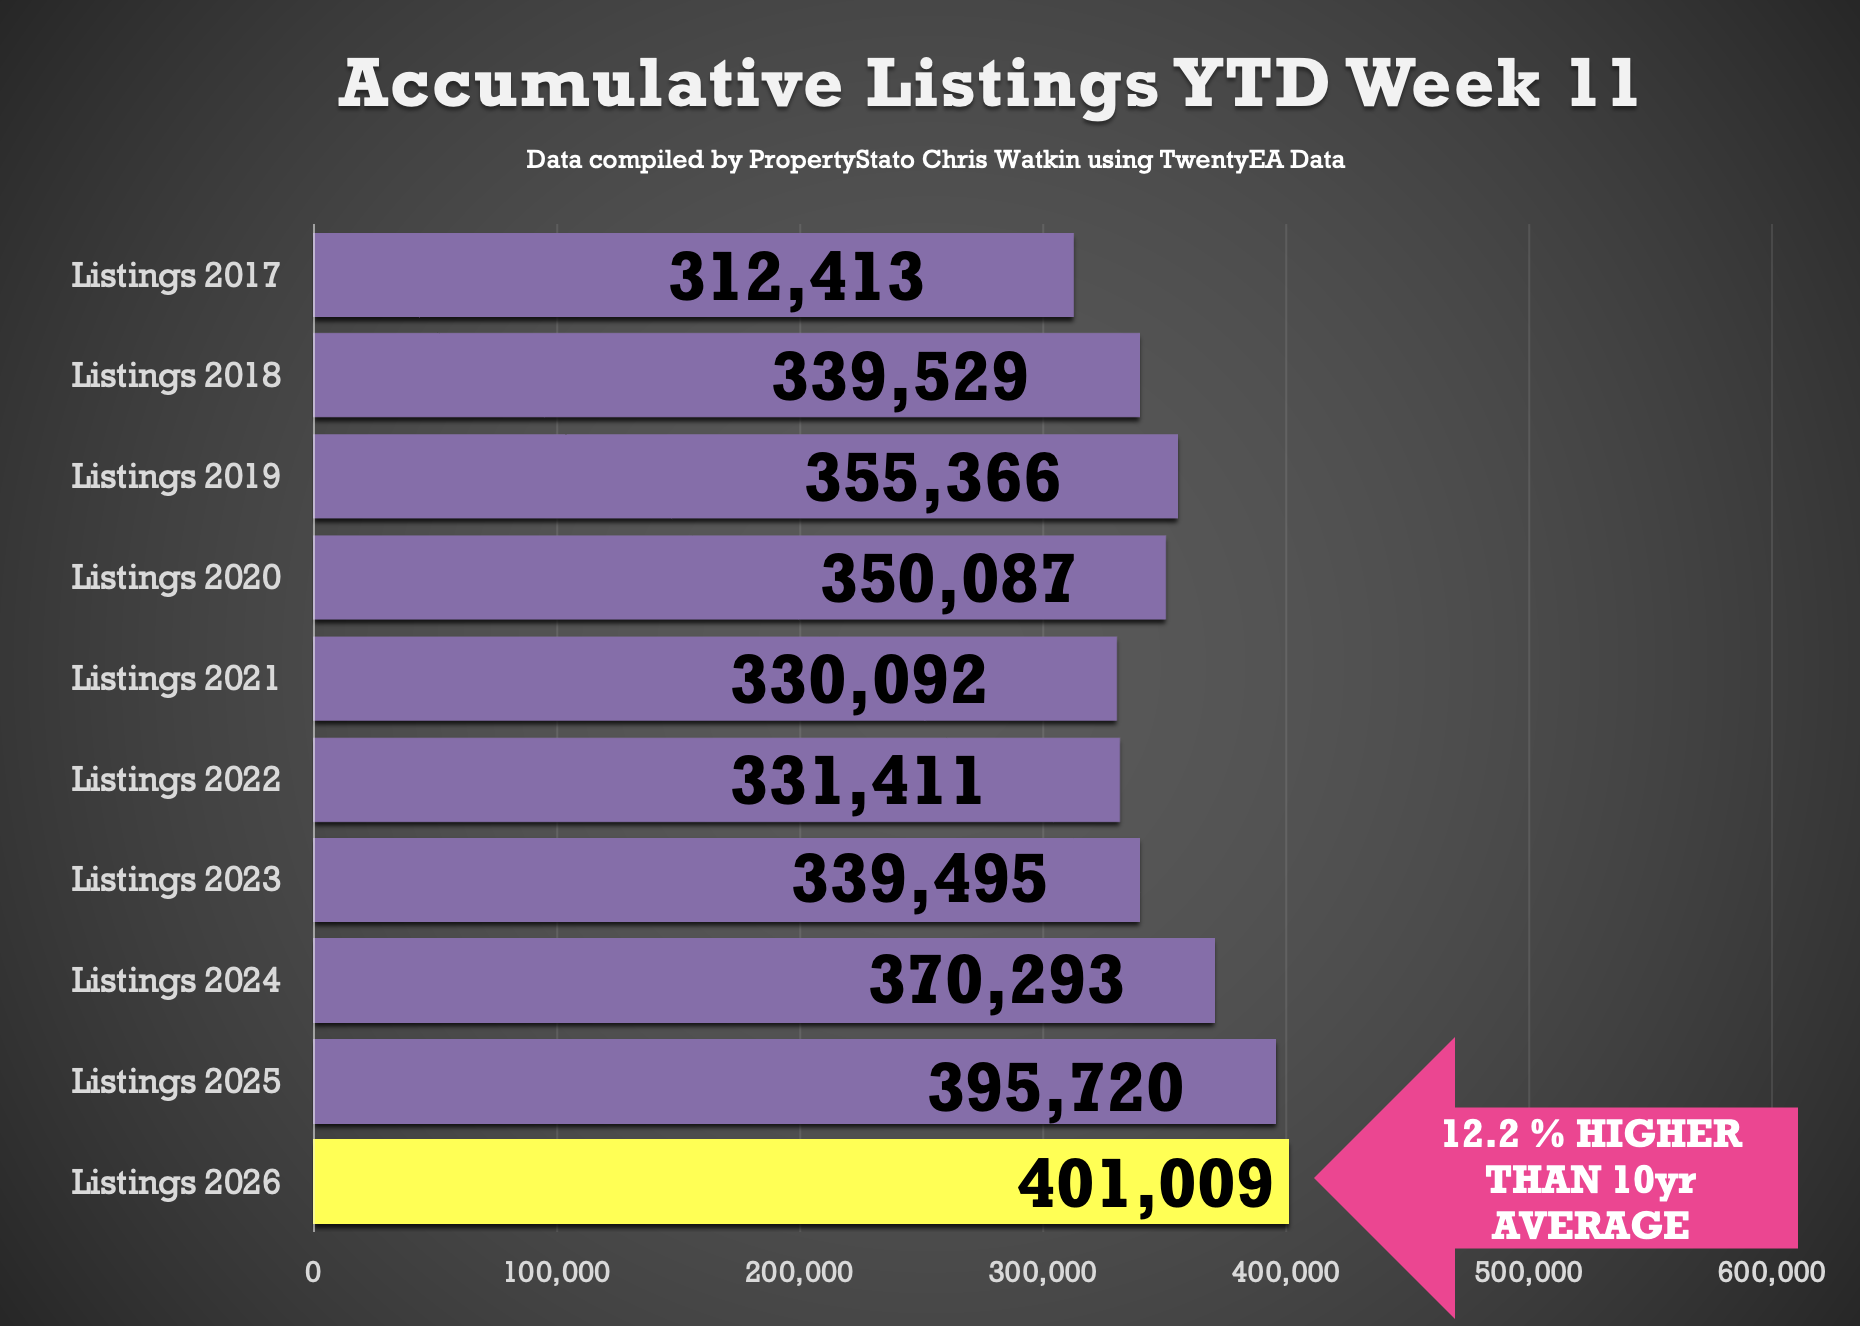
🟩 Listings YTD
401k new properties have come onto the market YTD , 1.3% ahead of 2025, 8.3% above 2024, and 19.4% higher than the 2017–19 average.
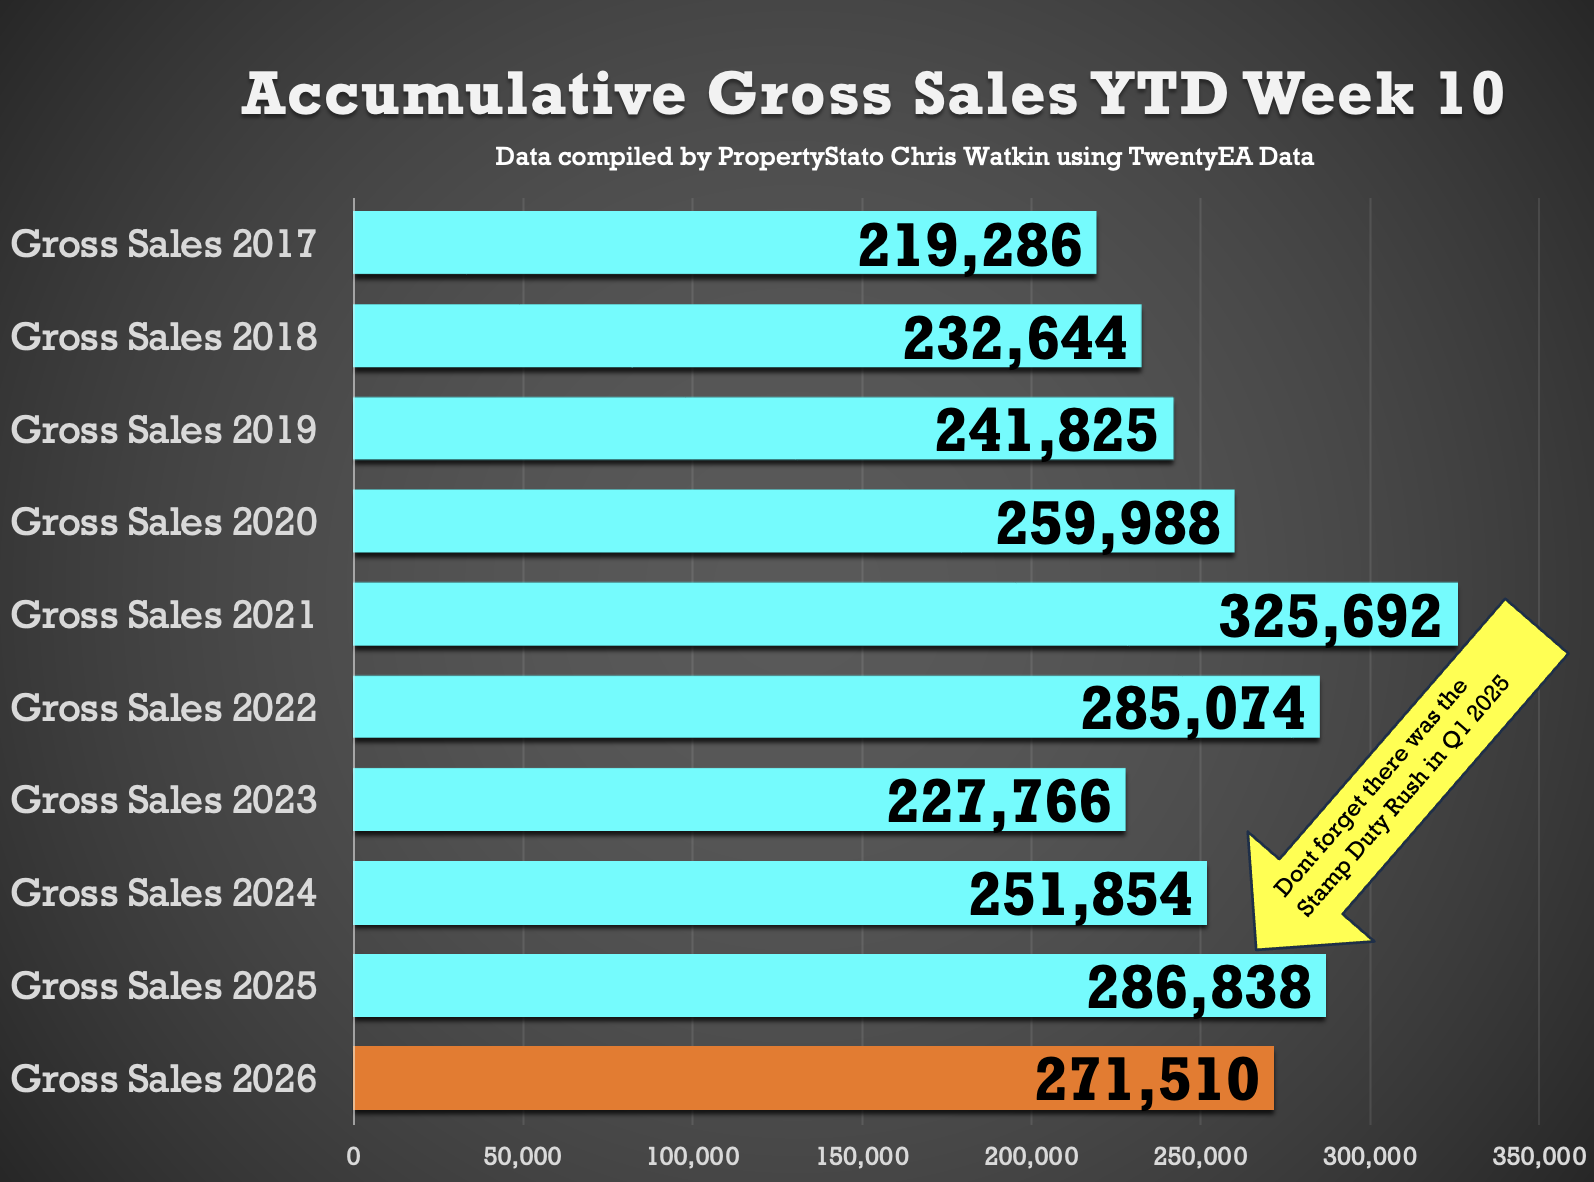
🟧Gross Sales YTD
272k UK homes sold STC YTD , 5.3% lower than 2025, 7.8% higher than 2024, and 17.4% above pre Covid norms.
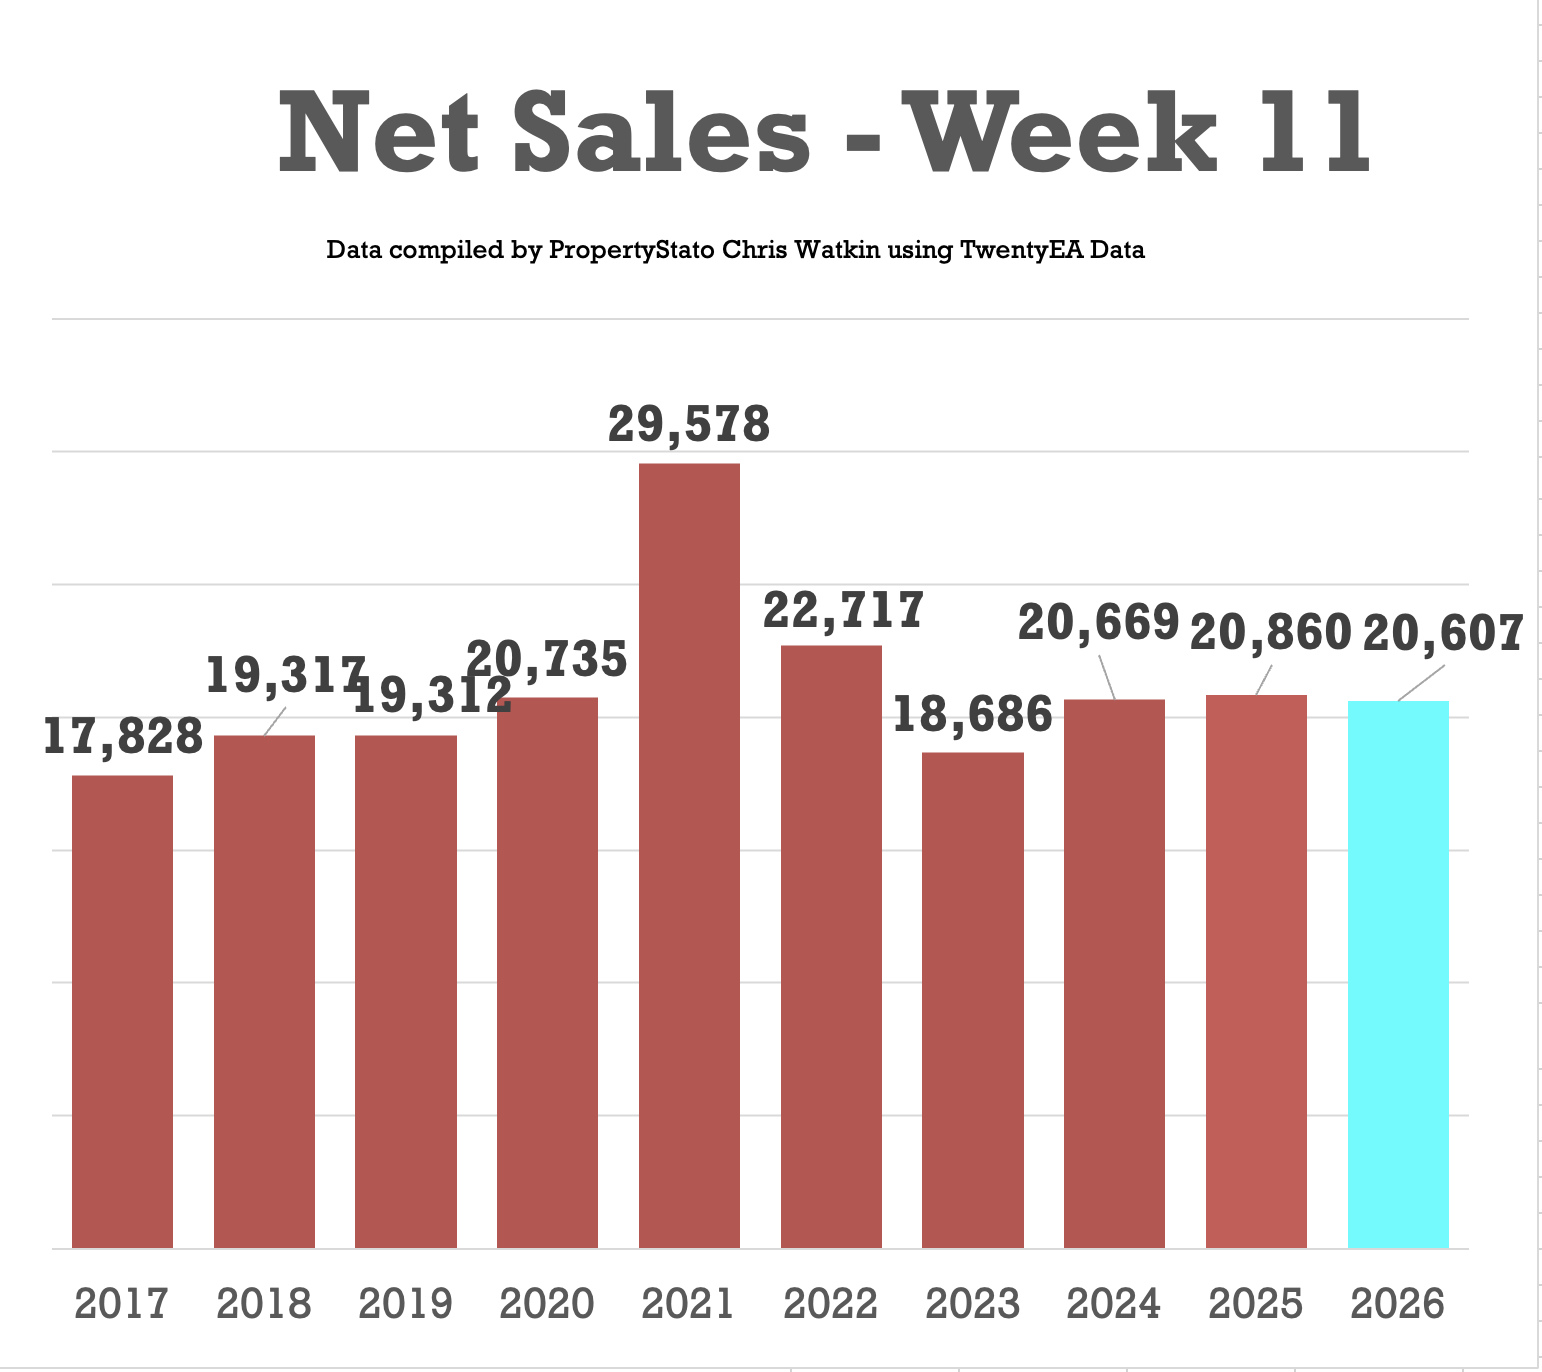
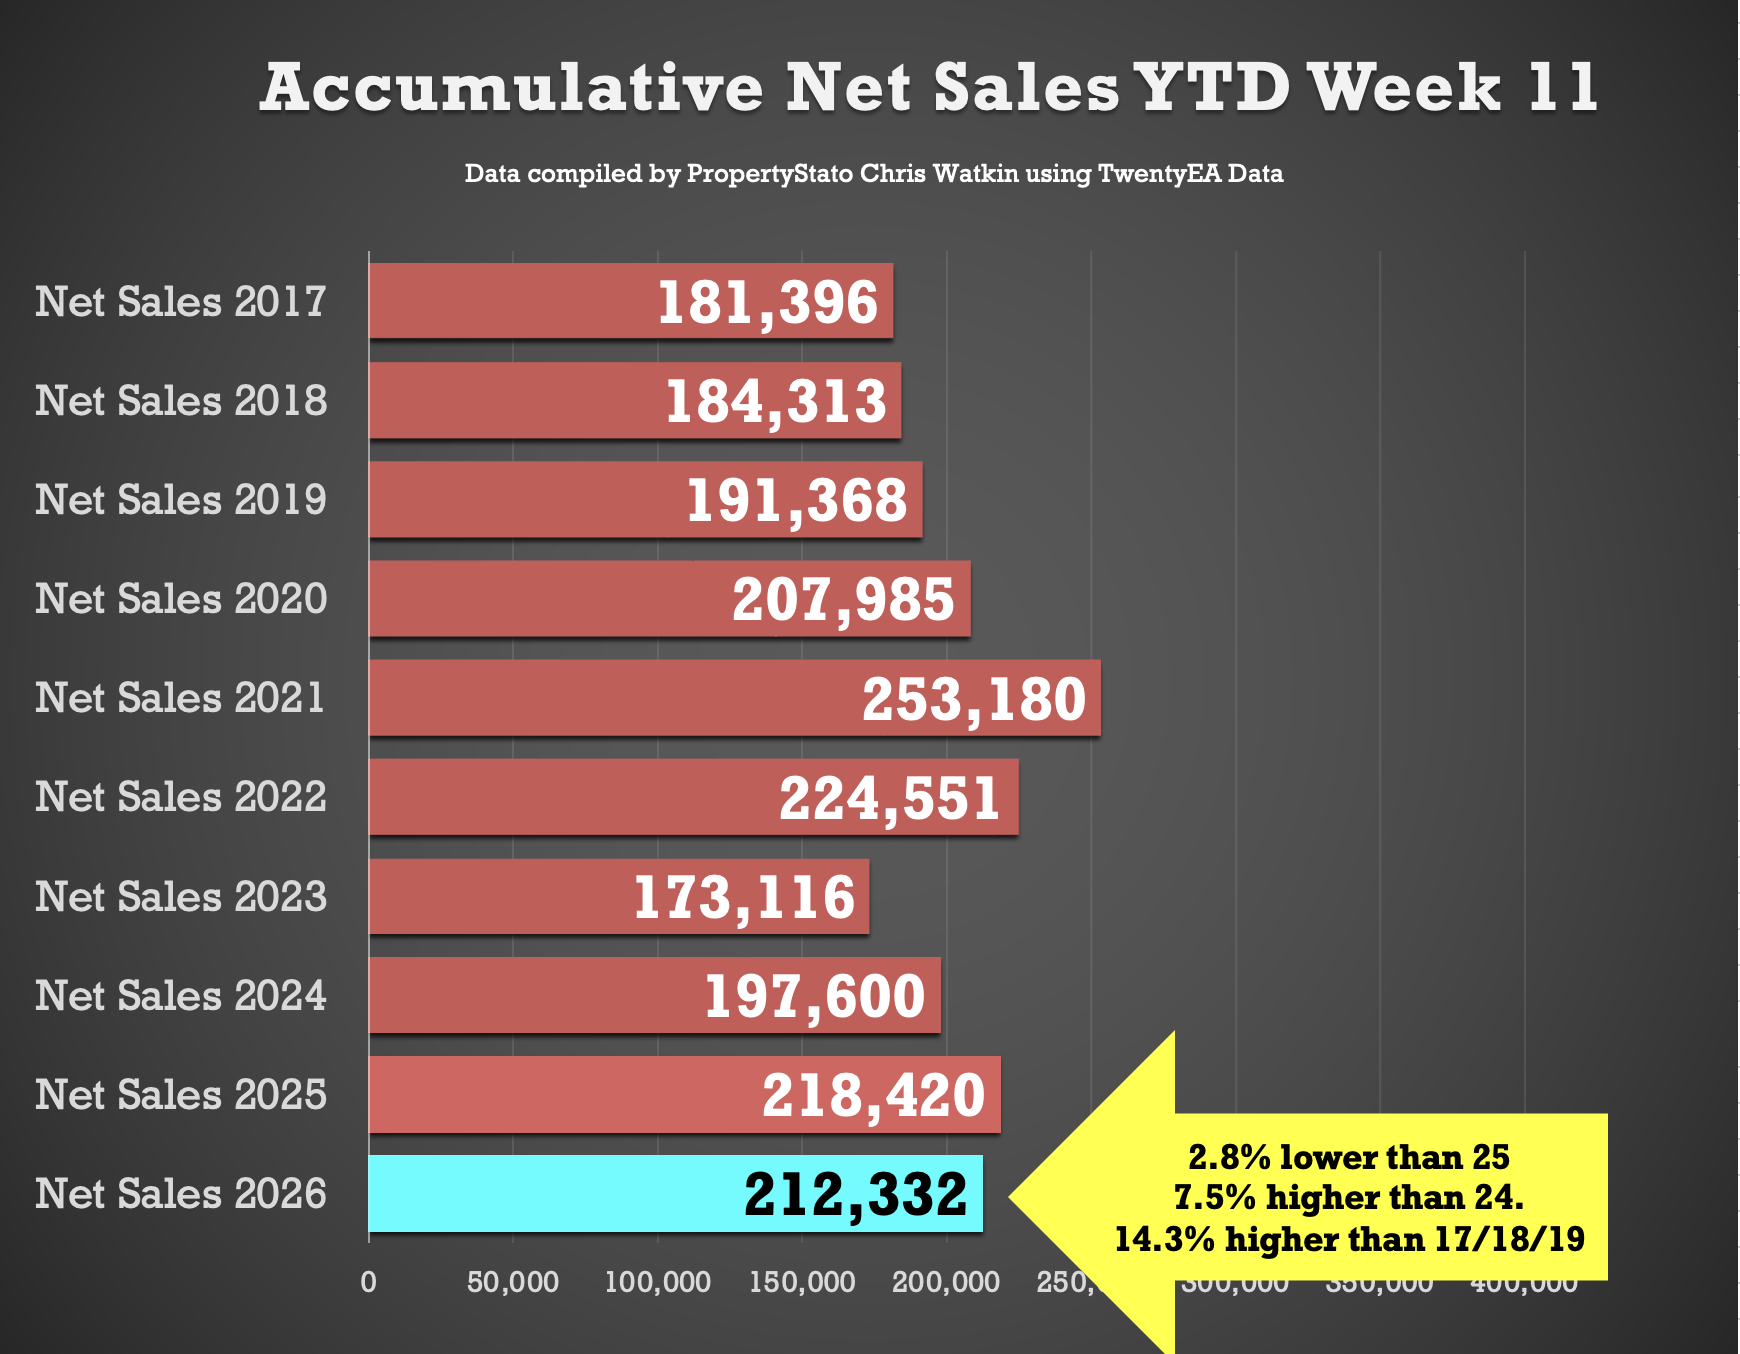
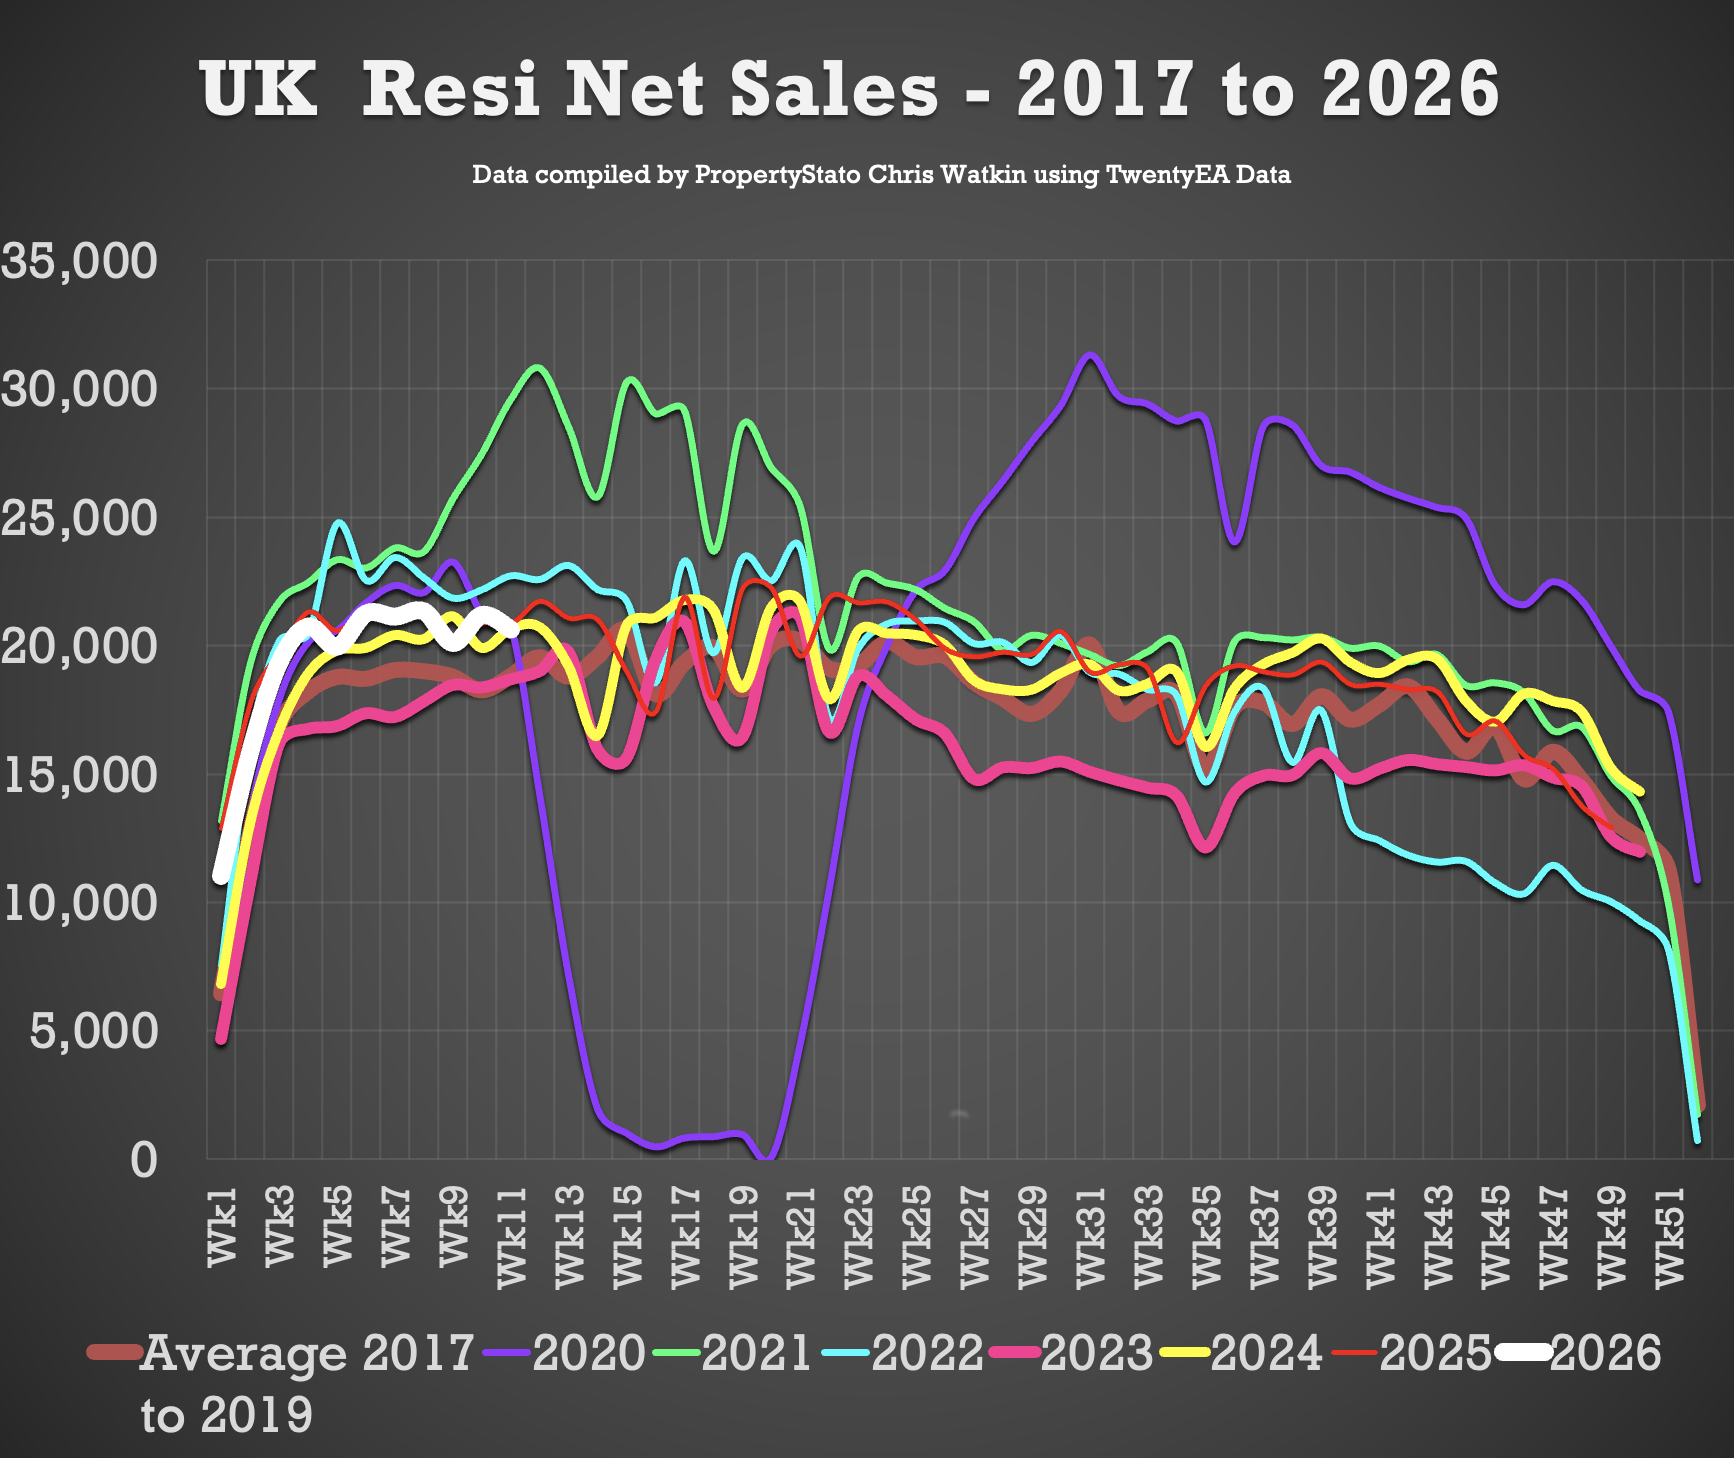
🟩 Net Sales YTD
212k UK net home sales YTD (Net Sales being Gross sales less Fall Thrus). 2.8% lower than 2025, 7.5% ahead of 2024, 22.7% ahead of 2023 and 14.% above the 2017–19 average.
🟥 Exchanges YTD
139k UK Exchanges to the end of Feb 26
5.5% lower than end of Feb 2025, when it was 147k.
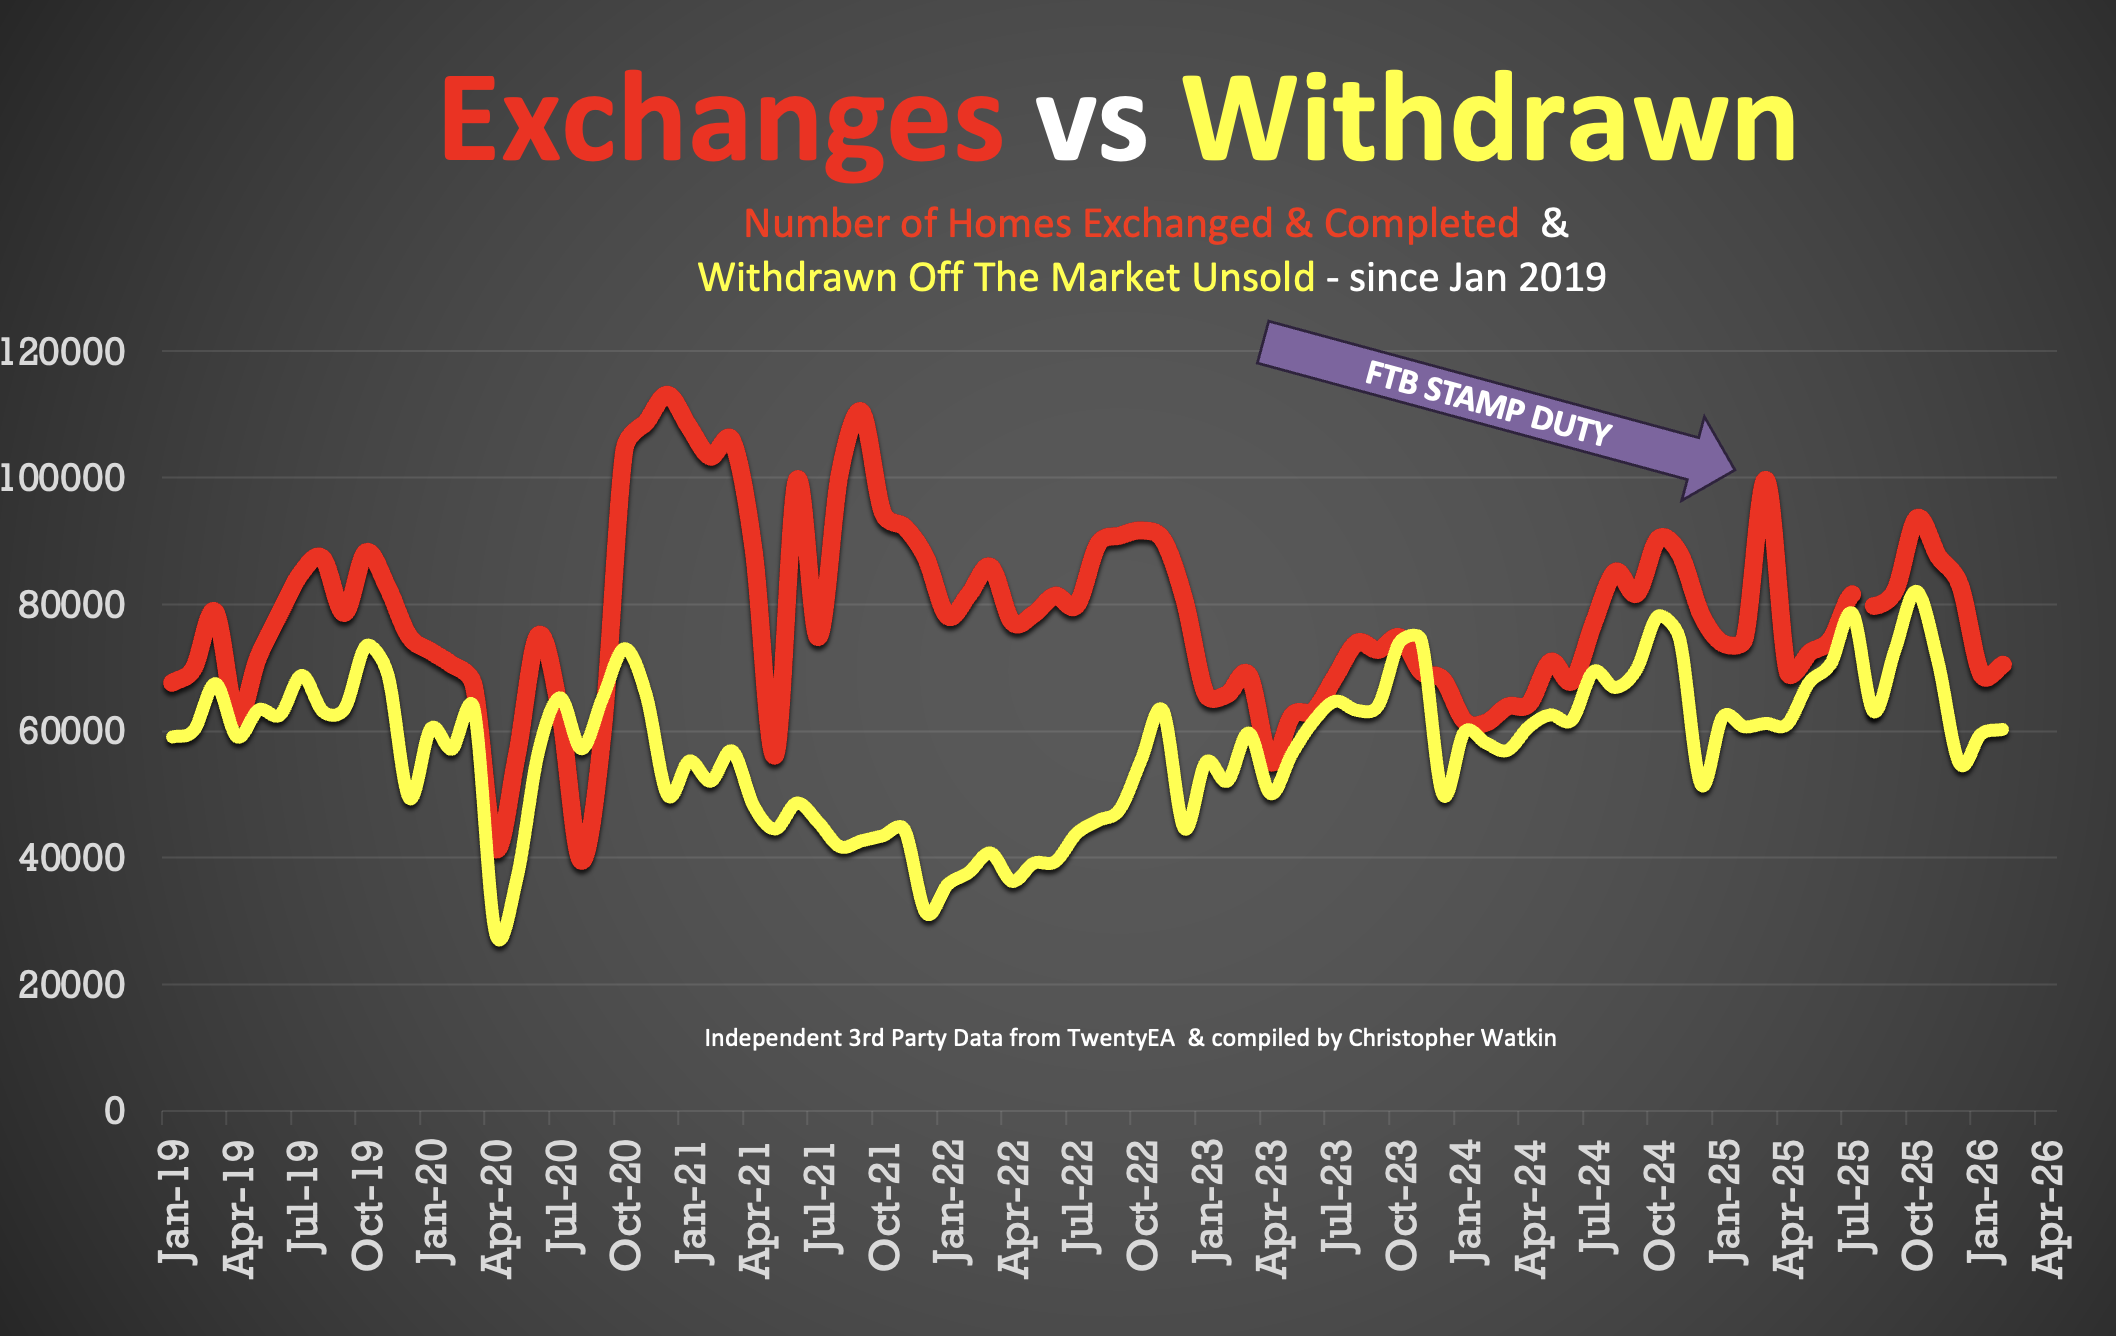
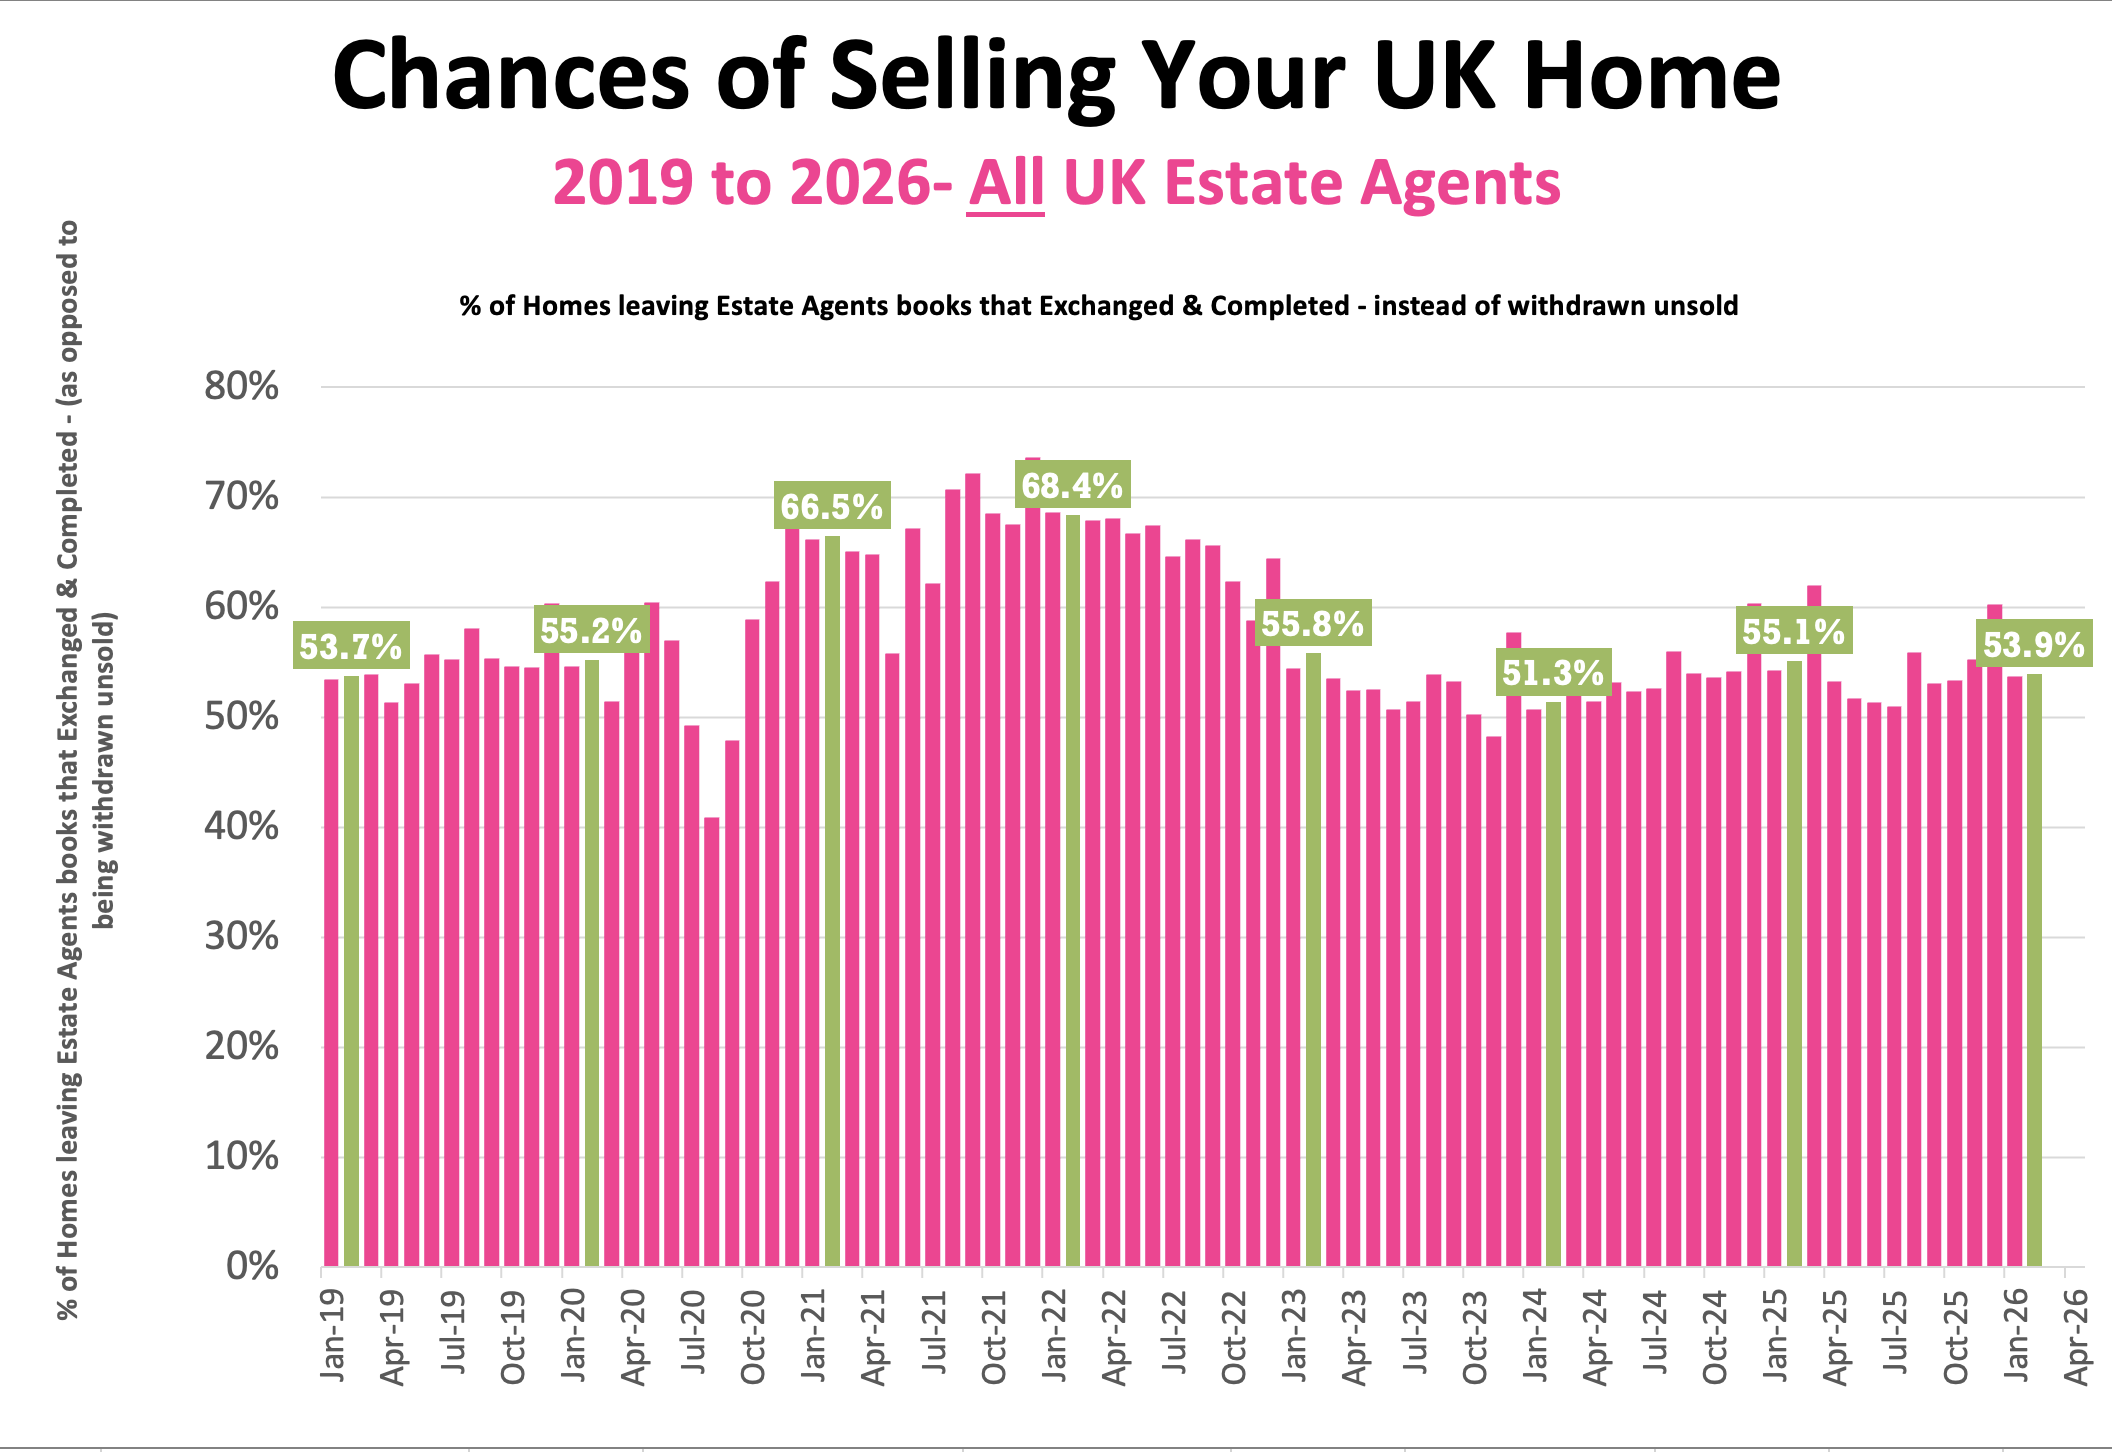
🟥 Overvaluing
46.1% of the homes that left UK Estate Agents books in February were withdrawn unsold. Main cause – blatant overvaluing supported by long sole agency agreements of 20+ weeks.
The Show
The UK Property Market Stats Show for the week ending Sunday, 22nd March 2026 (week 11) with Rob Smith, boss man of TPFG Group MD of Hunters, Whitegates & Northwood brands
Detailed Breakdown …
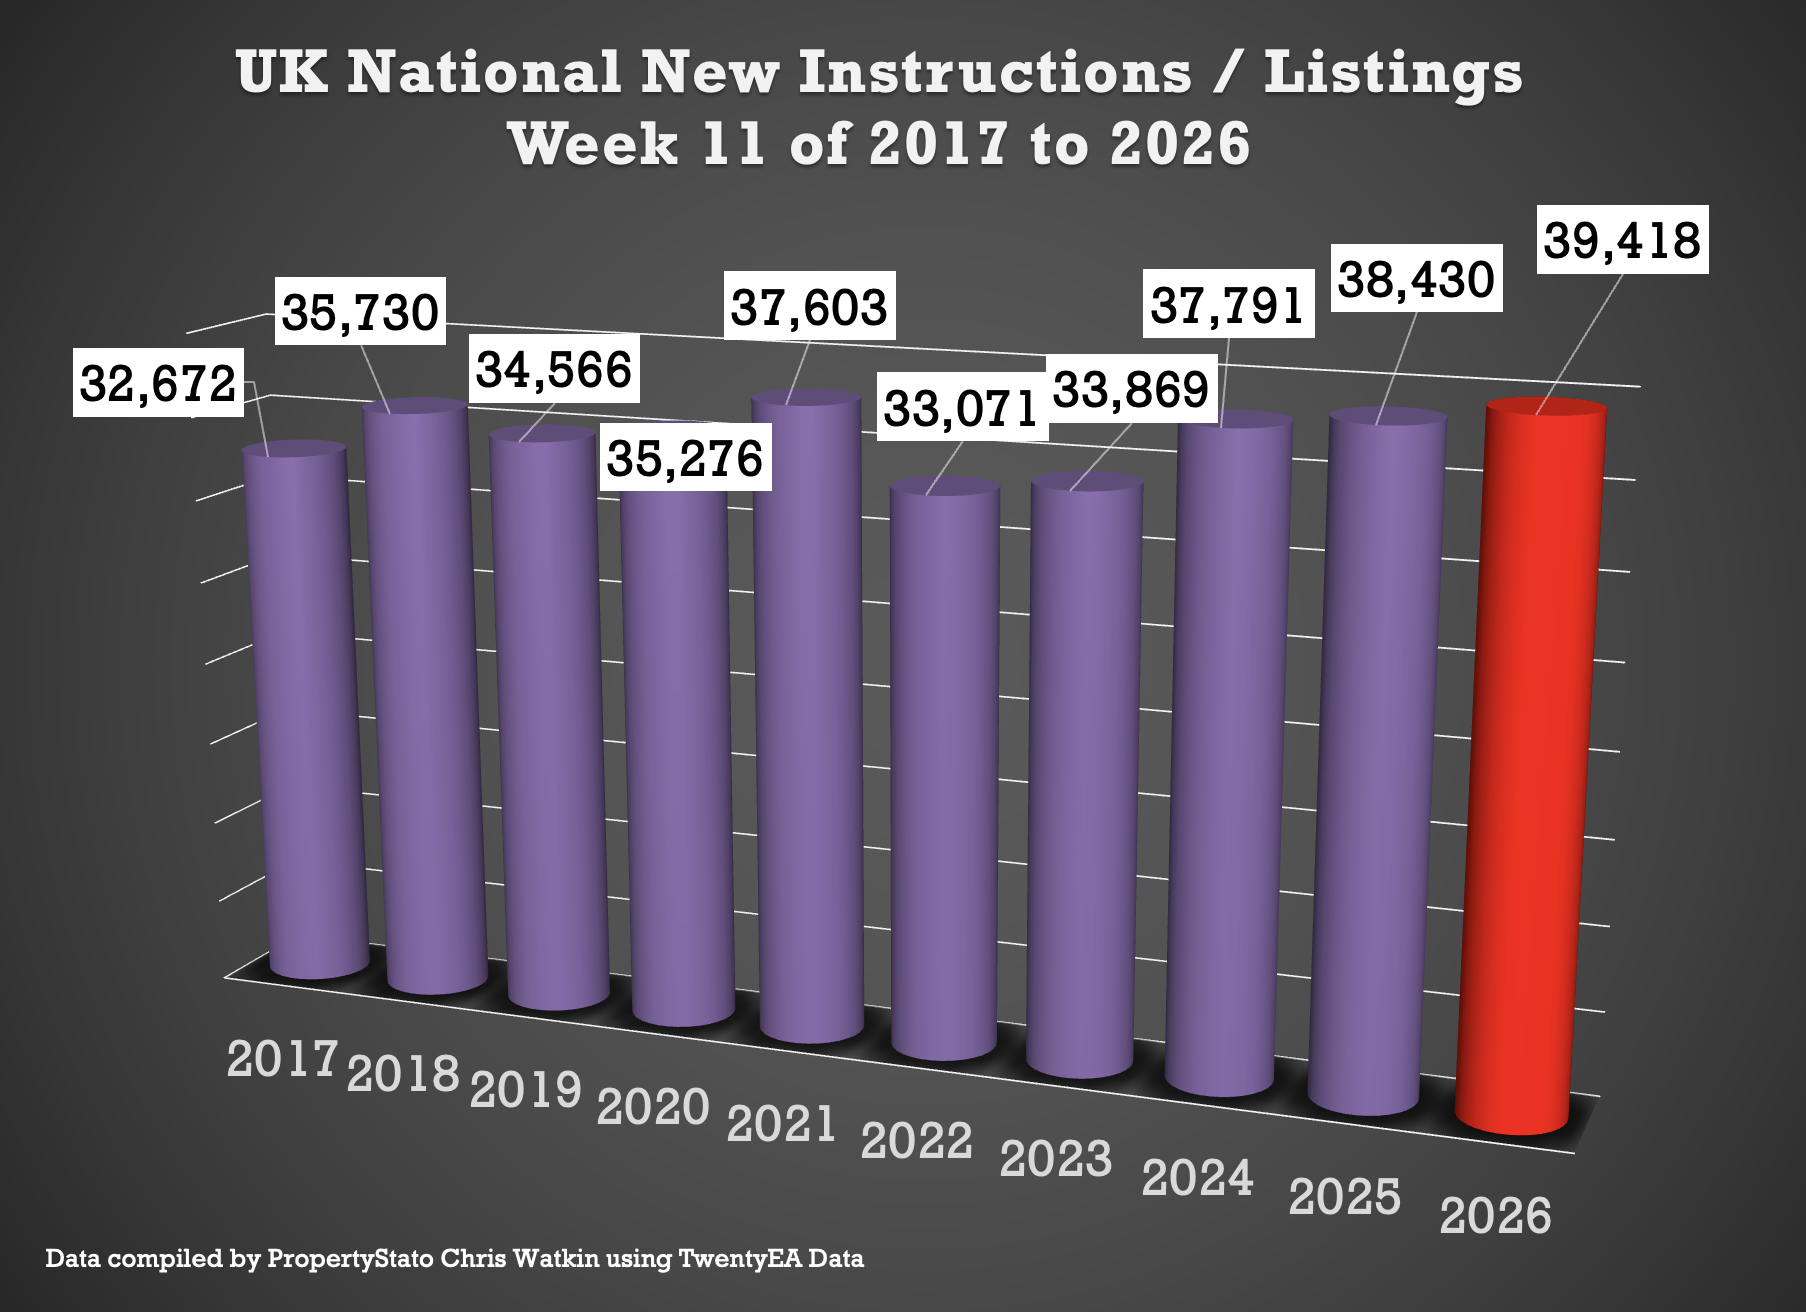
✅ New Listings
• 39.4k new properties came onto market this week, down marginally from 39.7k last week.
• 2025 weekly average: 30.6k.
• 10-year week 11 average : 35.8k.
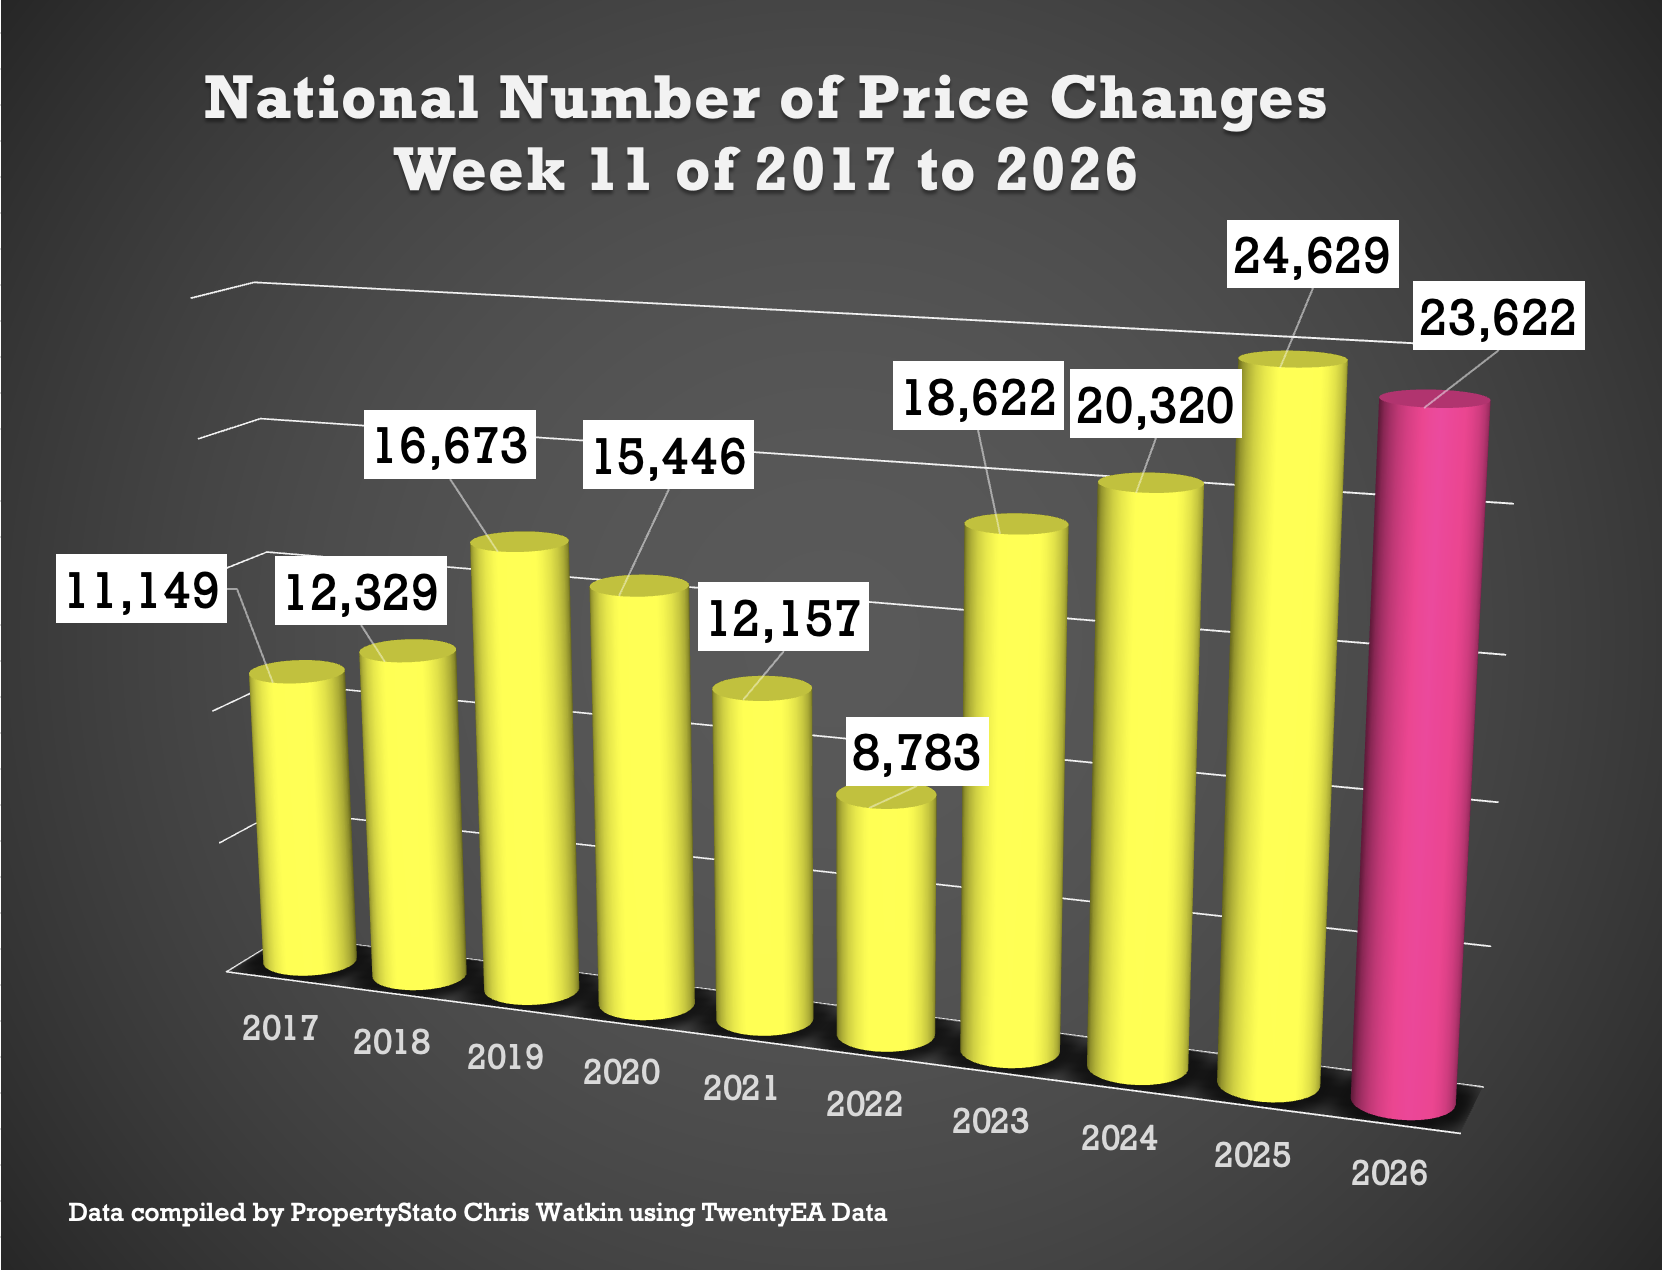
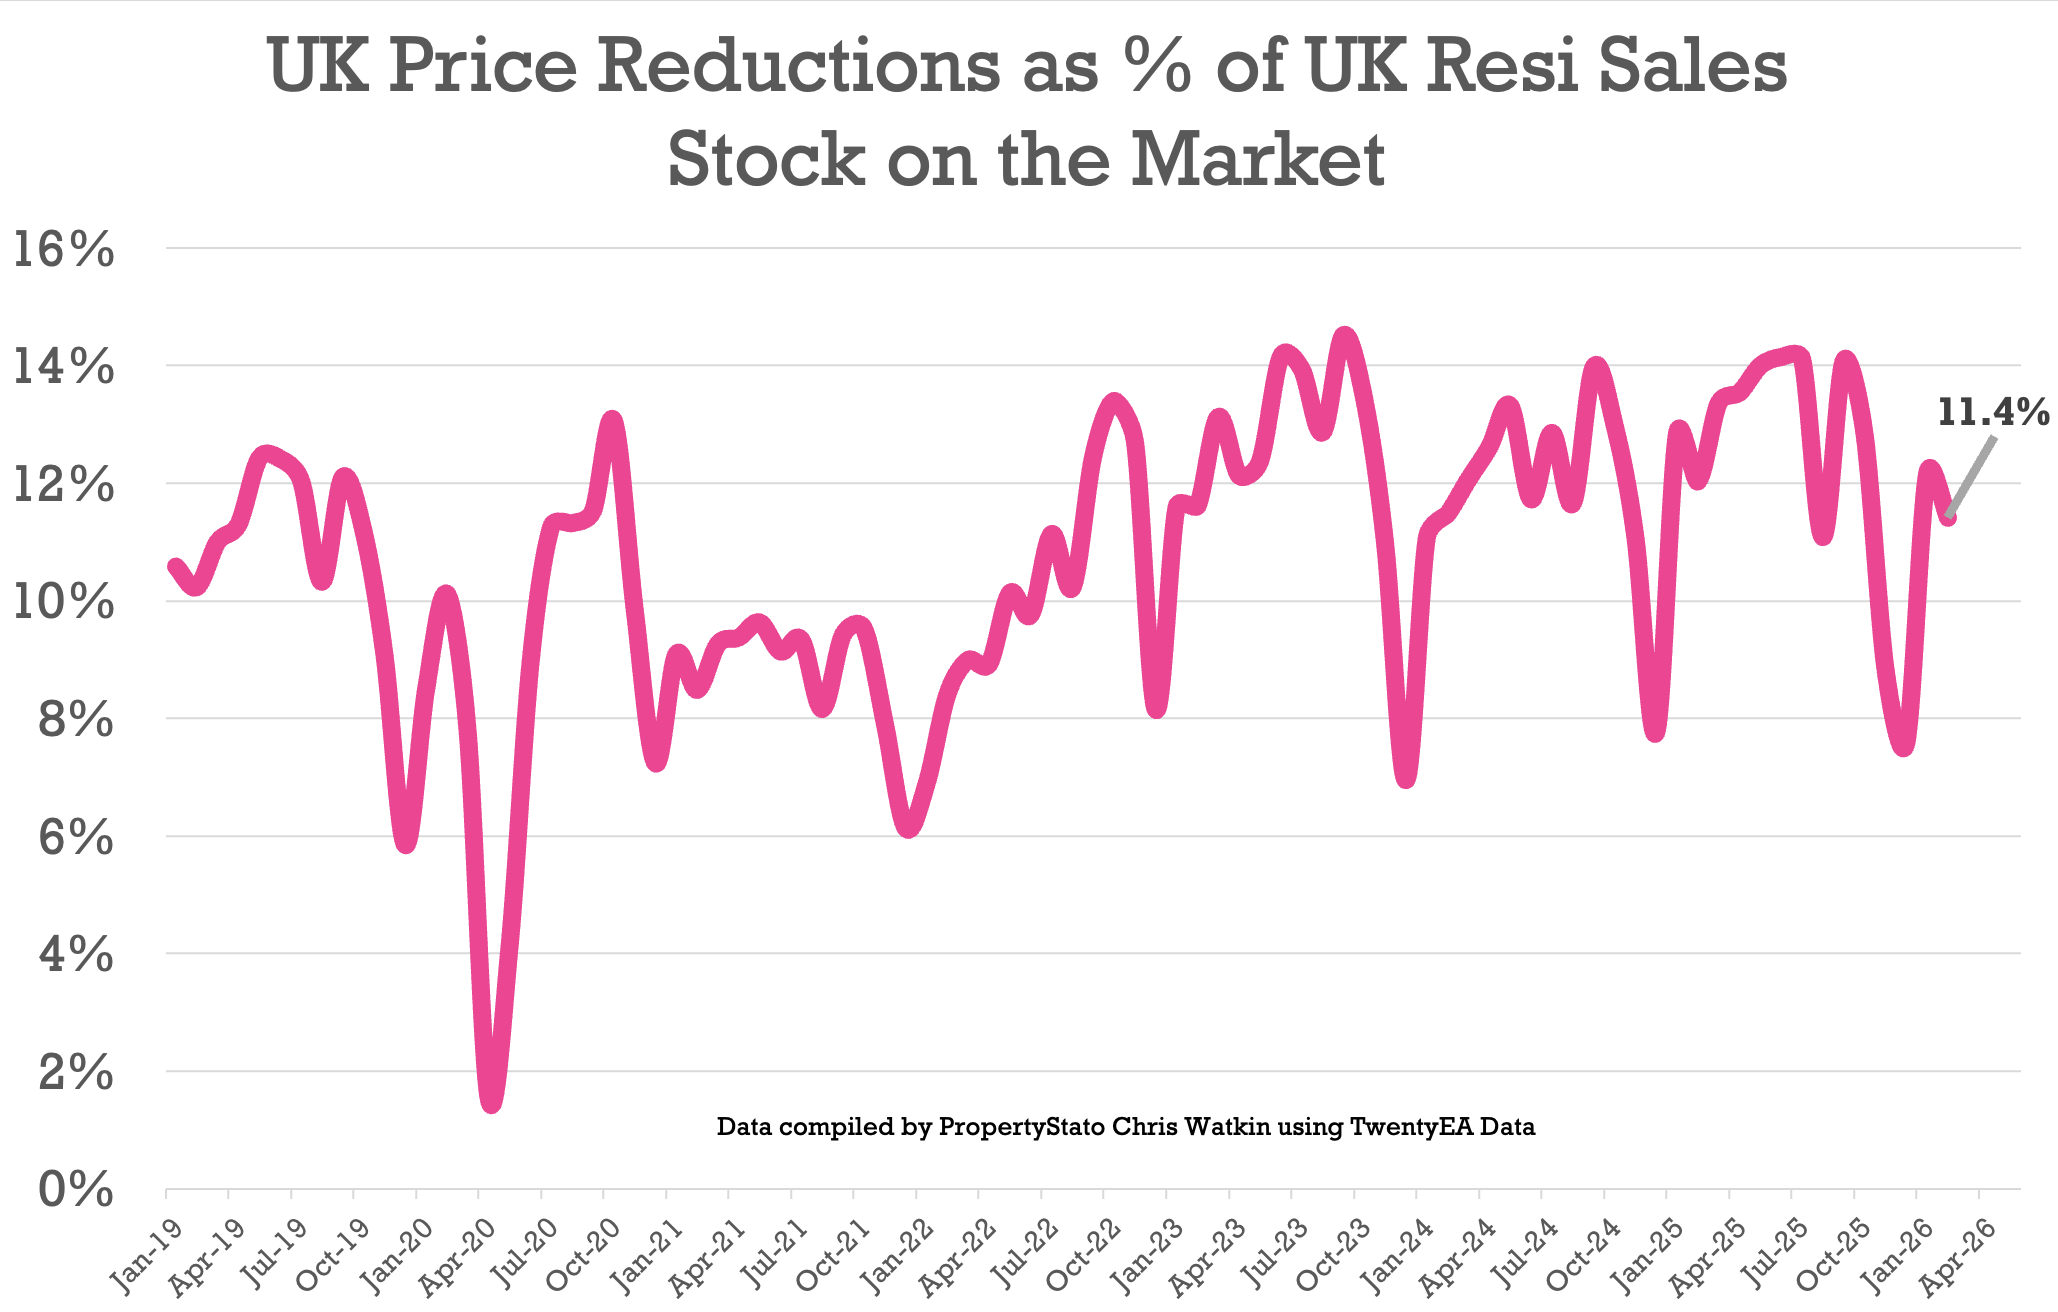
✅ Price Reductions
• 23.6k reductions this week, down from 22.9k last week
• 11.4% of resi homes for sale were reduced in February. Feb 25 – 12%. Feb 24 – 11.5%
• 2025 average was 12.8%, versus the 6-year long-term average of 10.7%.
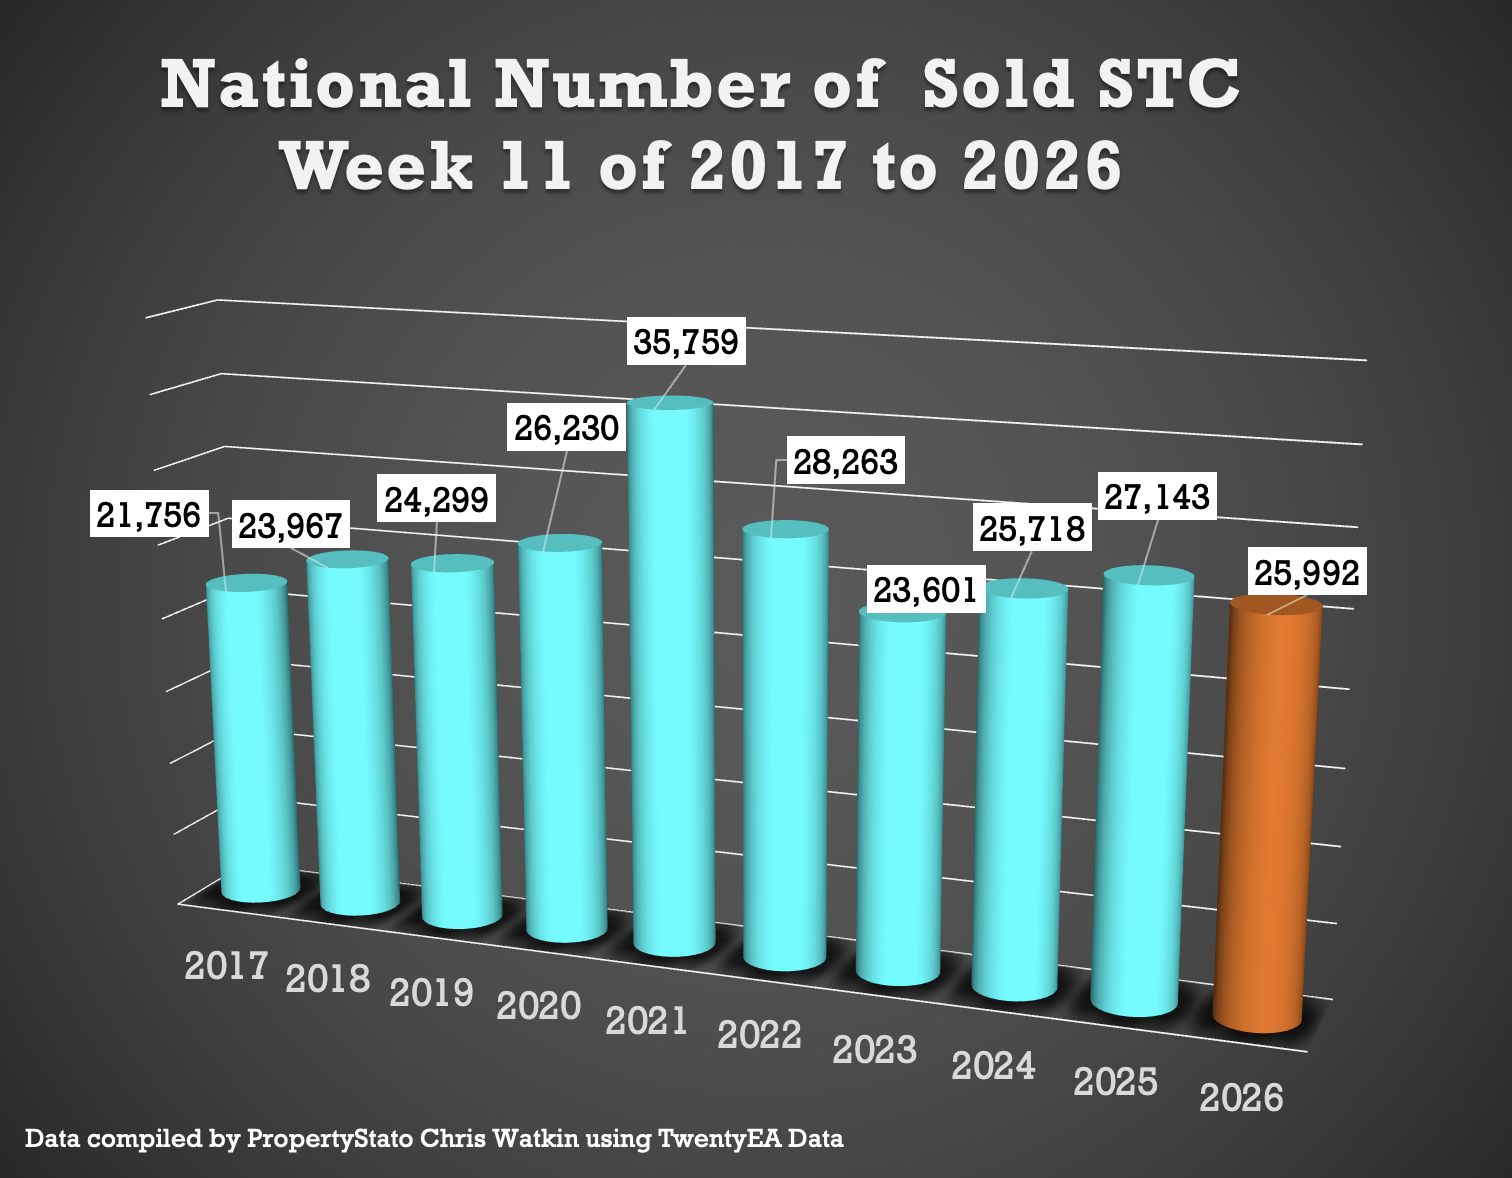
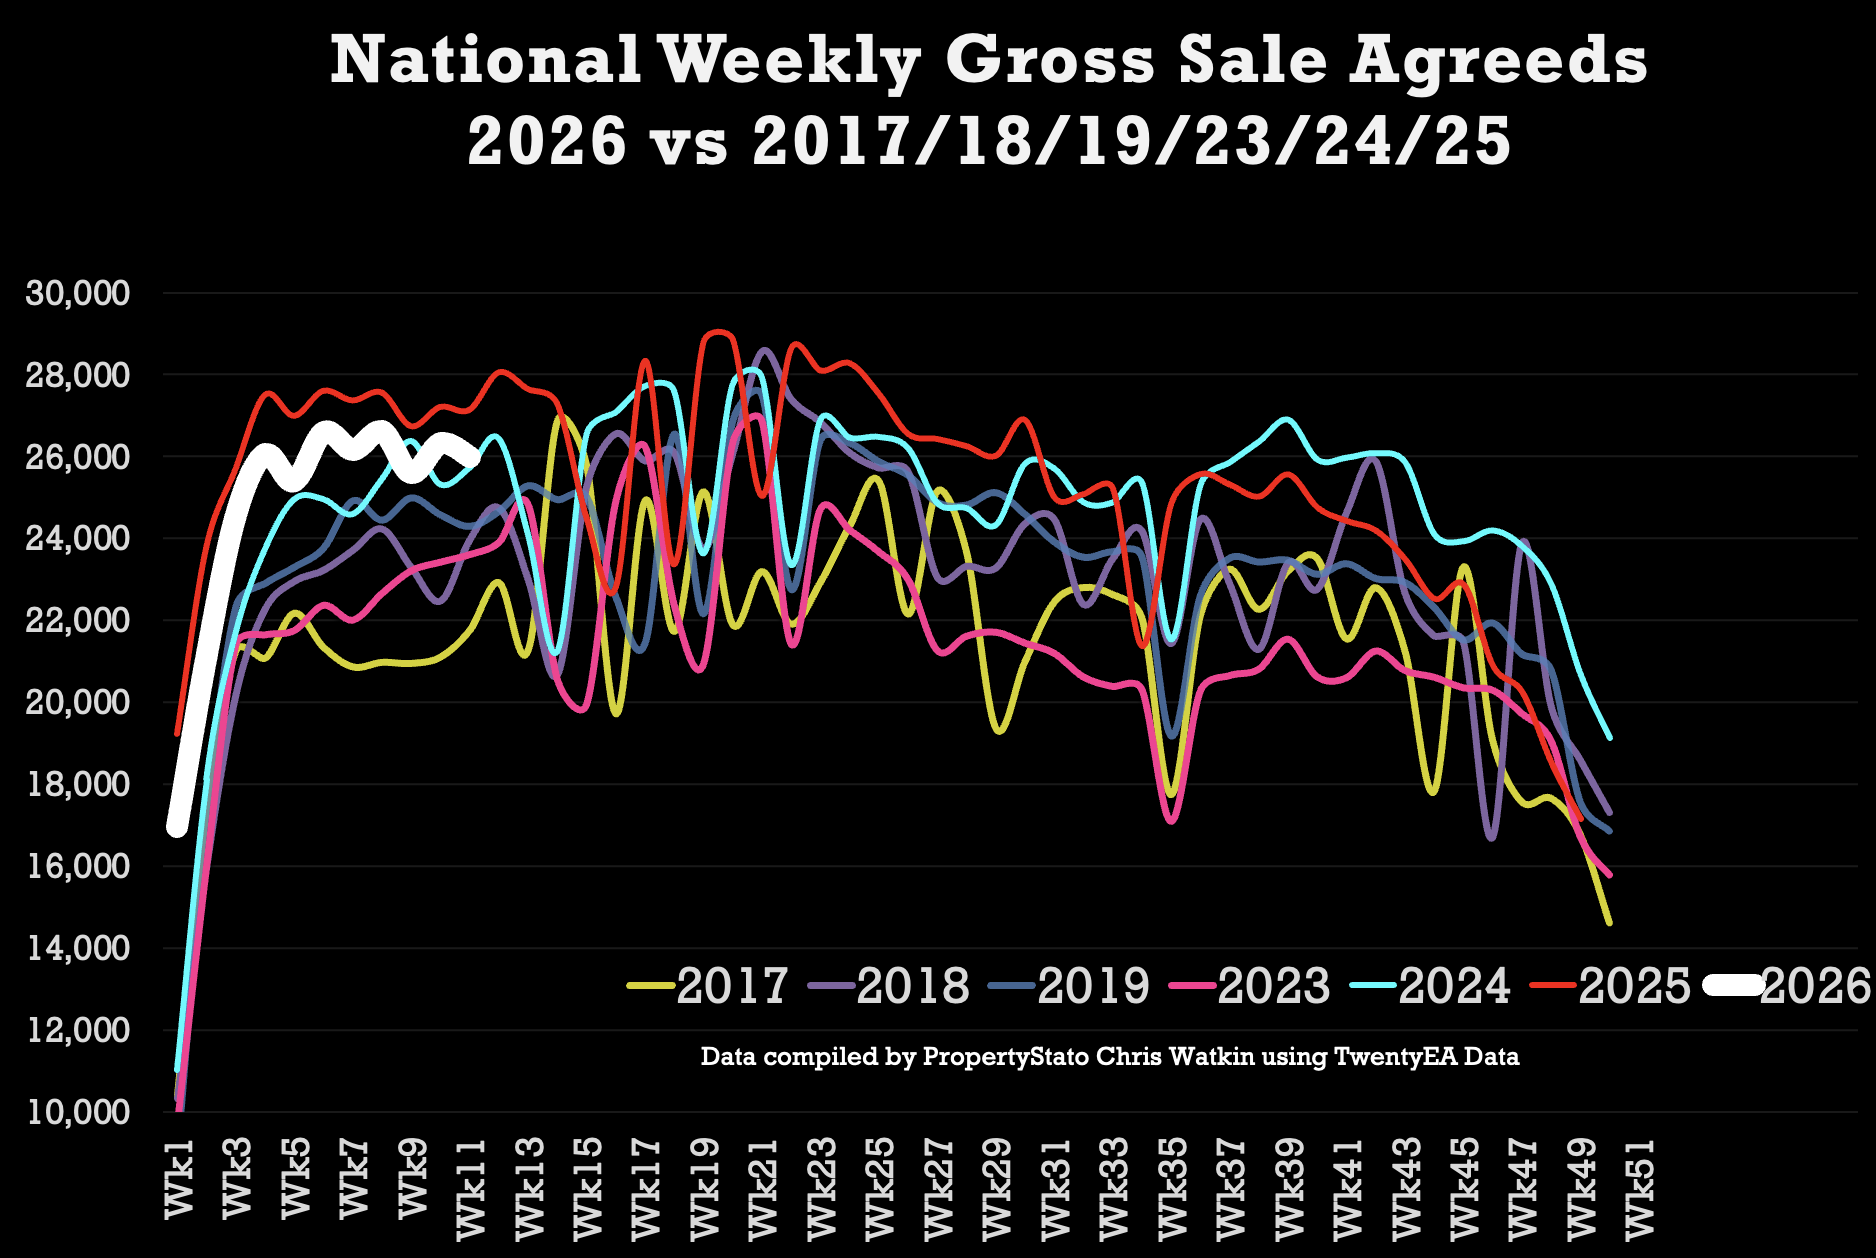
✅ Sales Agreed
• 26k homes sold stc this week 11, slightly down from 26.3k last week.
• Week 11 average (for last 10 years which includes the post pandemic boom) : 26.3k
• 2026 weekly average : 24.2k.
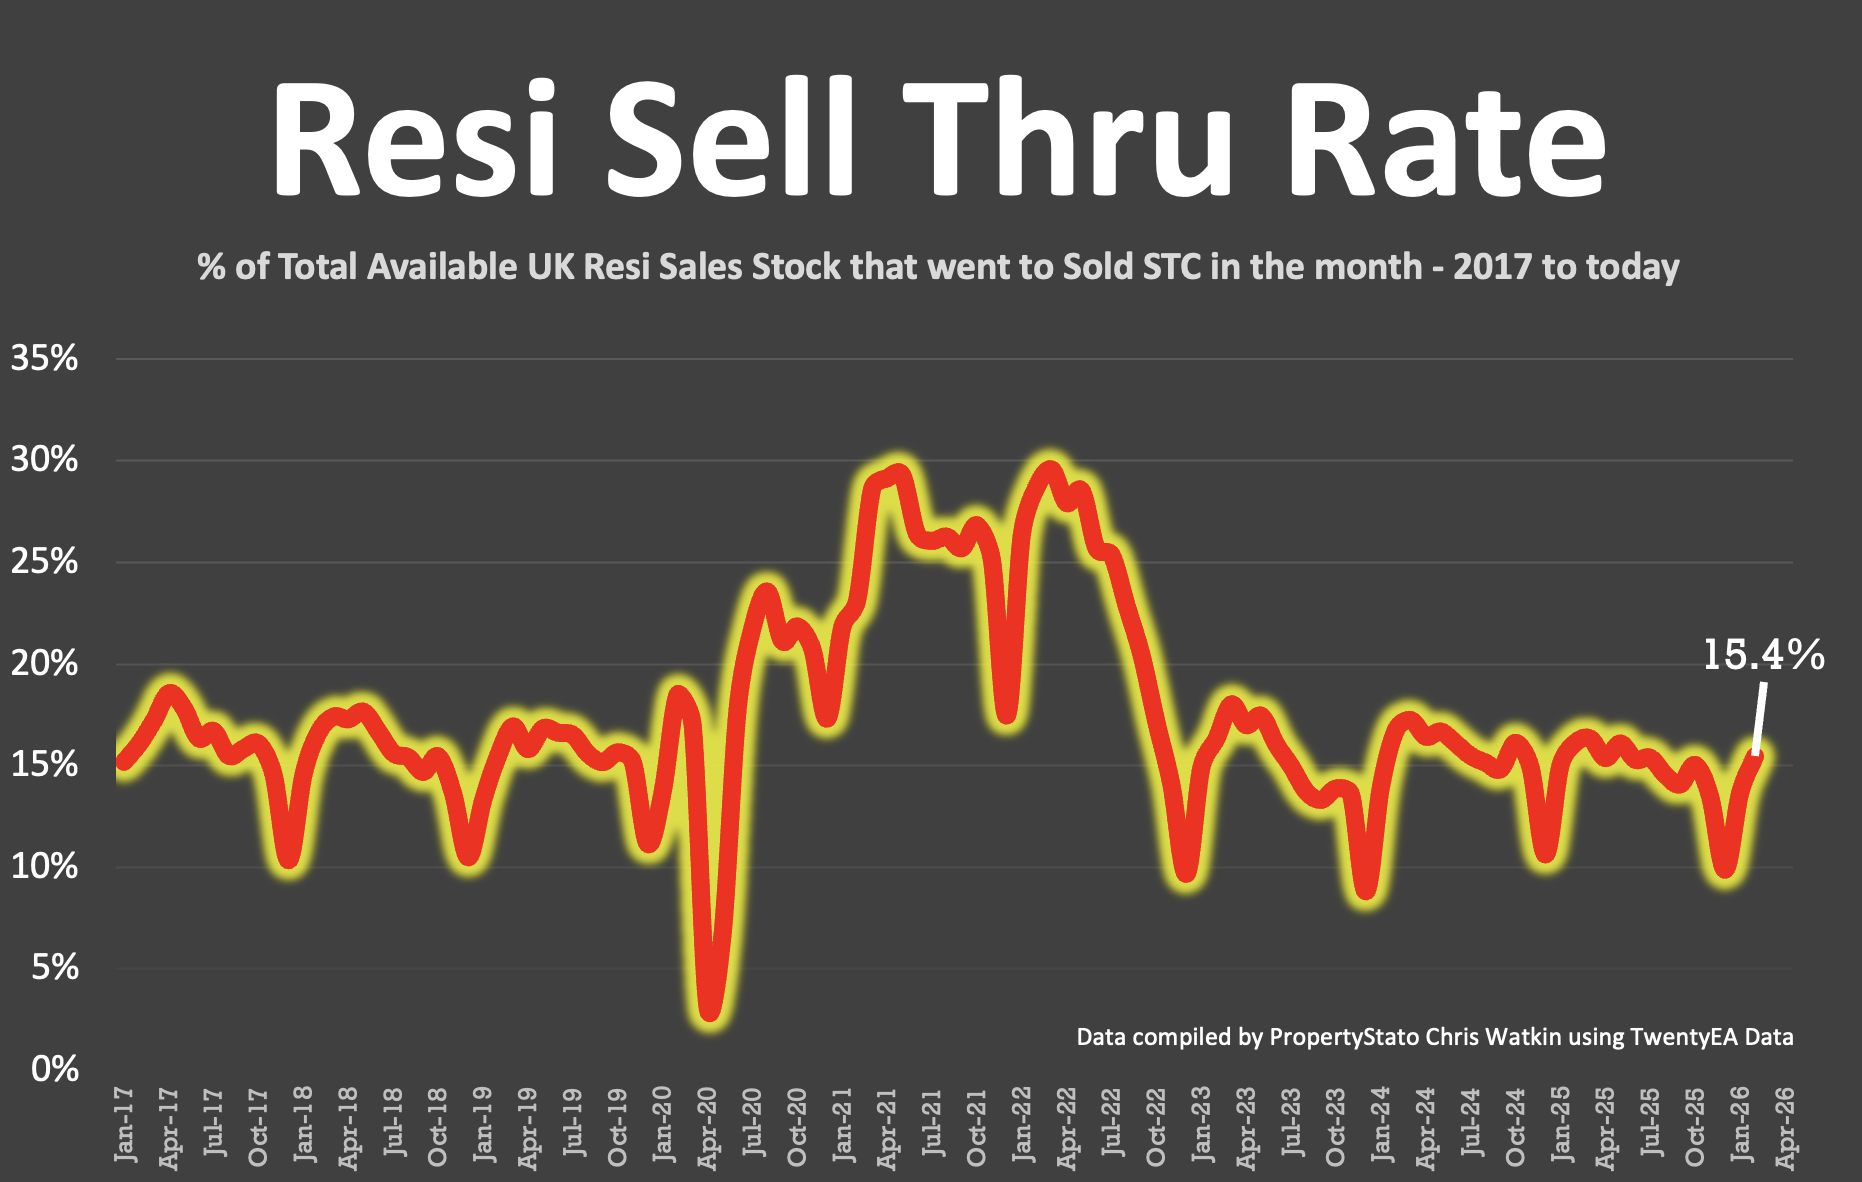
✅ Sell-Through Rate
• 15.4% of homes on agents’ books went SSTC in February ’26. (Feb ’25 – 16.1% / Feb ’24 – 16.7%)
• Pre-Covid average: 15.5%.
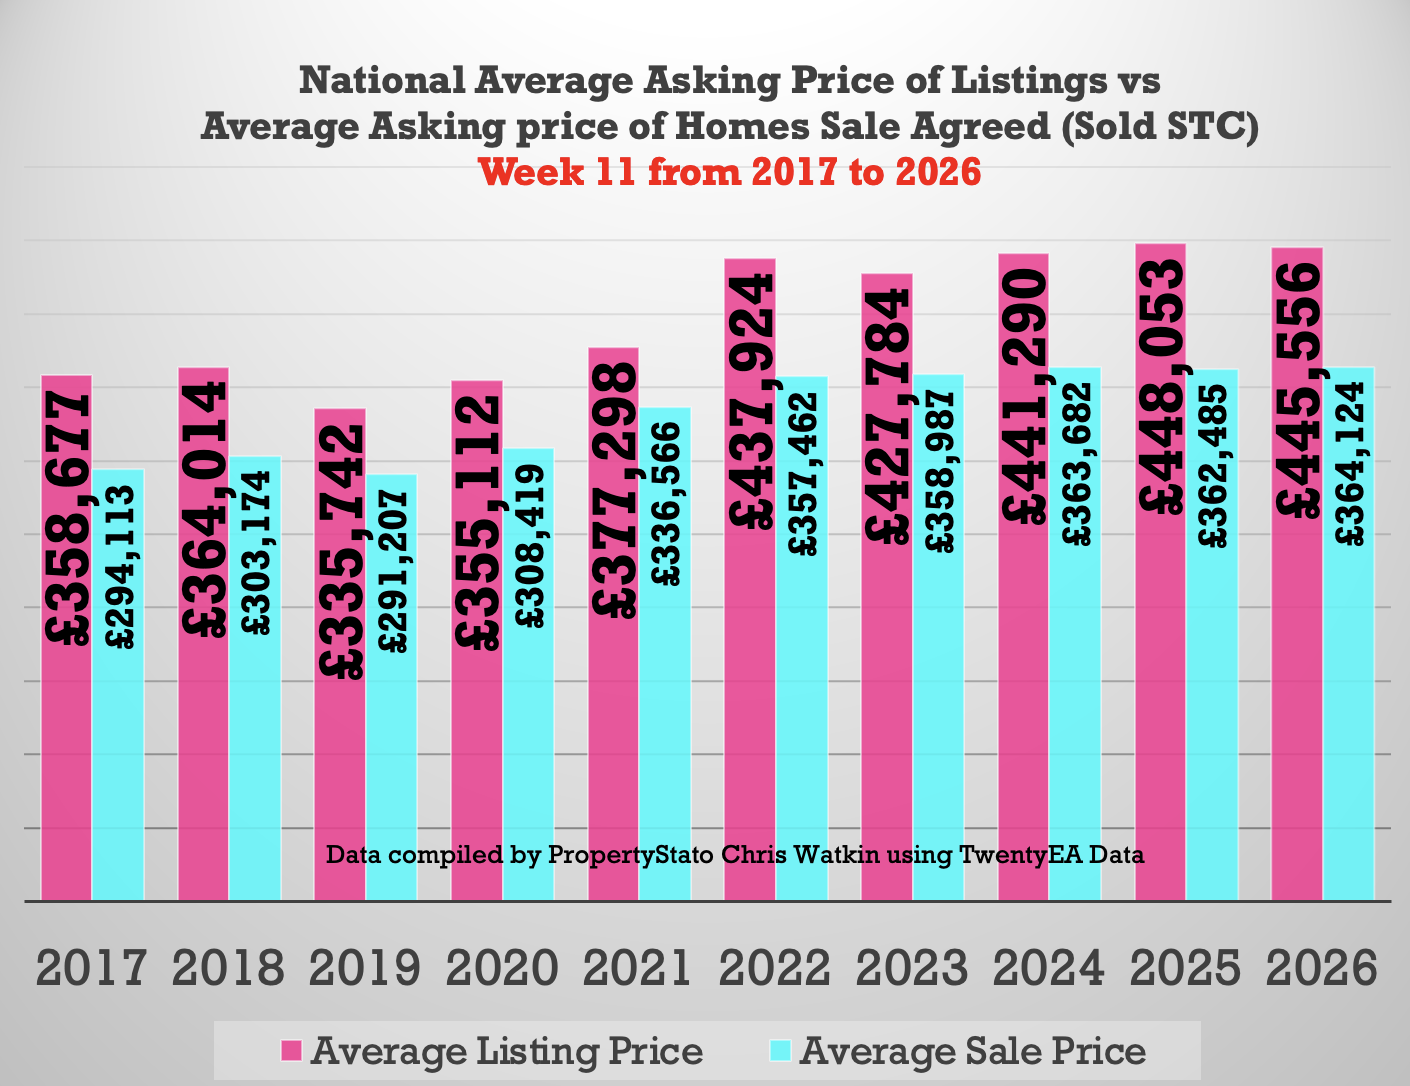
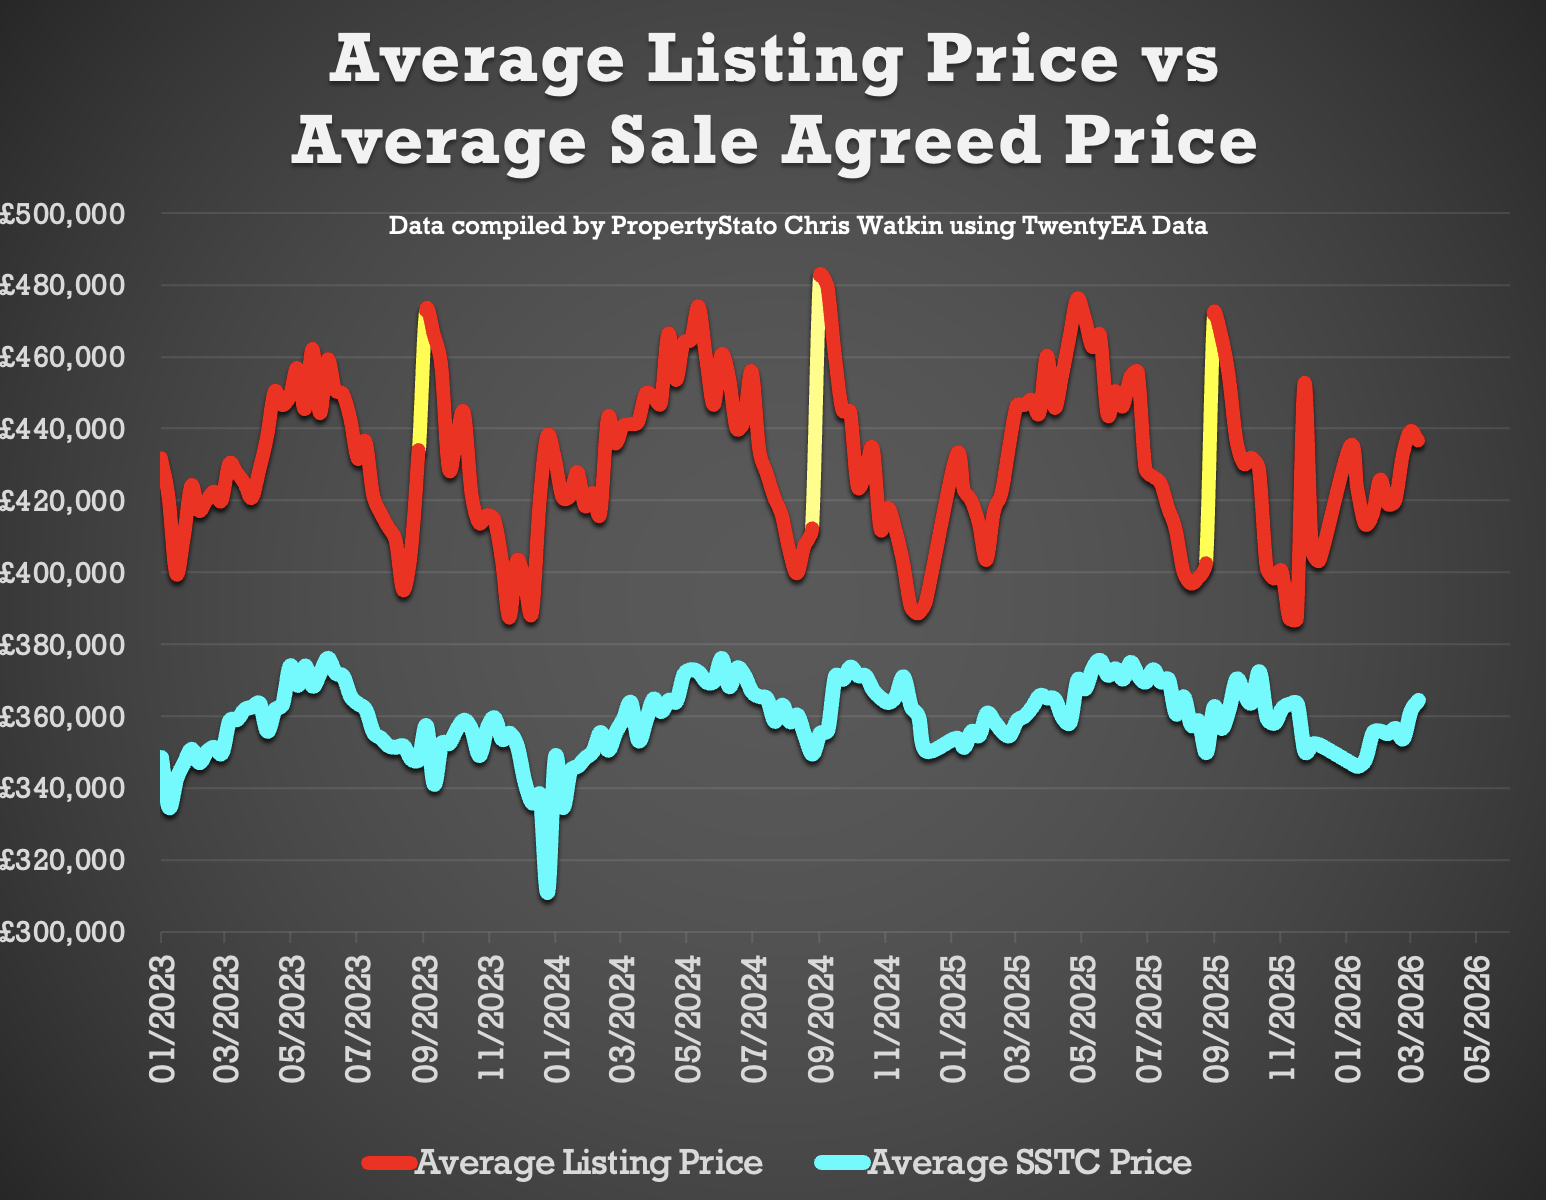
✅ Price Difference between Listings & Sales
• 22.4% difference (long term 10 year average is 16% to 17%). (£446k ave Listing Ave Asking price vs £364k Sale Agreed ave Asking price).
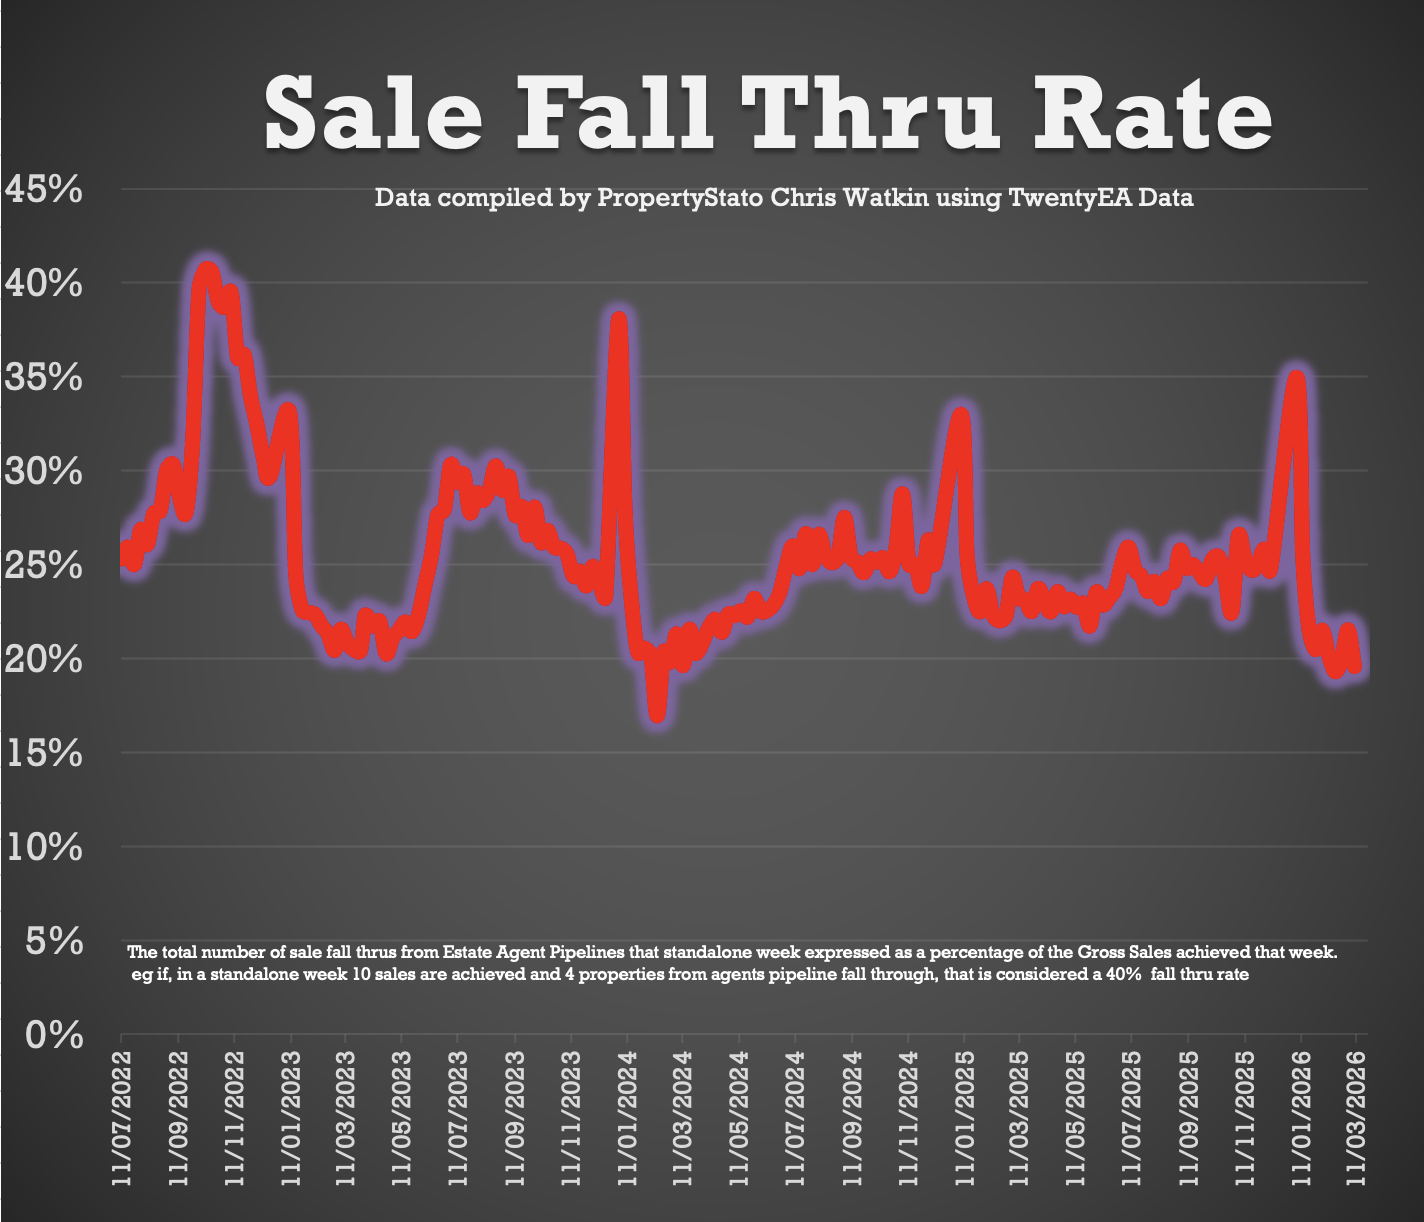
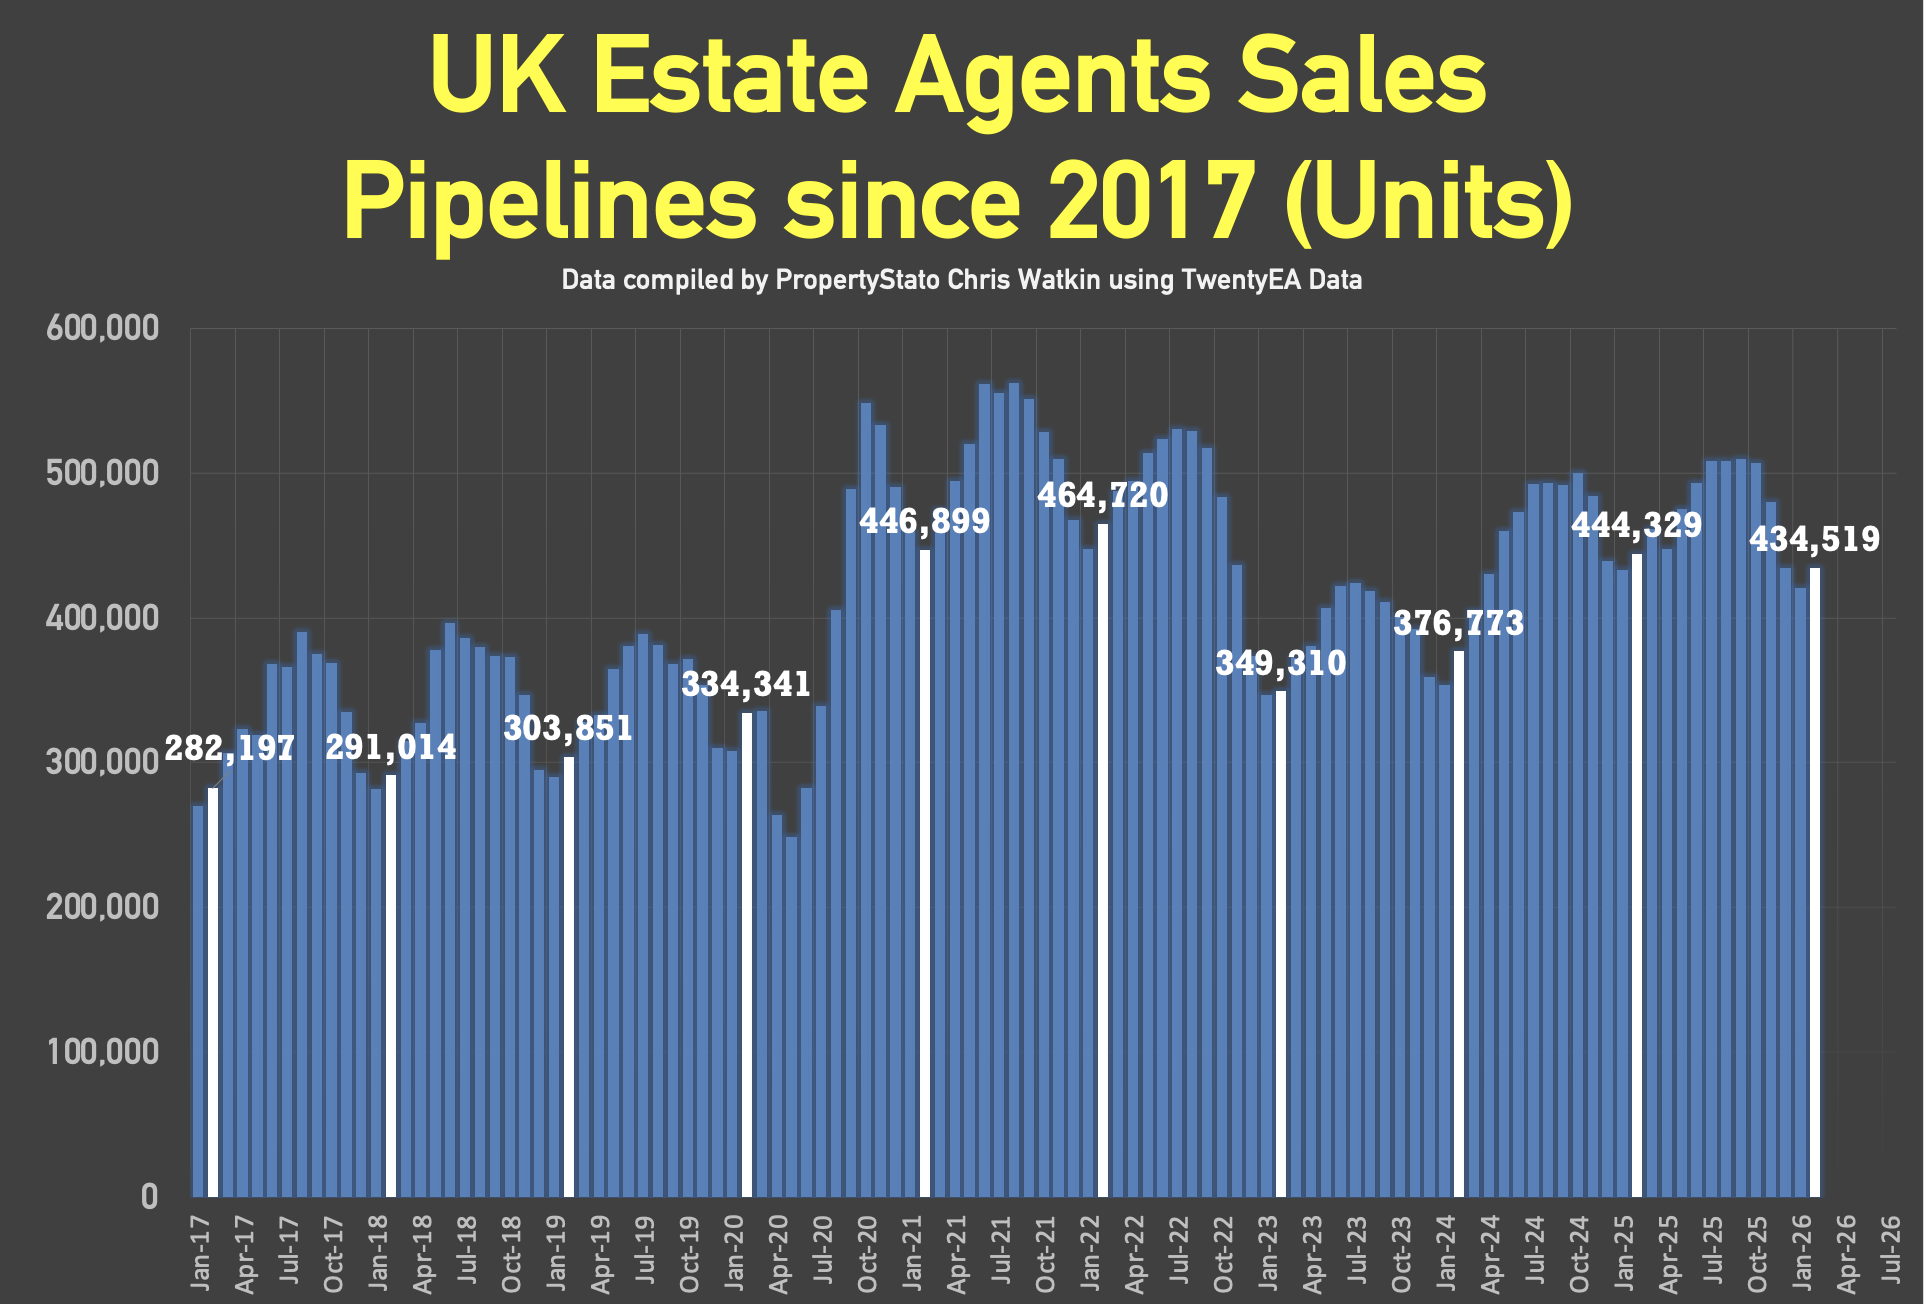
✅ Fall-Throughs
• 5,385 fall-throughs last week (pipeline of 434k home Sold STC).
• Weekly average for 2025: 6.1k.
• Fall-through rate (Fall thru expressed as a % of the Gross sales that week): 20.7%, down from 19.6% last week.
• Long-term average: 24.2% (post-Truss chaos saw levels exceed 40%).
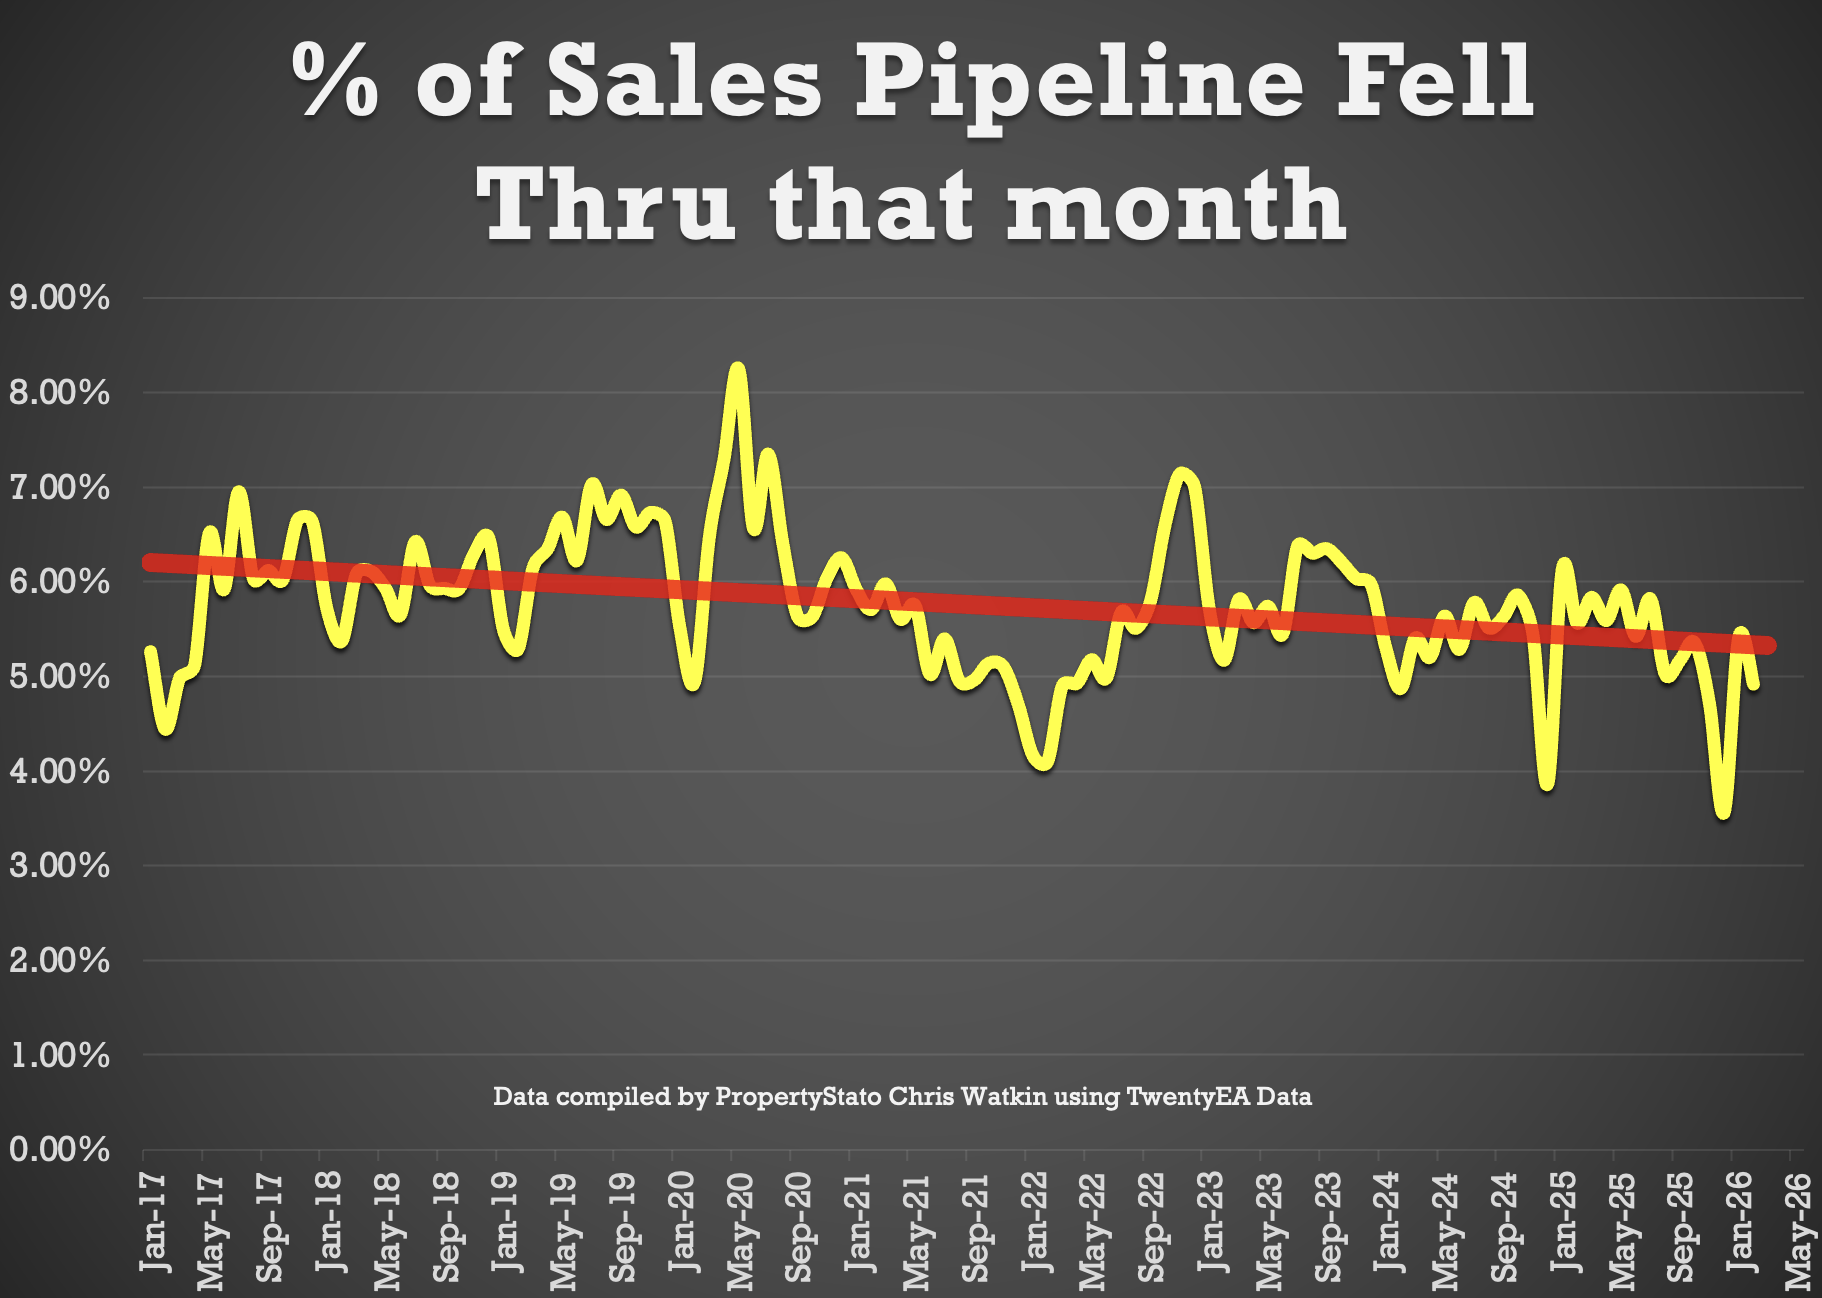
• 4.9% of all the sales agreed in Estate Agent’s Sales pipelines fell thru in February 2026. 2025 average – 5.3% & 10 year average – 5.8%).
✅ Net Sales
• 20.6k Net Sales, down slightly from 21.2k last week
• Ten-year Week 11 average: 21k.
• Weekly average for 2026: 19.3k.
• Weekly average for the whole of 2025: 18.8k.
✅ Probability of Selling (% that Exchange vs withdrawal)
• Feb ’26 Stats so far : 53.9% of homes that left agents’ books exchanged & completed in Feb. (Note this figure will change throughout the month as more Feb stats come in).
• 57.6% is the 7 year average (which includes the crazy years post lockdown 18 months).
✅ House Prices (£/sq.ft)
• February ’26 agreed sales averaged £343.36 per sq.ft. 2.3% higher than 12 months ago (£335.63) and 18.2% than 5 years ago (£290.43). The £/sqft at sale agreed matches the HM Land Registry Index with a 98% accuracy, 5 months in advance. That is why it is so important.
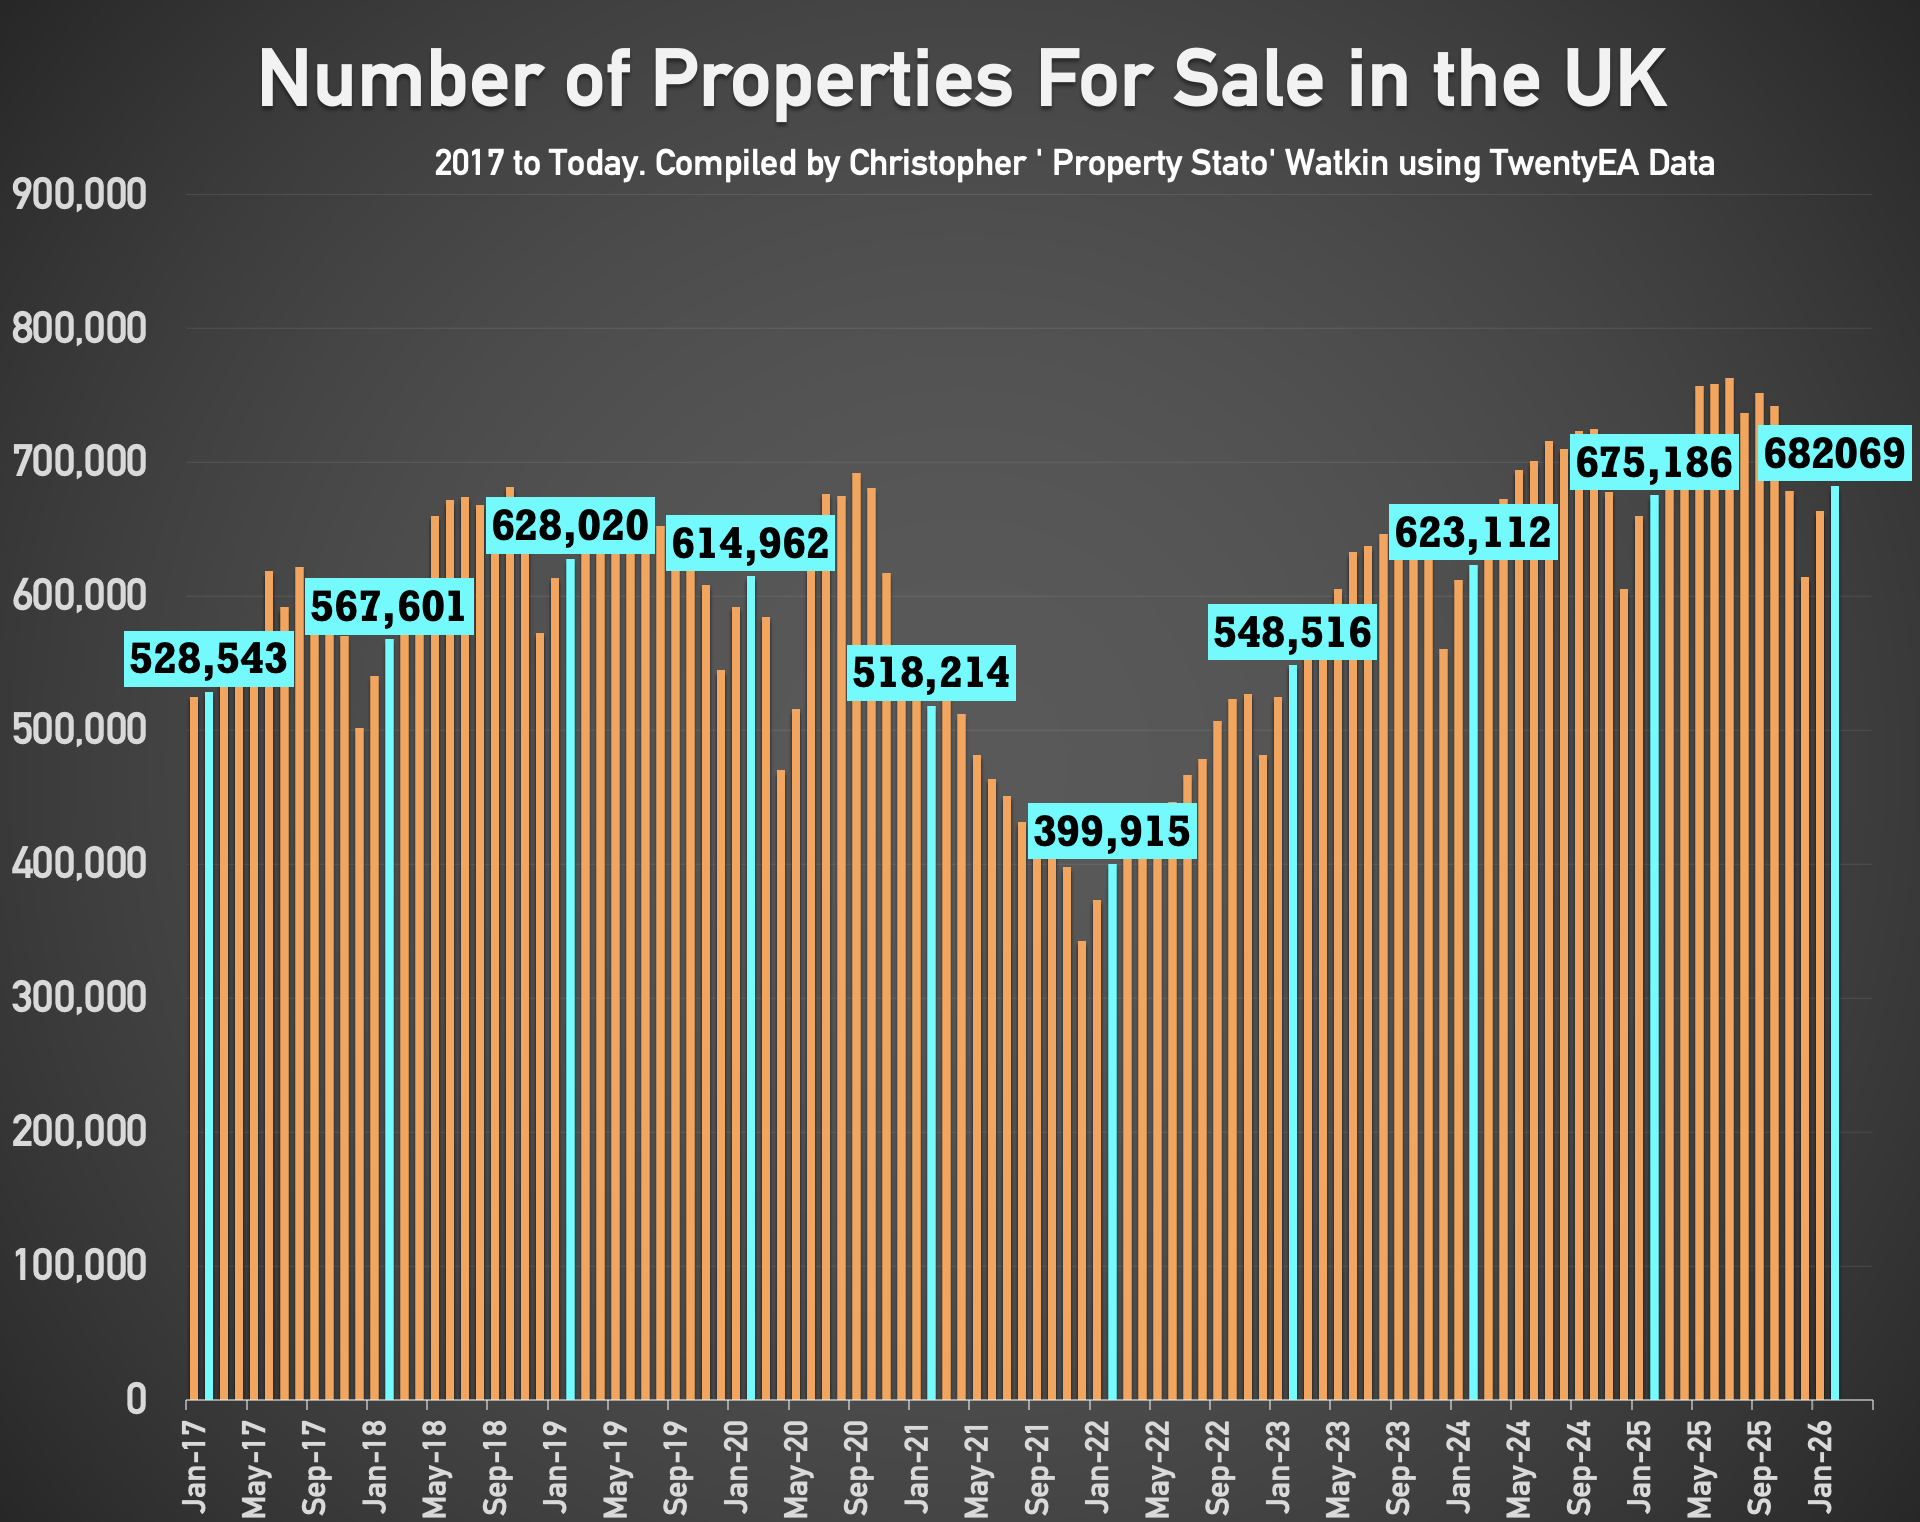
✅ Stock Levels
• 682k homes on the market on the 1st of March ’26. (675k – 1st March 25)
• 434k homes in agent’s sales pipeline on the 1st March 2026, slightly lower than 12 months ago on 1st March ’25 (444k).
✅ UK Rental Data
• Average Rent in Feb 2026 – £1,711 pcm (£1,745 in Feb 25)
• 305k UK Rental Stock available to rent in Feb 26 (310k in Feb 2025)
✅ Local Focus
Chelsea

While looking for something new, I stumbled on https://rabbit-road-inout.games/ and decided to try it. It’s way more engaging than I expected. Each round feels alive, and the game mechanics actually let you make small strategic choices. I liked that even the bonus features make each session exciting. For a casual online game, this one really stands out and kept me coming back.
You must be logged in to like or dislike this comments.
Click to login
Don't have an account? Click here to register