

 In this week’s UK Property Market Stats show, the first segment reviews the UK housing market for the week ending Sunday 1 March 2026 (week 8), with guest Verona Frankish.
The second part focuses on analysing estate and letting agent performance in Stevenage, using data to identify which agencies are achieving the strongest results locally.
The discussion also looks at how agents can use performance data to demonstrate their value to vendors, particularly in markets where competitors are overvaluing properties or competing on lower fees.
Headlines:
The headlines for the 8th week of the 2026 UK Property Market (week ending Sun 1st March 2026)
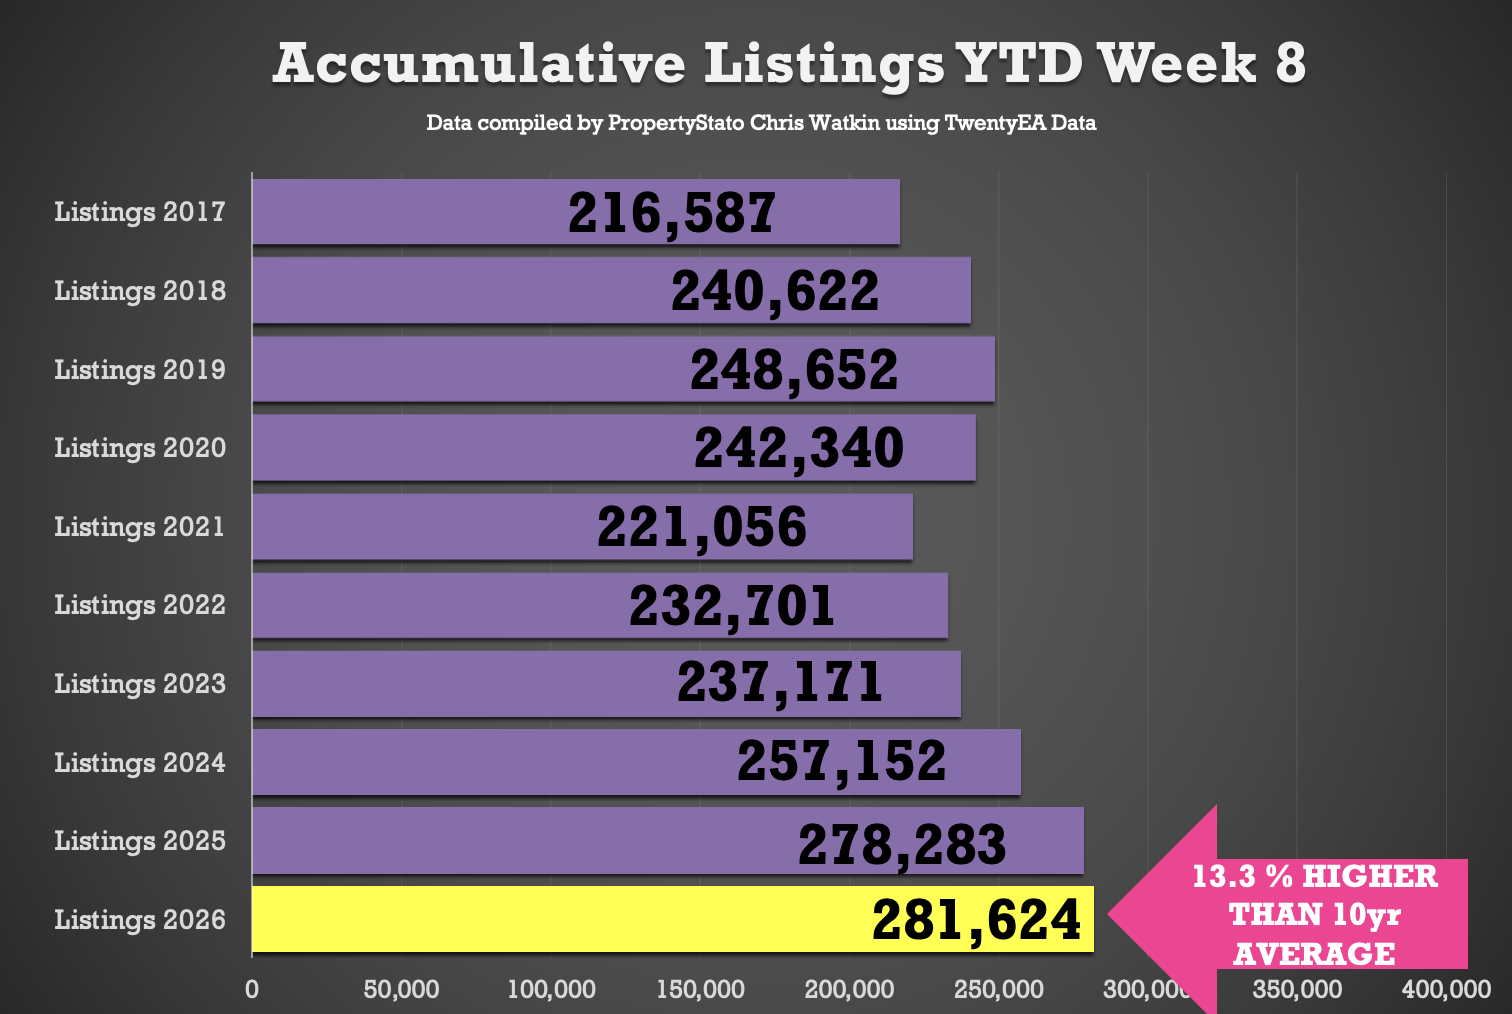
🟩 Listings YTD
282k new properties have come onto the market YTD , 1% ahead of 2025, 9% above 2024, and 20% higher than the 2017–19 average.
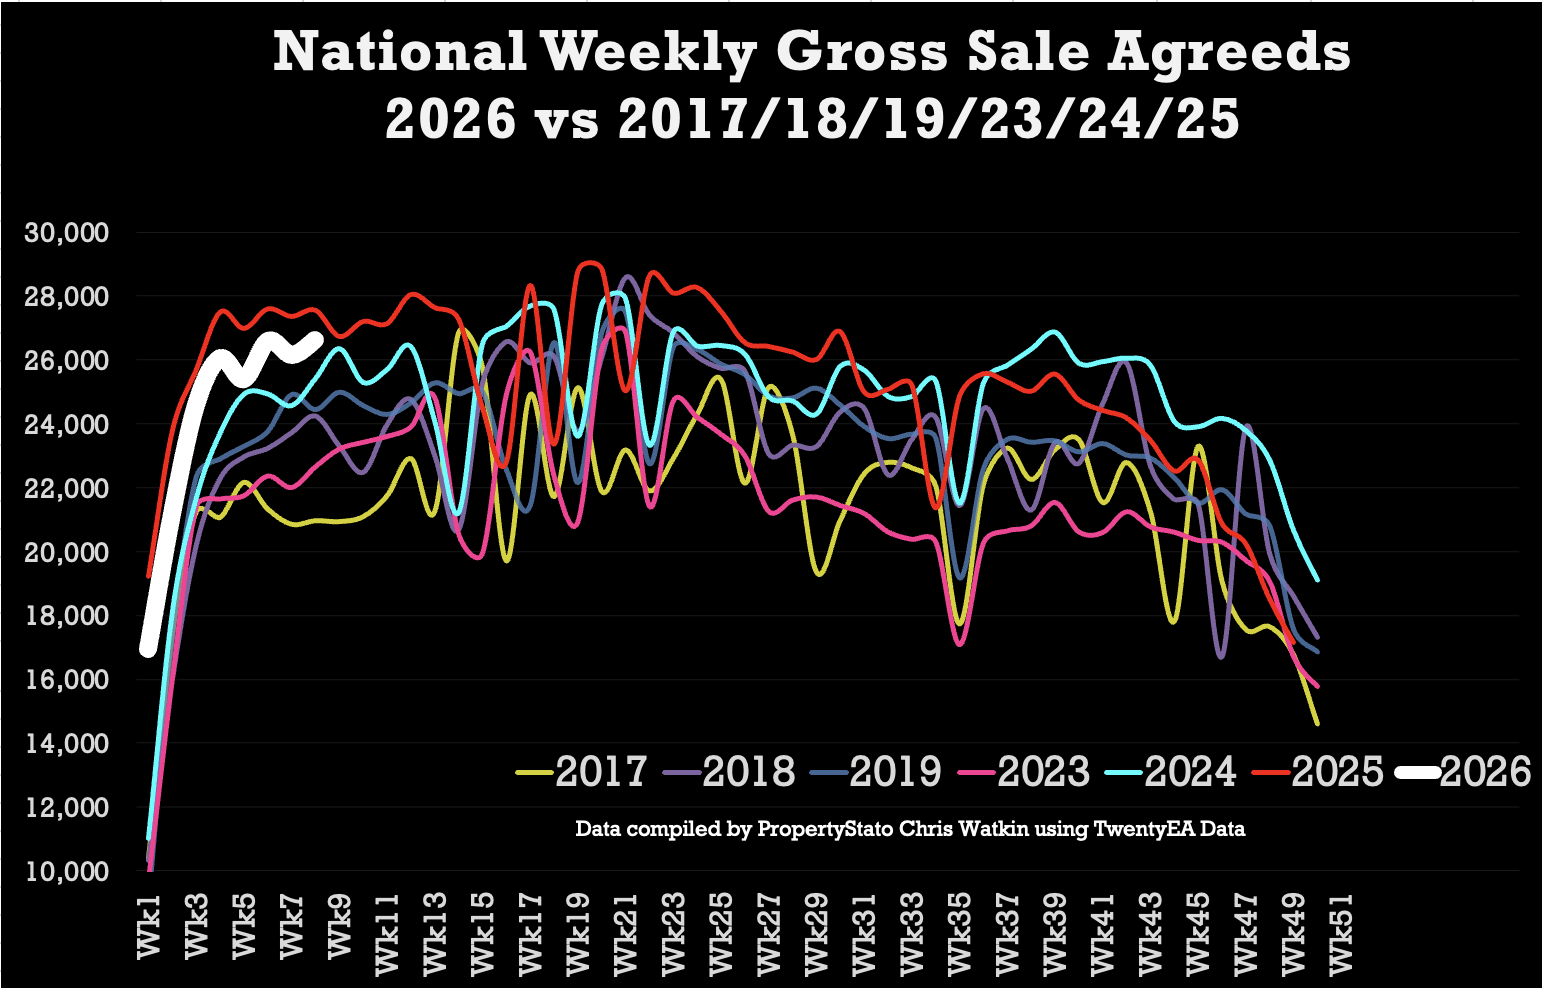
🟩 Gross Sales YTD
194k UK homes sold STC YTD , 6% lower than 2025, 11% higher than 2024 and 19% above pre Covid norms.
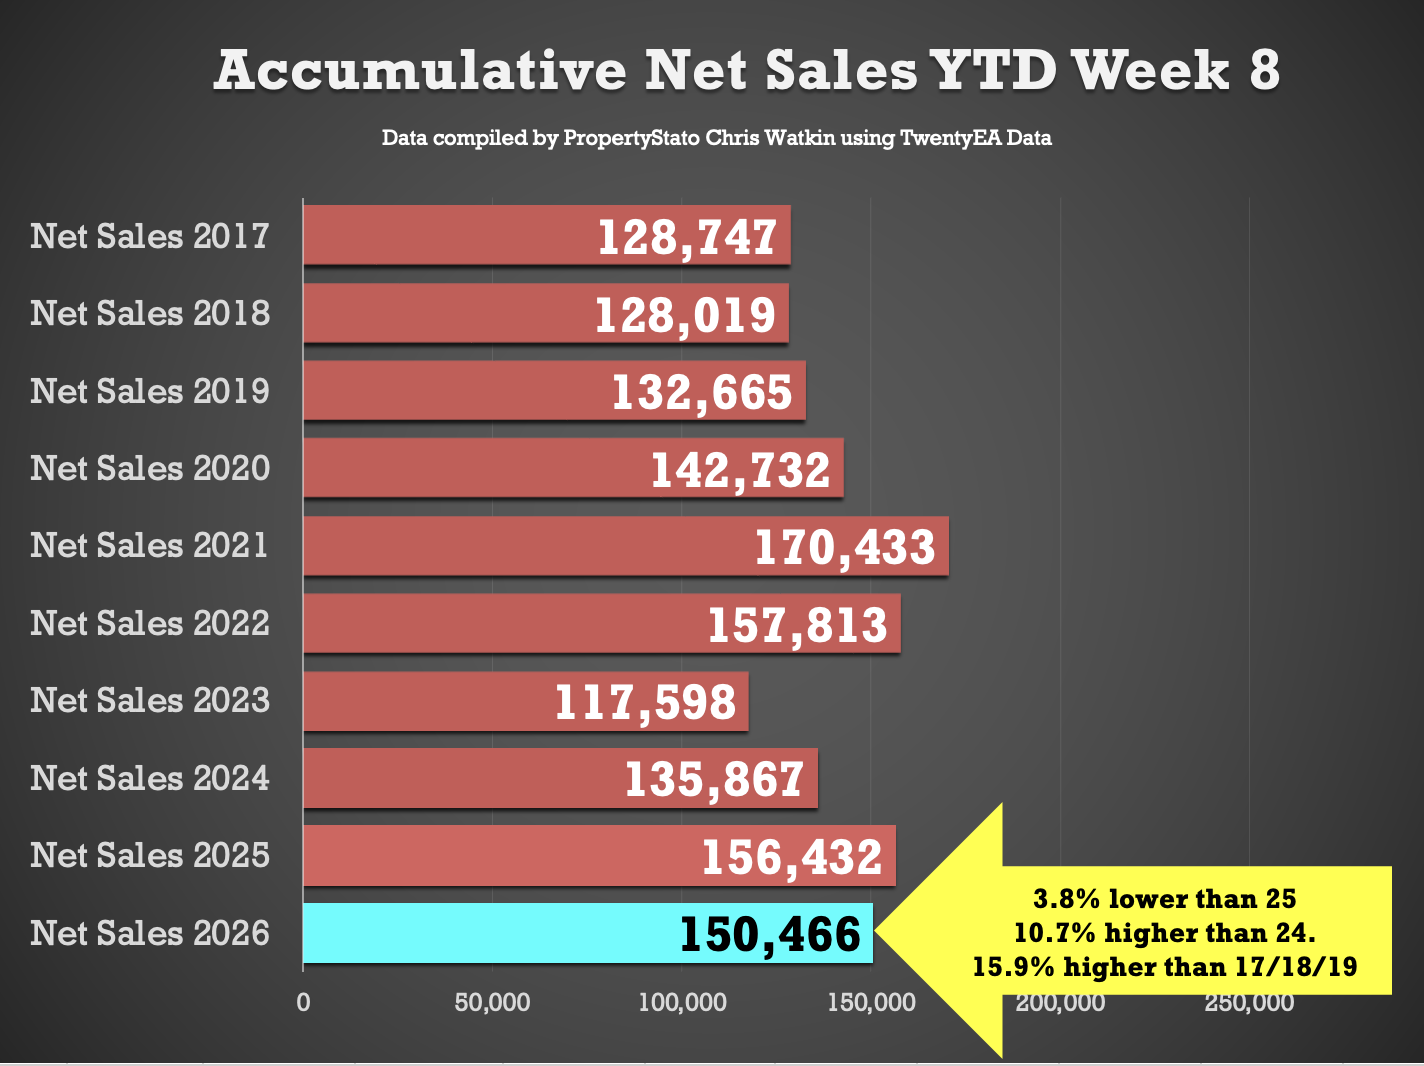
🟩 Net Sales YTD
150k UK net home sales YTD (Net Sales being Gross sales less Fall Thrus). 4% lower than 2025, 11% ahead of 2024, 28% ahead of 2023 and 16% above the 2017–19 average.
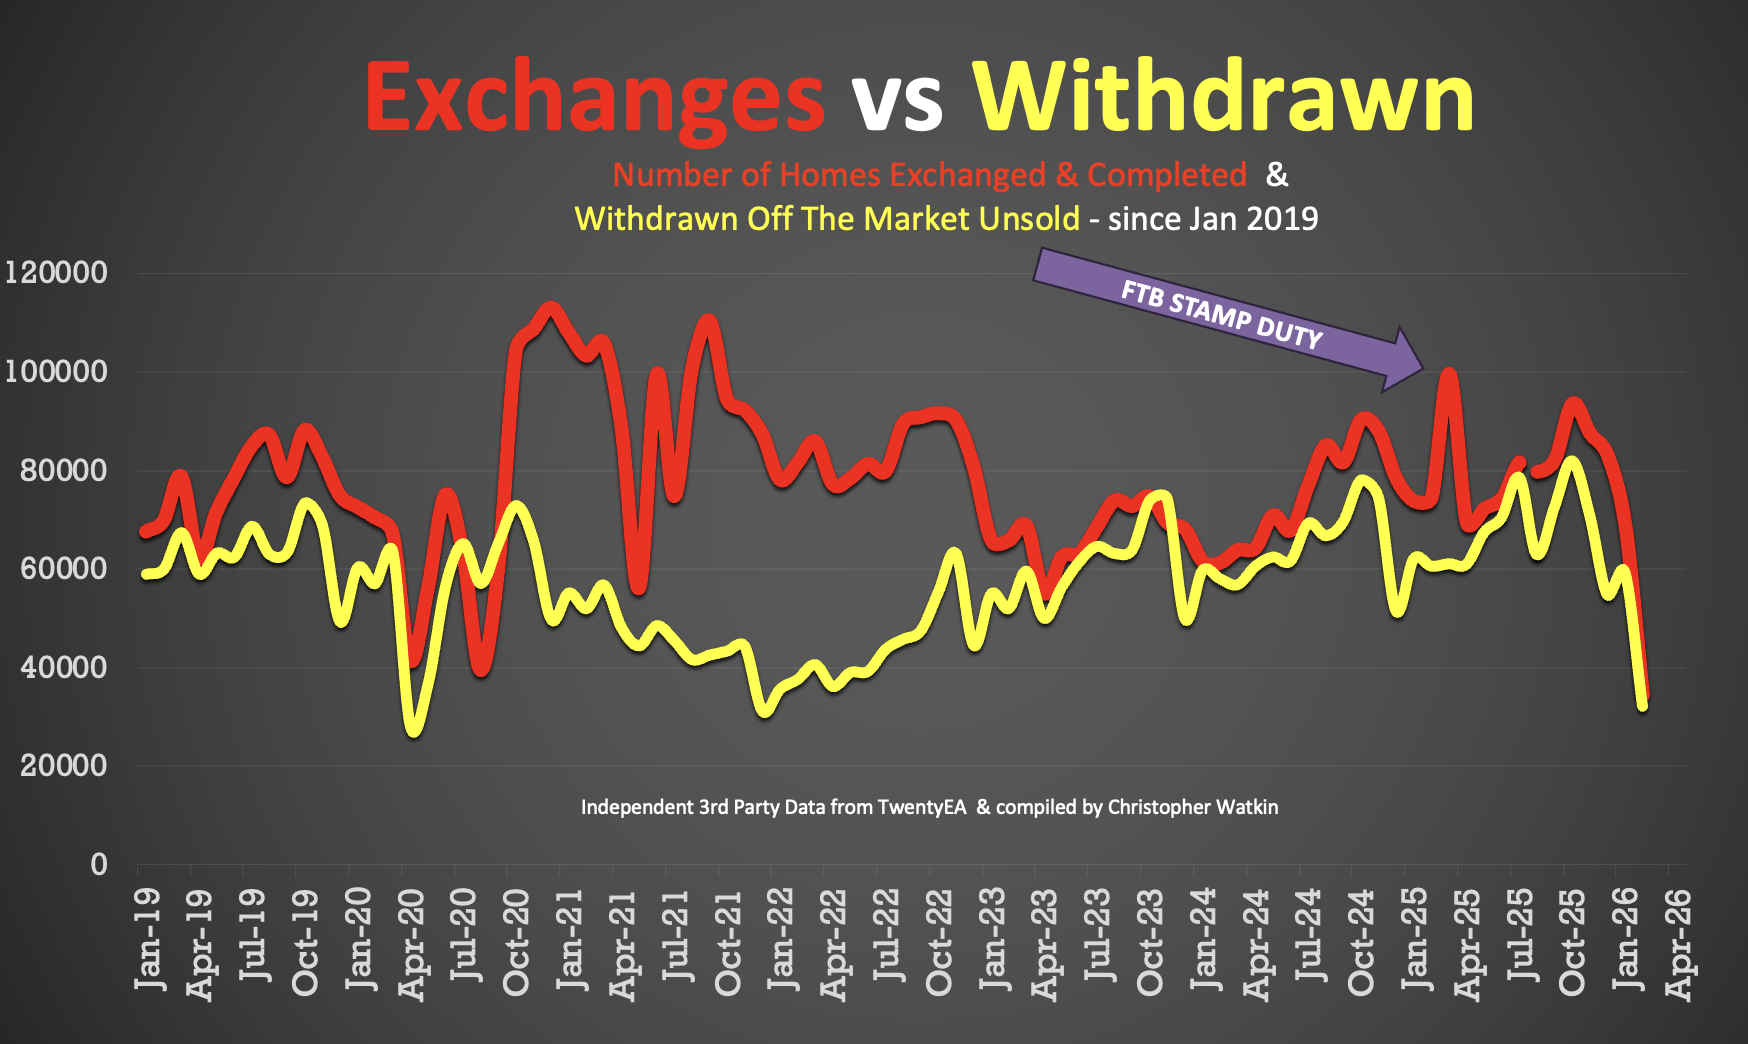
🟥 Overvaluing
Some 48% of the homes that left UK estate agents books in February were withdrawn unsold. Main cause – blatant overvaluing supported by long sole agency agreements of 20+ weeks.
Detailed Breakdown:
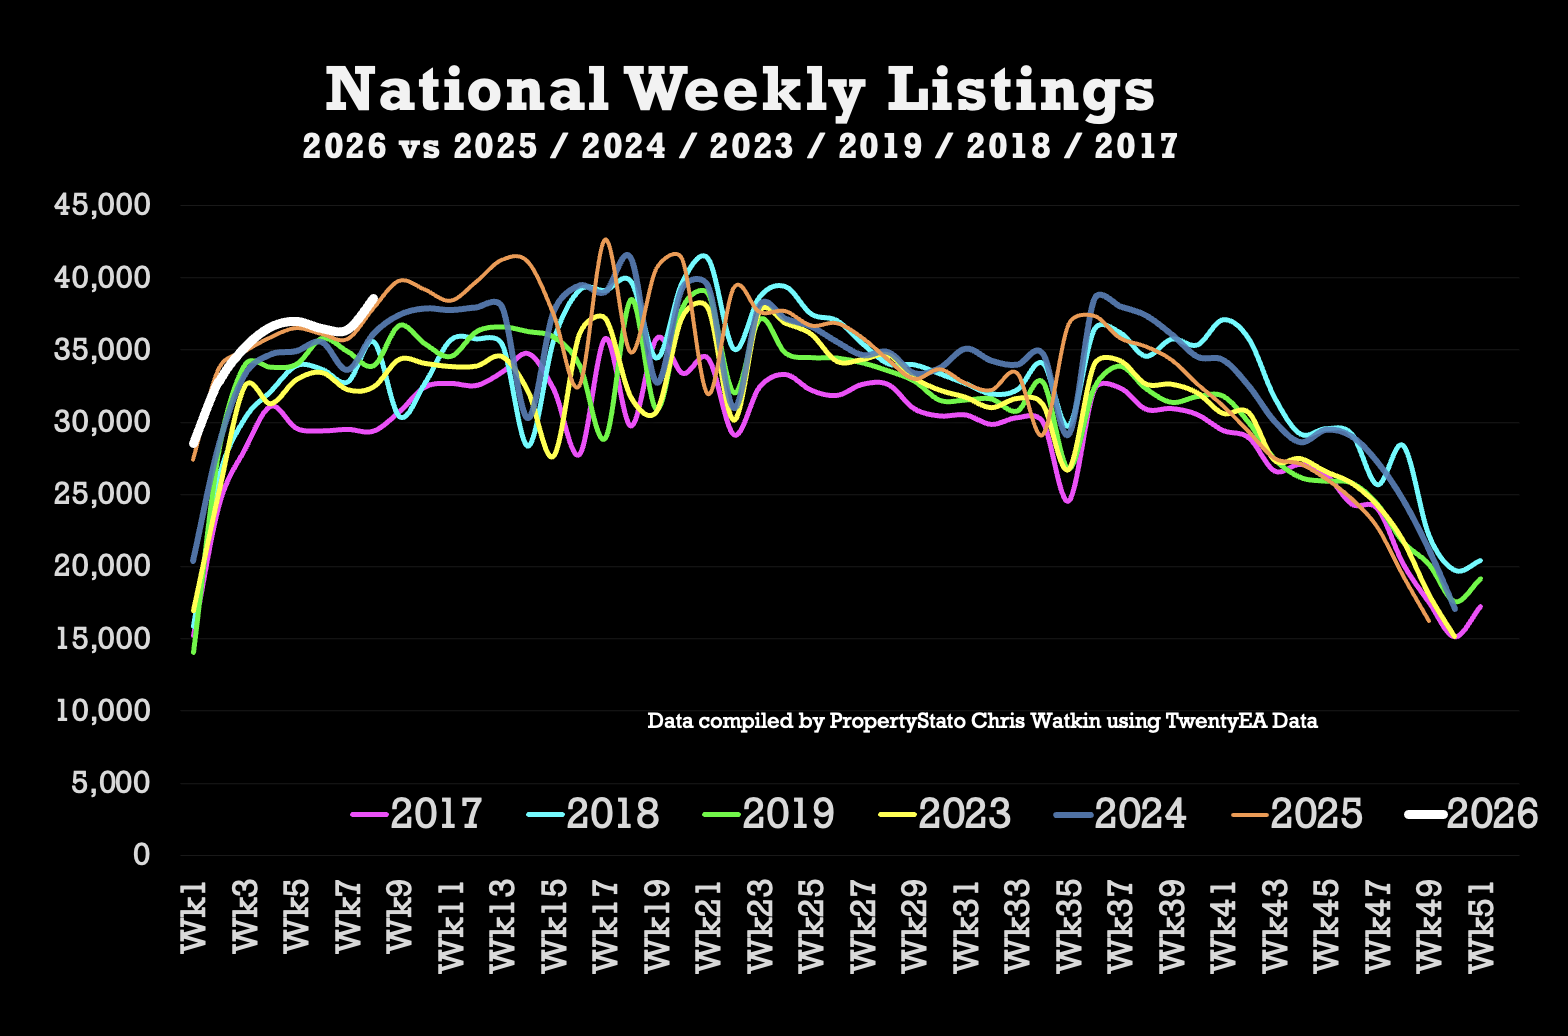
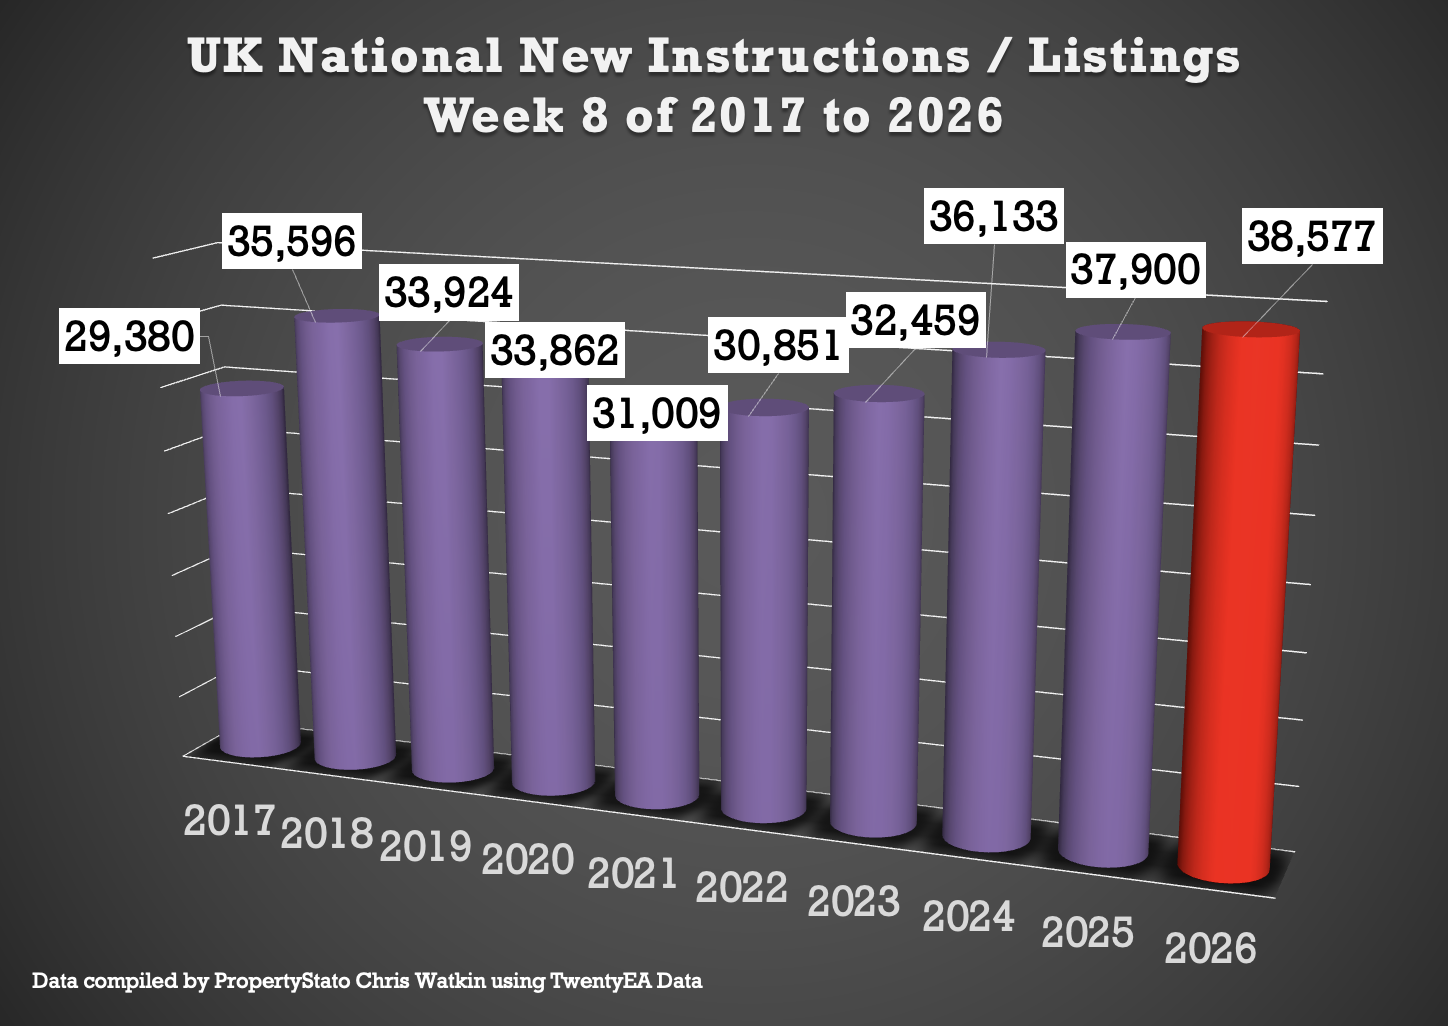
✅ New Listings
• 36.8k new properties came onto market this week, slightly up from 36.4k last week.
• 2025 weekly average: 30.6k.
• 10-year week 8 average : 34k.
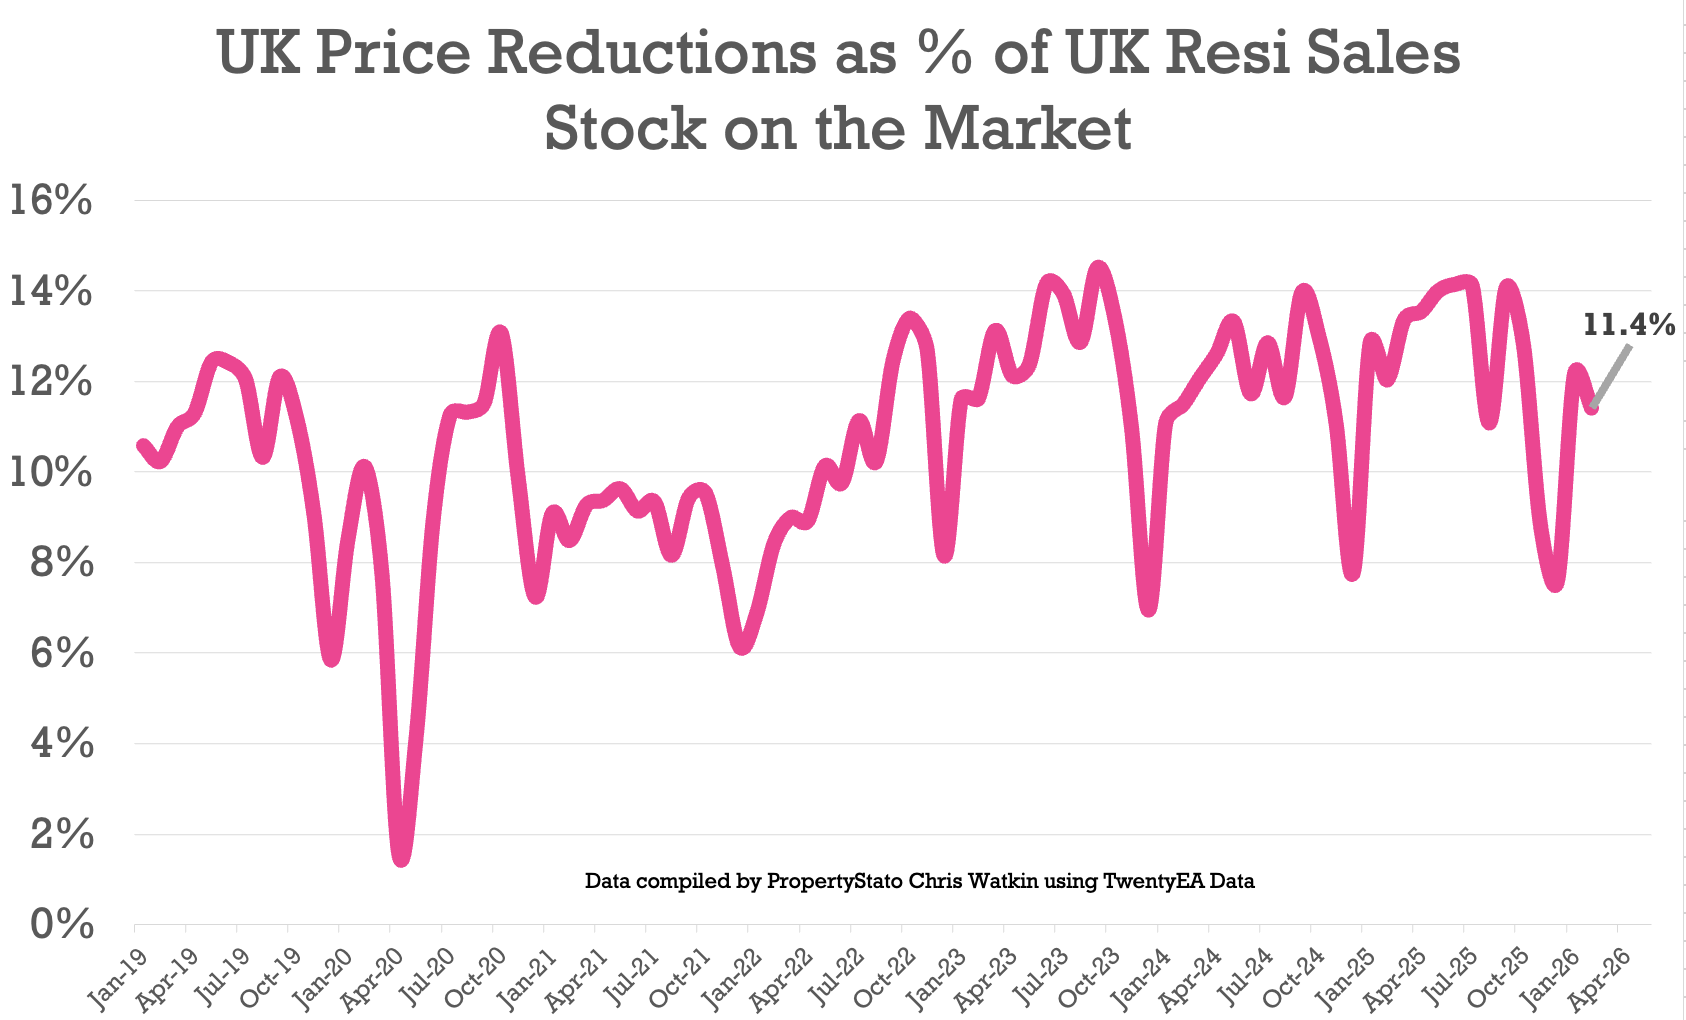
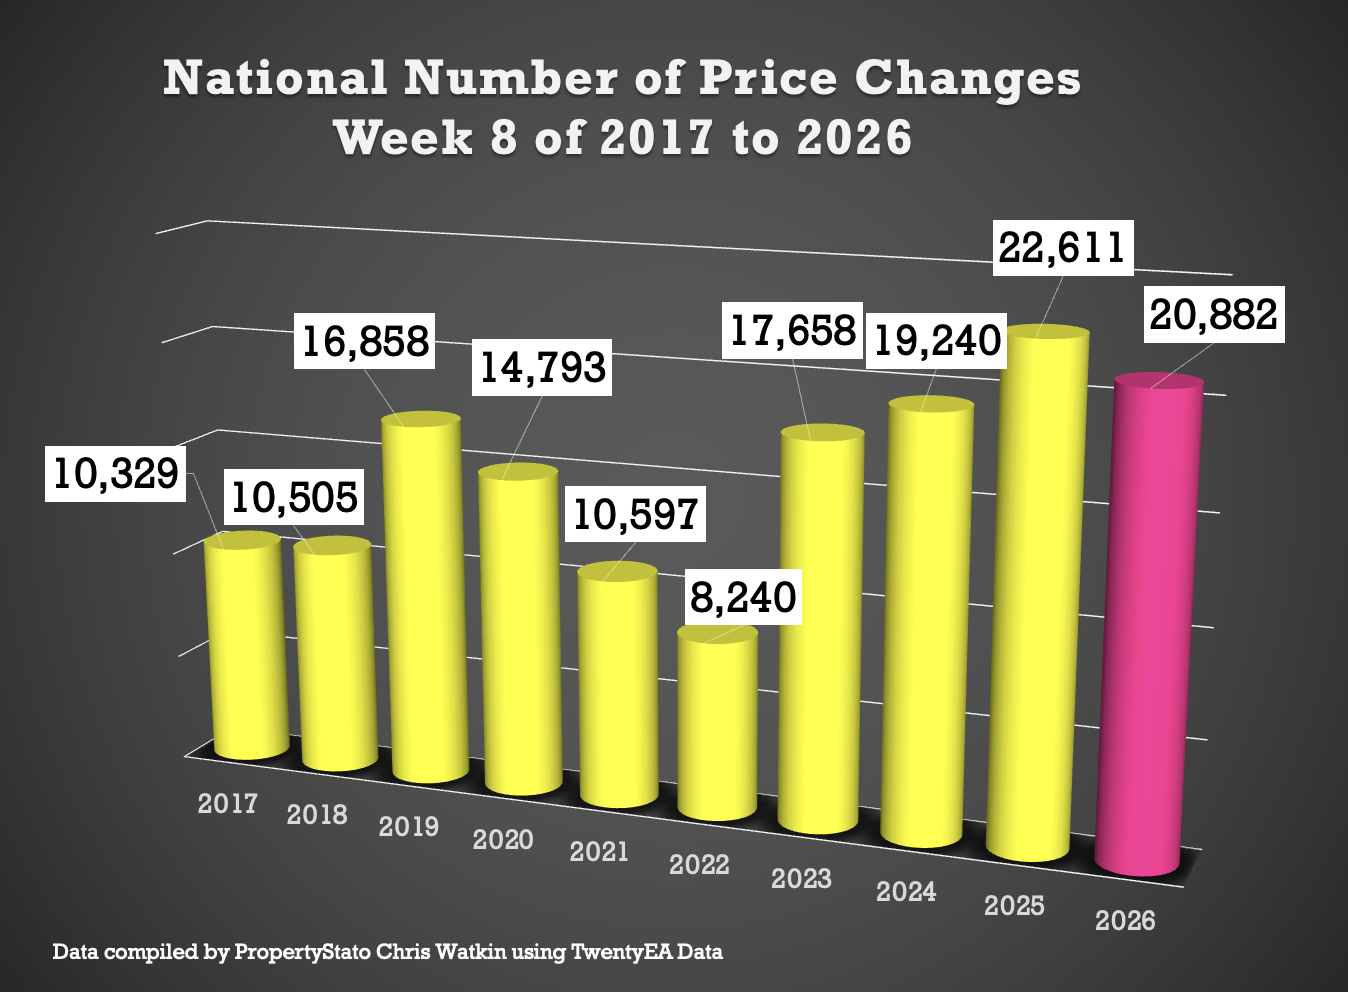
✅ Price Reductions
• 20.9k reductions this week, up from 19.8k last week
• 11.4% of resi homes for sale were reduced in February. Feb 25 – 12%. Feb 24 – 11.5%
• 2025 average was 12.8%, versus the 6-year long-term average of 10.7%.
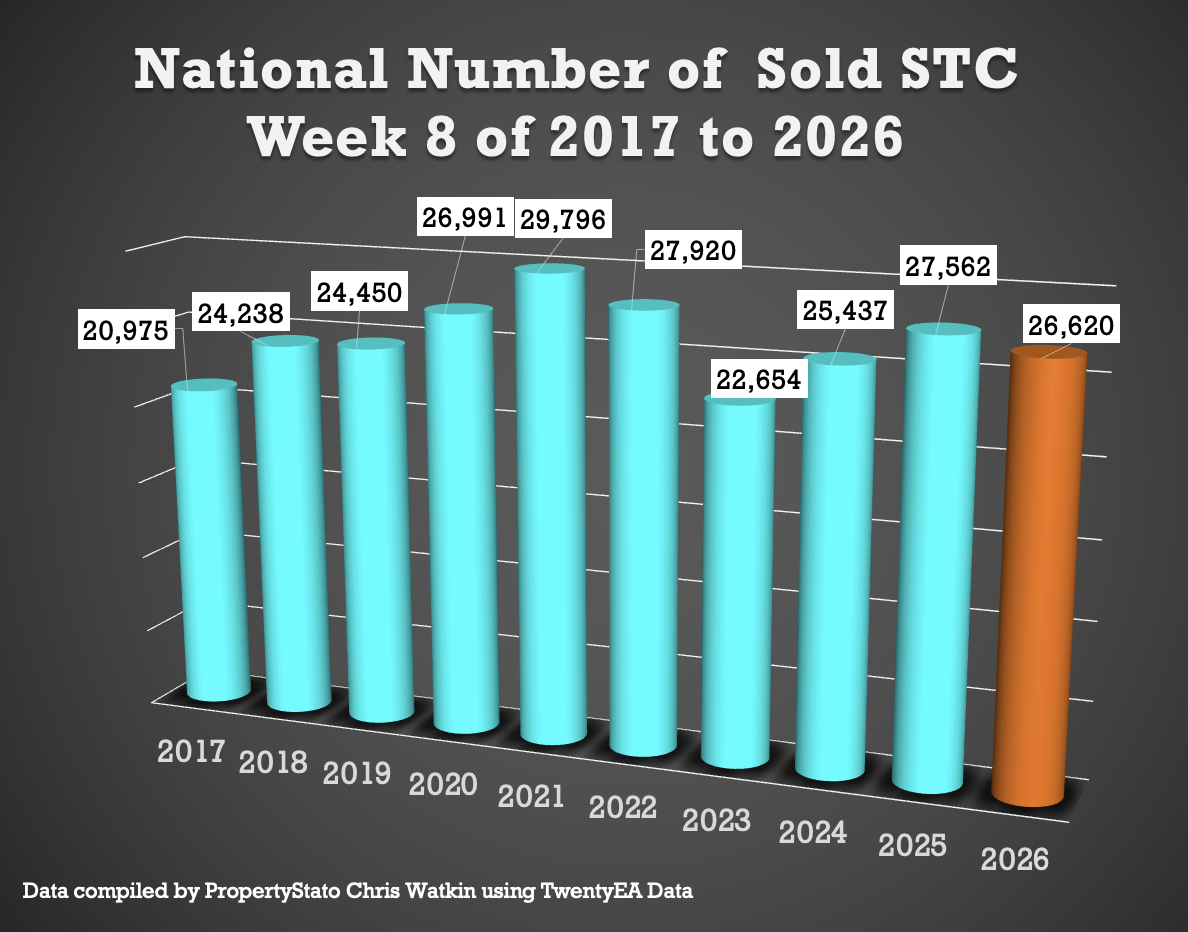
✅ Sales Agreed (UK)
• 26.6k homes sold stc this week 8, up slightly from 26.2k last week.
• Week 8 average (for last 10 years) : 25.7k
• 2026 weekly average : 24.2k.
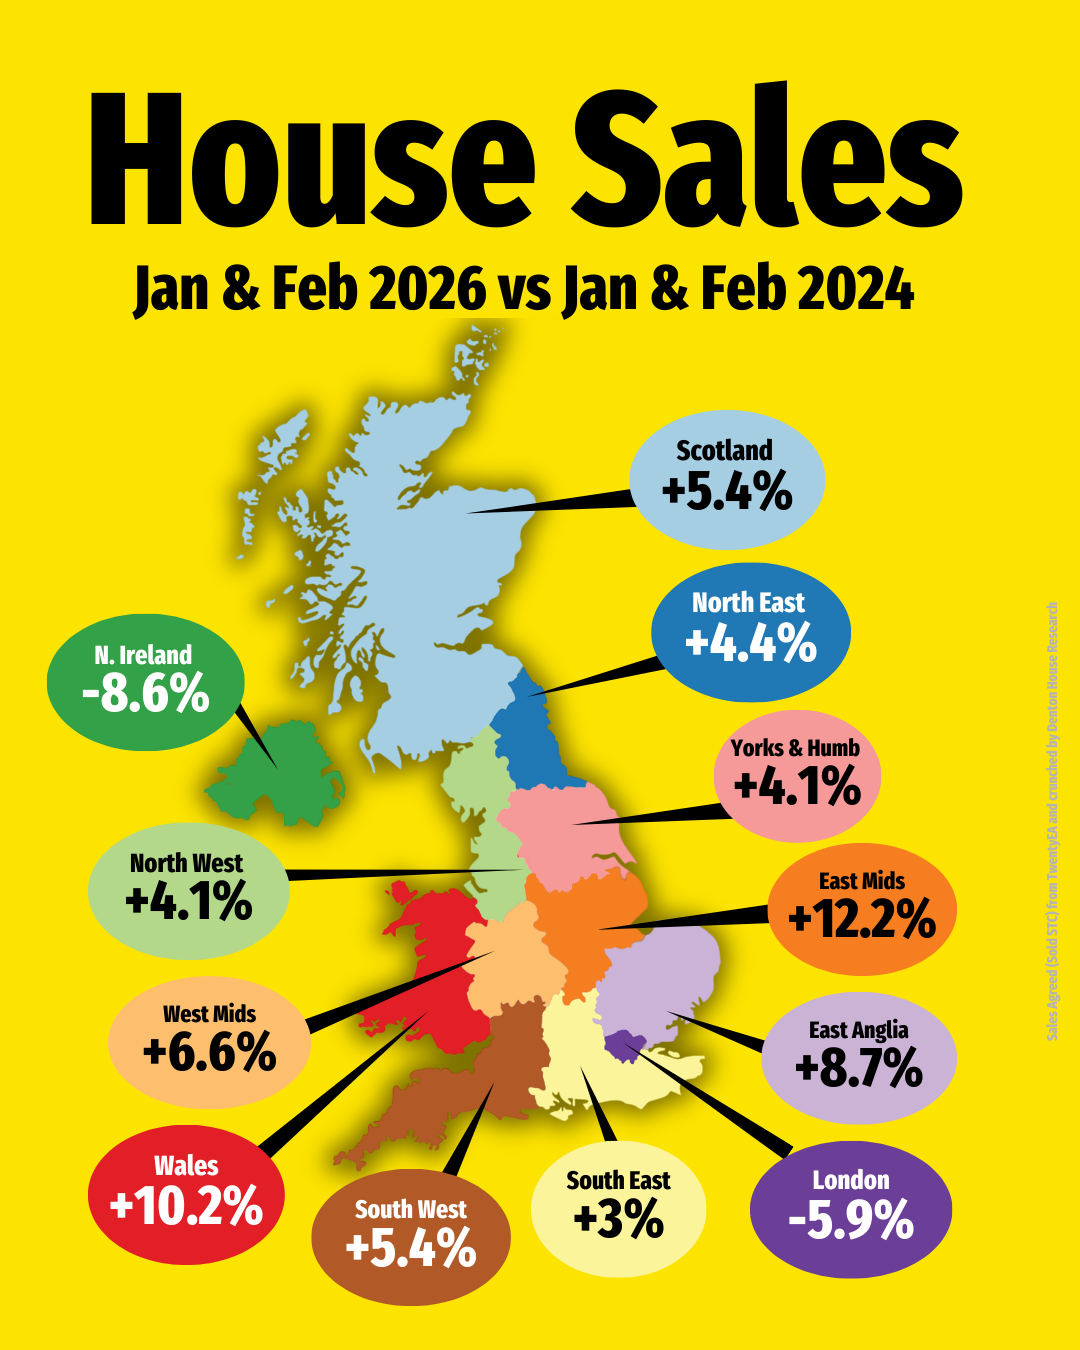
✅ Sales Agreed (Regional)
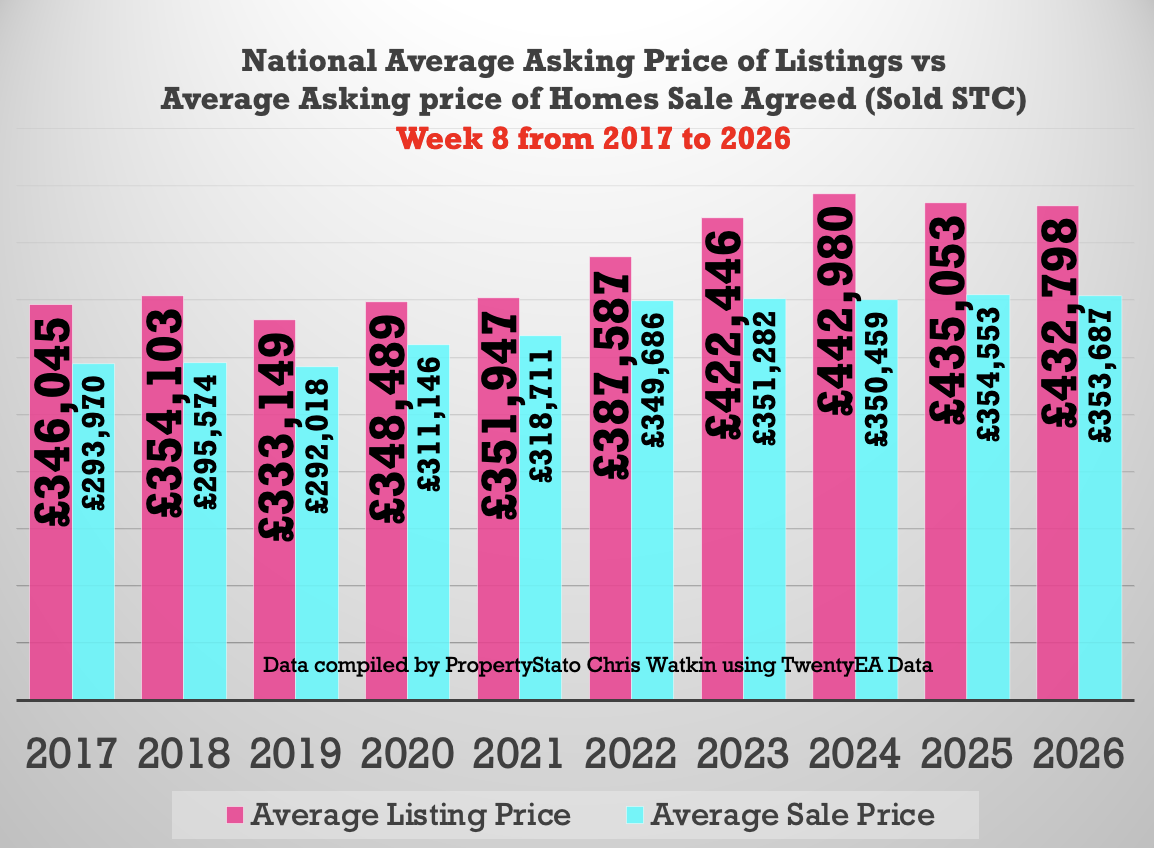
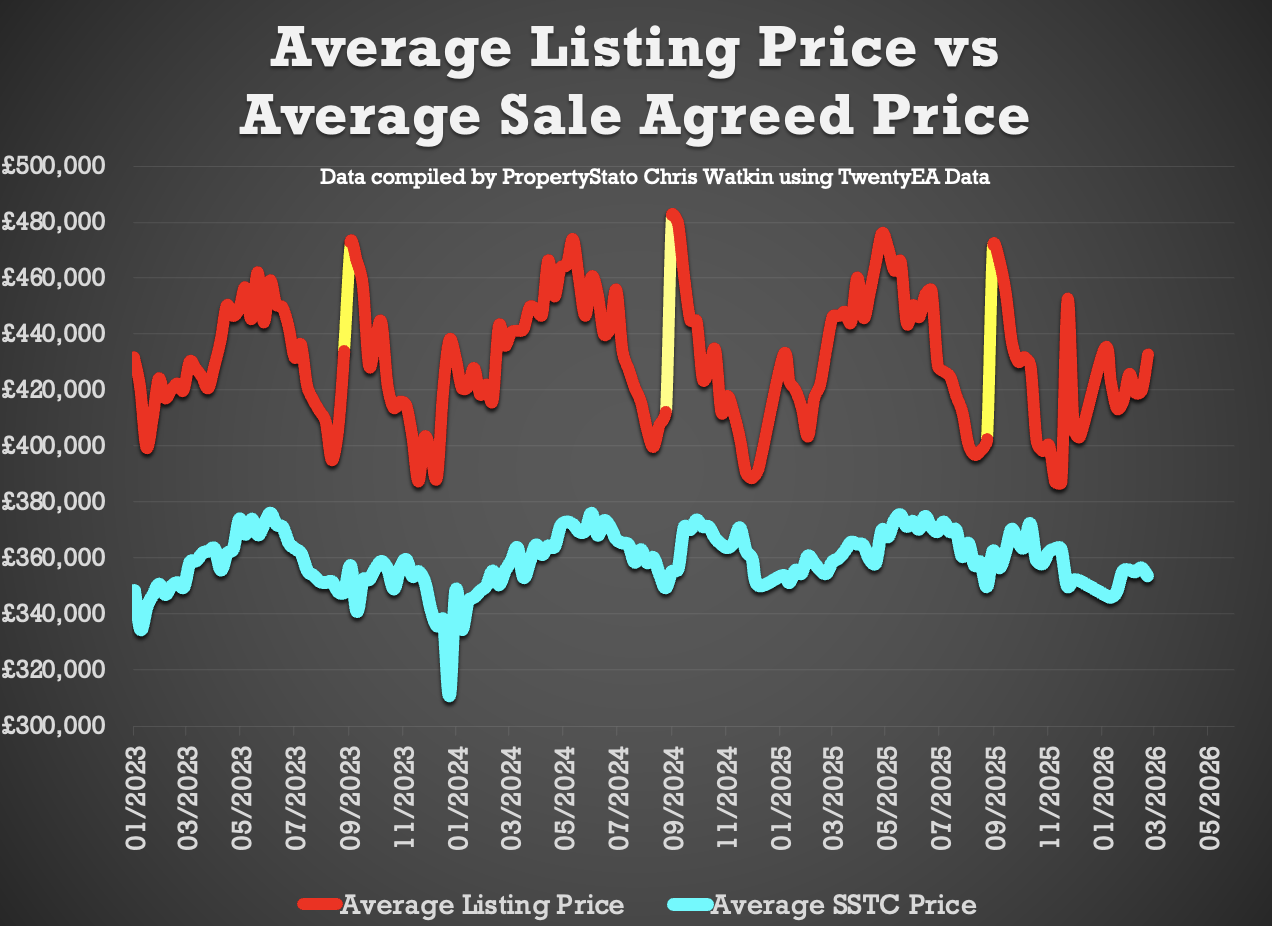
✅ Price Difference between Listings & Sales
• 22.4% difference (long term 10 year average is 16% to 17%). (£433k ave Listing Ave Asking price vs £354k Sale Agreed ave Asking price).
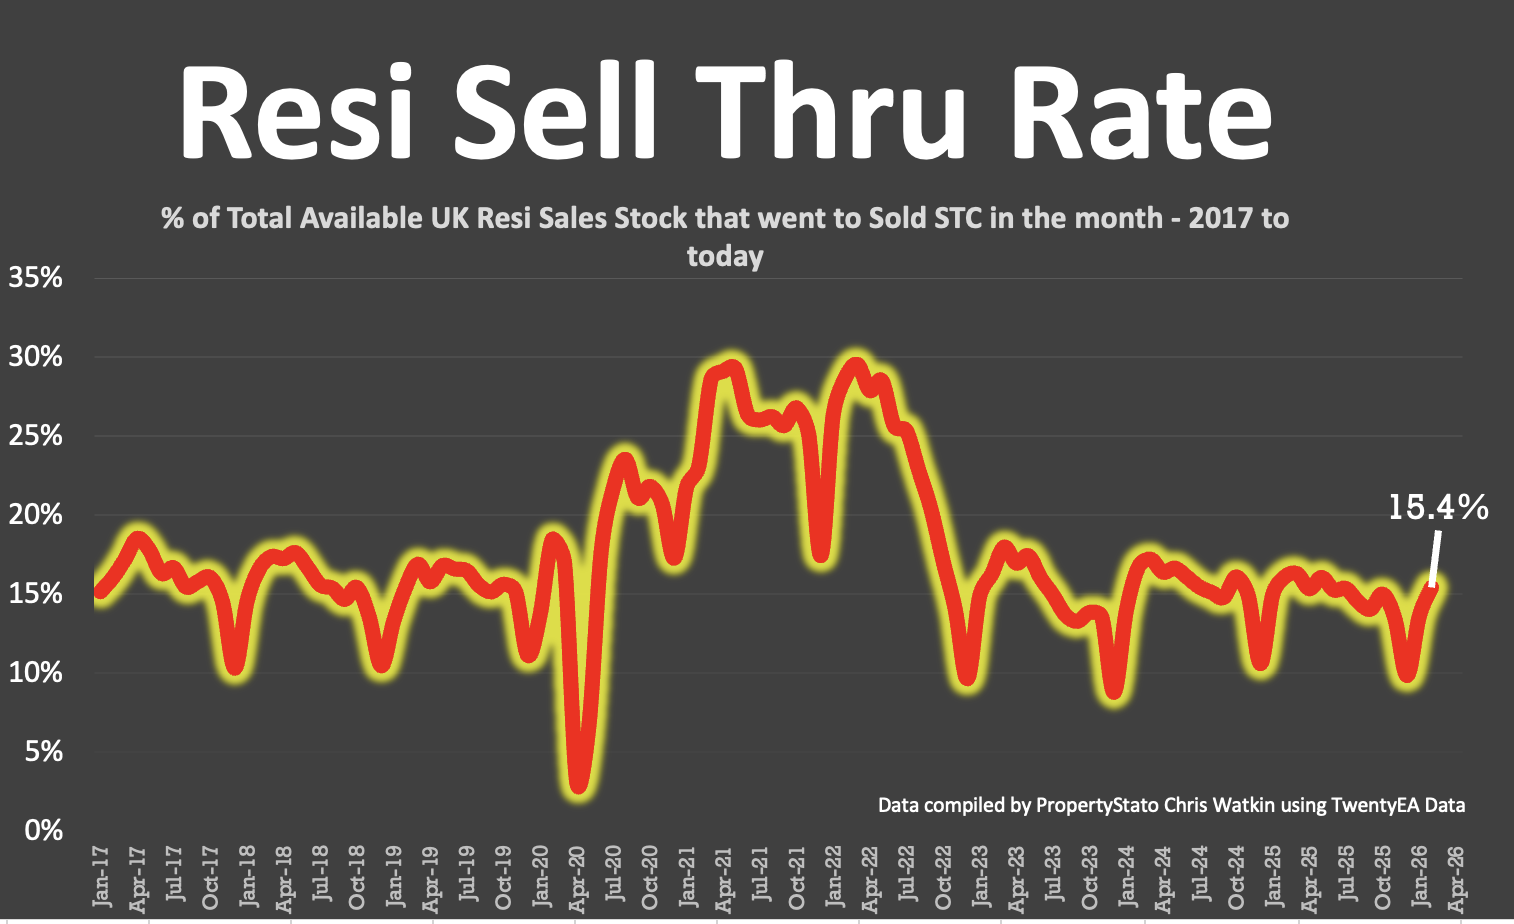
✅ Sell-Through Rate
• 15.4% of homes on agents’ books went SSTC in February ’26. (Feb ’25 – 16.1% / Feb ’24 – 16.7%)
• Pre-Covid average: 15.5%.
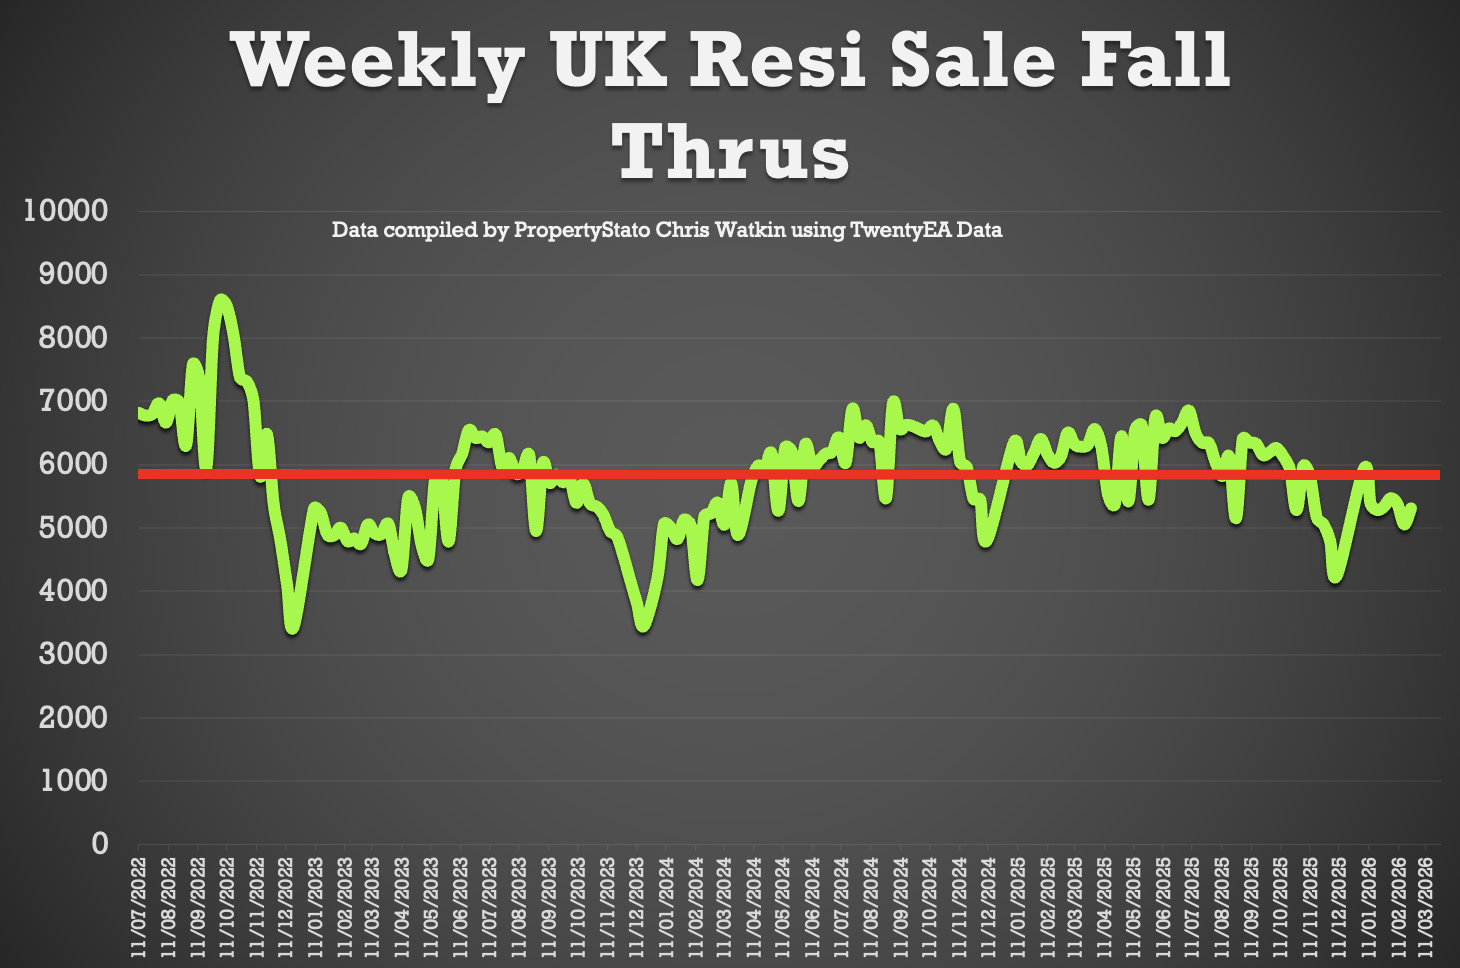
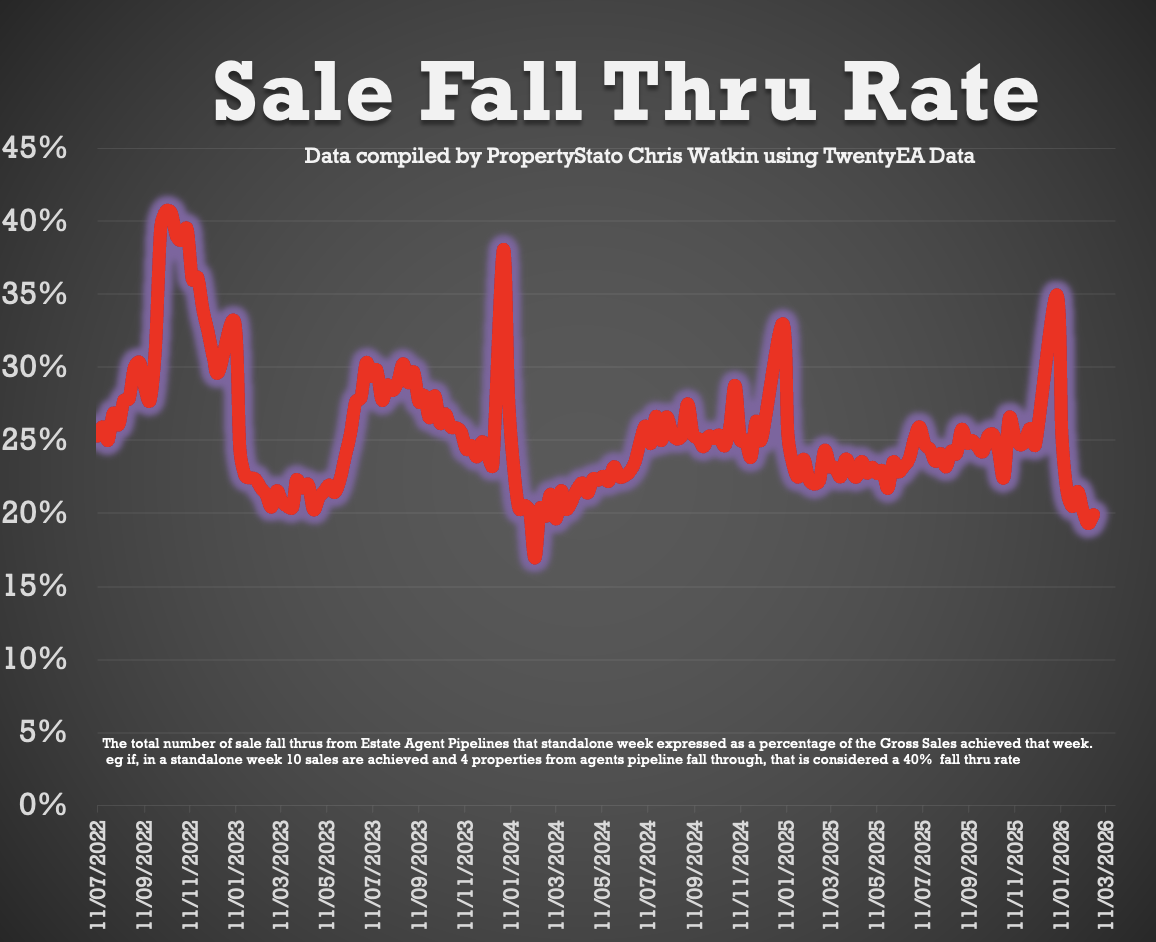
✅ Fall-Throughs
• 5,306 fall-throughs last week (pipeline of 422k home Sold STC).
• Weekly average for 2025: 6,100.
• Fall-through rate (Fall thru expressed as a % of the Gross sales that week): 19.9%, down from 20.2% last week.
• Long-term average: 24.2% (post-Truss chaos saw levels exceed 40%).
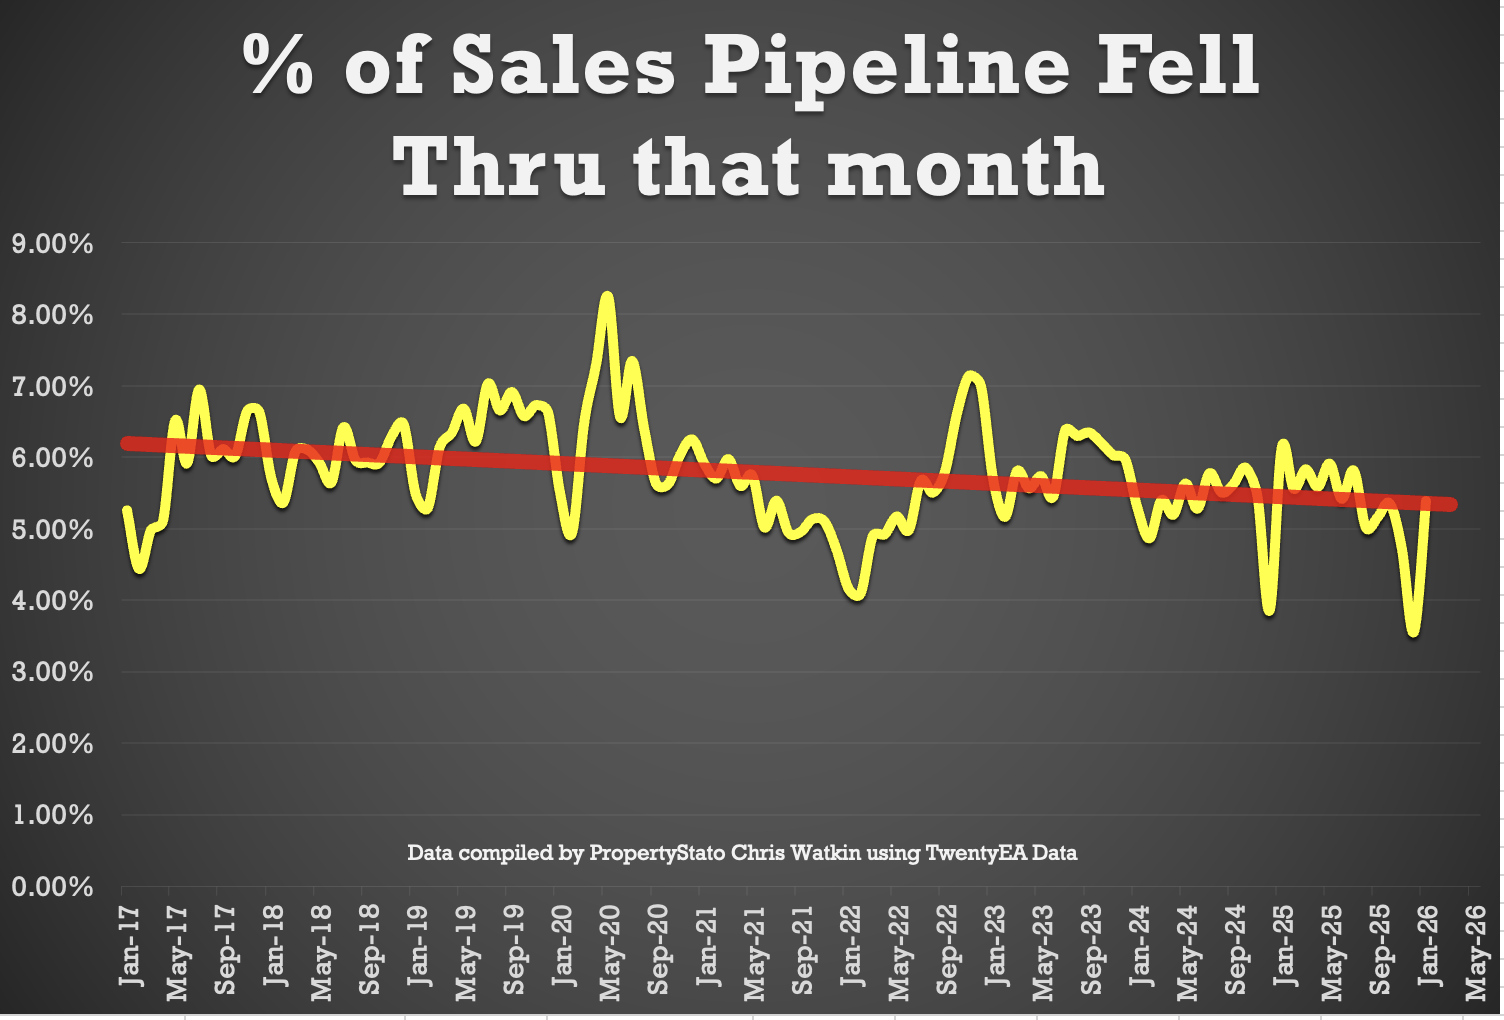
• 5.39% of all the sales agreed in Estate Agent’s Sales pipelines fell thru in January (6.13% in Jan 25 and 5.3% in Jan 25 . 10 year average – 5.8%). February figures to follow next week.
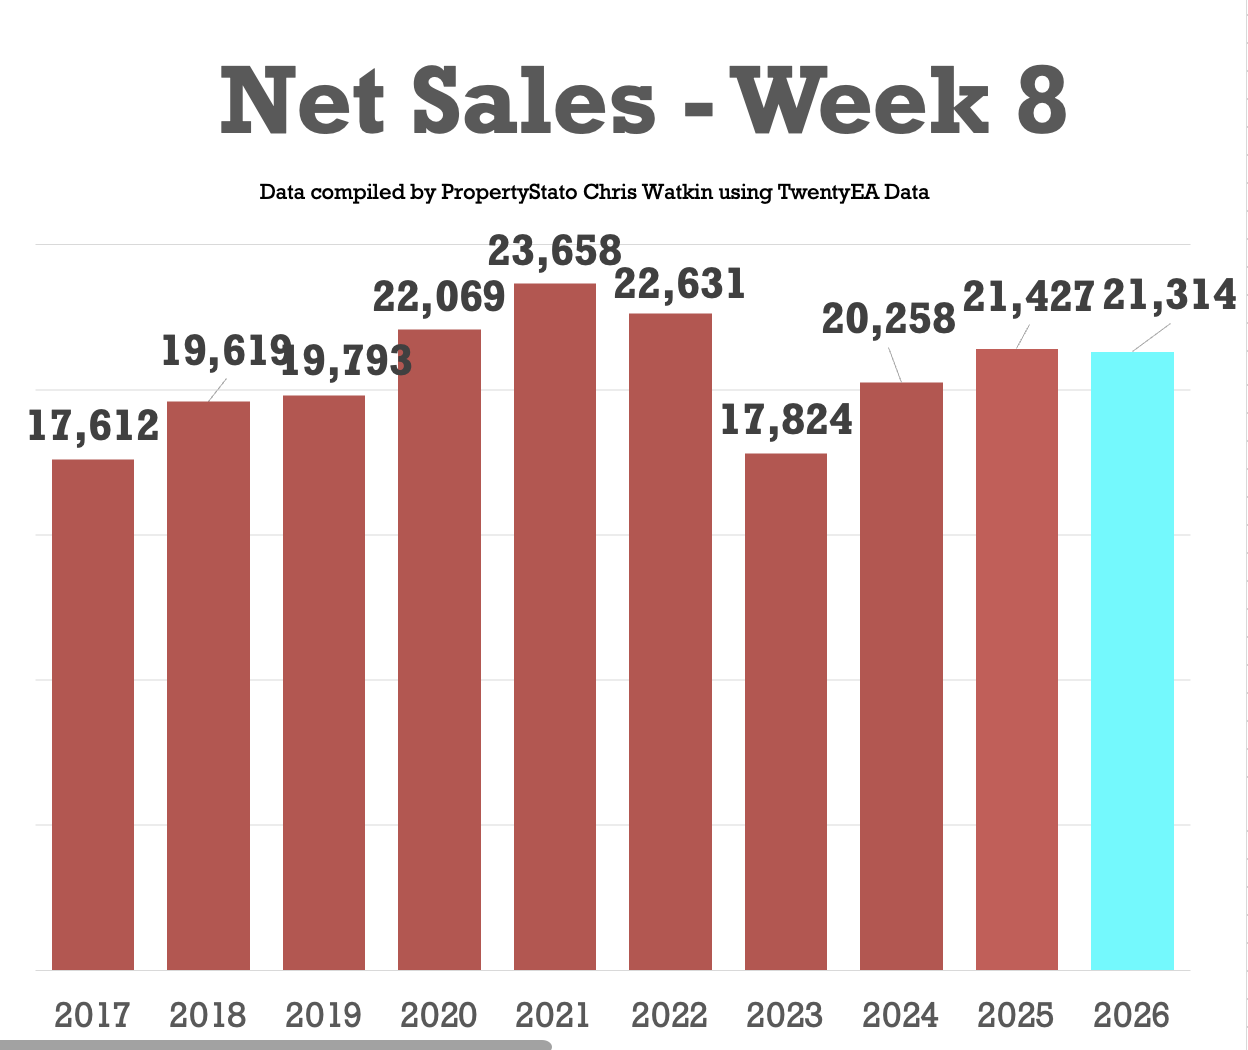
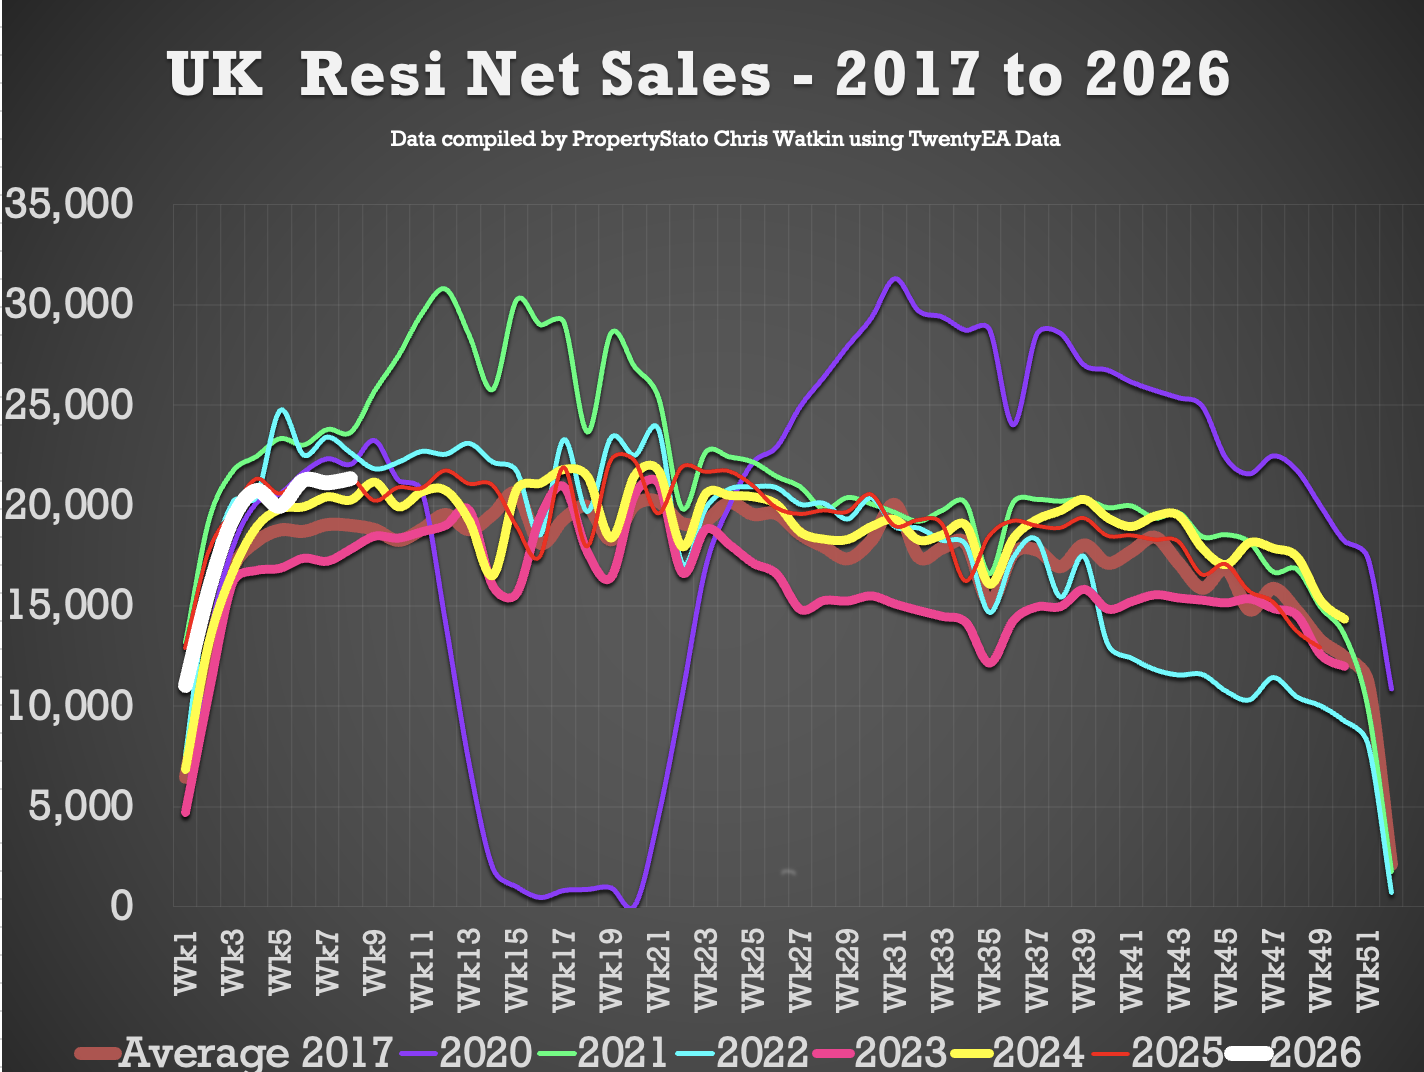
✅ Net Sales
• 21.3k Net Sales, up slightly from 21.1k last week
• Ten-year Week 8 average: 20.6k.
• Weekly average for 2026: 18k.
• Weekly average for the whole of 2025: 18.8k.
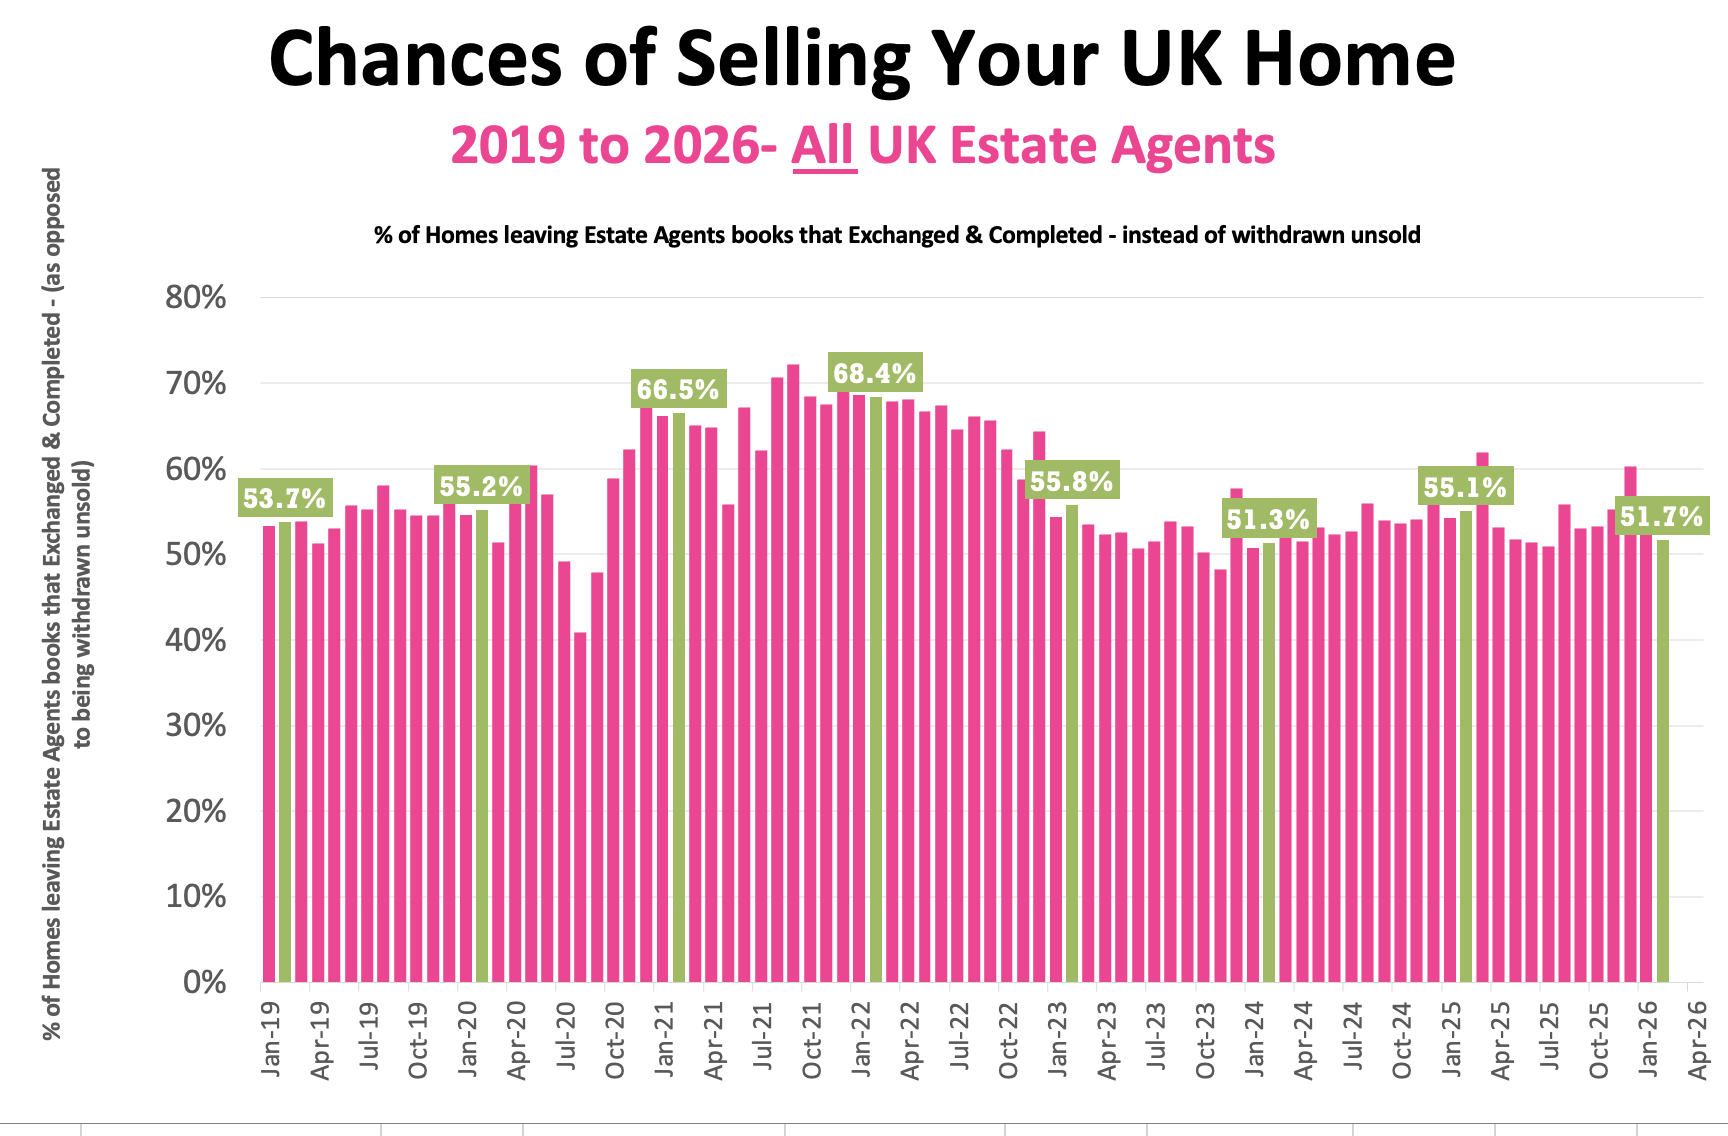
✅ Probability of Selling (% that Exchange vs withdrawal)
• Feb ’26 Stats : 51.7% of homes that left agents’ books exchanged & completed in Feb. (Note this figure will change throughout the month as more Feb stats come in).
• 57.6% is the 7 year average (which includes the crazy years post lockdown 18 months).
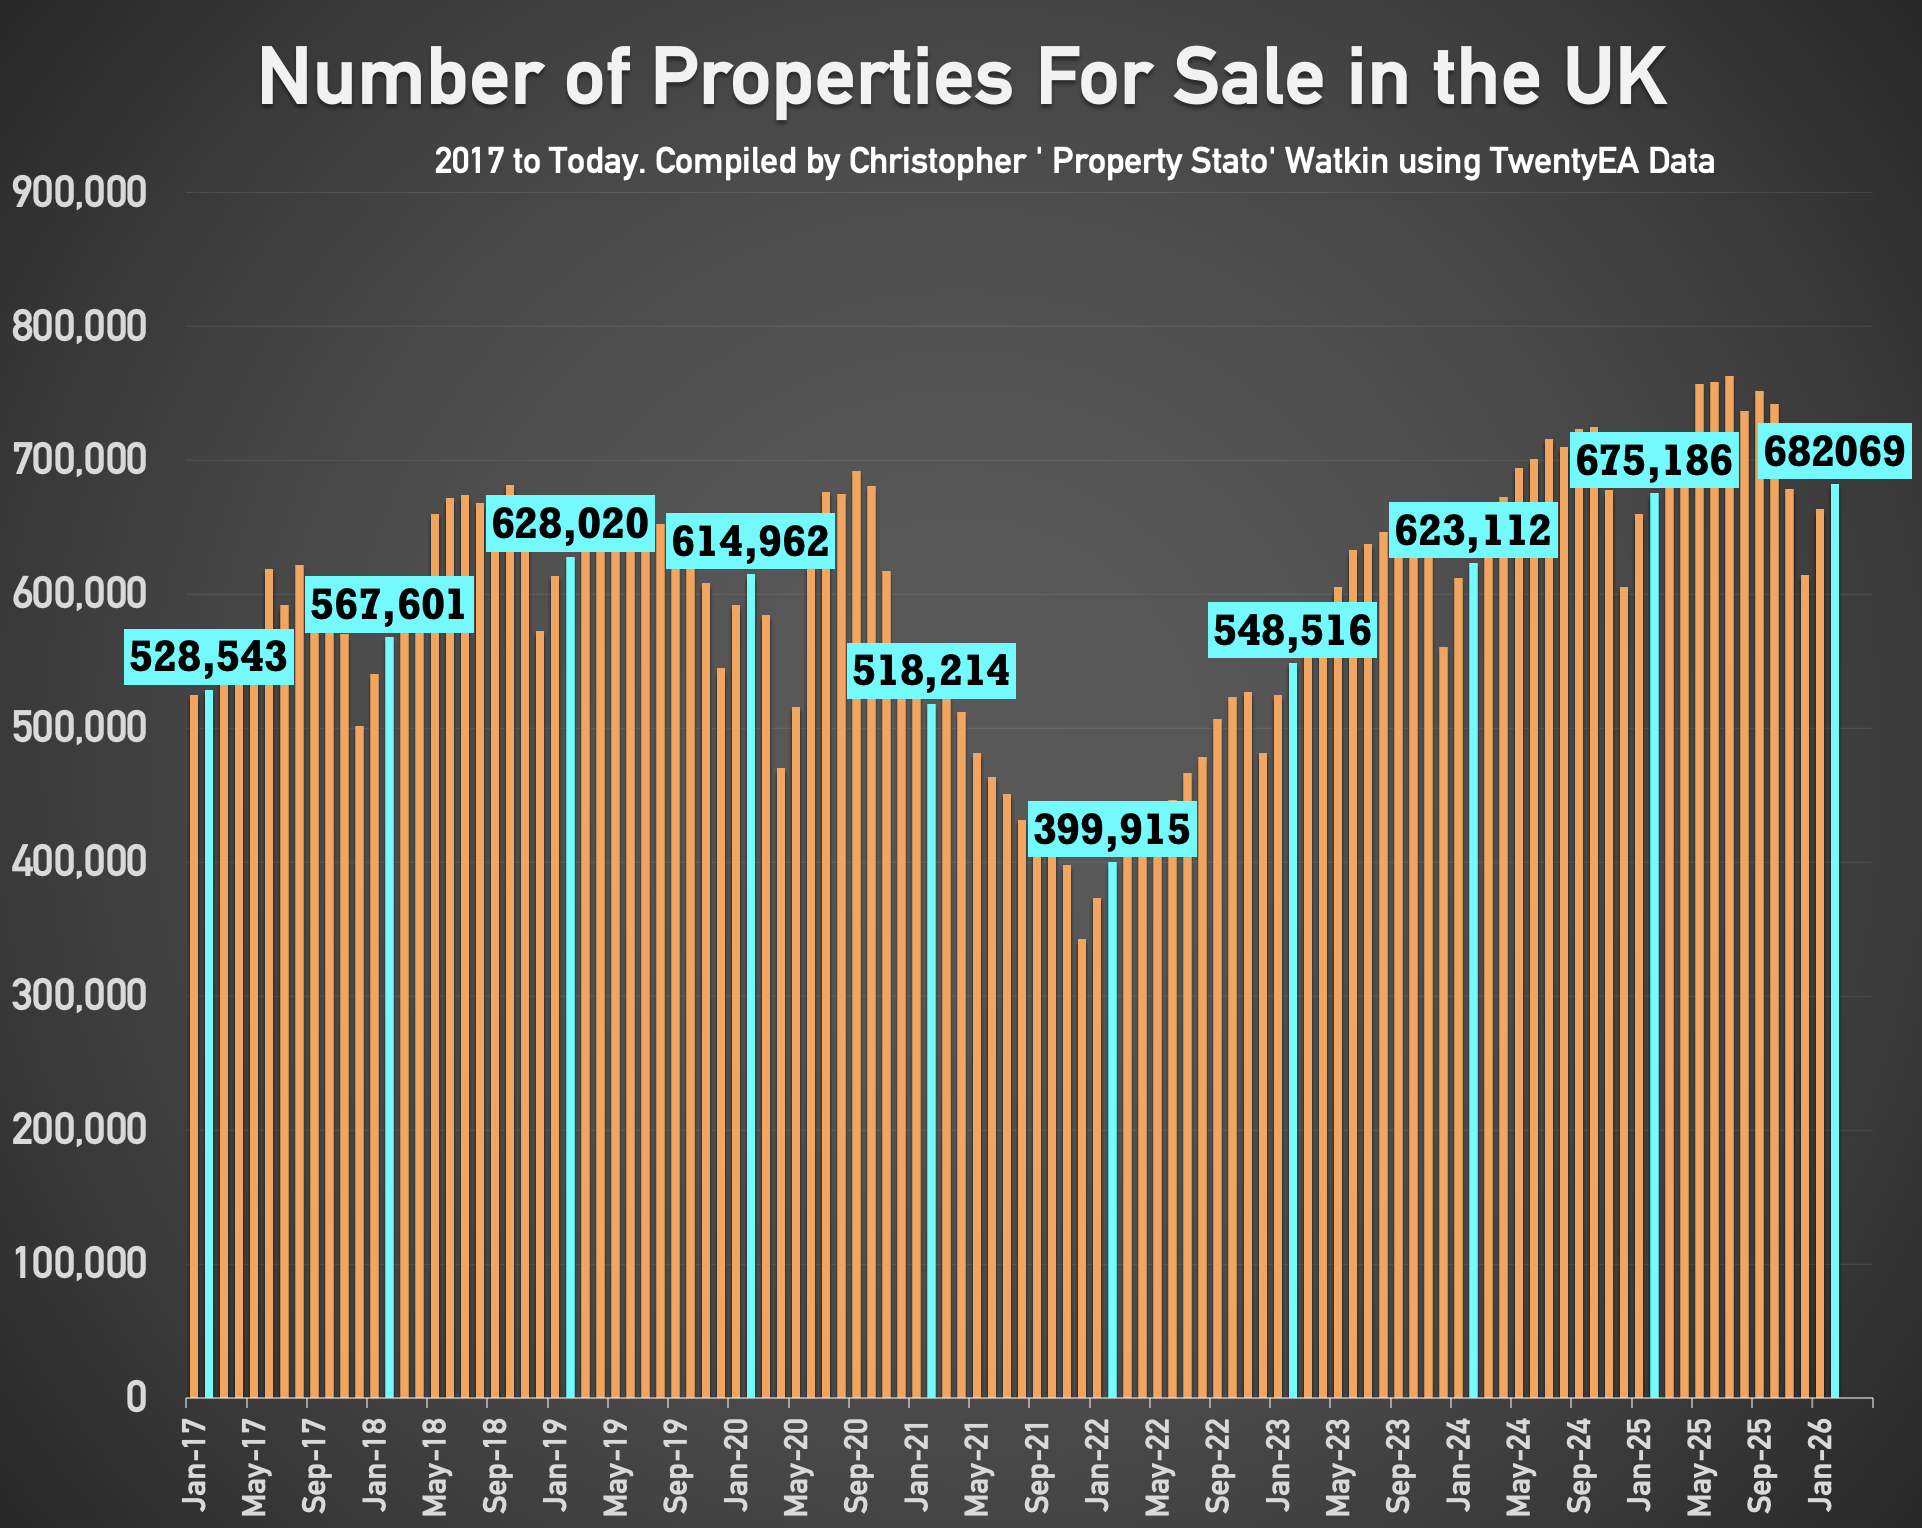
✅ Stock Levels
• 682k homes on the market on the 1st of March ’26. (675k – 1st March 25)
• 422k homes in agent’s sales pipeline on the 1st Feb 2026, slightly lower than 12 months ago on 1st Feb ’25 (433k). (NOTE – I haven’t got the 1st March stats yet – should have them for next week).
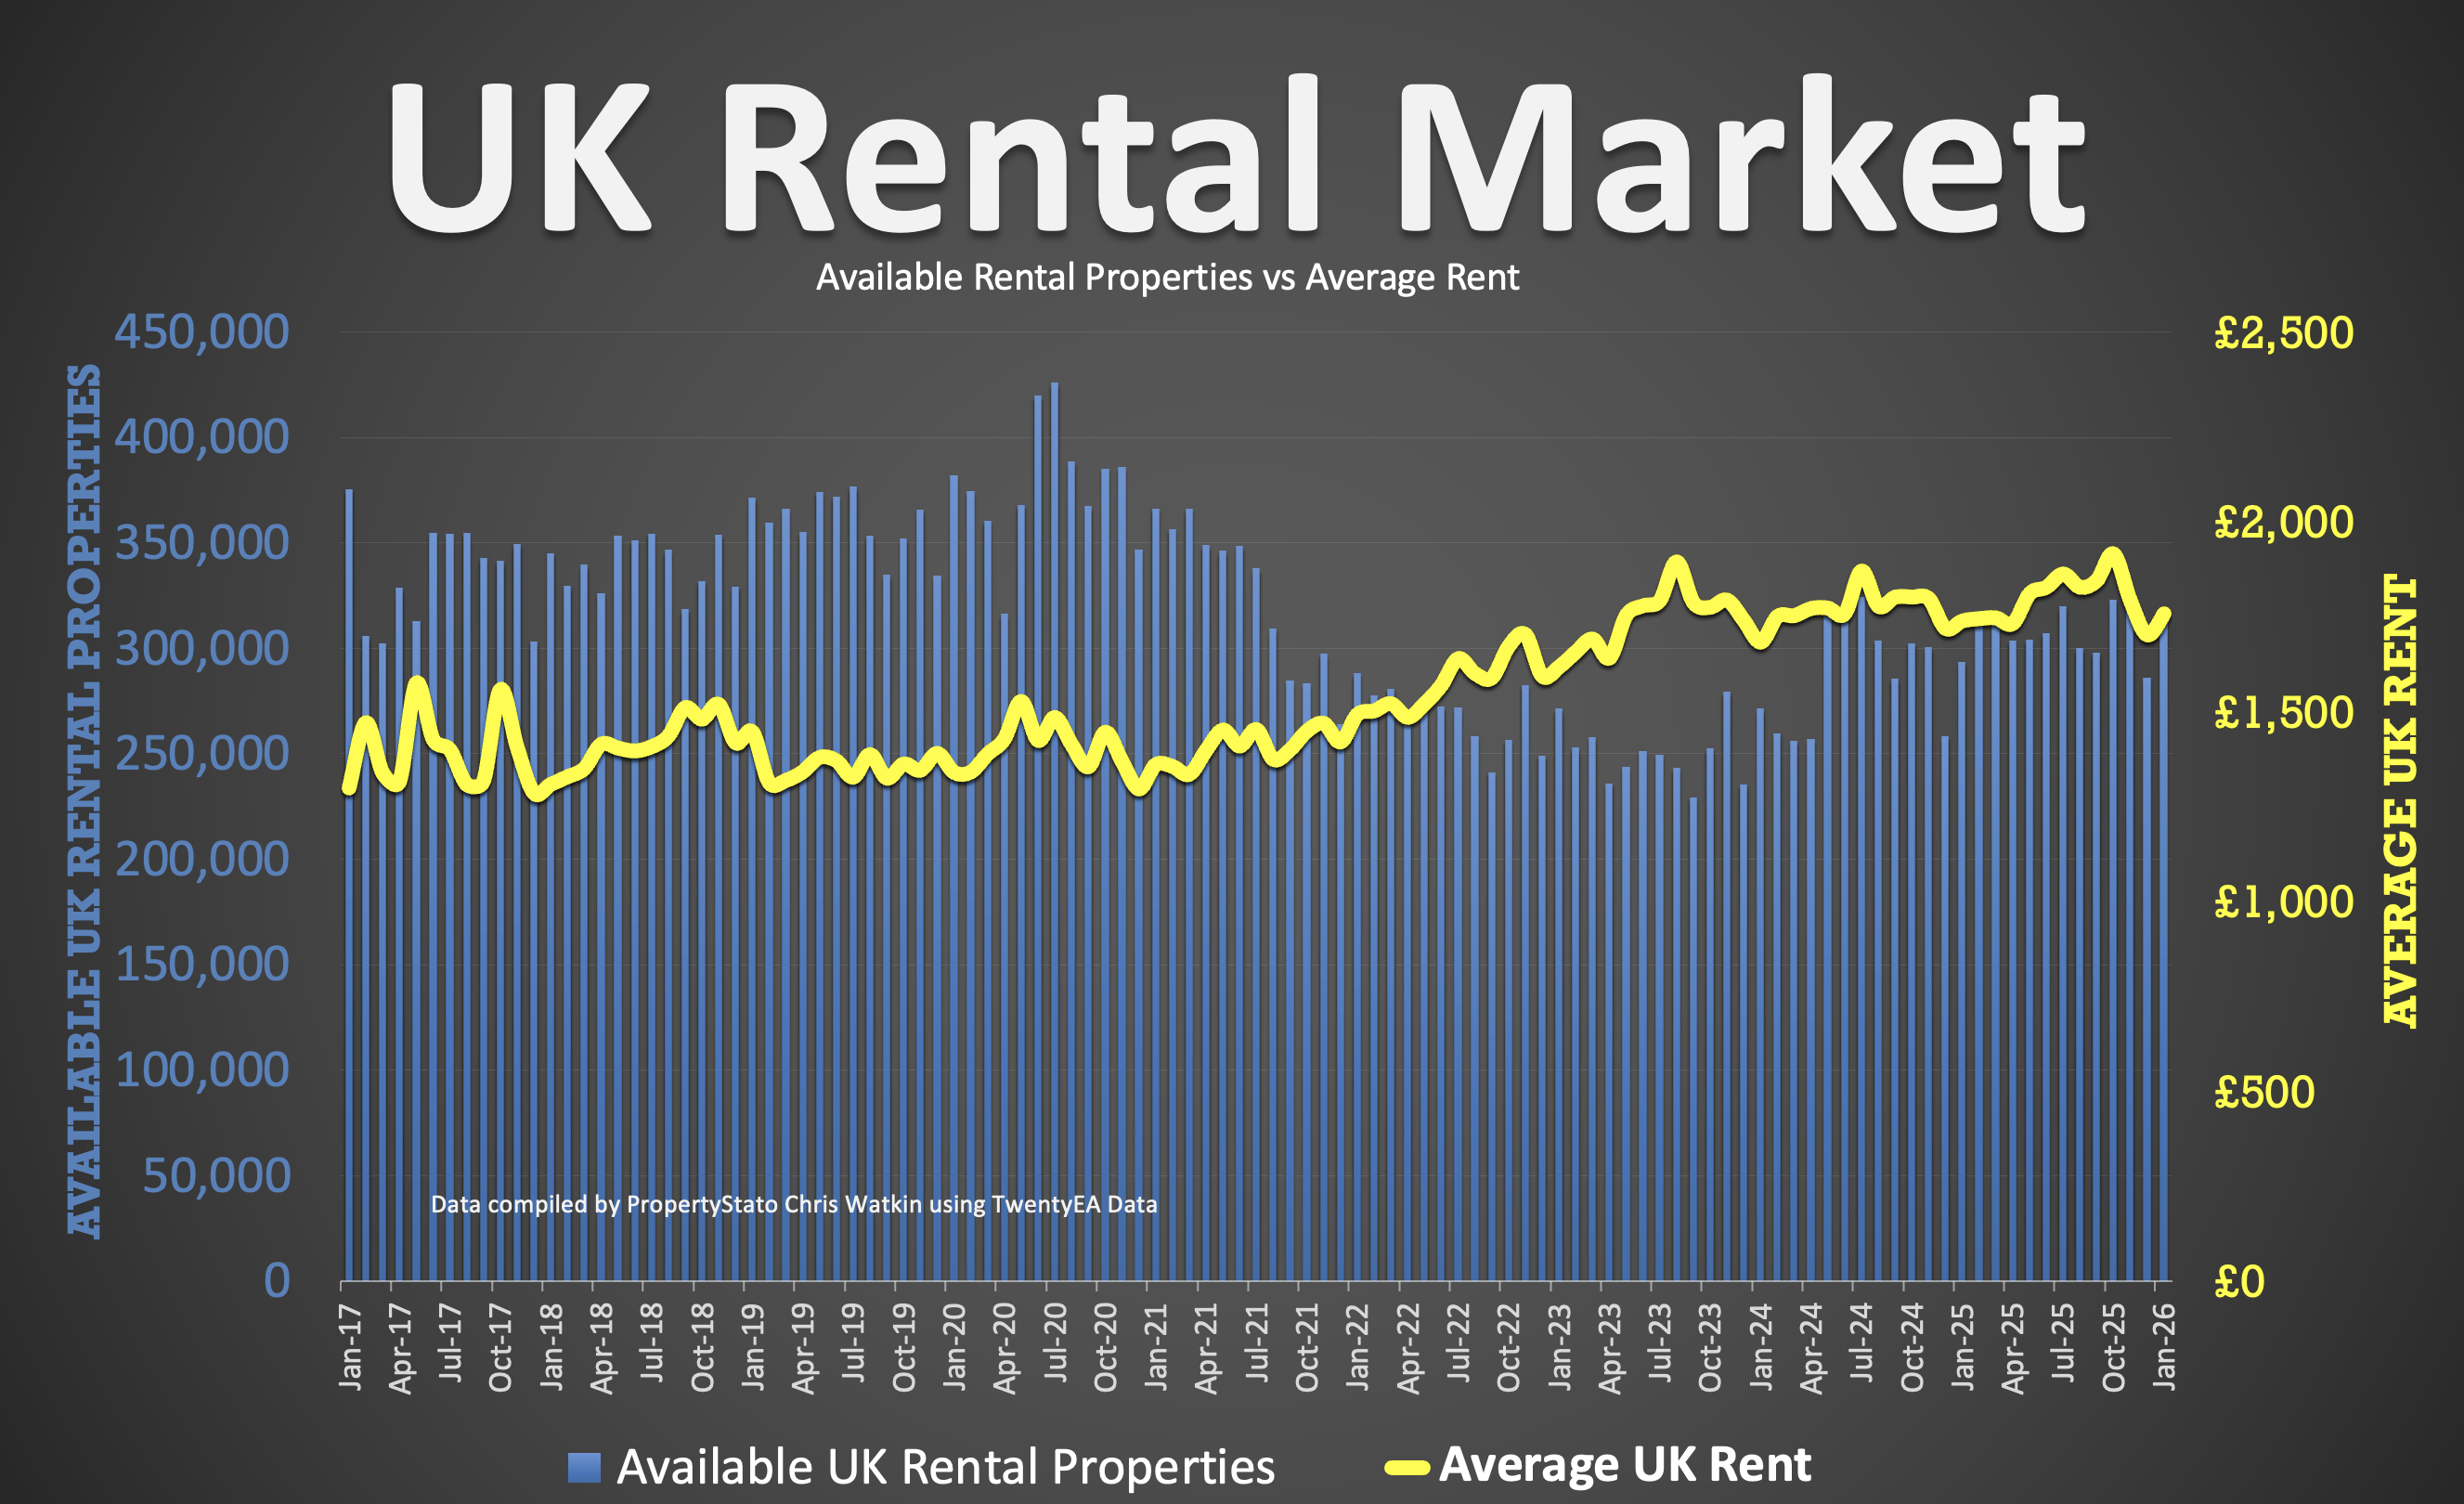
✅ UK Rental Data
• Average Rent in Feb 2026 – £1,711 pcm (£1,745 in Feb 25)
• 305k UK Rental Stock available to rent in Feb 26 (310k in Feb 2025).
✅ Local Focus
Stevenage

Despite the headlines and noise surrounding the housing market, the data shows that the British property market follows remarkably consistent seasonal patterns year after year. Activity typically builds through the early months, peaks during the spring selling season, dips around the bank holiday periods (2 Spring Bank Hols and Easter) and slows again towards the end of the year. Understanding these patterns allows agents to plan their strategy rather than reacting emotoinally to short term fluctuations. When you recognise that the market moves in cycles, you can prepare for them and position your property more effectively. The real advantage often comes from working with the pattern rather than fighting it.
You must be logged in to like or dislike this comments.
Click to login
Don't have an account? Click here to register
OVERVALUING … The biggest reason homes fail to sell is not the market, lack of buyers, the mortgage rates, or the government. It is simply ovarvaluing/overpricing. Too many agents still chase instructions by telling sellers what they want to hear rather than what the market will actually pay. The result is predictable. Weeks of silence, price ‘salami style’ reductions (instead of a big chunk) , frustrated vendors and a lower final sale price. In today’s market, accurate pricing is not a nice to have, it is survival. I say the sooner we can get rid of long sole agency agreements that protect these agents, the better – what say you???
You must be logged in to like or dislike this comments.
Click to login
Don't have an account? Click here to register
I am not an agent bit weas
I assume you are not as you would not mind visiting a vendor
Taking instructions
Doing floorplan
Details
Photos
Adding to the web portals
For a vendor to allow viewing from other agents when another agent phones and says “I have buyer for your house can I send them round”
That is certainly what I would have done if my competitors had not had an agreement in place
You must be logged in to like or dislike this comments.
Click to login
Don't have an account? Click here to register
Here is the irony of estate agency. Agents spend £1000’s and £1000’s marketing properties on RM fees, Zoops fees, OTM fees, floor plans, videos, drone shots etc etc ….. yet very little time(and more importantly thought) marketing themselves.
The real battle is not selling the home. It is getting invited into the living room in the first place.
By the time a seller calls three agents for a valuation, they already have a favourite in their mind. The agents who dominate their local market are the ones who consistently show knowledge, insight and authority long before a homeowner decides to move. Visibility builds trust, and trust wins instructions. It’s all about looking at it through lens ……
“Will this help more [your town] homeowners see [your agency] as the authority in the [your town] property market, so that when they decide to move, you are the agent they call?
You must be logged in to like or dislike this comments.
Click to login
Don't have an account? Click here to register