

 This week’s ‘UK Property Market Stats Show’ for week ending Sunday, 16th June 2024 features Steph Walker, boss of the The Agency UK.
The headlines are:
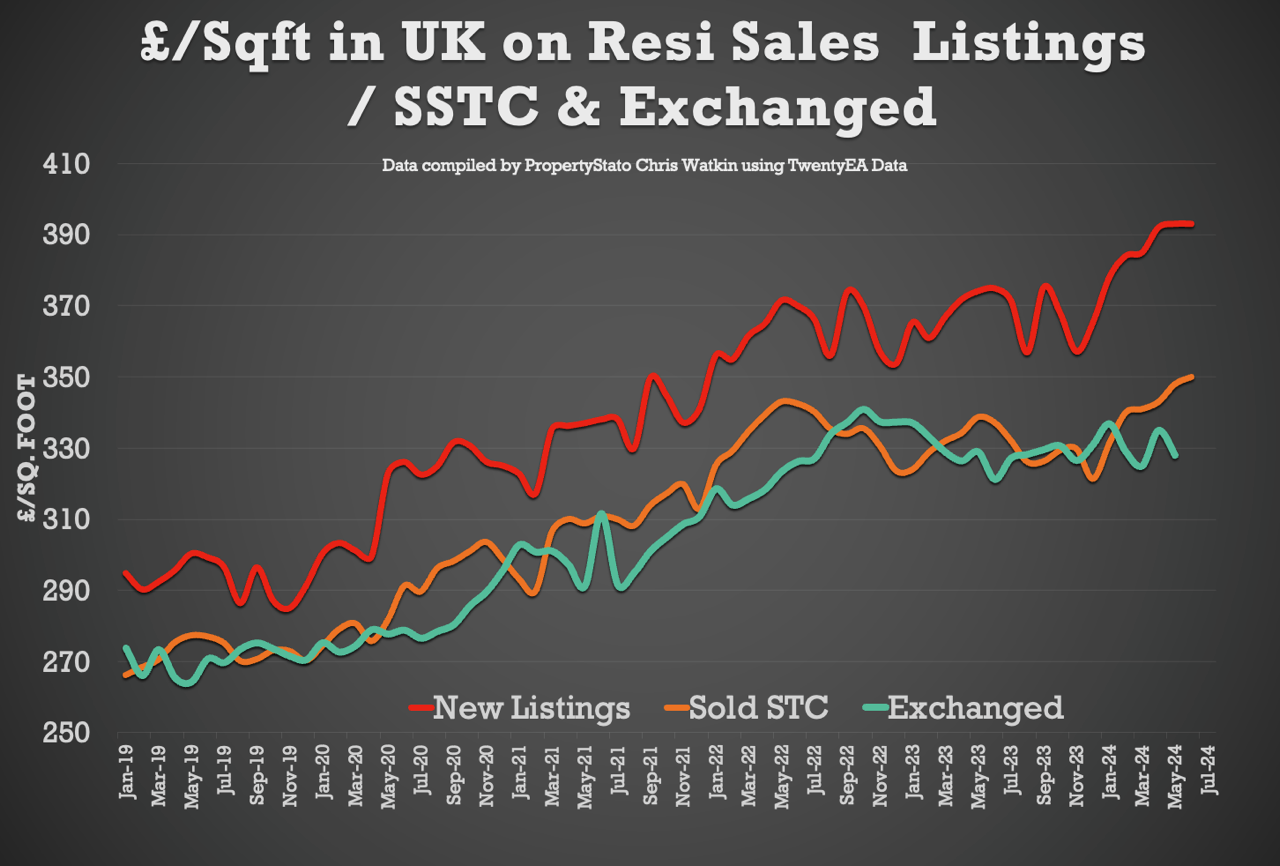
UK House prices remain strong at £350/sq.ft – 3.2% higher than March 2024
Listings – 37k UK listings this week. 5% higher YTD than 2017/18/19/20
Total Gross Sales – 26,455 (24,201 same week in 2023). YTD Gross sales are 8.7% higher than 2023 YTD levels and 7.7% higher than 2017/18/19 levels.
Net Sales – 20,483 this week, 13.5% higher than the same Week in 2023.
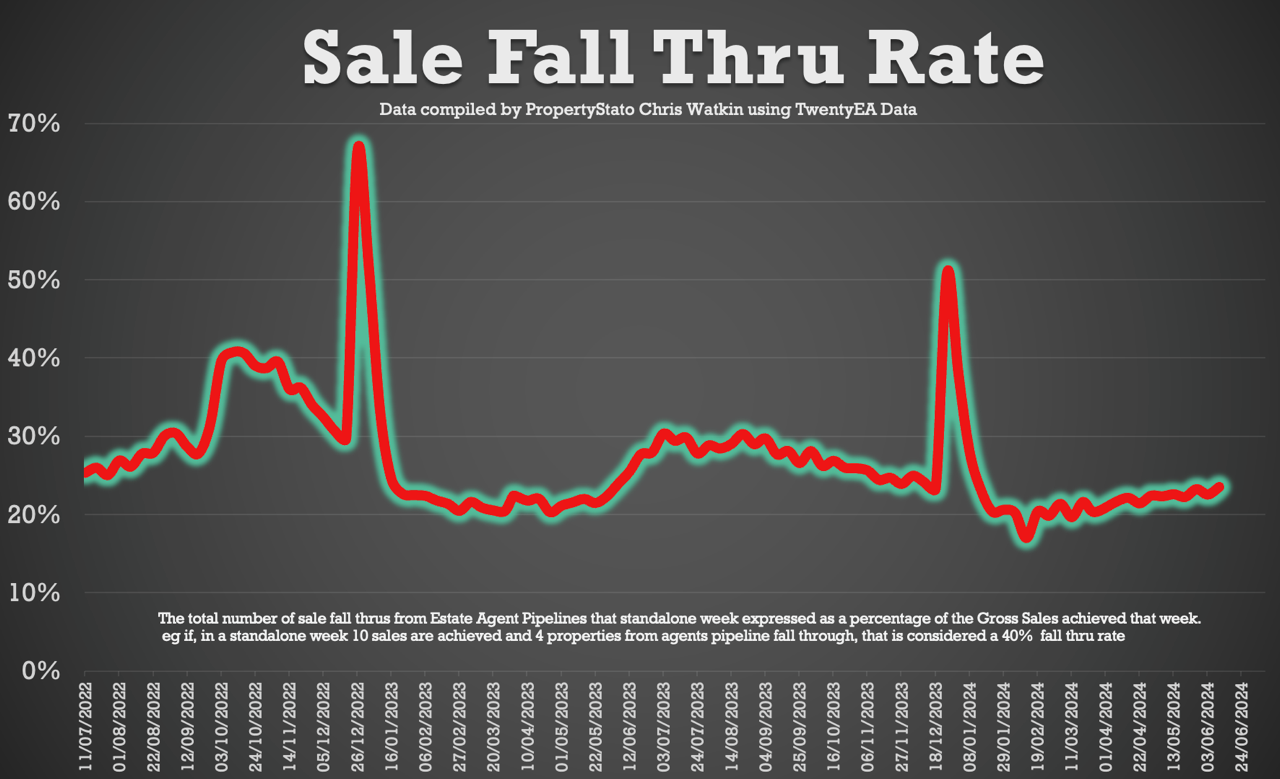
Sale fall-throughs remain steady at just over 1 in 5 sales.
Chris’s In-Depth Analysis of the UK Property Market (Week 24) :
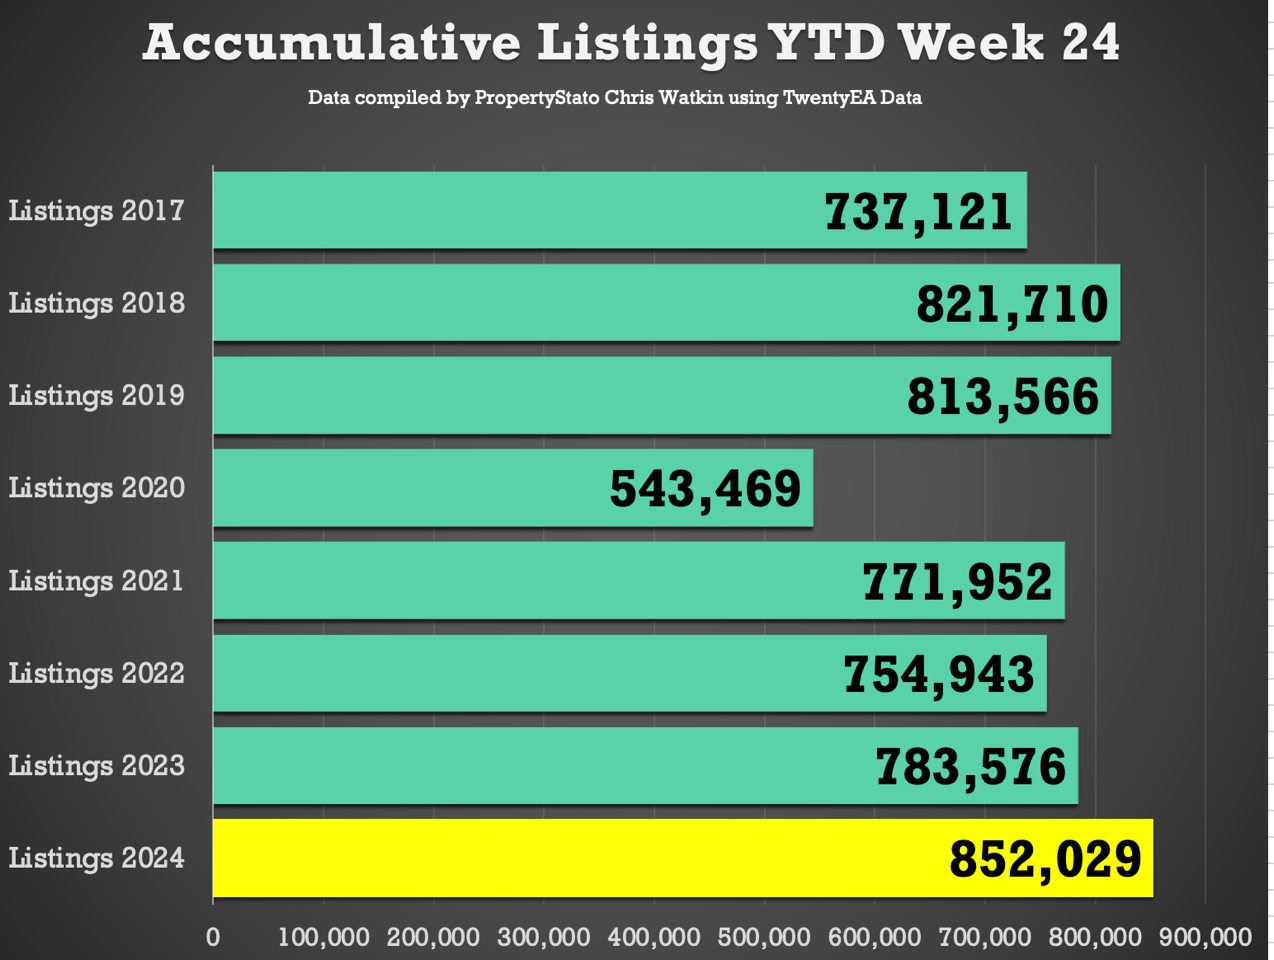
New Properties to Market: The UK saw 37,191 new listings. This year’s YTD listings stand at 852,029, 12.1% higher than the historical 8 year YTD average of 759,291, 7.7% higher than YTD 2017/18/19 and 8.7% higher YTD 2023. Weekly 2024 average : 35,501.
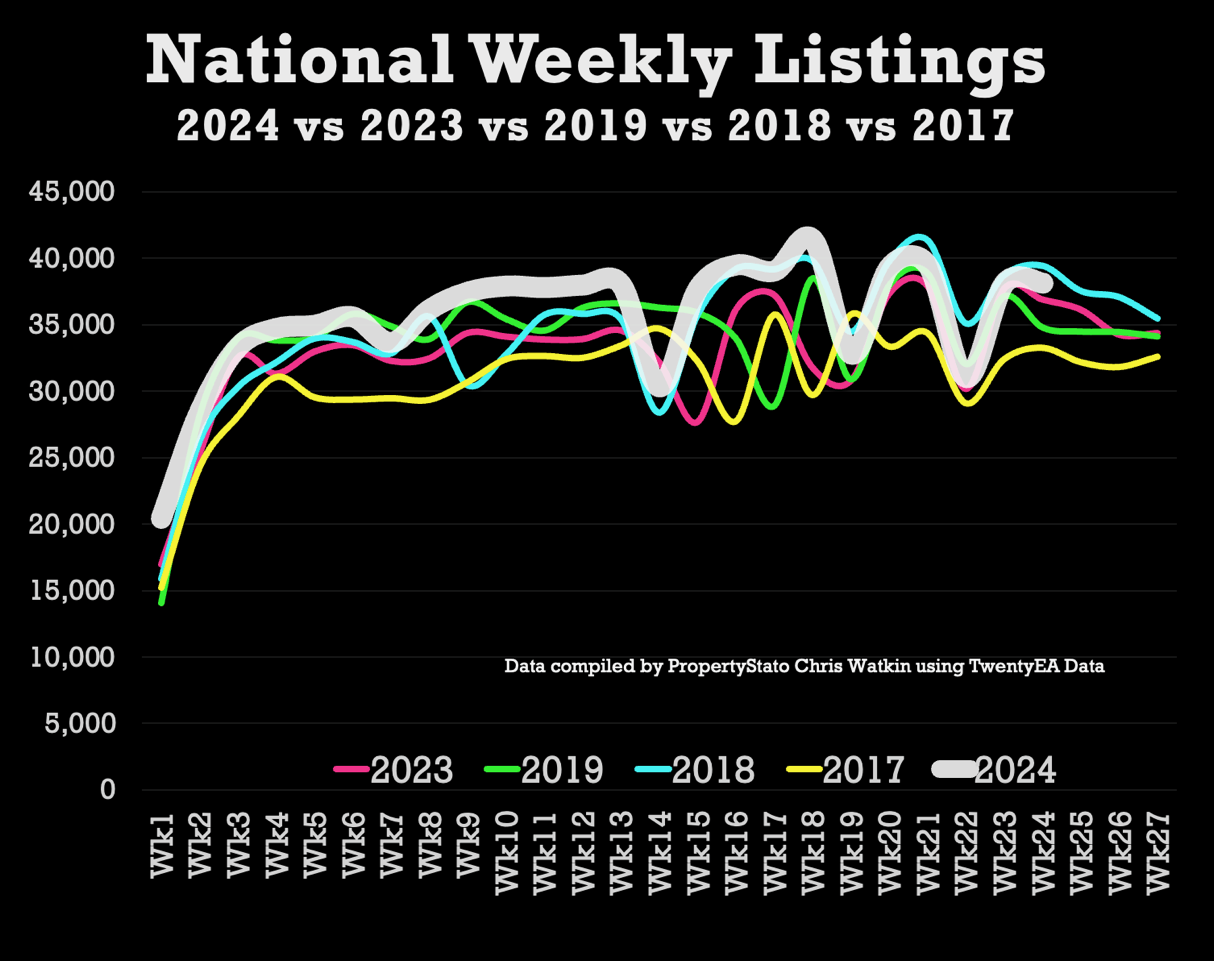
Average Listing Price: £454,451 .
Average Asking Price of this week’s Listings vs Average Asking Price of the Properties that Sale Agreed this week: 23.4%. The long-term average is between 16% and 17%. Over valuing in the whole of the UK, higher valuing properties for sale (downsizing) and a lower propensity of London & SE properties to sell causing this.
Price Reductions: Last week, 22,415 properties saw price reductions, a significant number compared to the 8-year Week 24 average of 19,532. This means 1 in 6.61 properties each month are being reduced (Long term average 1 in 9.9 per month)
Average Asking Price for Reduced Properties: £410,769
Gross Sales: 26,455 properties were sold stc last week (2024 weekly average : 24,522 Gross Sales).
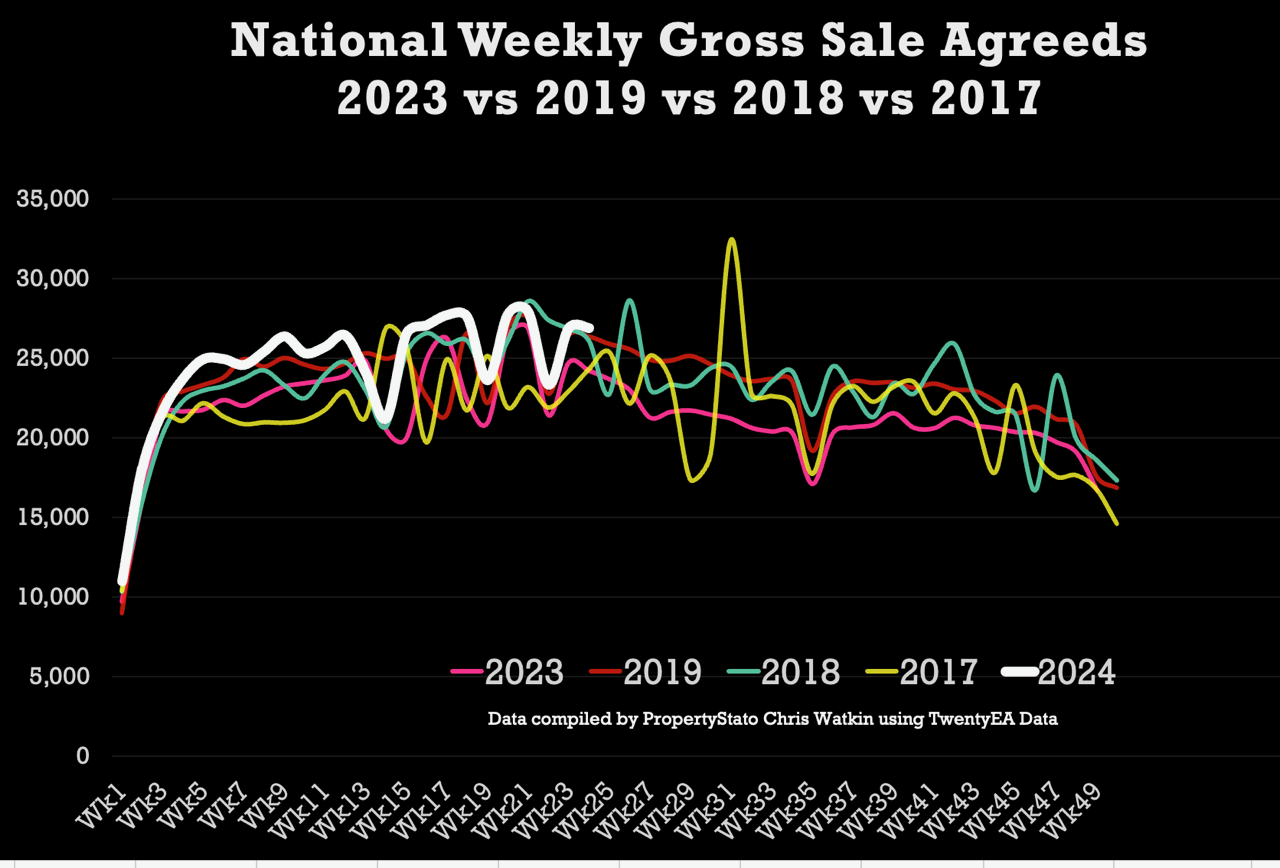
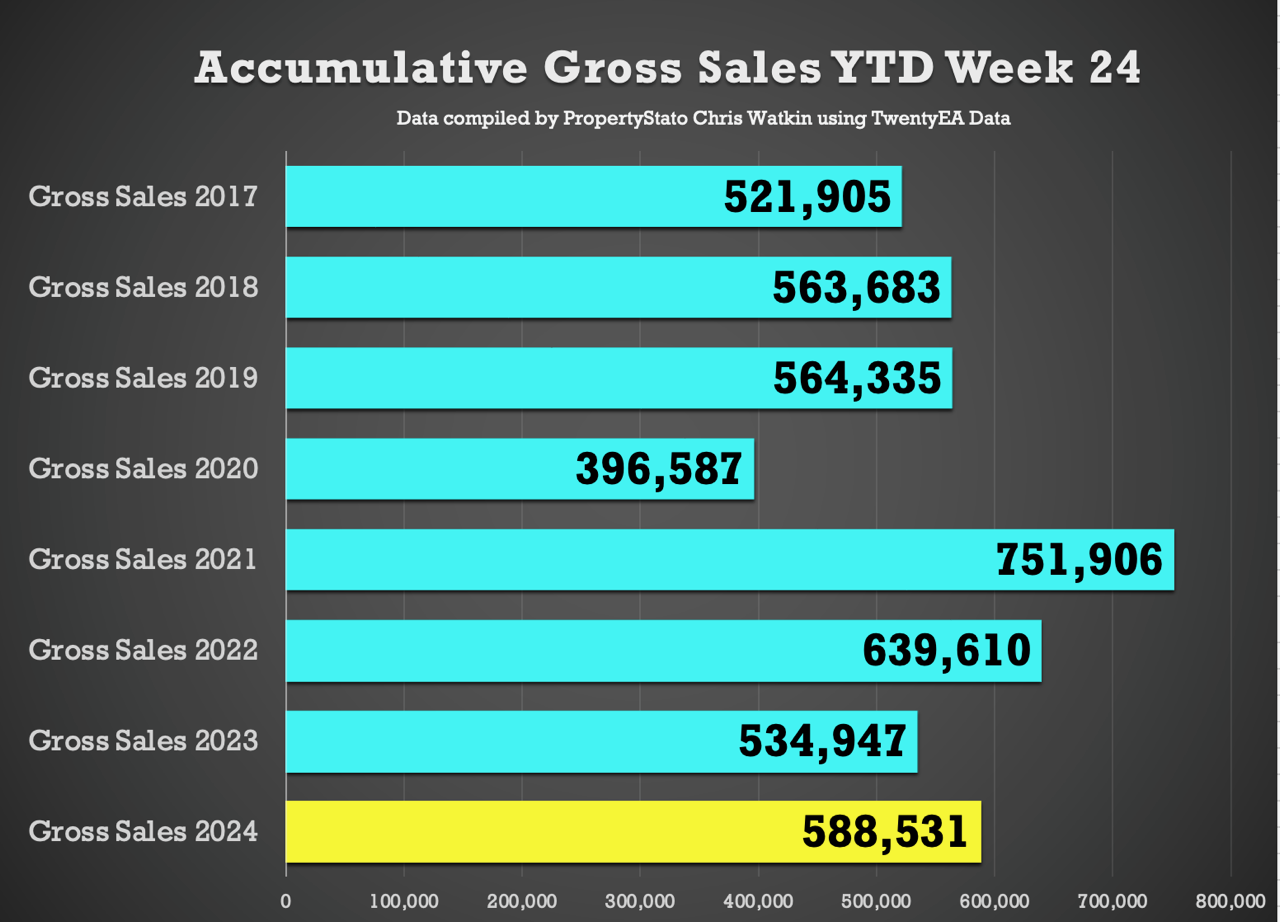
Accumulative Gross Sales YTD: The total stands at 588,531, exceeding the average of 549,974 from 17/18/19 and 534,947 in the same week 24 in 2023.
Average Asking Price of Sold STC Properties: Still staying in the mid £360/380k’s range (like has been for 2 years) at £368,143.
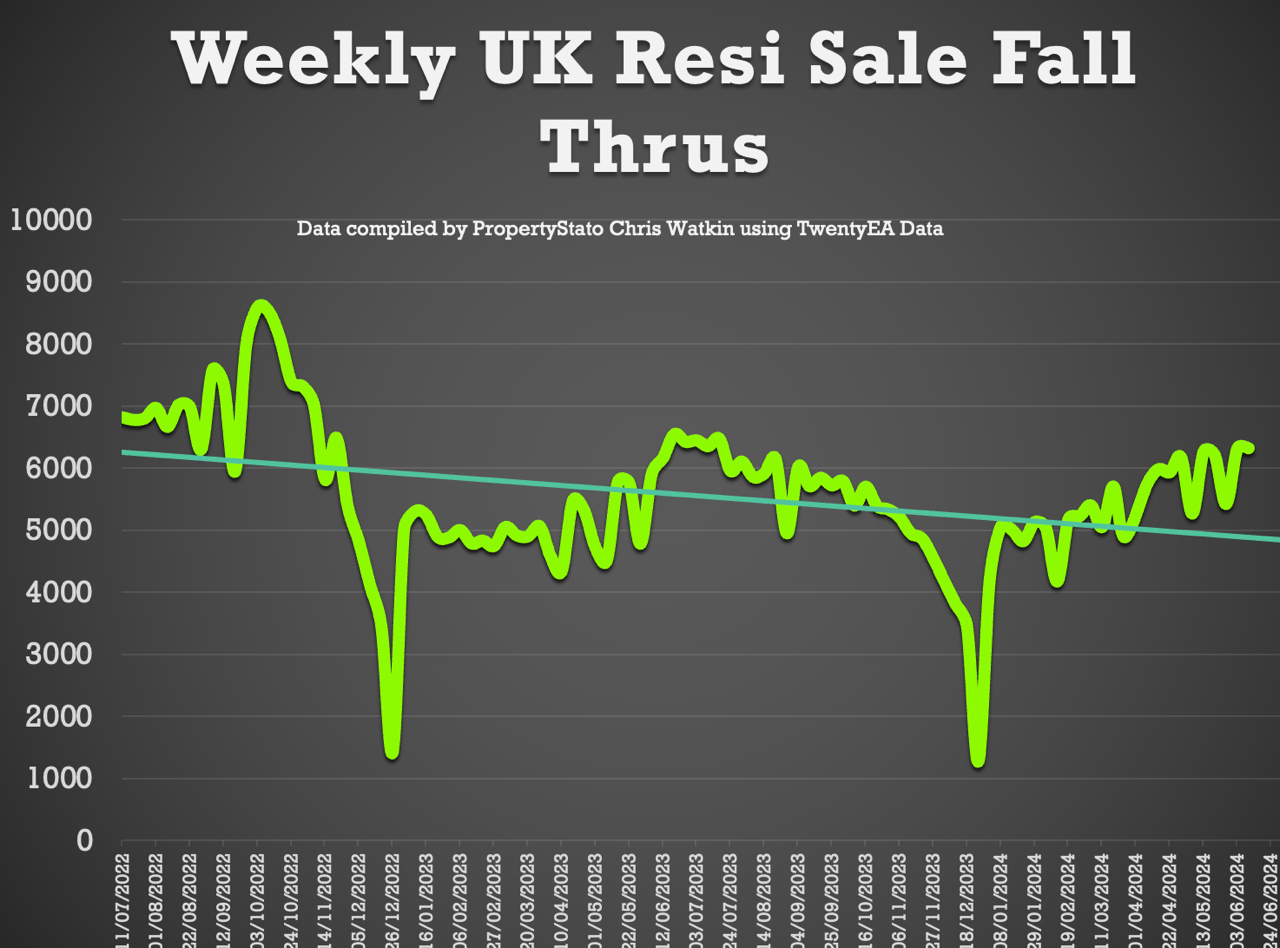
Sale Fall Throughs: Fall thrus this week at 5,972. Last 2 months weekly average 5,943.
Sale Fall Through % Rate: Similar to last week at 22.6% for week 24. (Comparison – 22.4% for the last 2 months, whilst the long term 8 years average is 24.8% & it was 40%+ in Q4 2022 – that budget!)
Net Sales – 20,483. 6.9% higher than the 2024 YTD average of 19,153.
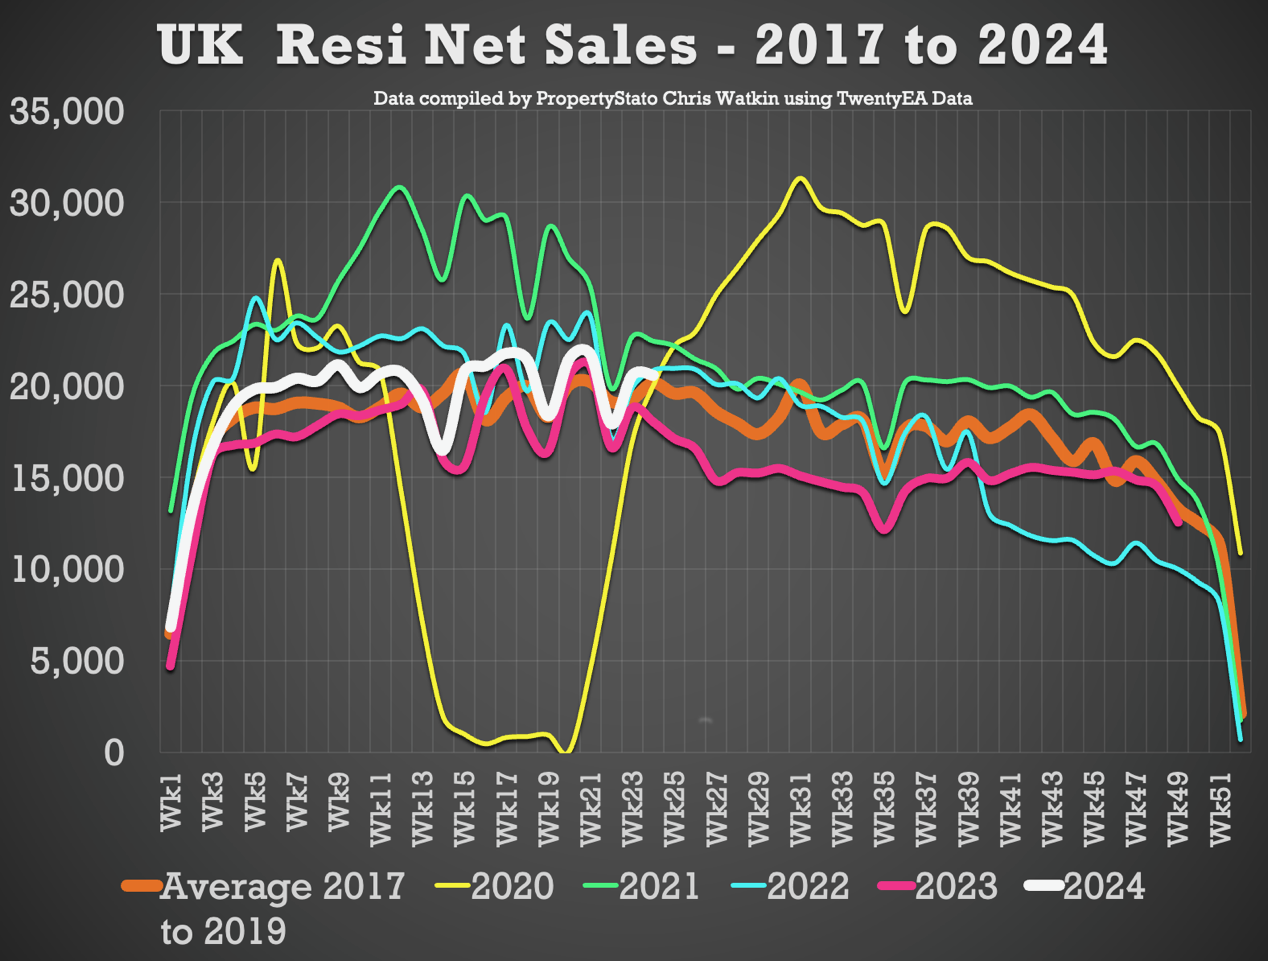
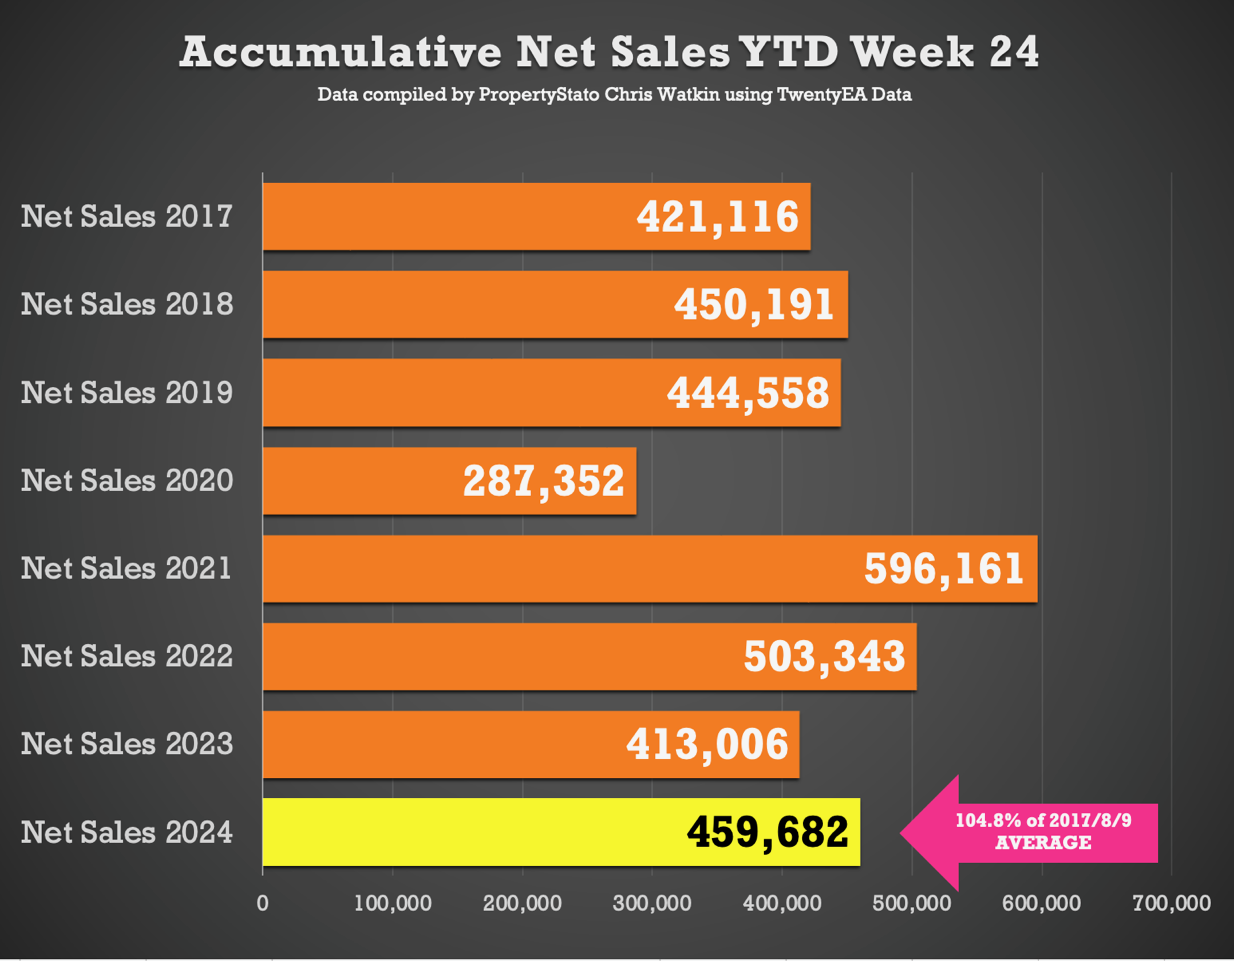
Accumulative Net Sales YTD: The total stands at 459,682, 4.8% higher the 17/18/19 YTD Net sales average (438,622) and 11.3% higher than the YTD figure for 2023 for Net Sales.
House Prices for June MTD are £350/sq.ft. For comparison – in May ’24 in £348/sq.ft, April ’24 – £344/sq.ft, March ’24 – £339/sq.ft, Feb ’24 -£339/sq.ft & Jan ’24 to £331/sq.ft).
This week’s local focus is on Amersham.

Sub national market trend we have seen, would be interested if others also have this happening – £1 to 2m family homes (i.e. VAT changes are a material hurt to you) in areas with lots of private schools but poor state catchment for secondary are effectively bidless at the moment.
Bristol (clifton/redland) now has relatively high levels of this sort of inventory, nobody buying, reasonable numbers of prime properties are offered way way (25%) below the few very peak panic 2022 sales on similar – likely a national phenomena but obviously difficult to tell as those markets are relatively niche and split over the country.
You must be logged in to like or dislike this comments.
Click to login
Don't have an account? Click here to register