

Highlights:
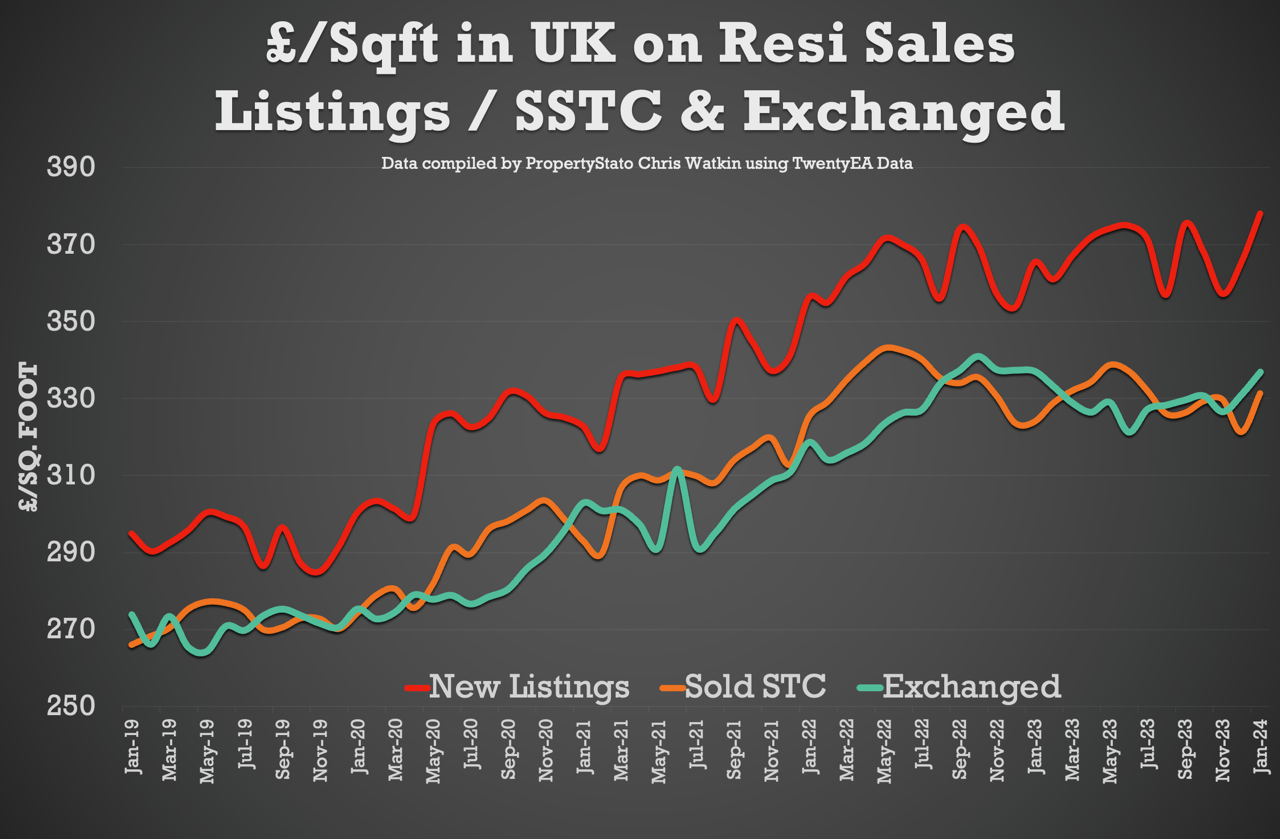
+ House Prices on Sale Agreed homes rise in Jan ’24 to £331.35 / sq.ft – a rise of 1.39% from Q4 ’24 levels (£326.80/sqft)
+ House Prices on Exchange of Contracts homes rise in Jan ’24 to £336.83 / sq.ft – a rise of 2.26% from Q4 ’24 levels (£329.37/sqft)
+ £/sqft at Sale Agreed predicts Land Registry House Price Stats with a 91% correlation rate, 5 months before the Land Registry House
+ Price Stats are published – hence this is an important stat.
+ Listings for Week 5 of 2024 hit a 8-year record high.
+ Gross sales up 5.2% on week before (& 36% higher than the Jan ’24 weekly average)
+ Net sales up 4.8% on week before (& 43% higher than the Jan ’24 weekly average)
+ Sale fall-throughs continue to be at record lows.
+ New Listings to Market:
The UK has observed 34,947 new property listings in Week 5, which is above the 8-year average for this week (32,615 listings). This year’s Year-To-Date (YTD) listings stand at 151,792, surpassing the historical 8-year YTD average of 138,606.
Questions: What factors might be contributing to this increase in new listings? Is this a sign of a more vibrant market or are there other underlying reasons?

Average Listing Price:
The average listing price currently stands at £418,395.
Questions: How does this compare to the same period last year? What might be driving changes in the average listing price?
Listing vs Sale Agreed Prices:
The difference between listing prices and sale agreed prices stands at 20.1%. Ideally, this figure should be in the mid-teens.
Questions: What could be causing this larger than ideal gap? Is this indicative of a market where buyers have more negotiating power?

Price Reductions:
Last week saw 18,231 properties with price reductions, which is significantly higher than the 8-year average of 13,156. This implies that approximately 1 in 8 properties see a price reduction each month.
Questions: Is this level of price reduction sufficient to stimulate more sales? What does this say about market expectations versus reality?
Average Asking Price for Reduced Properties:
The average asking price for properties that have seen price reductions is £348,347, suggesting that it’s the lower to mid-priced properties that are being reduced.
Questions: How does the reduction in asking prices impact the overall market dynamics? Does this make properties more accessible to first-time buyers?
Gross Sales:
There were 24,945 properties sold subject to contract (STC) in Week 5, above the average of 21,959 for the same week across 2017/18/19/20
Questions: What might be driving the increase in gross sales? Is this an indication of rising demand or improved market conditions?

Accumulative Gross Sales YTD:
The accumulative gross sales YTD stands at 99,472, exceeding the average of 92,757 from 2017/18/19/20.
Question: What factors are contributing to this year’s performance exceeding the historical average?

Average Asking Price of Sold STC Properties:
The average asking price of sold STC properties holds steady at £348,347, consistent with the latter half of 2023.
Questions: How does the stability of this figure affect market perceptions? Does this indicate a balanced market?
Sale Fall Throughs:
Sale fall throughs were counted at 5,131, which is encouragingly lower than the 2023 weekly average of 5,382.
Question: What might be contributing to the decrease in sale fall-throughs? Are improvements in the mortgage process or buyer confidence factors?
Sale Fall Through Rate:
The sale fall-through rate currently stands at 20.57%, a level not seen since Spring 2022. This is part of a downward trend that started in Spring 2023.
Question: What implications does this downward trend in sale fall-through rates have for the market? Is this a sign of increasing market stability?

Net Sales:
Net sales for the week were 19,814, which is above the average of 17,998 for Week 5 across 2017/18/19/20.
Question: What does the higher net sales figure indicate about the current market conditions? Are we seeing a more active market compared to previous years?

Accumulative Net Sales YTD:
The total stands at 75,273, exceeding the average of 73,036 from 2017/18/19.
Question: How significant is this increase in accumulative net sales YTD? What might this suggest about the market’s trajectory for the rest of the year?

£/Sq.ft House Prices
This new data is discussed at length in the show with Chris and Iain, and how it can foretell with a high-level of accuracy, what will be happening to the Land Registry stats later in the Summer
Question: How significant is this new information on the trajectory of house prices 5 months in advance?
Iain McKenzie from the Guild and I answer all these question in the ‘UK Property Market Stats Show’.
Local Focus Segment – Worcester
We spend the last 20 minutes of their show dissecting the Worcester property market, identifying key performers and trends among Estate and Letting Agents in the area.
Final Thoughts from Watkin:
As we step into the second month 2024, the property market continues to show promising signs of strength and resilience. Yet it’s vital, however, to approach each week with a strategic mindset.
Estate agents – your goal remains 100% clear: Engage in proactive prospecting for new properties to sell, ensure accurate valuations (don’t forget only 52.8% of homes you try to sell in 2023 exchanged and completed), and focus great sales progression to get the sale through to exchange.


Comments (3)
Chris, since you have £/sqft can you break out average floor size of new listings vs. sale agreeds? Also a spread of floor size or bedroom numbers vs discounts would be good to see. Strong suspicion that the ave listed price vs sale agreed gap is actually more larger homes coming to market vs. Sales of smaller/cheaper properties being more robust rather than simple agent over valuation. Hopefully it should be possible to show if this is right from your dataset
Price per Sqft is flawed and of little use as it doesn’t factor in site location and site density
A 600sqft flat in Sloane has a different value to 600sqft semi detached starter home in Hull.
What is selling or not selling, where, is something all these stats overlook. Talking up the market based on national stats doesn’t help agents where everyone has just been laid off from a steel works and conversely talking the market down in heaven’s waiting room where retirees view all homes as a bargain compared to where they live doesn’t help agents there either.
Very true, but because all the answers cannot be easily teased out of a large scale dataset doesn’t mean that there is no point in looking at different metrics. The market is of course hyper local but large scale national trends will always affect a push or pull on it.
There is value in looking at the existing data, producing a theory based on a combination of market knowledge and trends in the data, then attempting to splice things a different way to get closer to confirm / not confirm the idea. It will never tell you everything but can definitely provide a more empirical guide to where things are/were heading at the time of the information.