

 The general election does not seem to have had a major impact on the UK property market, as house prices achieved at sold STC are 6% up on January 2024 and net sales 12.4% higher year-to-date than 2023, the latest figures show.
This week’s ‘UK Property Market Stats Show’ for week ending Sunday, 7th July 2024, features special guest Verona Frankish, CEO of Yopa.
The headlines for Week 27 of 2024 are as follows:
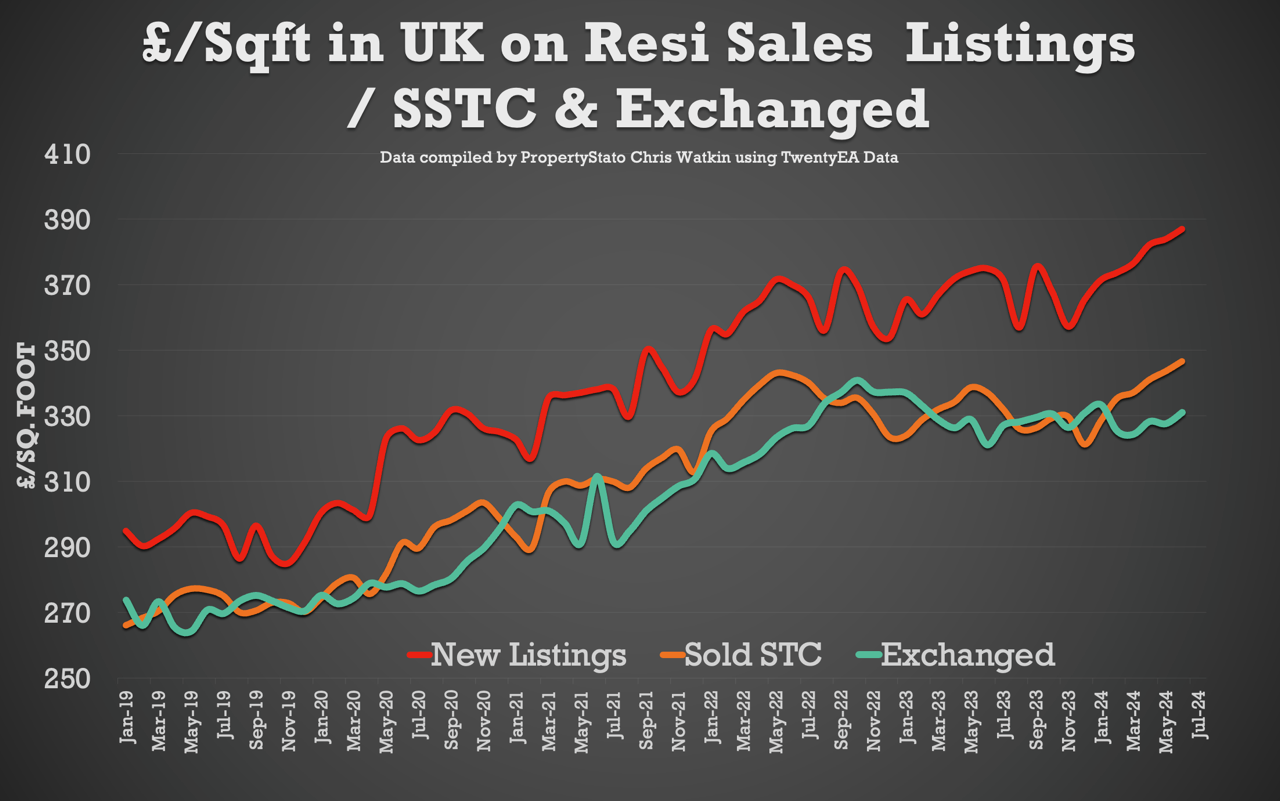
+ UK House prices on Homes sold (STC) in July continue to remain strong at £348/sq.ft – 6% higher than Jan 2024
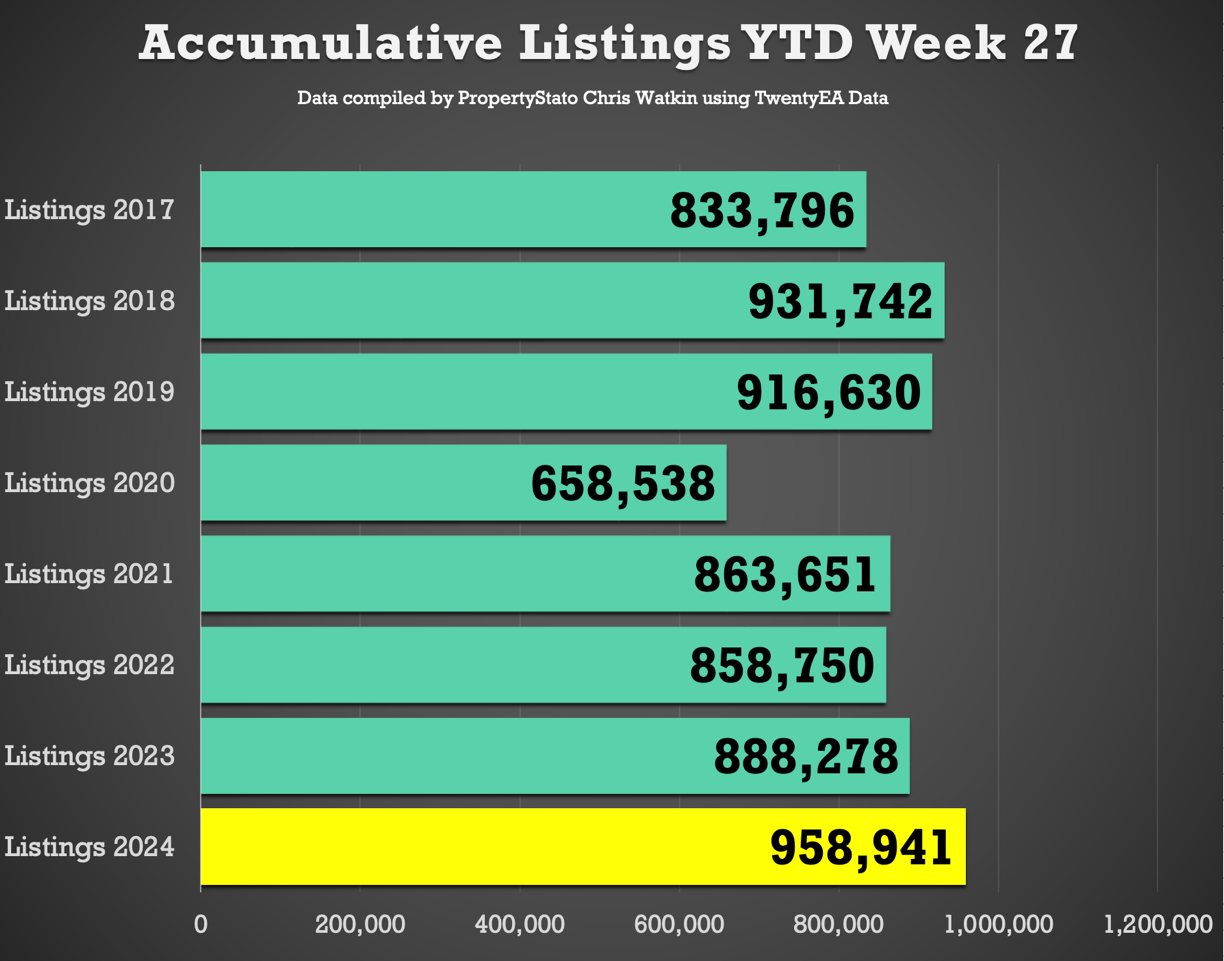
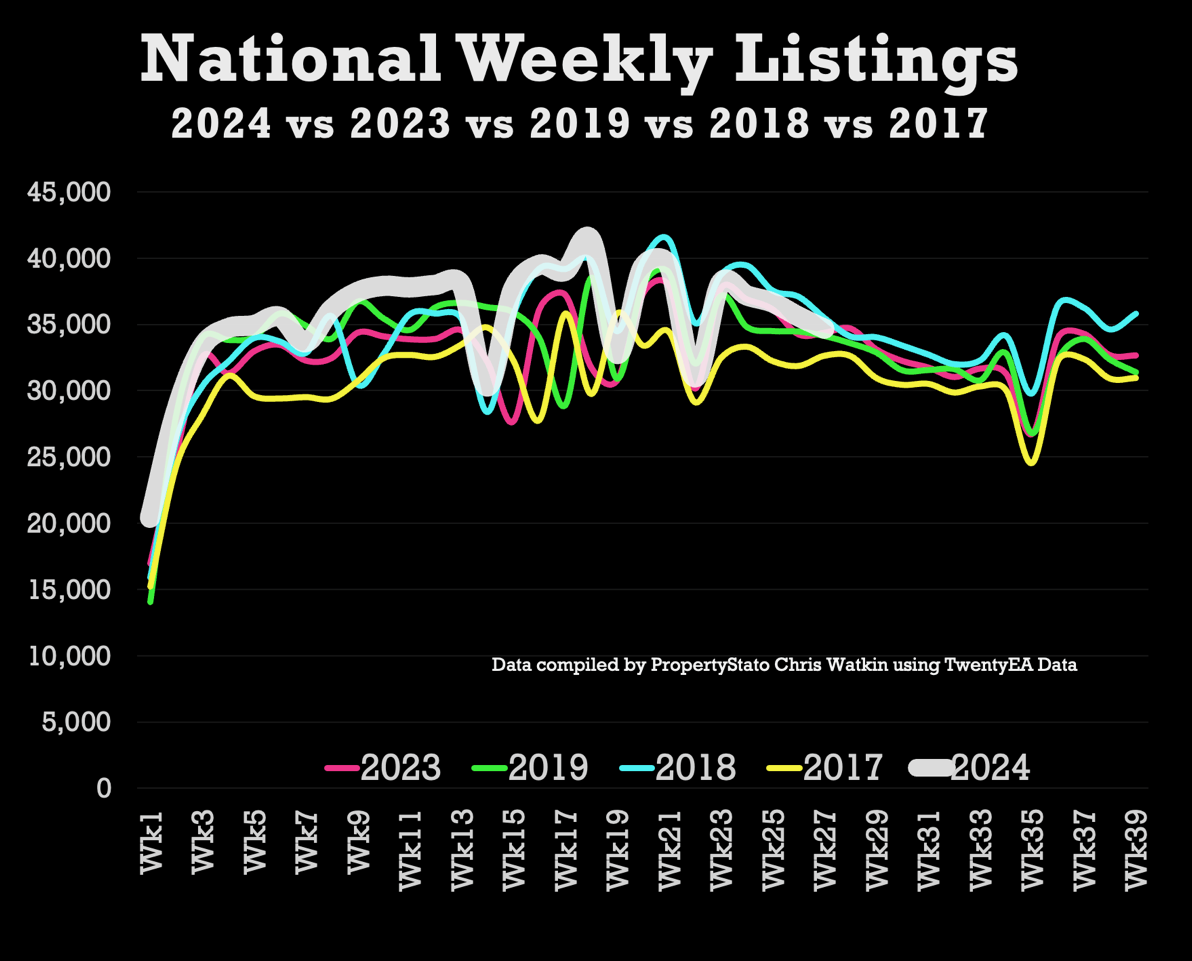
+ Listings – 34.6k UK listings this week. 8% higher YTD than 2017/18/19 YTD average
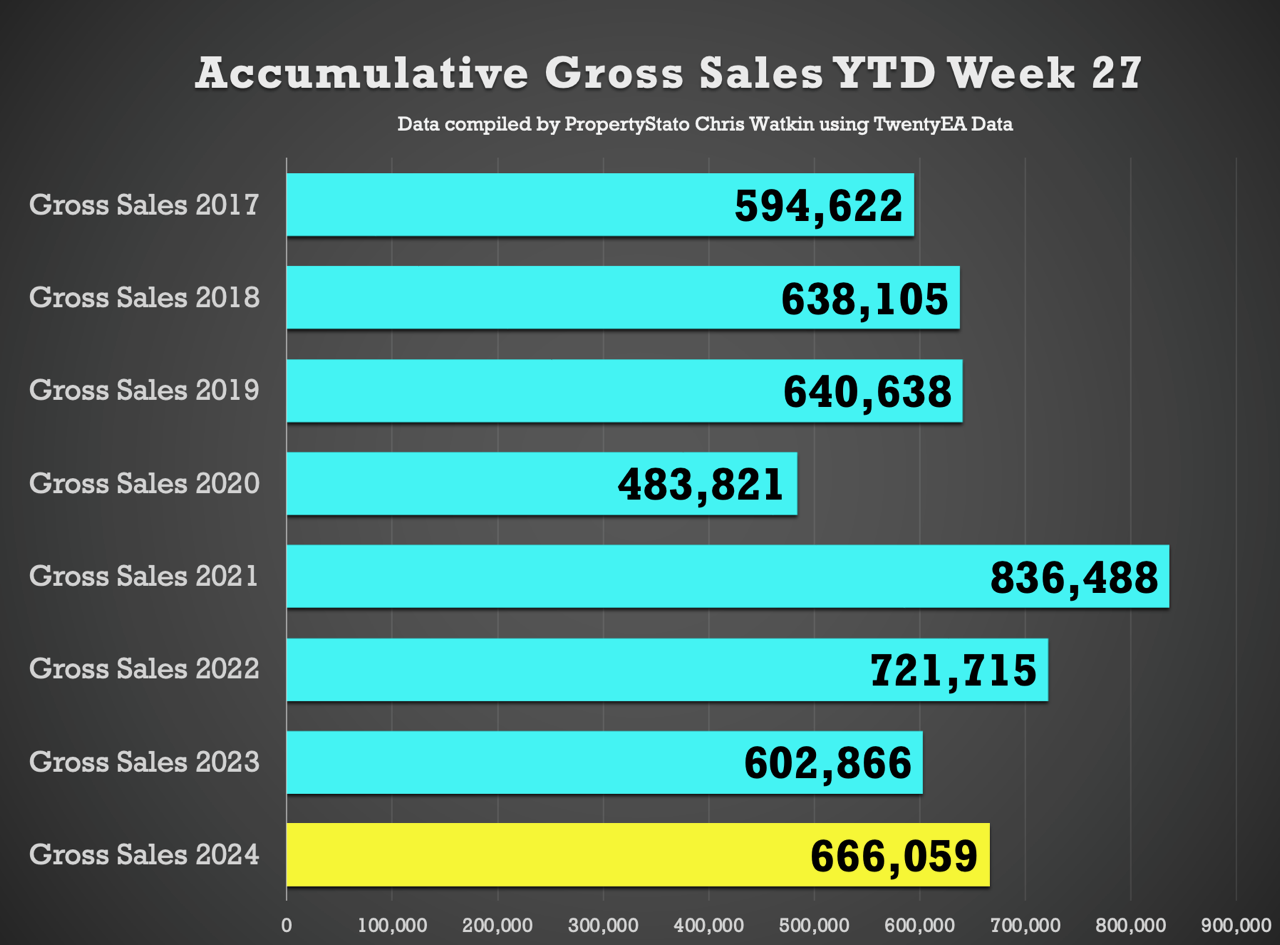
+ Total Gross Sales – 24,858 – 6.7% higher than 2017/18/19 YTD levels & 10.5% higher than 2023 YTD levels.
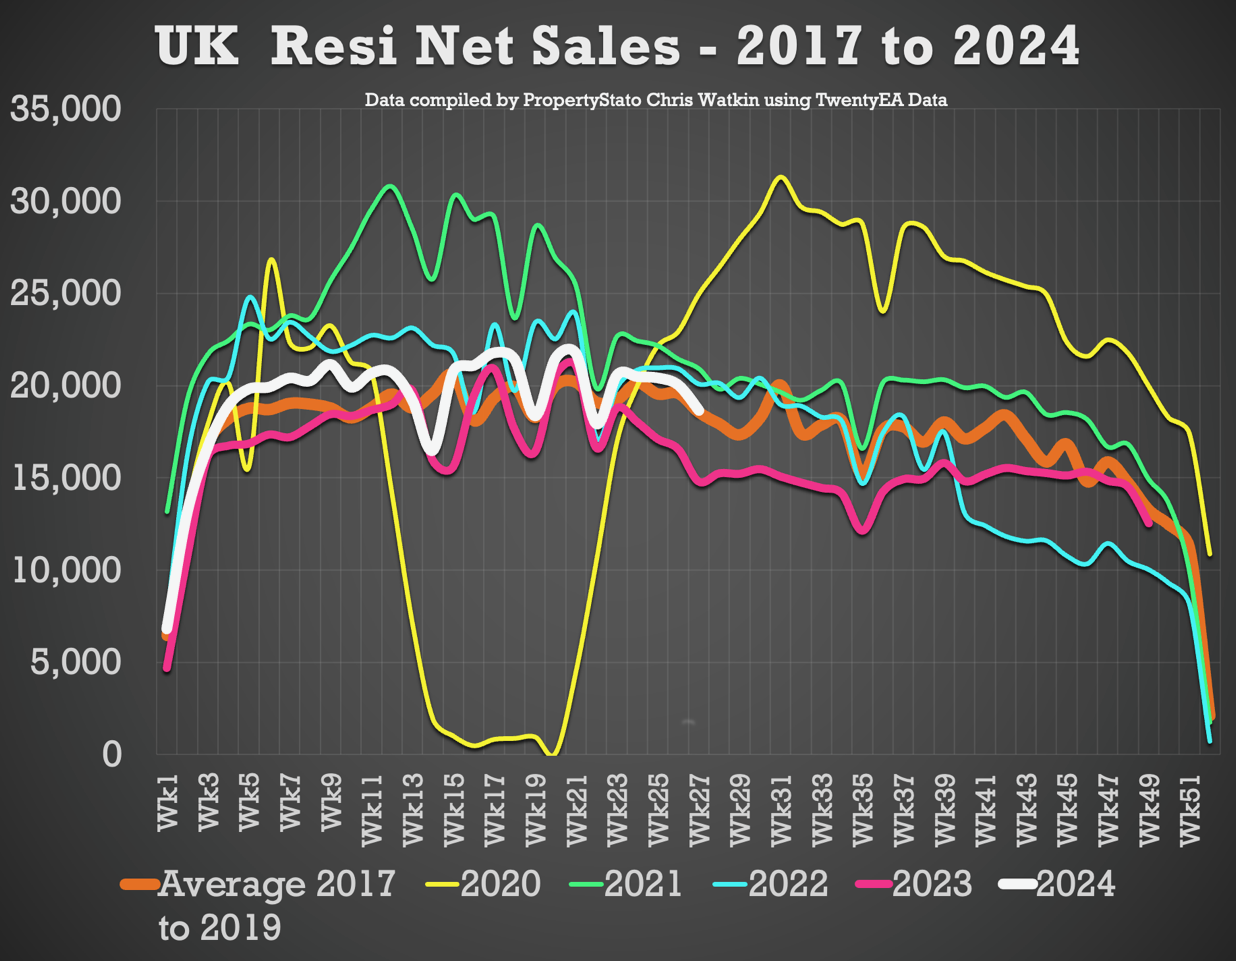
+ Net Sales – 18,656 this week, 25.9% higher than the same week in 2023.
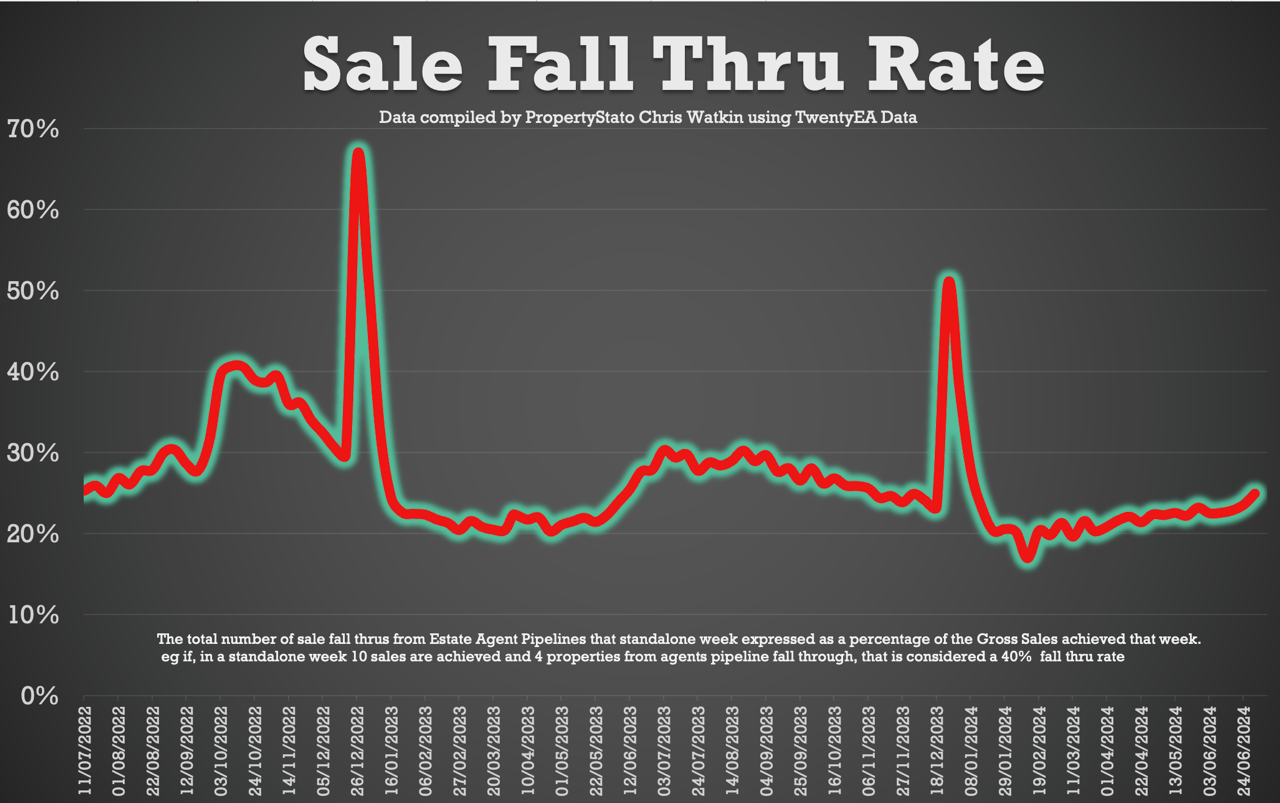
+ Sale fall-throughs – Only fly in the ointment is sale fall thru rate rising. For the last few months its been around the 21% to 22% range, yet in the last few weeks its been towards the mid 20’s. This week it crept up again to 24.95% – Yet, everything in context, the 7 year Long Term Average is 24.8% and it was 40%+ in the Truss Budget.
Chris’s In-Depth Analysis (Week 27) :
New Properties to Market: The UK saw 34,672new listings. This year’s YTD listings stand at 958,941, 11% higher than the historical 8 year YTD average of 849,056, 7.3% higher than YTD 2017/18/19 and 8% higher YTD 2023. Weekly 2024 average : 35,516.
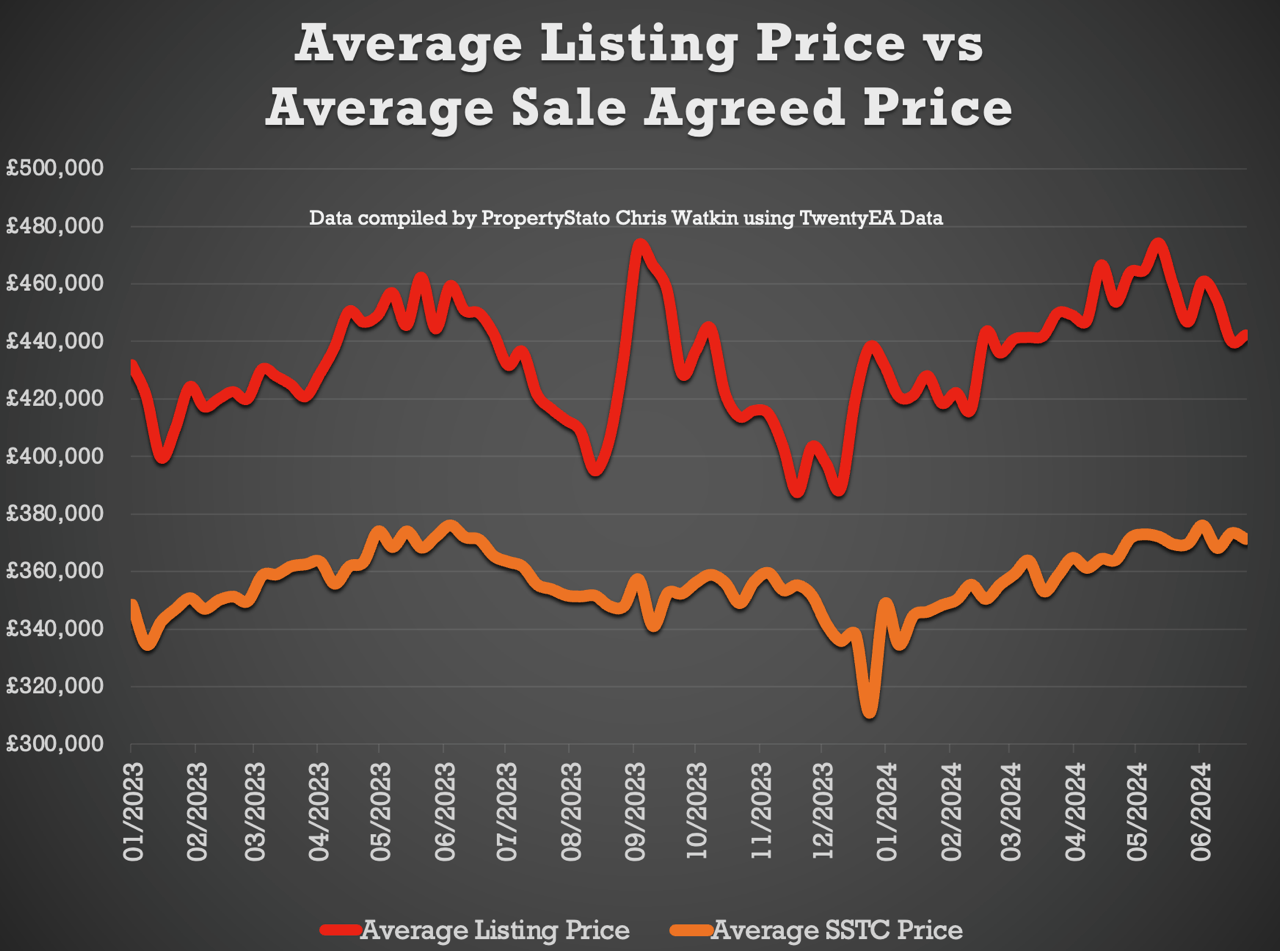
Average Listing Price: £456,007.
Average Asking Price of this week’s Listings vs Average Asking Price of the Properties that Sale Agreed this week: 24.4%. Again, Its back to levels that we’ve seen in the spring and again, I think it’s just a bit too much. Some of this is overvaluing and some of it is that high price properties have a lower propensity to sell and there’s been more of those coming on the market. The long-term average is between 16% and 17%.
Price Reductions: Last week, 19,161 properties saw price reductions, higher compared to the 8-year Week 27 average of 17,960. Yet there is higher stock levels. Stock June levels are at 700,524. This means 1 in 8.6 properties each month are being reduced.
Average Asking Price for Reduced Properties: £389,446.
Gross Sales: 24,858 properties were sold stc last week (2024 weekly average : 24,669 Gross Sales).
Accumulative Gross Sales YTD: The total YTD stands at 666,059, exceeding the average YTD Gross sales figure of 624,455 from 2017/18/19 and 602,866 in the same week 27 in 2023.
Average Asking Price of Sold STC Properties: Still staying in the mid £360/380k’s range (like has been for 2 years) at £366,672.
Sale Fall Throughs: Fall thrus this week at 6,202. Last 3 months weekly average 5,977.
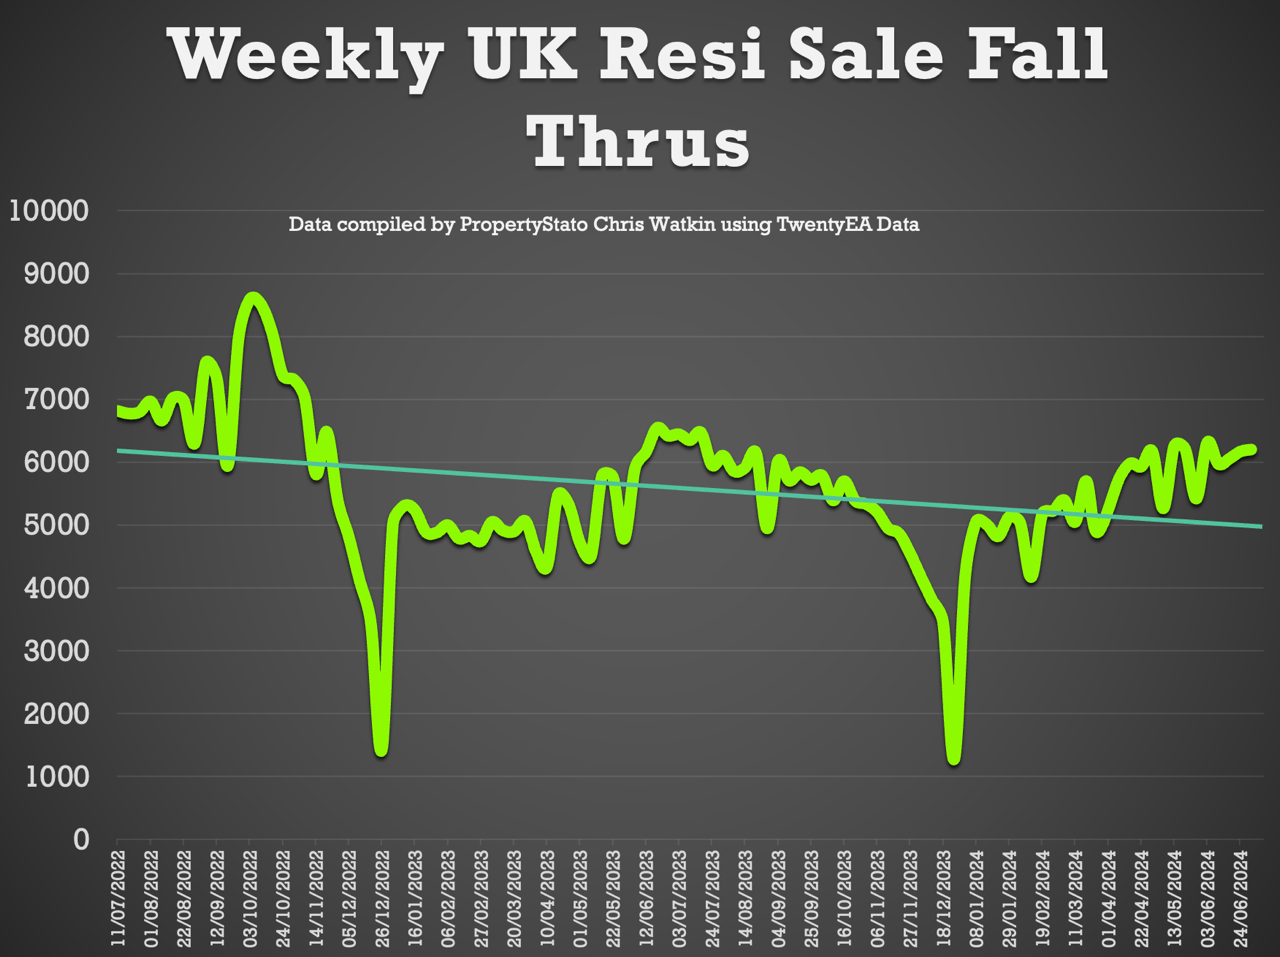
Sale Fall Through % Rate: 25.95% for week 27. (Comparison – 22.64% for the last 3 months, whilst the long term 8 years average is 24.8% & it was 40%+ in Q4 2022 – the Truss budget!)
Net Sales – 18,656.
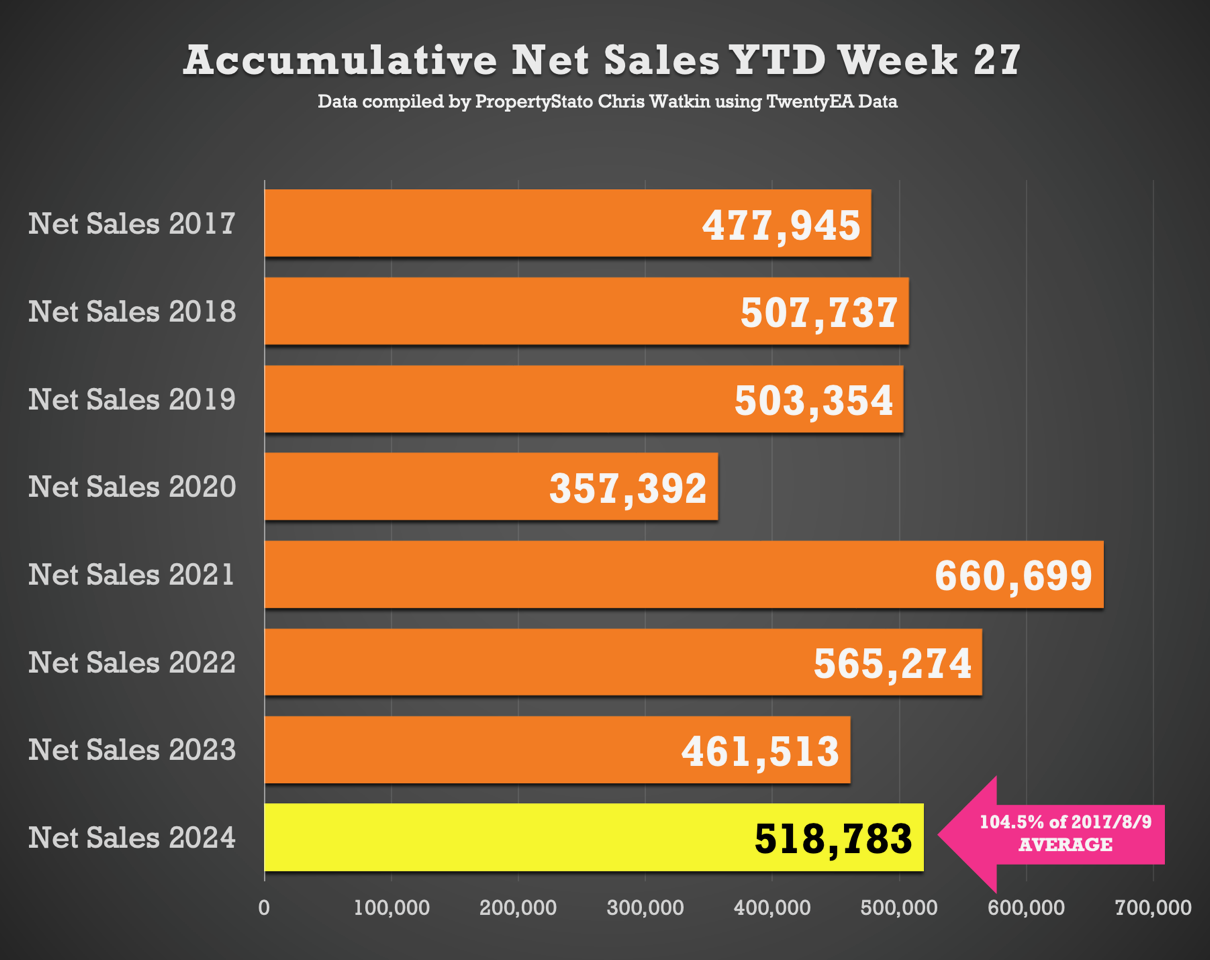
Accumulative Net Sales YTD: The total stands at 518,783, 4.5% higher the 17/18/19 YTD Net sales average (496,345) and 12.4% higher than the YTD figure for 2023 for Net Sales.
House Prices on the House sales agreed (SSTC) in July MTD is £348/sq.ft. For comparison, June was £347/sq.ft, May ’24 in £343/sq.ft, April ’24 – £341/sq.ft, March ’24 – £337/sq.ft, Feb ’24 -£335/sq.ft & Jan ’24 to £328/sq.ft).
This week’s local focus is on Canterbury.
Comments are closed.