

 Christopher Watkin is this week joined by special guest, James Forrester, to talk about the current state of play in the UK Property Market for the week ending Sunday, 5th November 2023 (Week 44).
Overall, the UK Property Market is battling the storm well.
Currently there are 664,373 UK properties for sale, compared to 522,497 twelve months ago – so stock is rising.
UK estate agents sales pipelines at the end of October stood at 403,087 residential sales (units) down from 410,826 on the 30th September 2023. Don’t forget the average end of October sales pipeline of sales for 2017/8/9 was 370,433.
Fly in the ointment – Overvaluing still seems to be an issue.
Year to date (YTD) headlines:
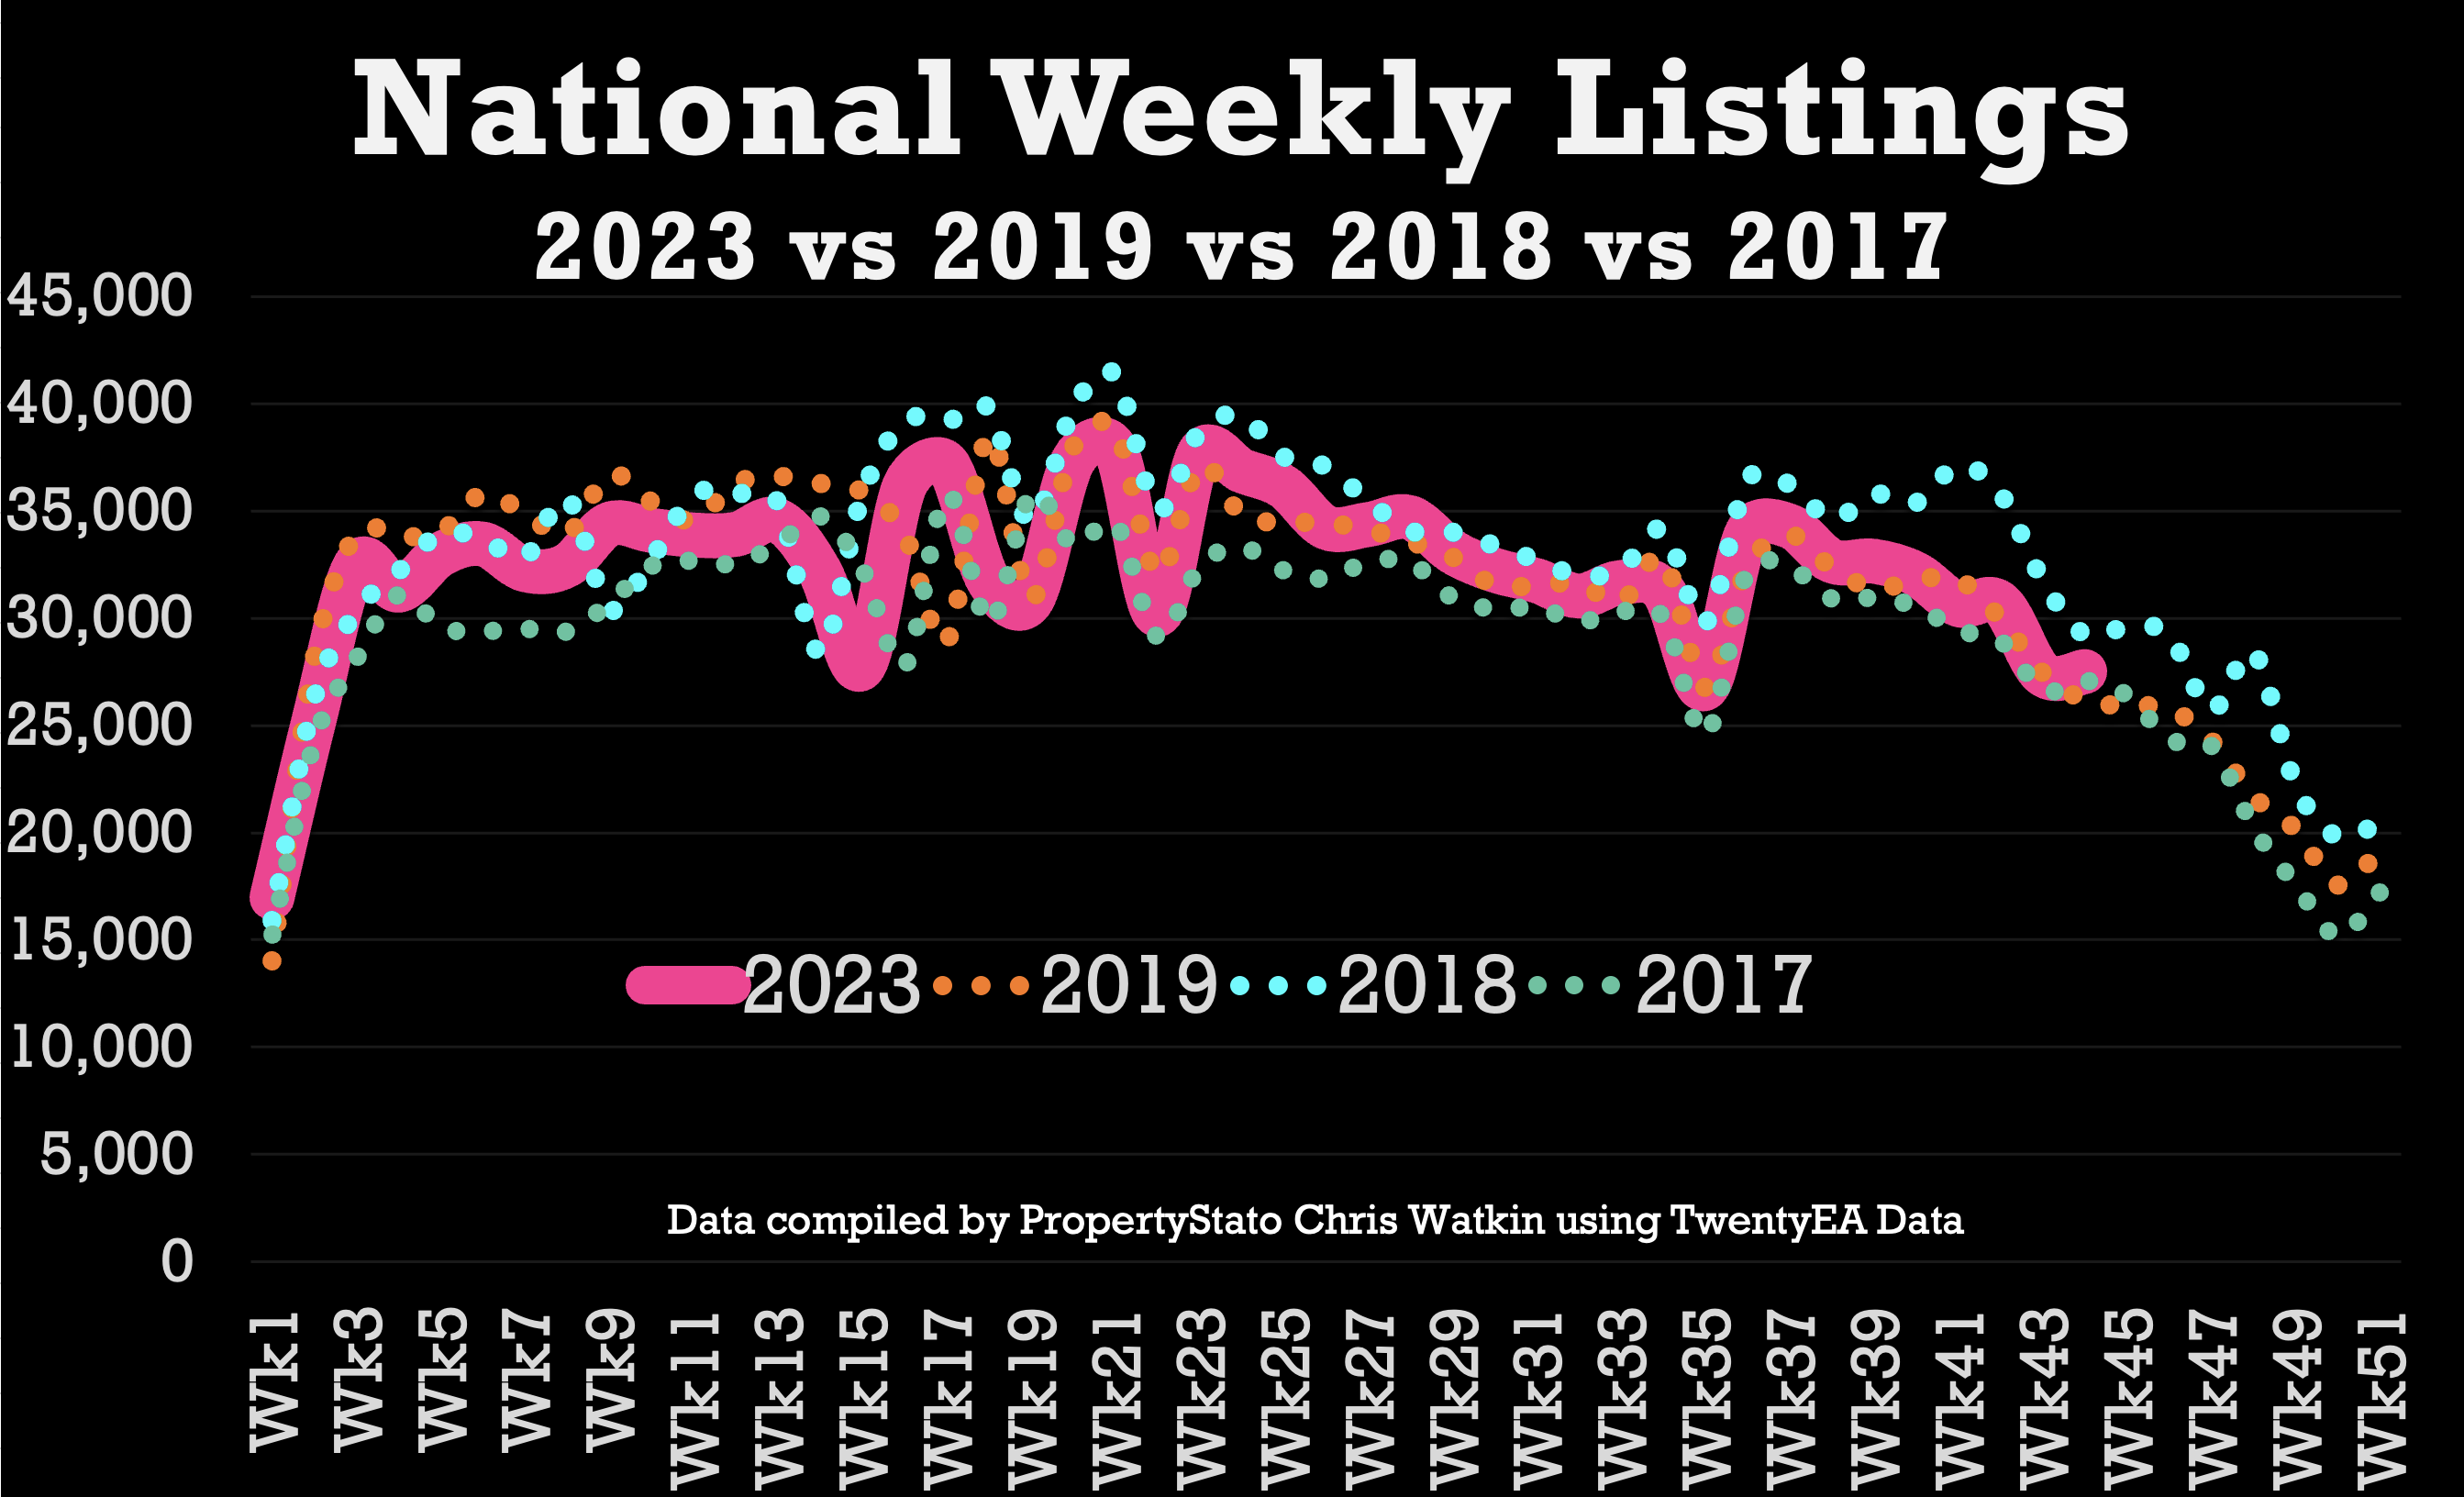
Listings YTD 2023 are 99.4% of the 2017/8/9 YTD average (last week 99.4%)
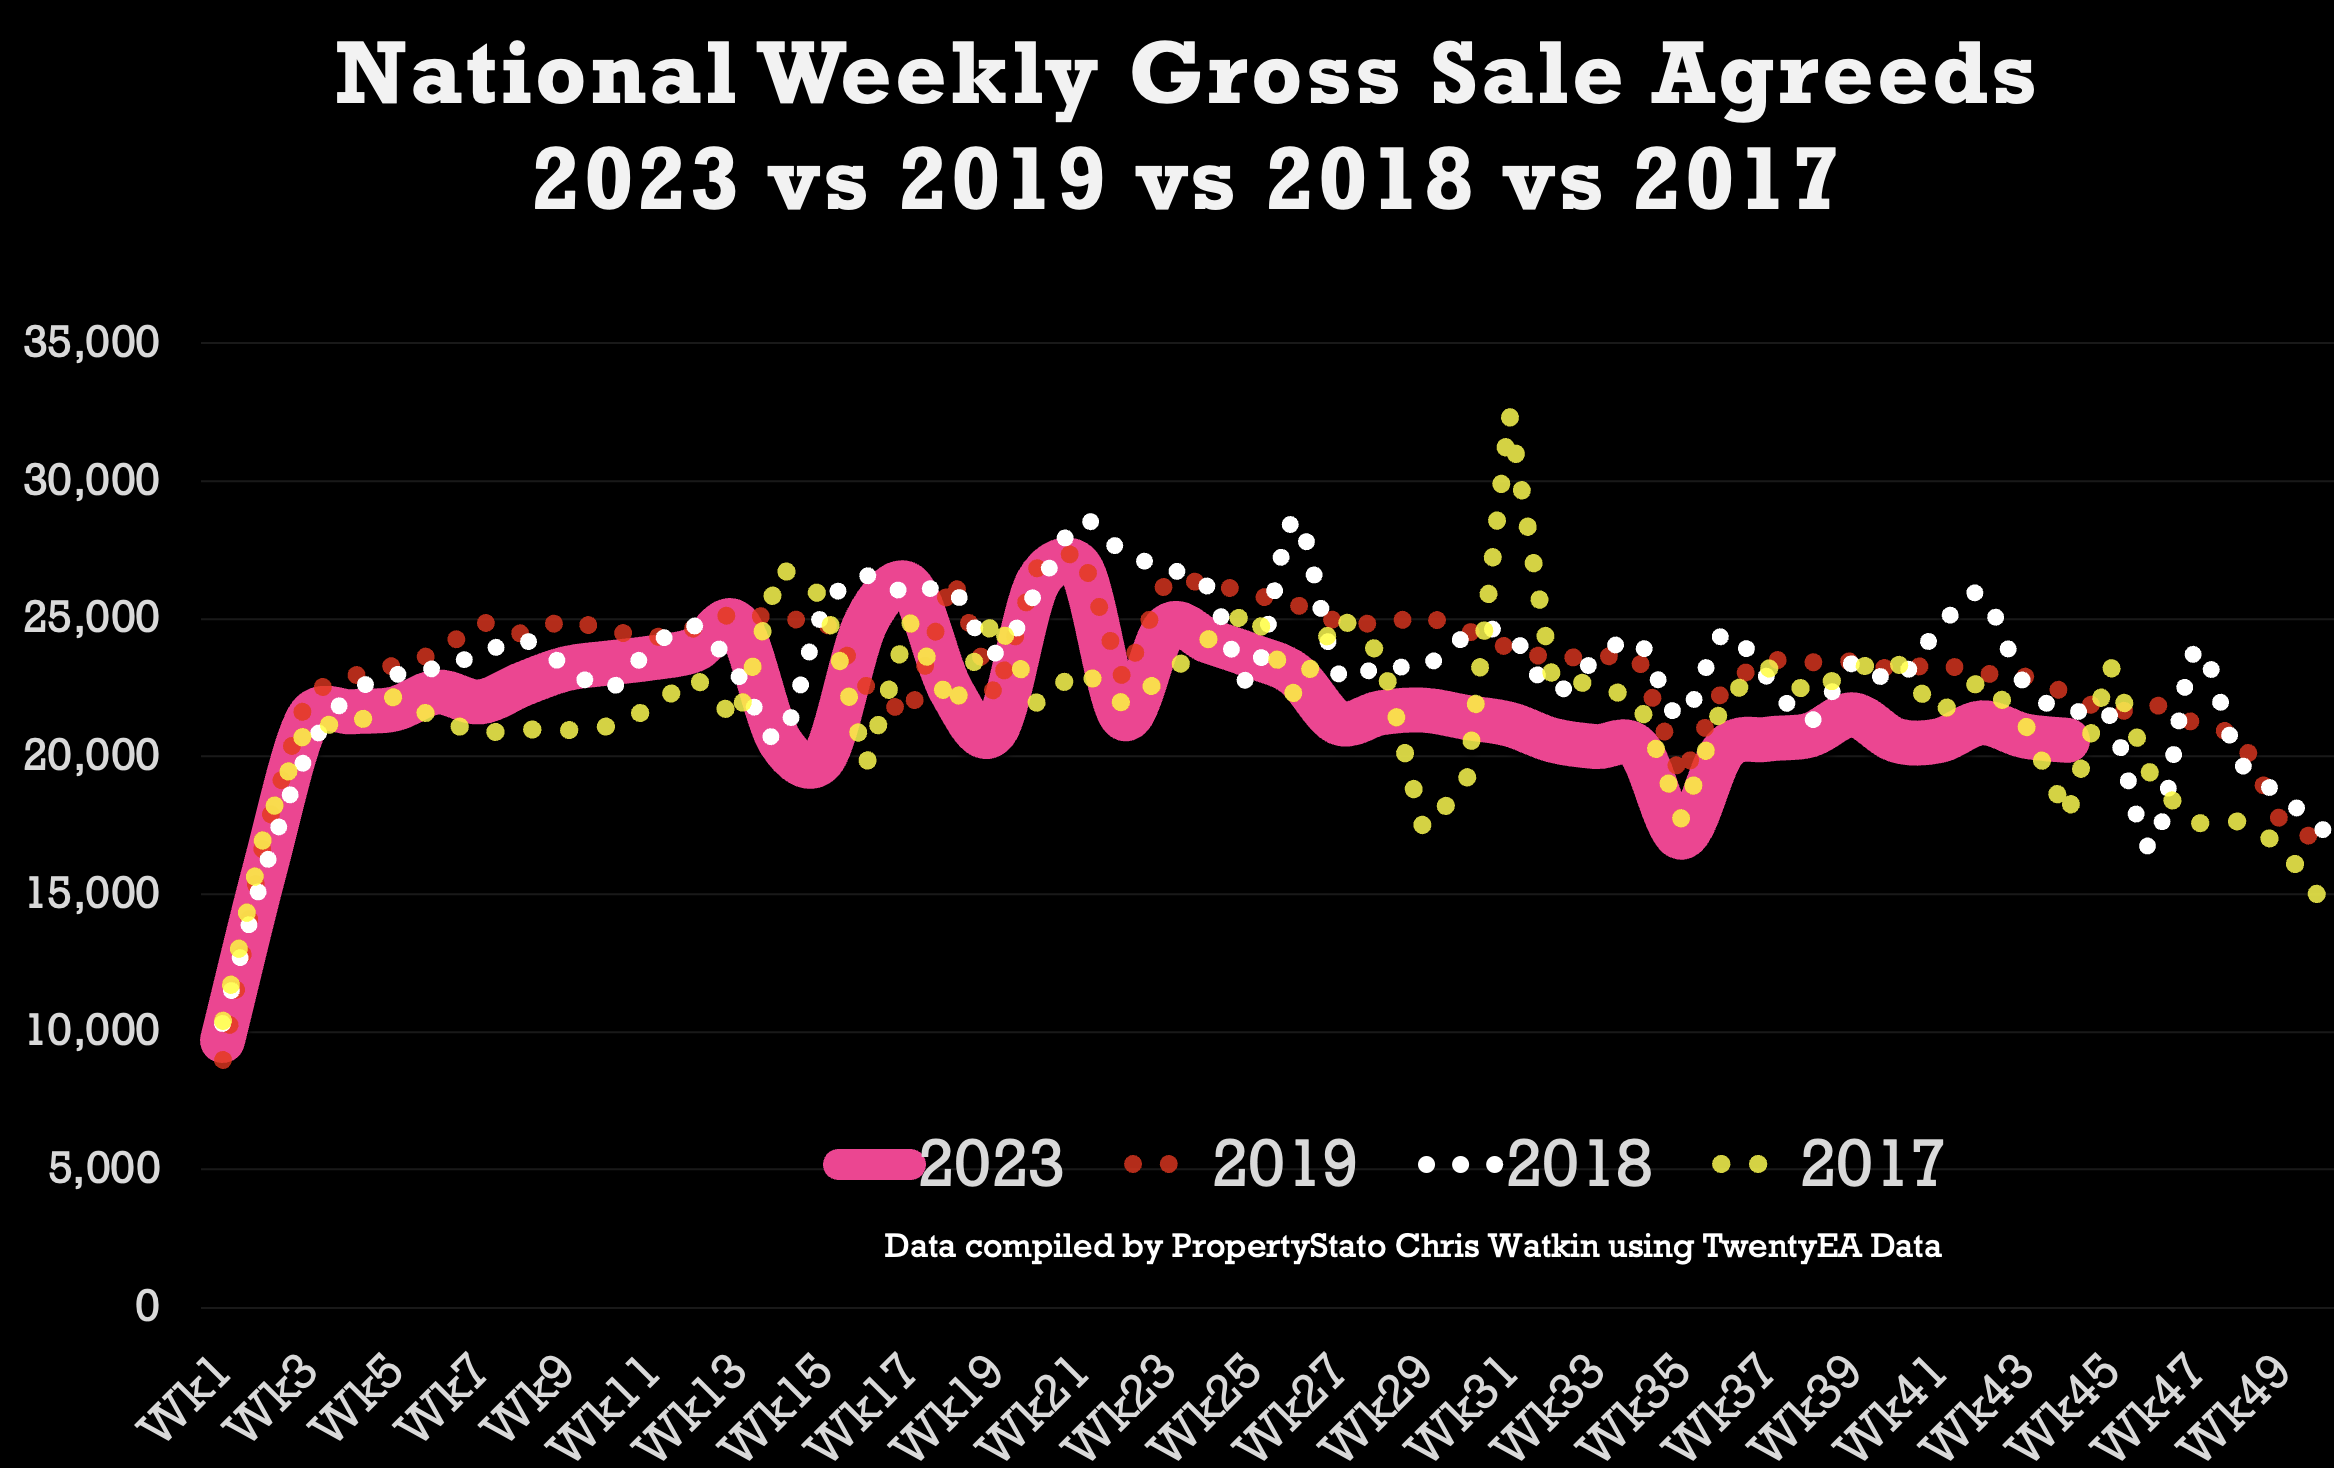
Gross Sales YTD 2023 are 94.1% of the 2017/8/9 YTD average (last week 94.0%)
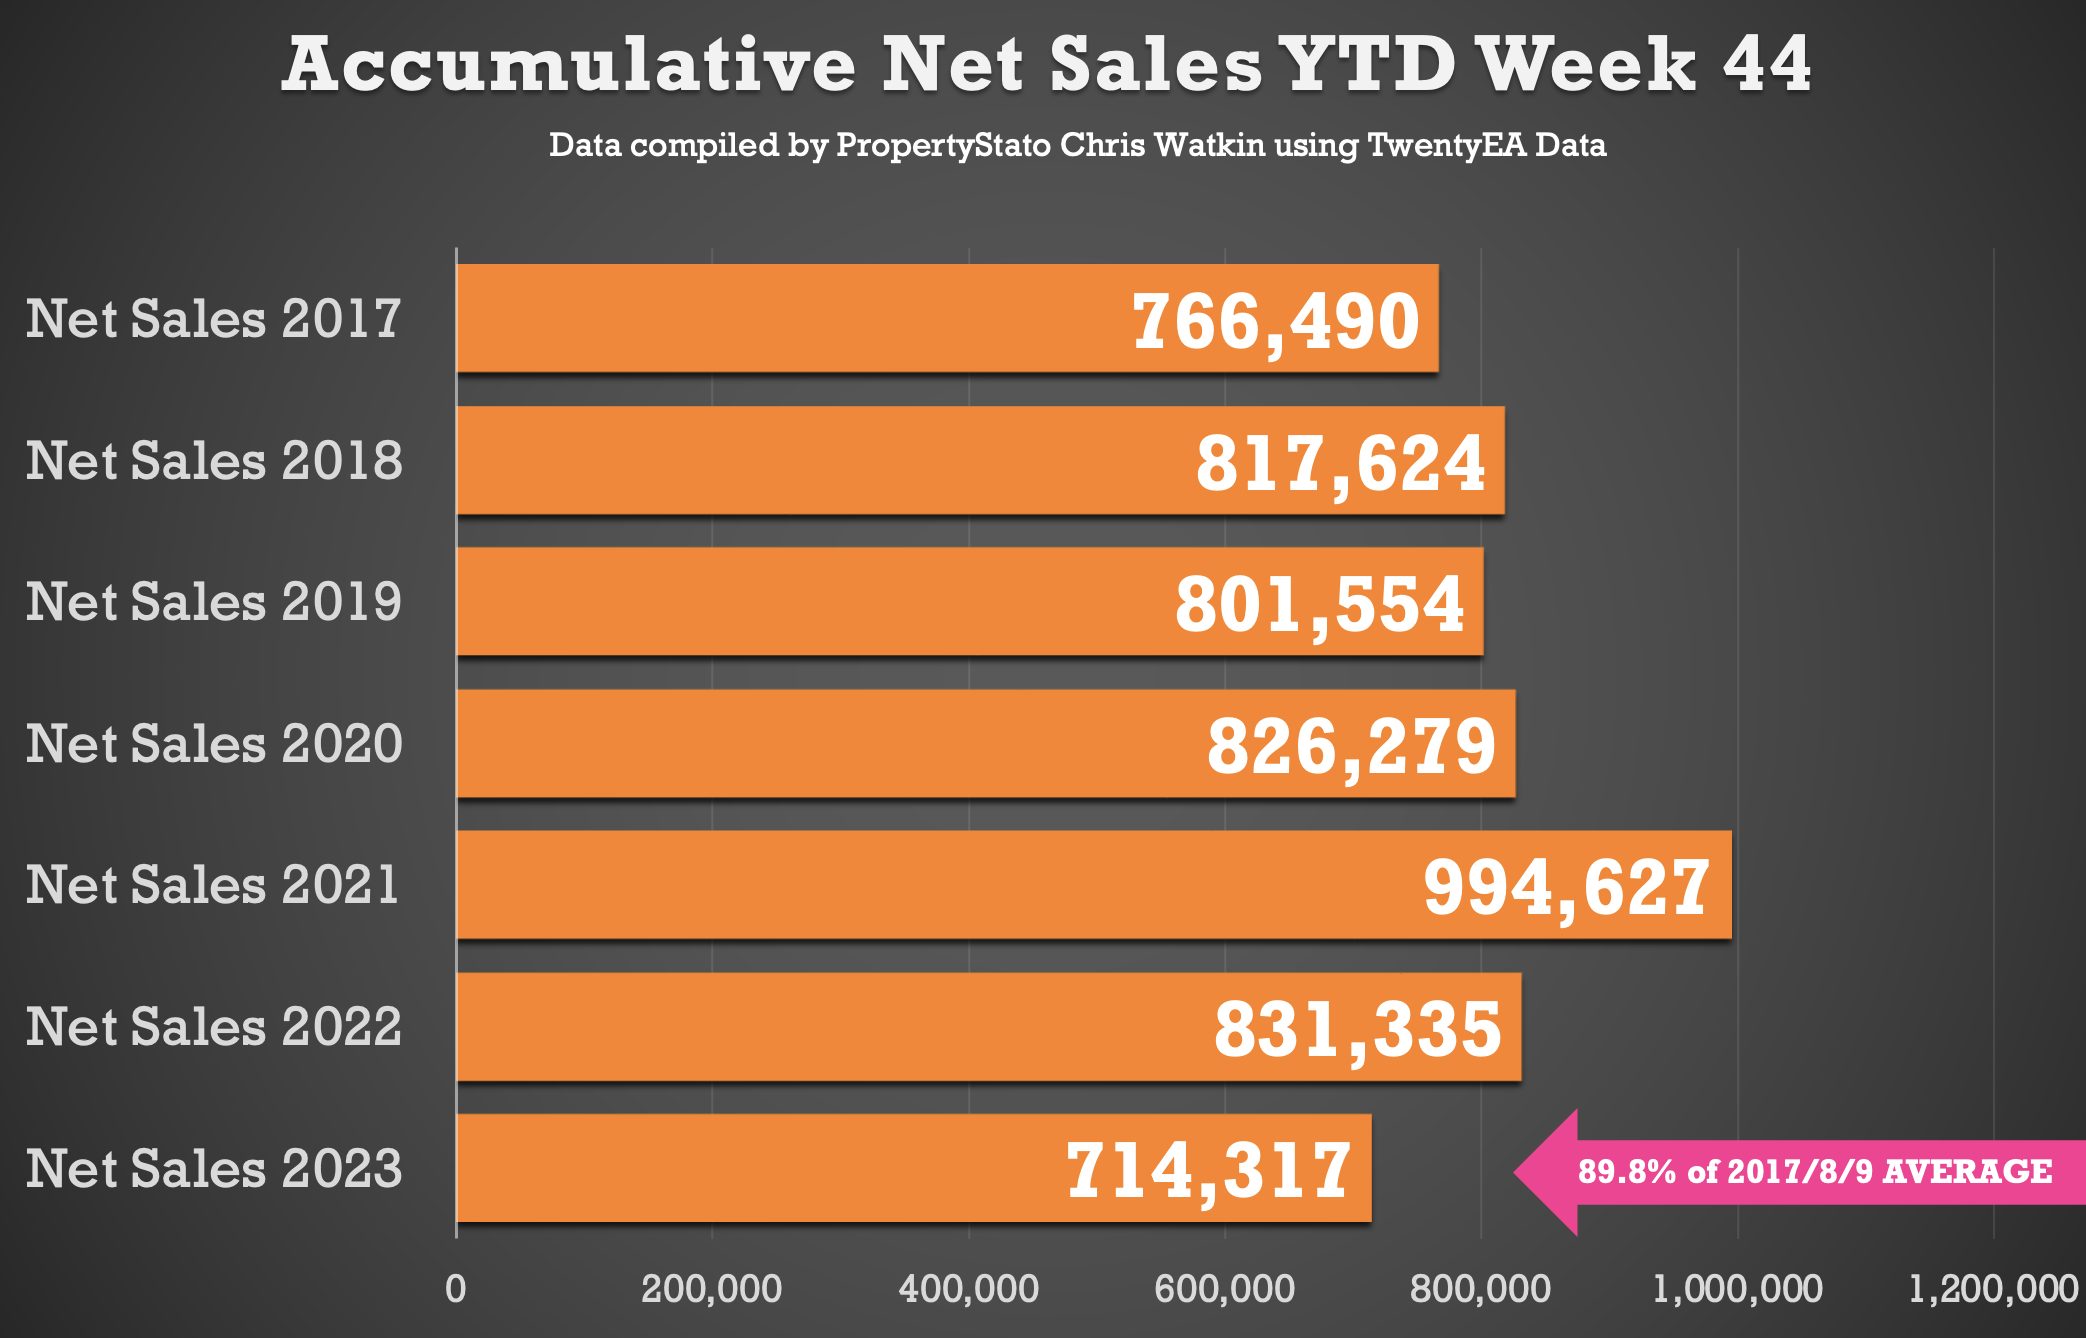
Net Sales YTD 2023 are 89.8% of the 2017/8/9 YTD average (last week 89.7%)
Looking at statistics in more detail.
· New Properties to the Market (Listings): The number of listings last week was 27,500 (Average for the last 4 weeks 29,050). The 2023 YTD running weekly average stands strong at 32,347.
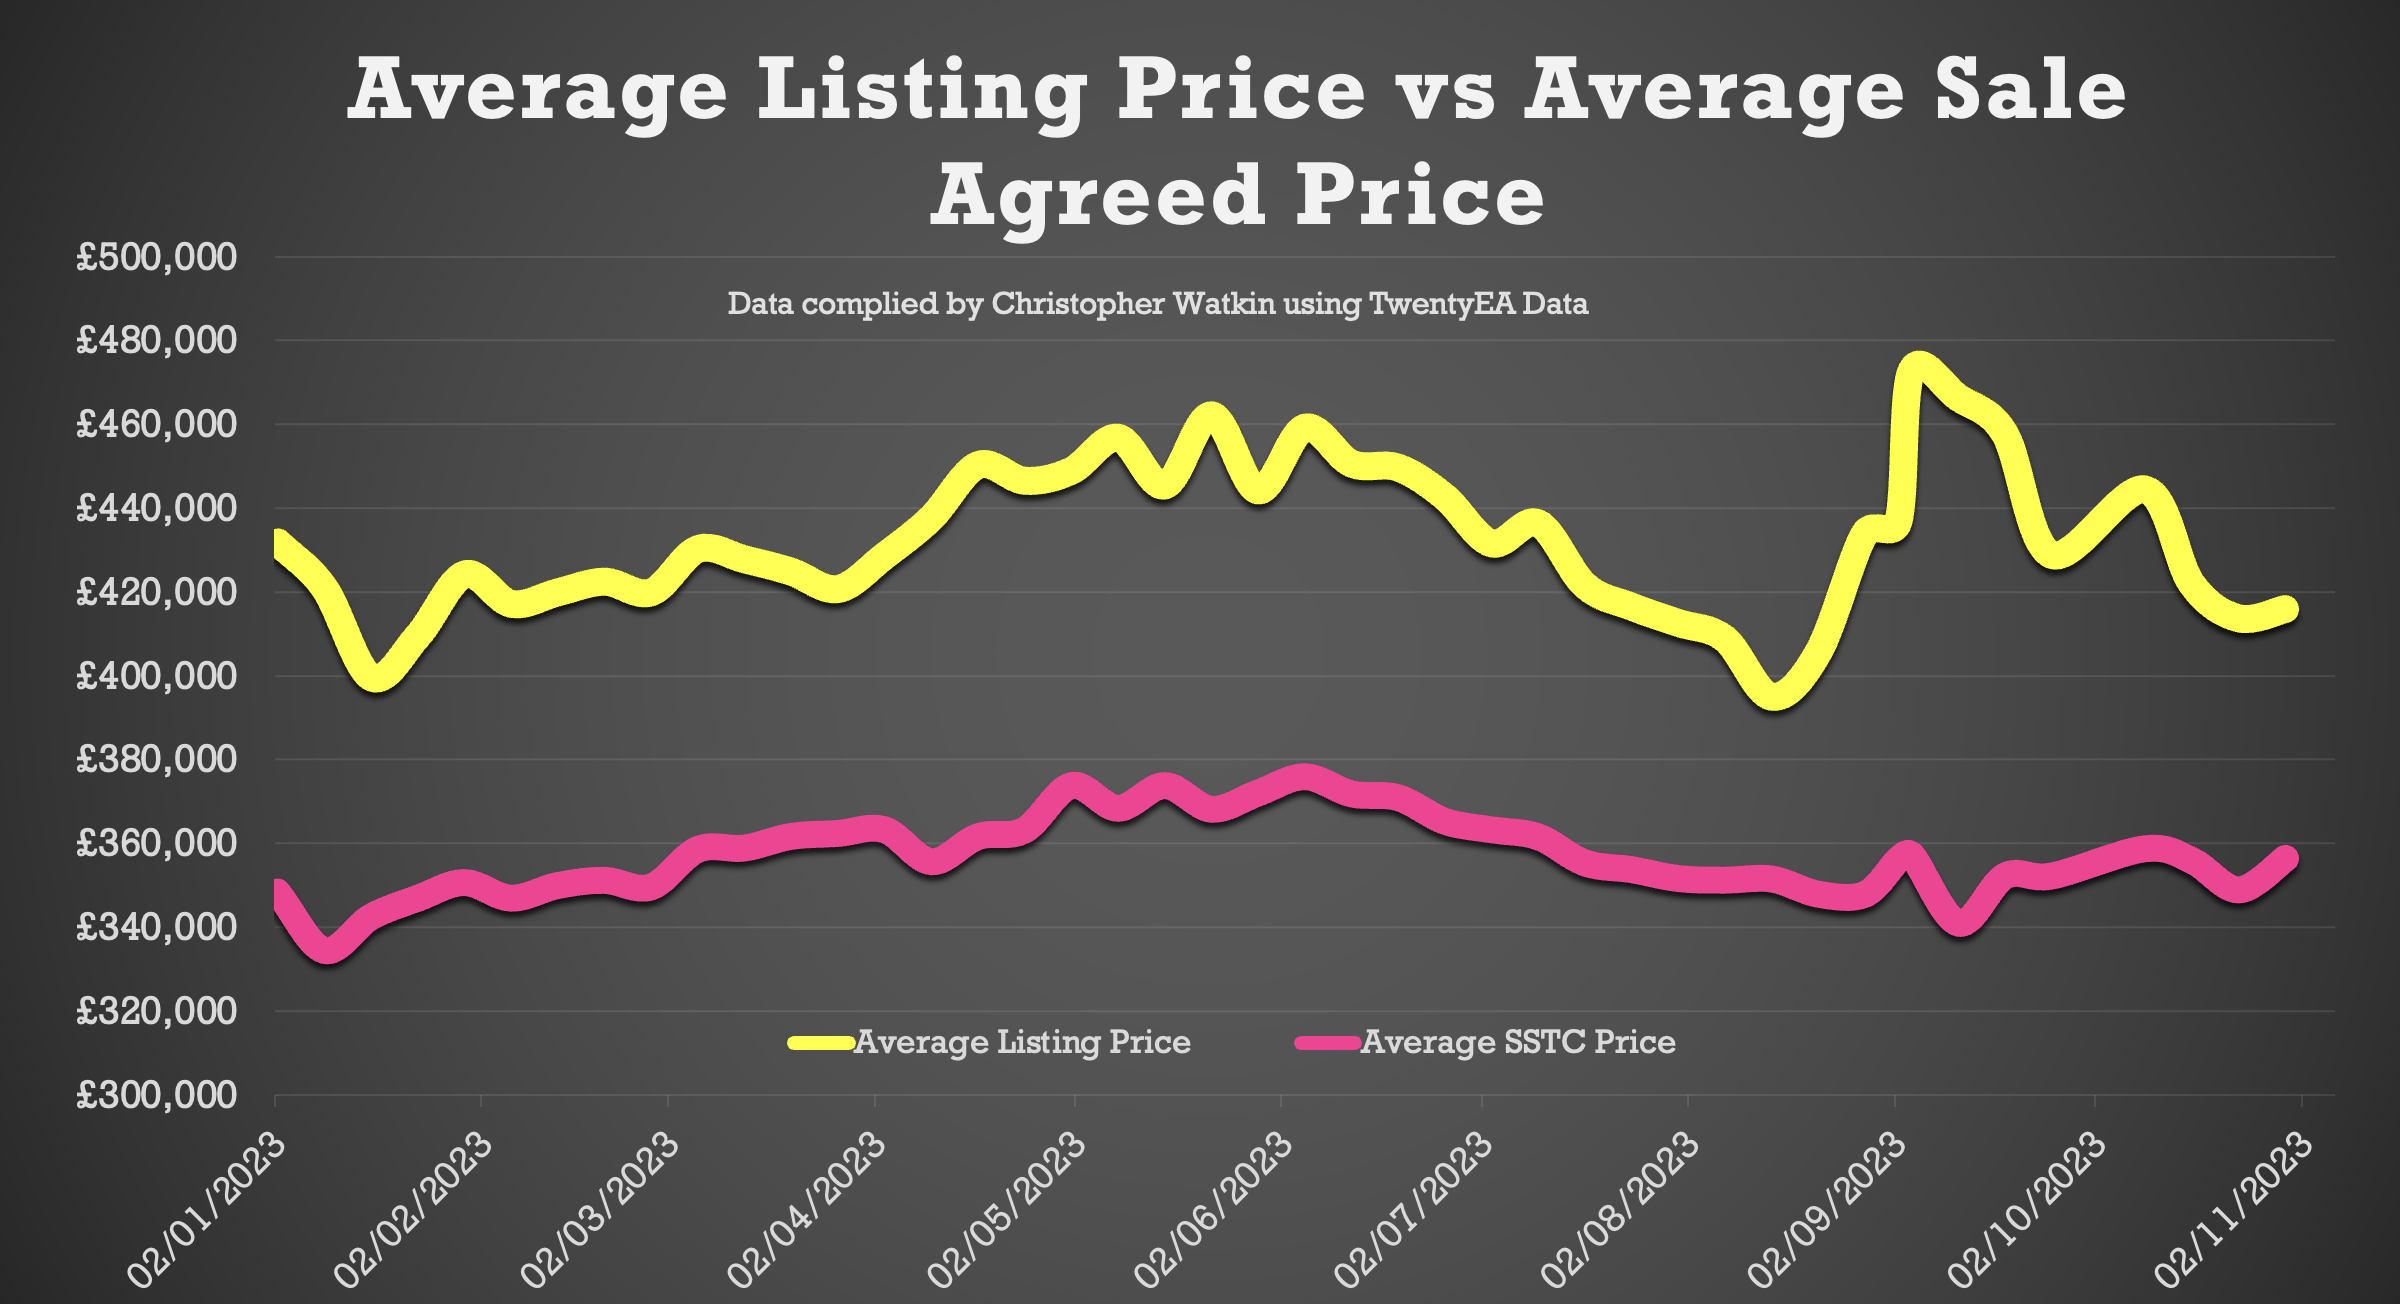
· Average Listing Price: The average listing price has been reducing in the last few weeks. Average Listing price this week £415,891. The 2023 running weekly average of £432,116.
· % Difference between Listing and Sale Agreed Prices: This week has dropped to 17% which means it continues to be below the important 20% barrier which is better for the property market. 2023 YTD average 21% and long term 7 year average 17%.
· Price Reductions: 21,295 price reductions were seen last week which about the same as last week. The 2023 running weekly average is 20,383 per week. This means approximately 14.2% of Resi Stock is being reduced per month (ie just under 1 in 7)
· Average Asking Price of Properties Being Reduced: This week’s average asking price of reduced properties £395,960 (similar to last week). The 2023 running weekly average of £403,286.
· Number of Properties Sold (Gross Sales): Gross sales are similar to last week. Total number of gross sales in the UK last week was 20,608. For comparison, the 2023 running weekly average is 21,689 weekly sales (stc).
· Average Asking Price of Properties Sold STC this Week: The average asking price of the properties selling last week was £356,510, which has remained quite static over the last few months. The 2023 running weekly average of £357,108.
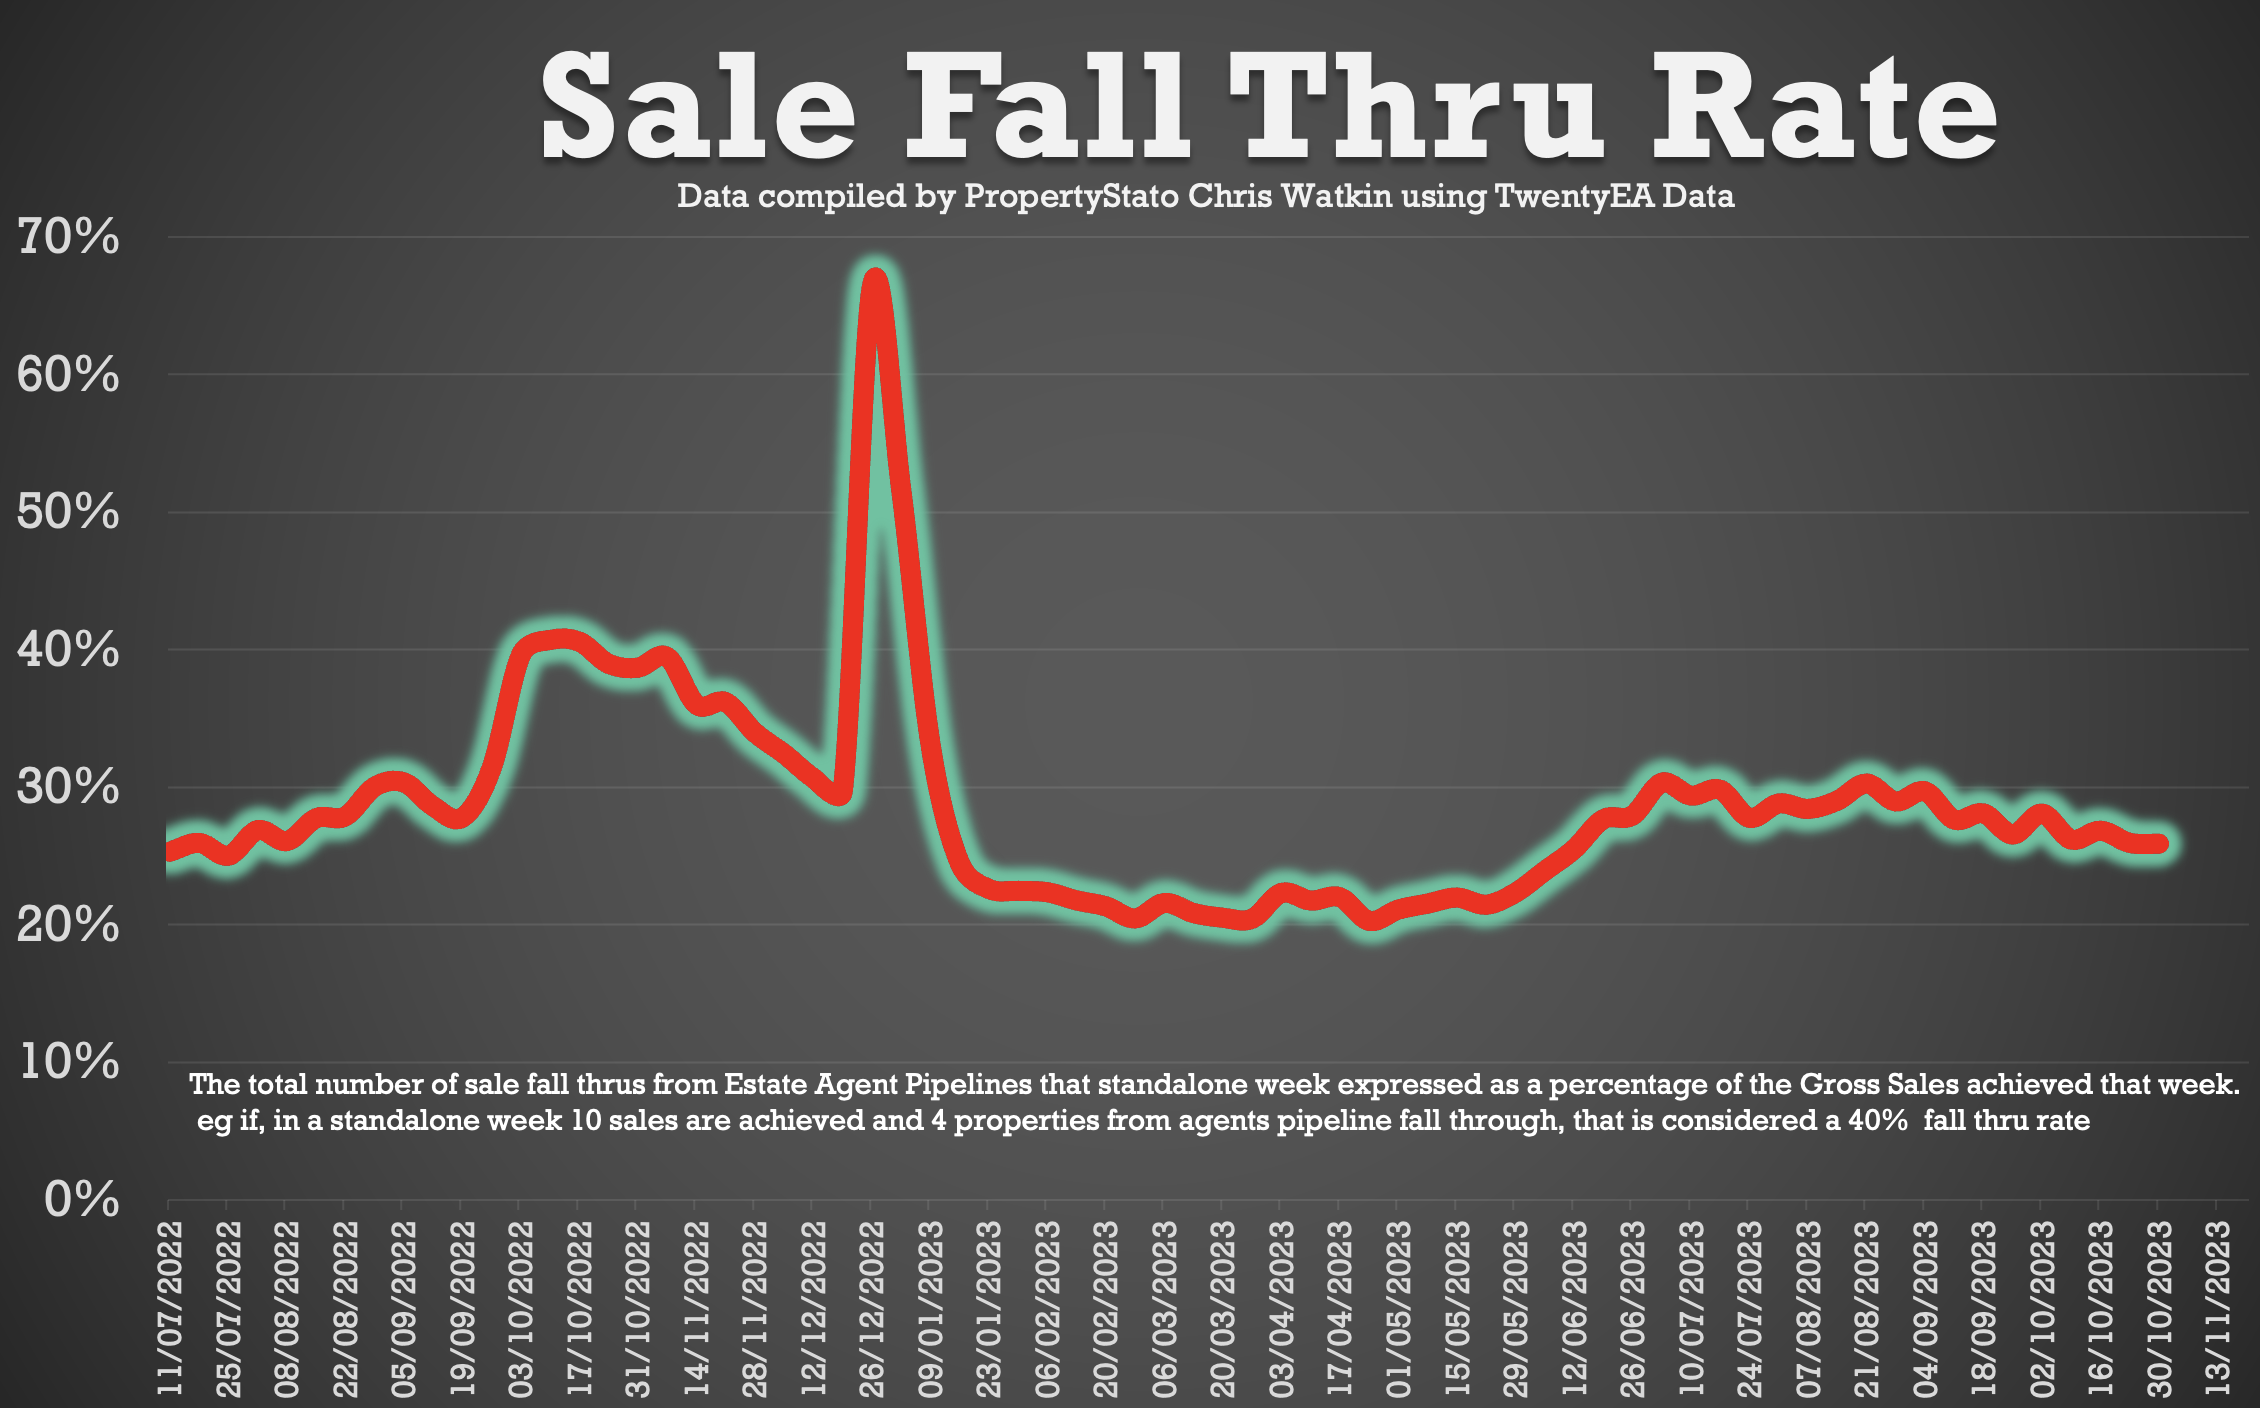
Sale Fall Throughs (Units): there are 5,334 sale for Throughs, which is similar to last week’s before at 5,389. The running four-week average for Sale Fall Thrus is 5,494 and the YTD figure average of 5,454.
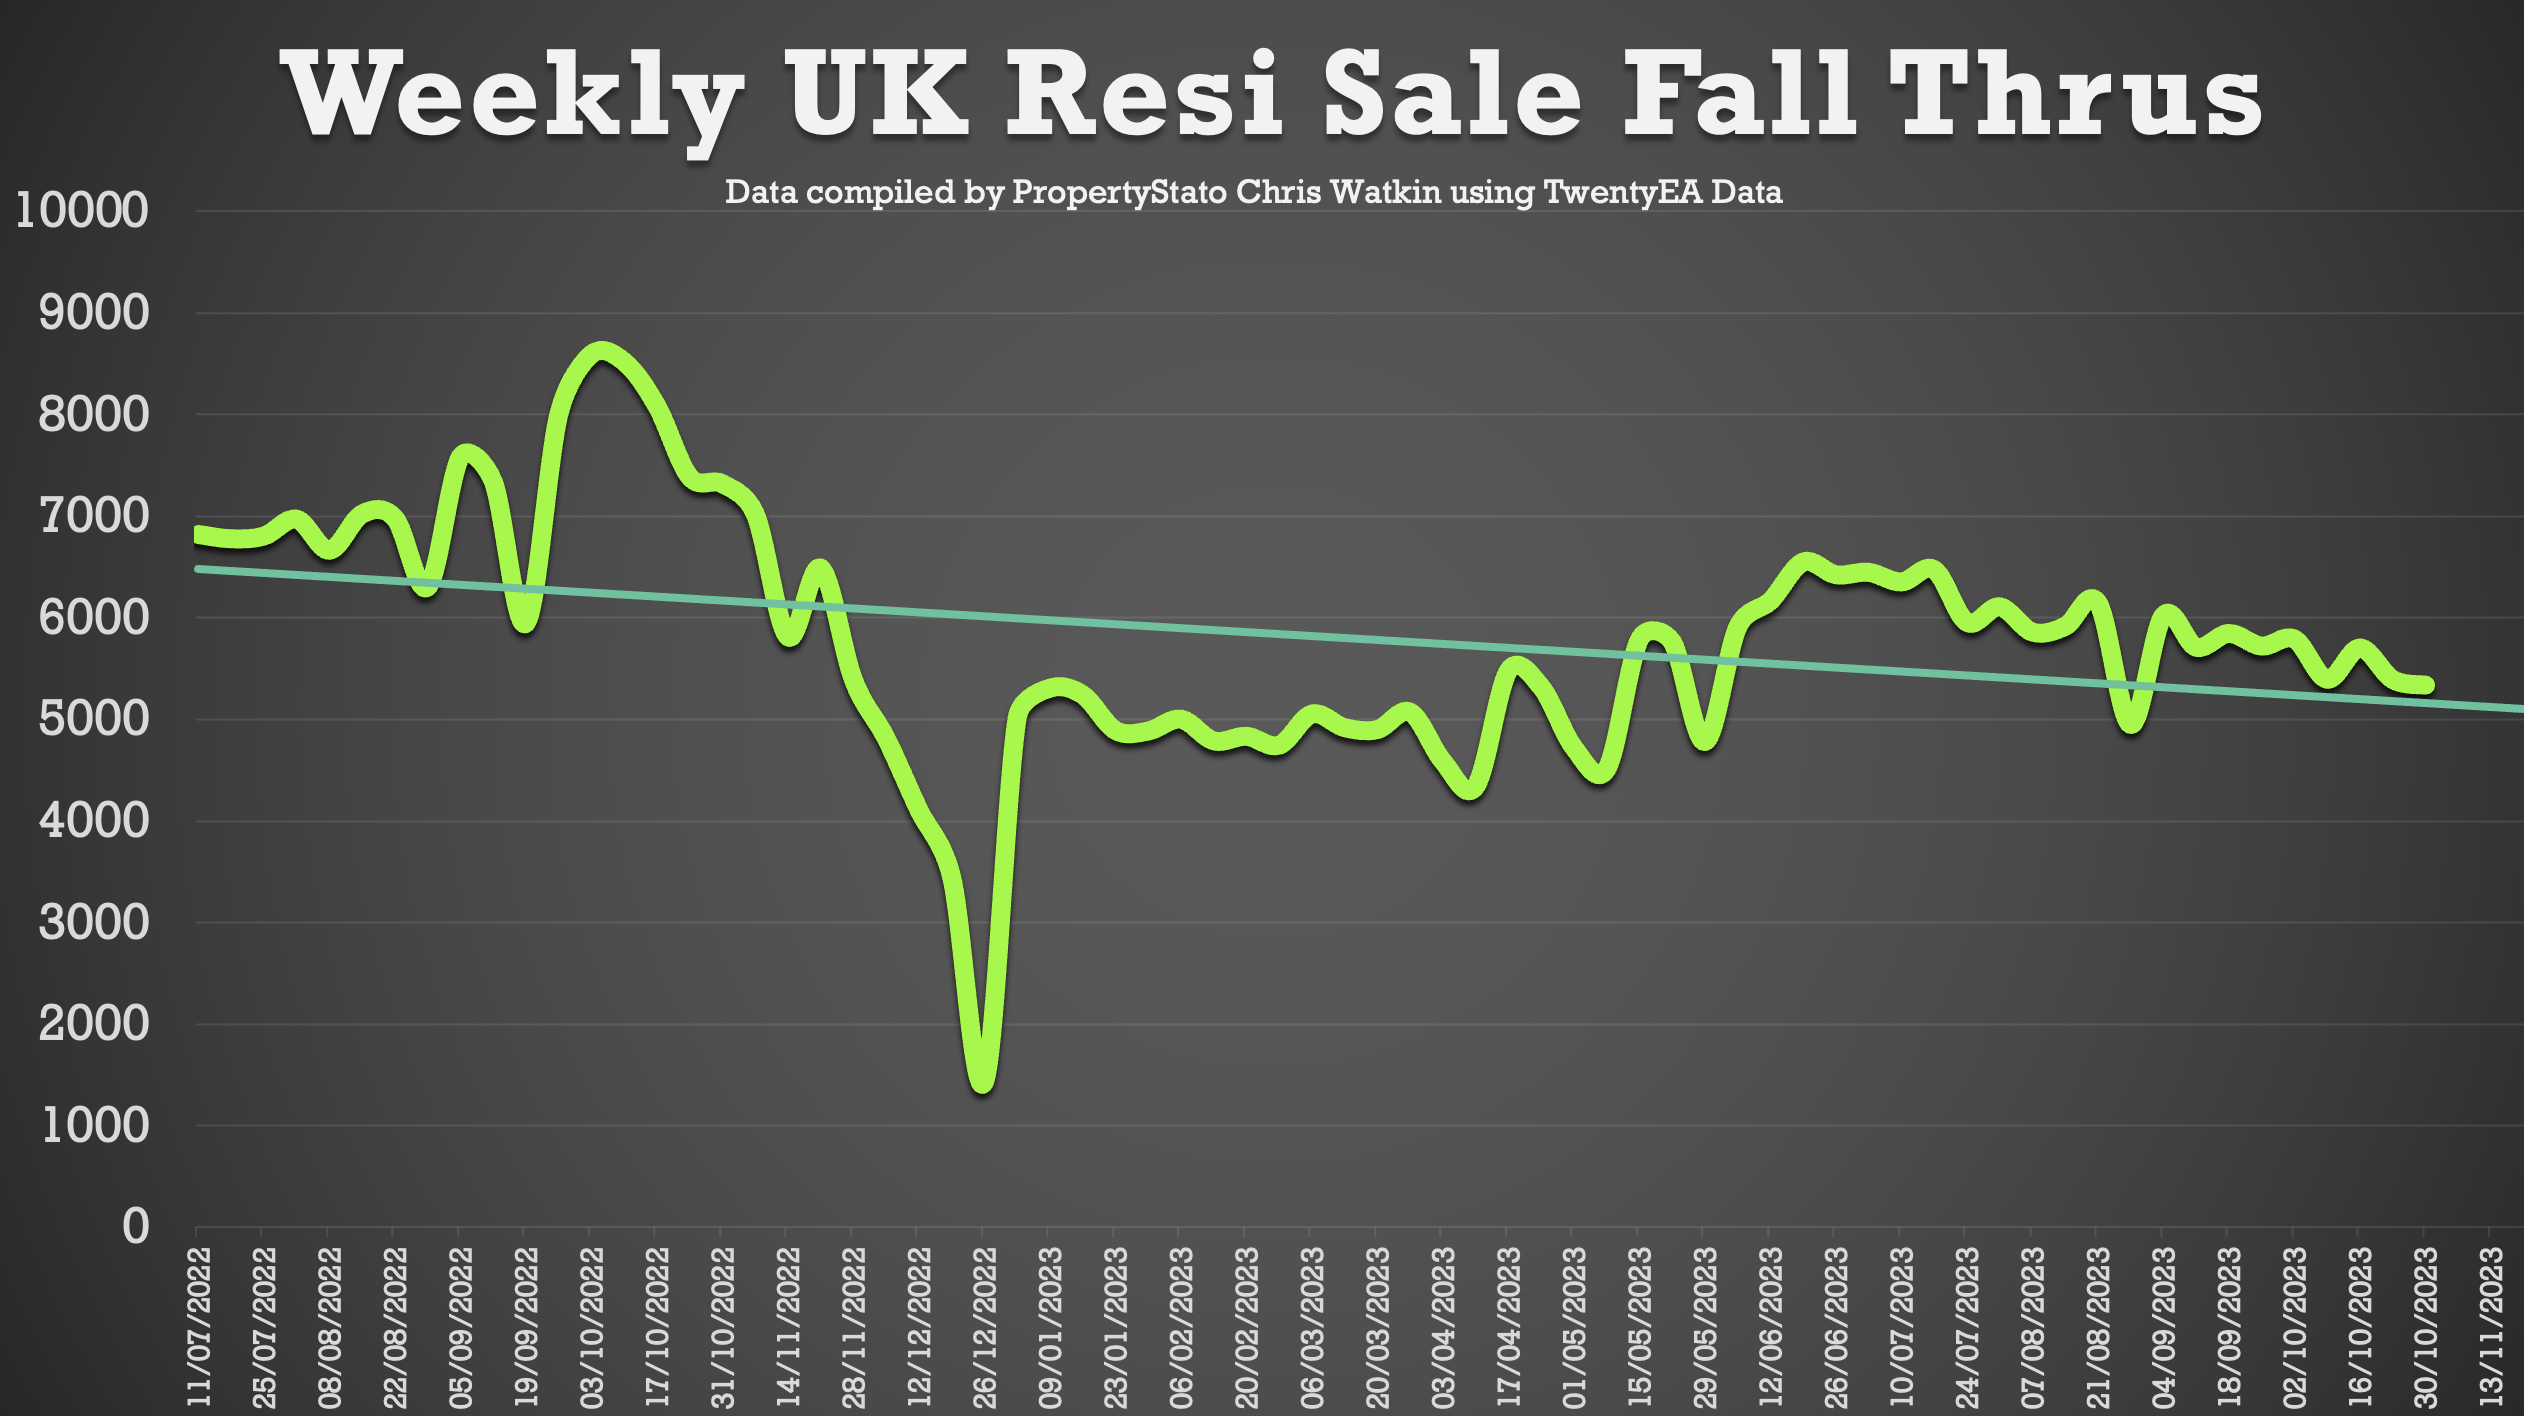
· Sale Fall Throughs (Percentage): The Sale fall Thru Rate % is the number of sales fall Thrus for the week expressed as a percentage of Gross Sales for the week). This week it is at 25.88%. This is a continuation of drop that started in early August 2023 when it was in the early 30%’s. The 2023 running weekly average is 25.70%. Let us not forget, in the same week of 2022 (Week 44), it was 38.69%). The seven-year long-term average is 24.3%.
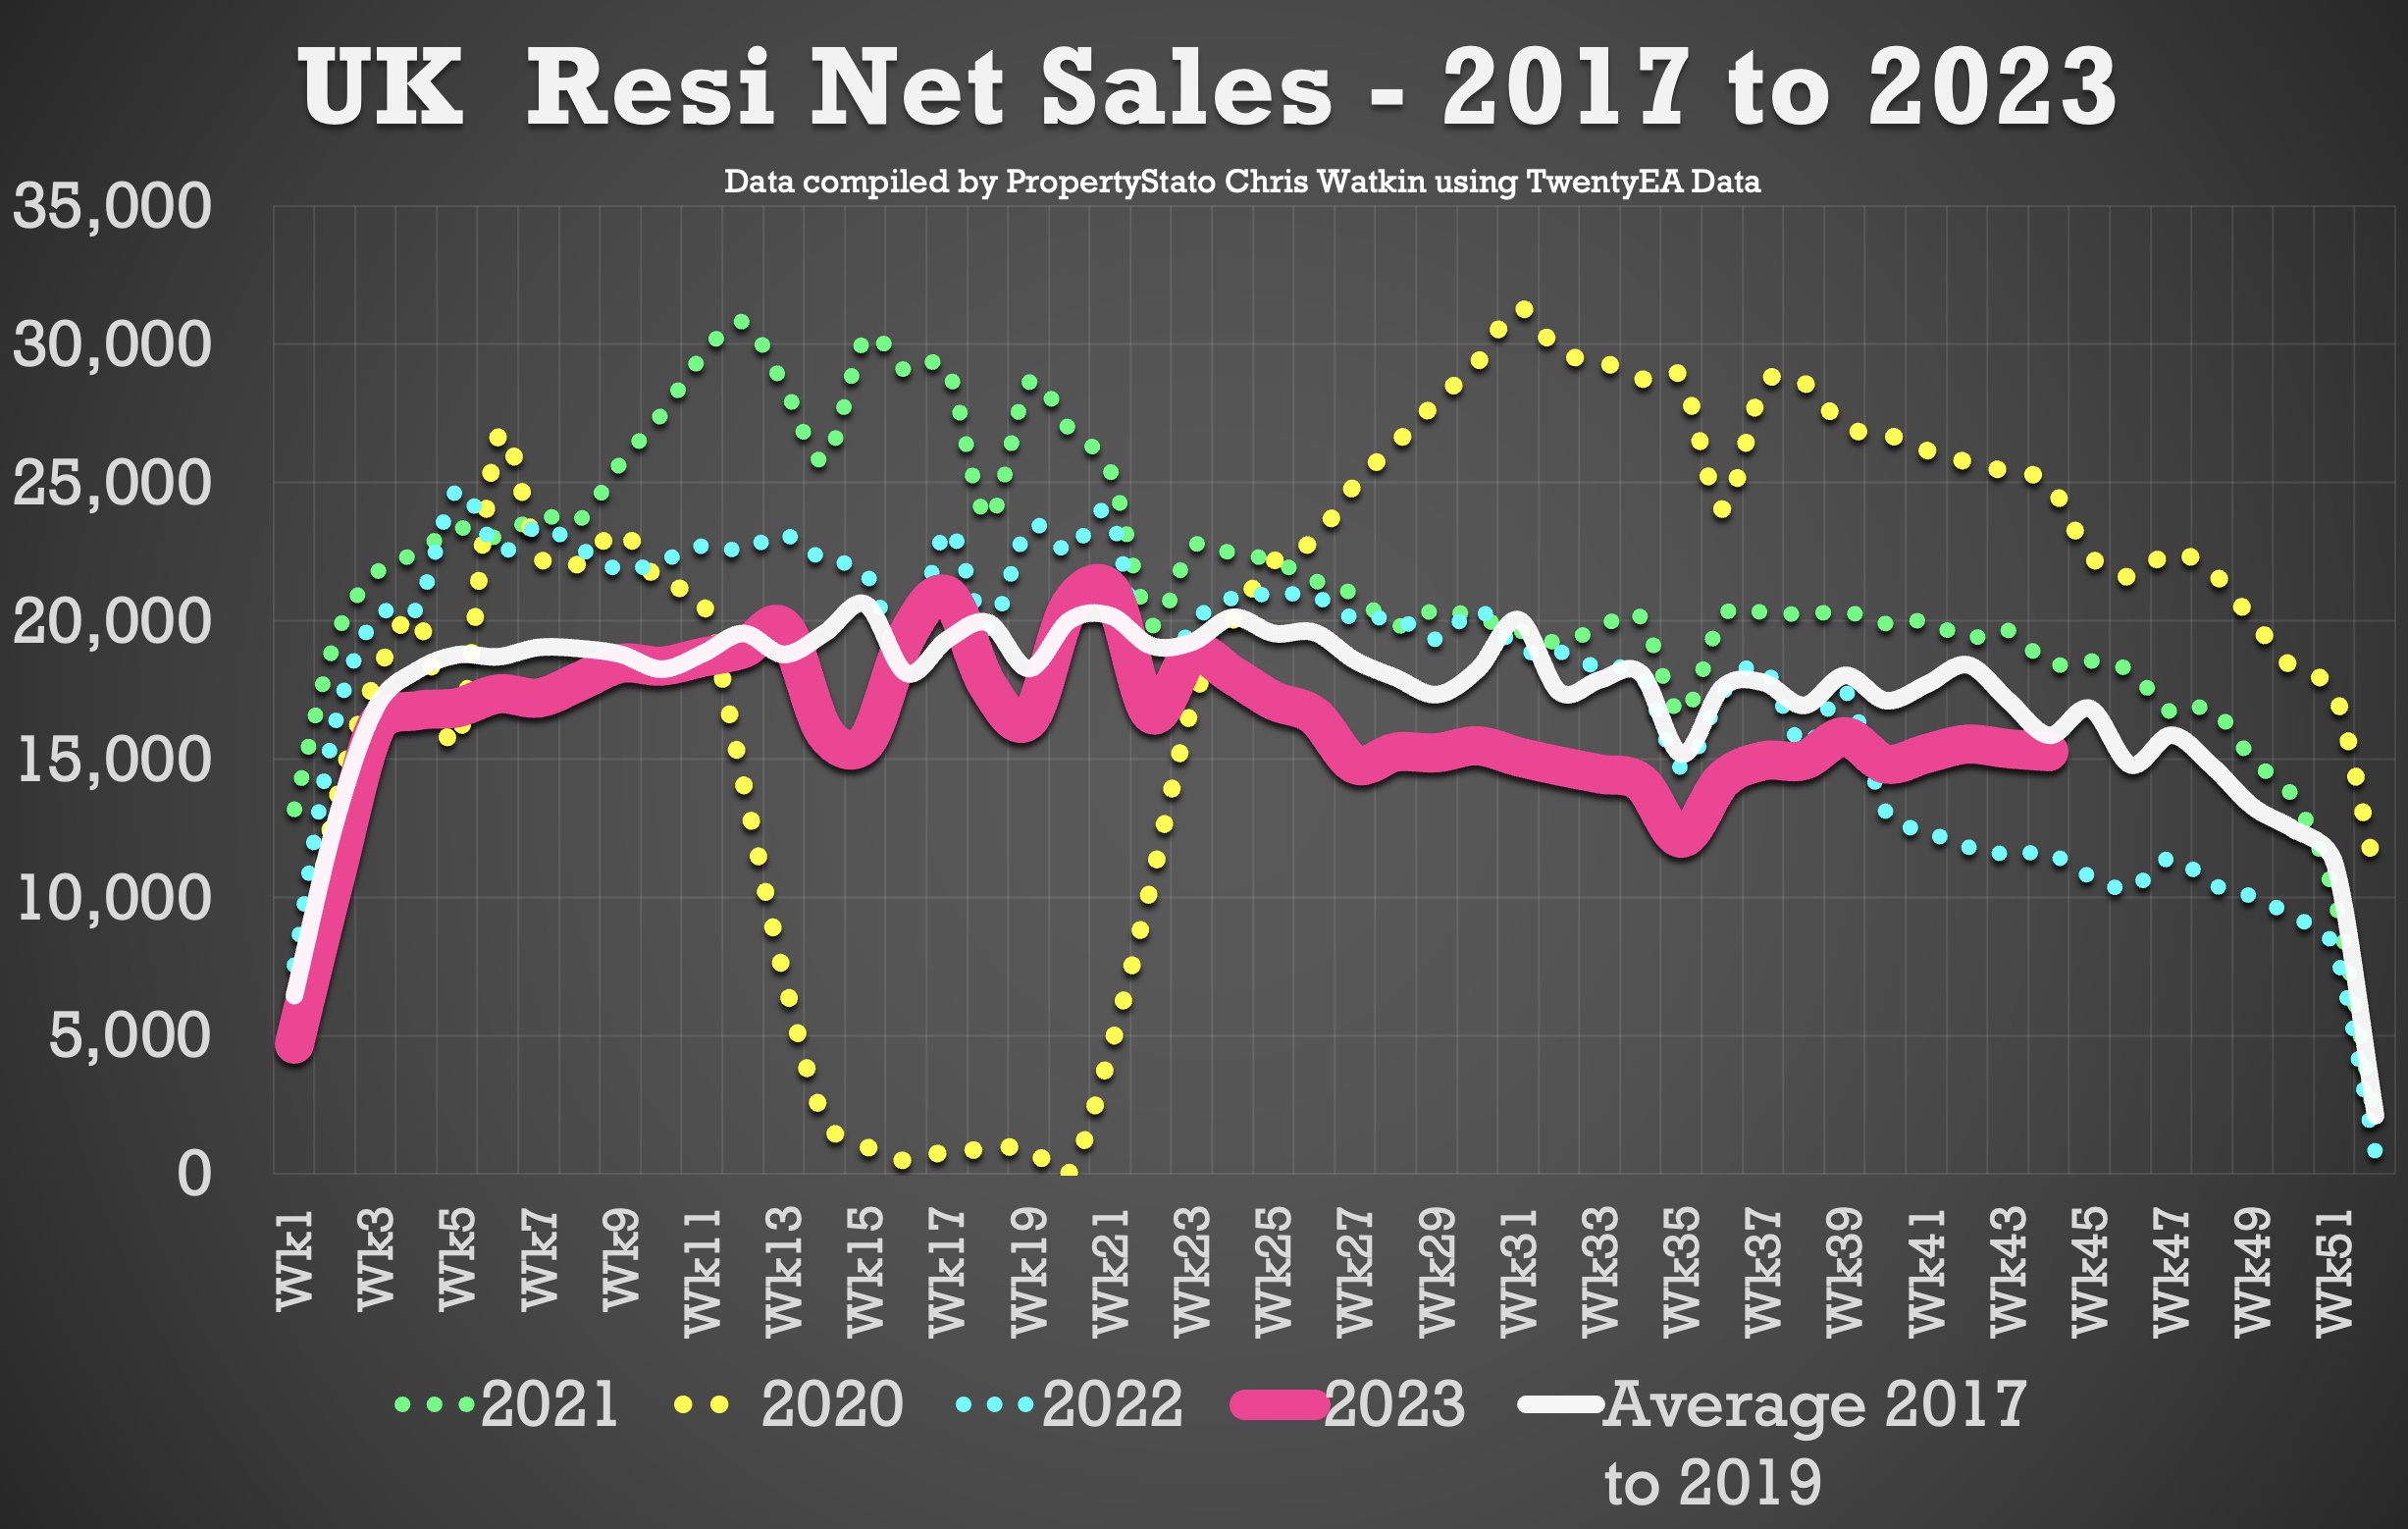
· Net Sales This Week: Net Sales increased to 15,247, excellent when compared to the running month average to 15,352. YTD running weekly average is 16,234. For comparison, there were 11,539 in net sales for the same week last year. (Week 44 in 2022)
· Net Sales Year-to-Date: Despite the challenges, the year-to-date net sales of 699k showcase despite the challenging economic news, the market is 10.3% behind the 2017/8/9 average YTD for net sales
· Sale Agreed £/sqft : Sales Agreed (ie went to Sold stc) in October 2023 achieved £330.32 /SqFt compared to Sale Agreed price of £330.54 /SqFt in September 23. Interesting when you compare, October 2022 when it’s £335.55 / SqFt .
· Exchanged £/sqft : Exchanged in October 2023 achieved £332.56 /SqFt compared to Exchanged price of £331.95 /SqFt in September 23. Interesting when you compare, October 2022 when it’s £340.98 / SqFt .
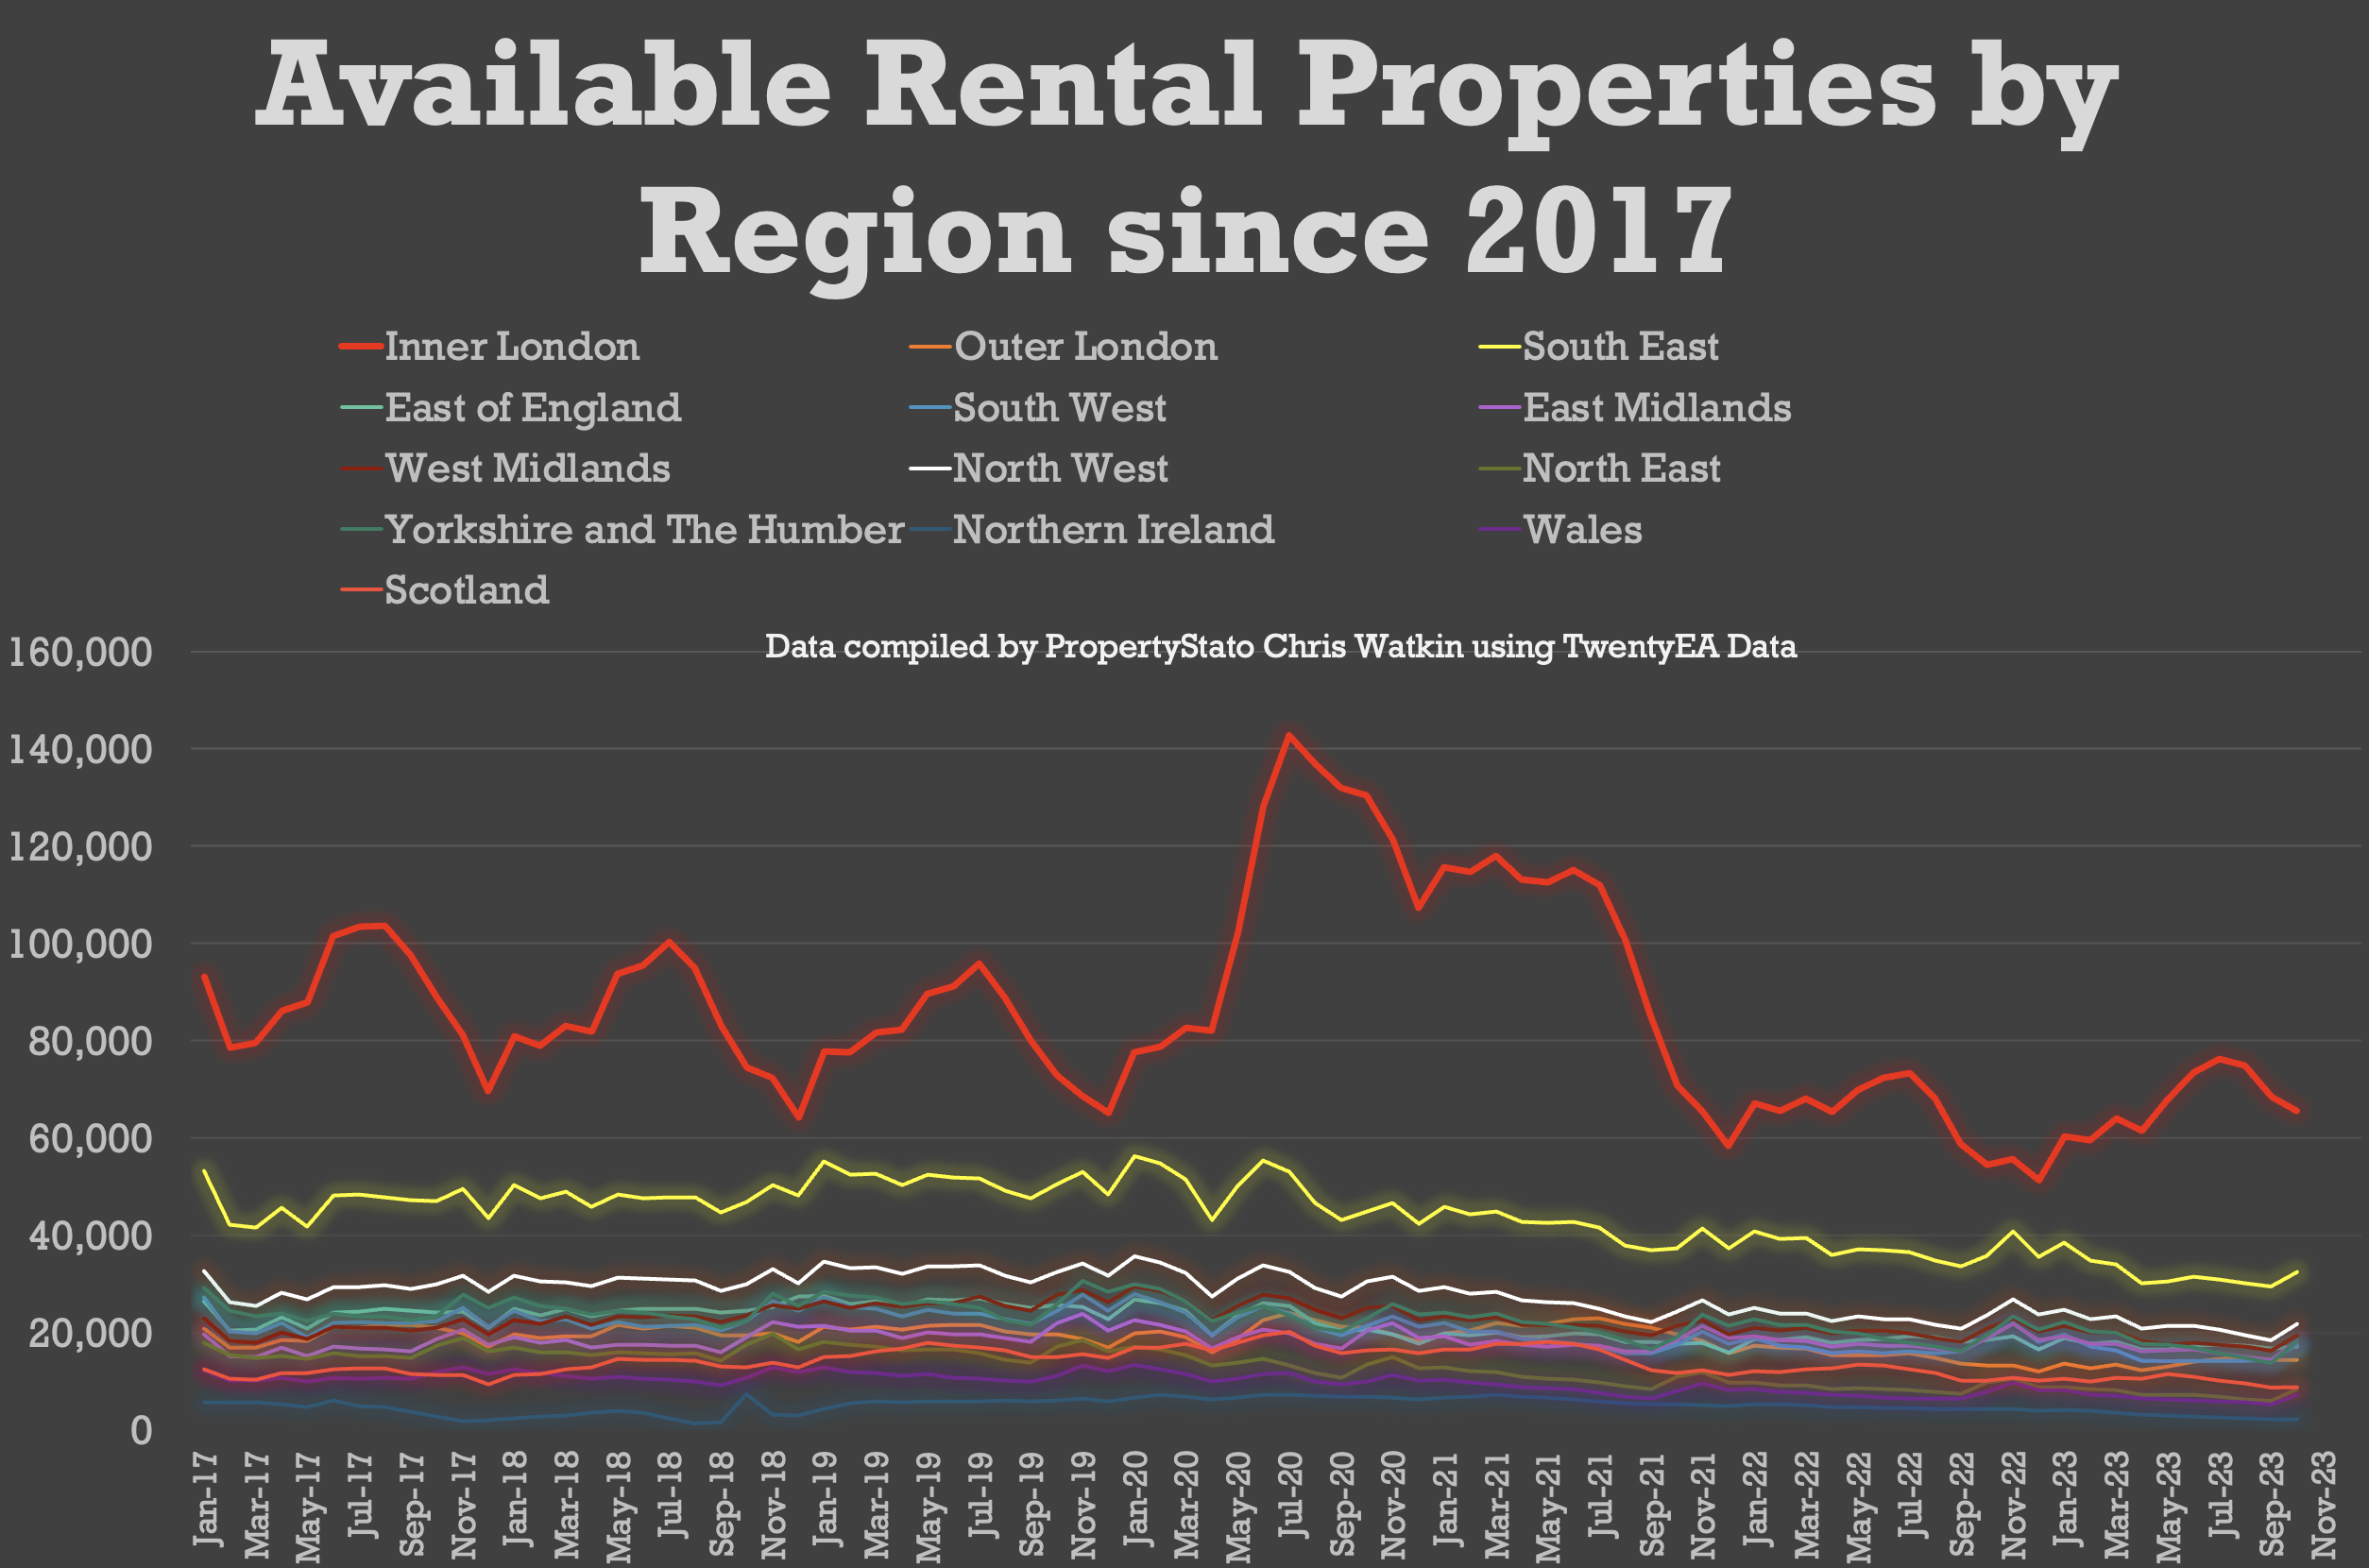
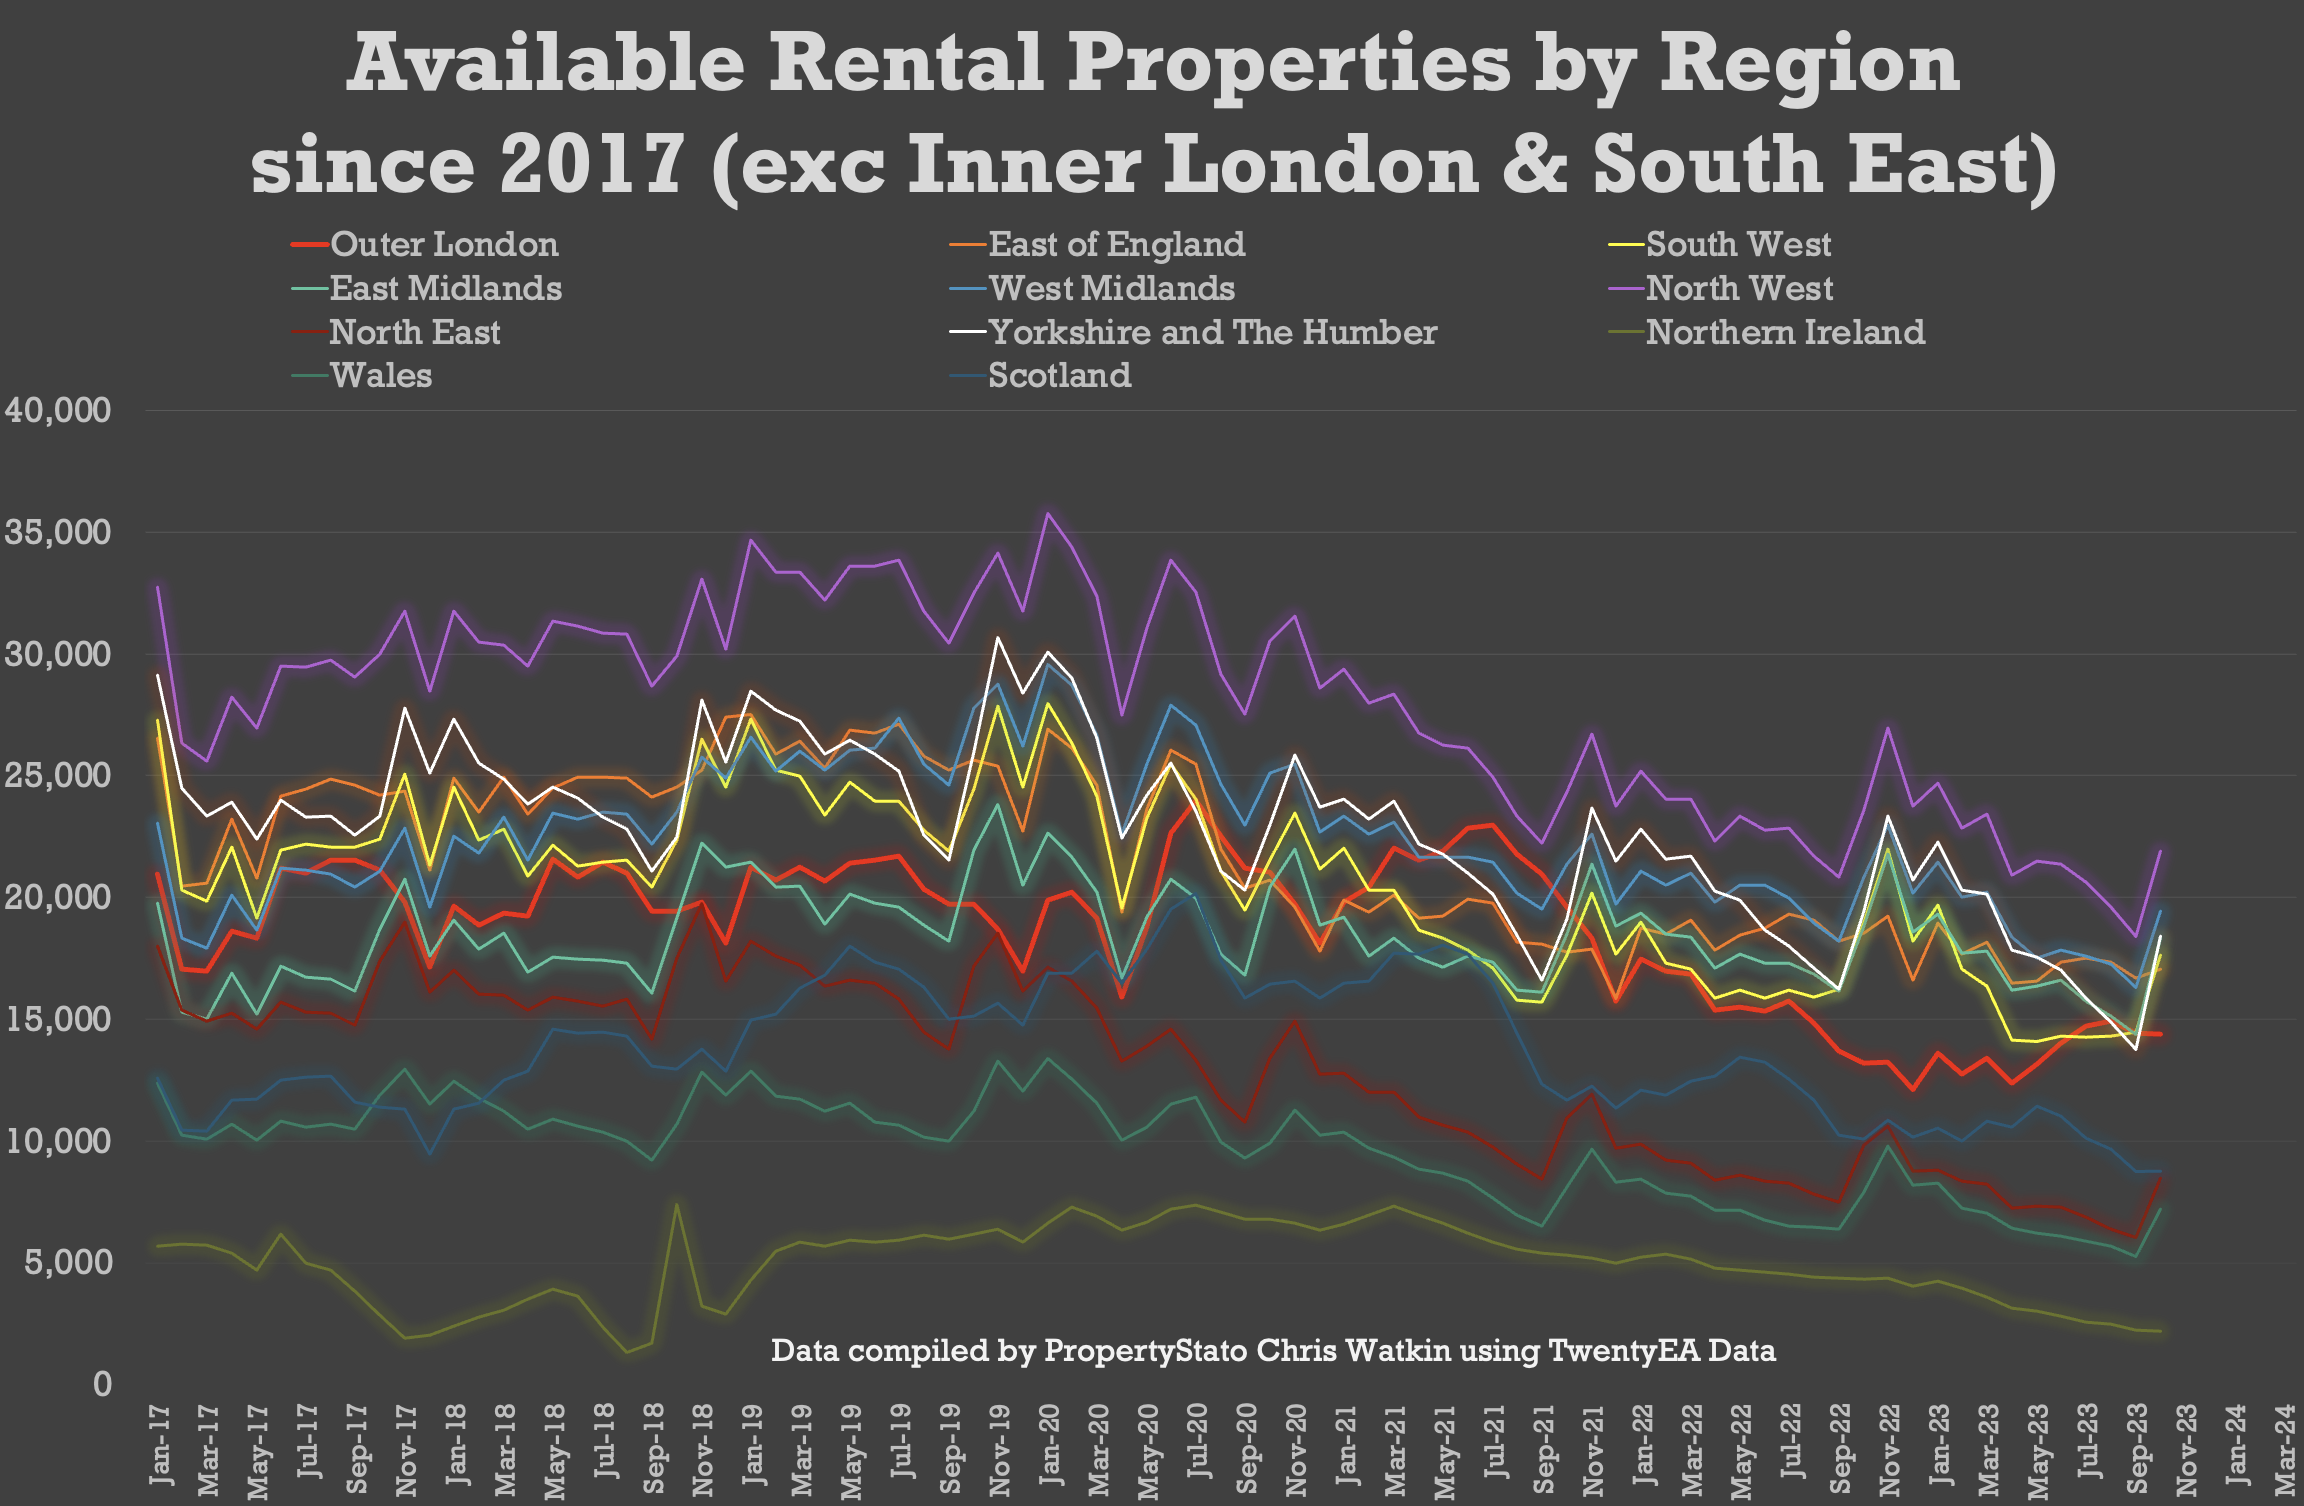
· Available Rental Properties : Available Rental properties have risen 10% in the last month. (252,229 at the end of October, compared to 229,037 at the end of September. Significant highlights include an increase of 40% in rental properties in the North East and 27.4% in the East Midlands, yet a reduction of 4.2% in London.
In the last 20 minutes of the show, there is the usual local focus, and this week it is on Islington (N1) in London.
Gross Sales as % of Listings
INNER LONDON 49.56% ( 2023 YTD average 46.19% )
OUTER LONDON 68.65% ( 2023 YTD average 59.59% )
SOUTH EAST 74.83% ( 2023 YTD average 63.69% )
SOUTH WEST 76.62% ( 2023 YTD average 68.05% )
EAST OF ENGLAND 71.58% ( 2023 YTD average 61.64% )
EAST MIDLANDS 68.26% ( 2023 YTD average 64.11% )
WEST MIDLANDS 82.30% ( 2023 YTD average 70.08% )
YORKSHIRE & HUMBER 75.11% ( 2023 YTD average 72.64% )
NORTH EAST 75.71% ( 2023 YTD average 72.22% )
NORTH WEST 81.53% ( 2023 YTD average 72.94% )
WALES 80.09% ( 2023 YTD average 73.58% )
SCOTLAND 96.07% ( 2023 YTD average 87.91% )
You must be logged in to like or dislike this comments.
Click to login
Don't have an account? Click here to register
% Sales that fell thru – The Sale fall Thru Rate % is the number of sales fall Thrus for the week expressed as a percentage of Gross Sales for the week).
INNER LONDON 23.48% ( 2023 YTD average 27.35% )
OUTER LONDON 26.02% ( 2023 YTD average 29.38% )
SOUTH EAST 26.58% ( 2023 YTD average 28.16% )
SOUTH WEST 27.14% ( 2023 YTD average 27.40% )
EAST OF ENGLAND 26.83% ( 2023 YTD average 27.98% )
EAST MIDLANDS 26.65% ( 2023 YTD average 25.50% )
WEST MIDLANDS 26.25% ( 2023 YTD average 26.55% )
YORKSHIRE & HUMBER 26.28% ( 2023 YTD average 23.64% )
NORTH EAST 24.67% ( 2023 YTD average 23.53% )
NORTH WEST 31.09% ( 2023 YTD average 27.53% )
WALES 29.12% ( 2023 YTD average 26.88% )
SCOTLAND 14.98% ( 2023 YTD average 13.32% )
You must be logged in to like or dislike this comments.
Click to login
Don't have an account? Click here to register
Net Sales as % listing
INNER LONDON 37.92% ( 2023 YTD average 33.81% )
OUTER LONDON 50.79% ( 2023 YTD average 42.23% )
SOUTH EAST 54.94% ( 2023 YTD average 45.94% )
SOUTH WEST 55.83% ( 2023 YTD average 49.60% )
EAST OF ENGLAND 52.37% ( 2023 YTD average 44.62% )
EAST MIDLANDS 50.07% ( 2023 YTD average 48.17% )
WEST MIDLANDS 60.70% ( 2023 YTD average 51.57% )
YORKSHIRE & HUMBER 55.37% ( 2023 YTD average 55.55% )
NORTH EAST 57.04% ( 2023 YTD average 55.27% )
NORTH WEST 56.18% ( 2023 YTD average 52.93% )
WALES 60.70% ( 2023 YTD average 51.57% )
SCOTLAND 81.68% ( 2023 YTD average 76.20% )
You must be logged in to like or dislike this comments.
Click to login
Don't have an account? Click here to register
Change in number of Rental properties available October 23 vs Sept 23
Inner London -4.18%
Outer London -0.48%
South East +10.31%
East of England +2.26%
South West +21.92%
East Midlands +27.44%
West Midlands +19.41%
North West +18.99%
North East 40.07%
Yorkshire and The Humber +33.70%
Northern Ireland -2.11%
Wales +36.43%
Scotland +0.56%
UK Average +10.13%
You must be logged in to like or dislike this comments.
Click to login
Don't have an account? Click here to register
Number of Properties For sale in the UK by month ..
October 2022 – 523,270
November 2022 – 527,084
December 2022 – 481,403
January 2023 – 524,558
February 2023 – 548,516
March 2023 – 585,741
April 2023 – 579,238
May 2023 – 605,006
June 2023 – 632,754
July 2023 – 637,252
August 2023 – 646,143
September 2023 – 662,829
October 2023 – 664,258
You must be logged in to like or dislike this comments.
Click to login
Don't have an account? Click here to register
Number of Properties in Estate Agents Sales Pipelines (Units)
January 2023 – 344,347
February 2023 – 346,388
March 2023 – 367,832
April 2023 – 375,028
May 2023 – 401,045
June 2023 – 422,005
July 2023 – 424,280
August 2023 – 418,580
September 2023 – 410,826
October 2023 – 403,087
You must be logged in to like or dislike this comments.
Click to login
Don't have an account? Click here to register
Its fked 🙂
You must be logged in to like or dislike this comments.
Click to login
Don't have an account? Click here to register
Tell me why you think it’s ‘f-word’ Jan Byers?
I am looking at the same data as you and its is hard work – yet not ‘f-word’ed
You must be logged in to like or dislike this comments.
Click to login
Don't have an account? Click here to register
Depends on your perception
I have little interest in data whch can be interpreted in many ways
I talk to agents every day
real people
Italk to sales directors ]rs of national housebuilders every week
Real people
I know the info they are giving nme
I know the number of developers who have slowed down build programmes as sales are not forthcoming
I know of 4 national housebuilders who have laid off loads of staff and closed regional offices
I know of 5 national housebuilders who have not bought one single site this year
Load of agents are going go bust
Many already have
My company will be fine we are selling well and buying land at low prices in this market
we will sell these as things improve
It has not been a bad thing for us
You must be logged in to like or dislike this comments.
Click to login
Don't have an account? Click here to register
The over pricing is getting silly. We are seeing houses being dropped by the same estate agents 2 weeks after advertising. Obviously they cannot have a sensible conversation with their clients. The market is sticking and it is getting worse fact but put a house on the market for the right price it sells simple. Unfortunately a600,000 house advertised for 800,000 will not
You must be logged in to like or dislike this comments.
Click to login
Don't have an account? Click here to register