

 In this week’s UK Property Market stats show, Chris Watkin and his special guest Verona Frankish of YOPA, talk about the state of play in the housing market for the week ending Sunday, 29th October 2023.
Brief headlines:
+ UK House Prices measured on £/sqft are 0.48% higher at Sale Agreed (Sold stc) than last month at £330.54/SqFt, yet 1.04% lower than year ago
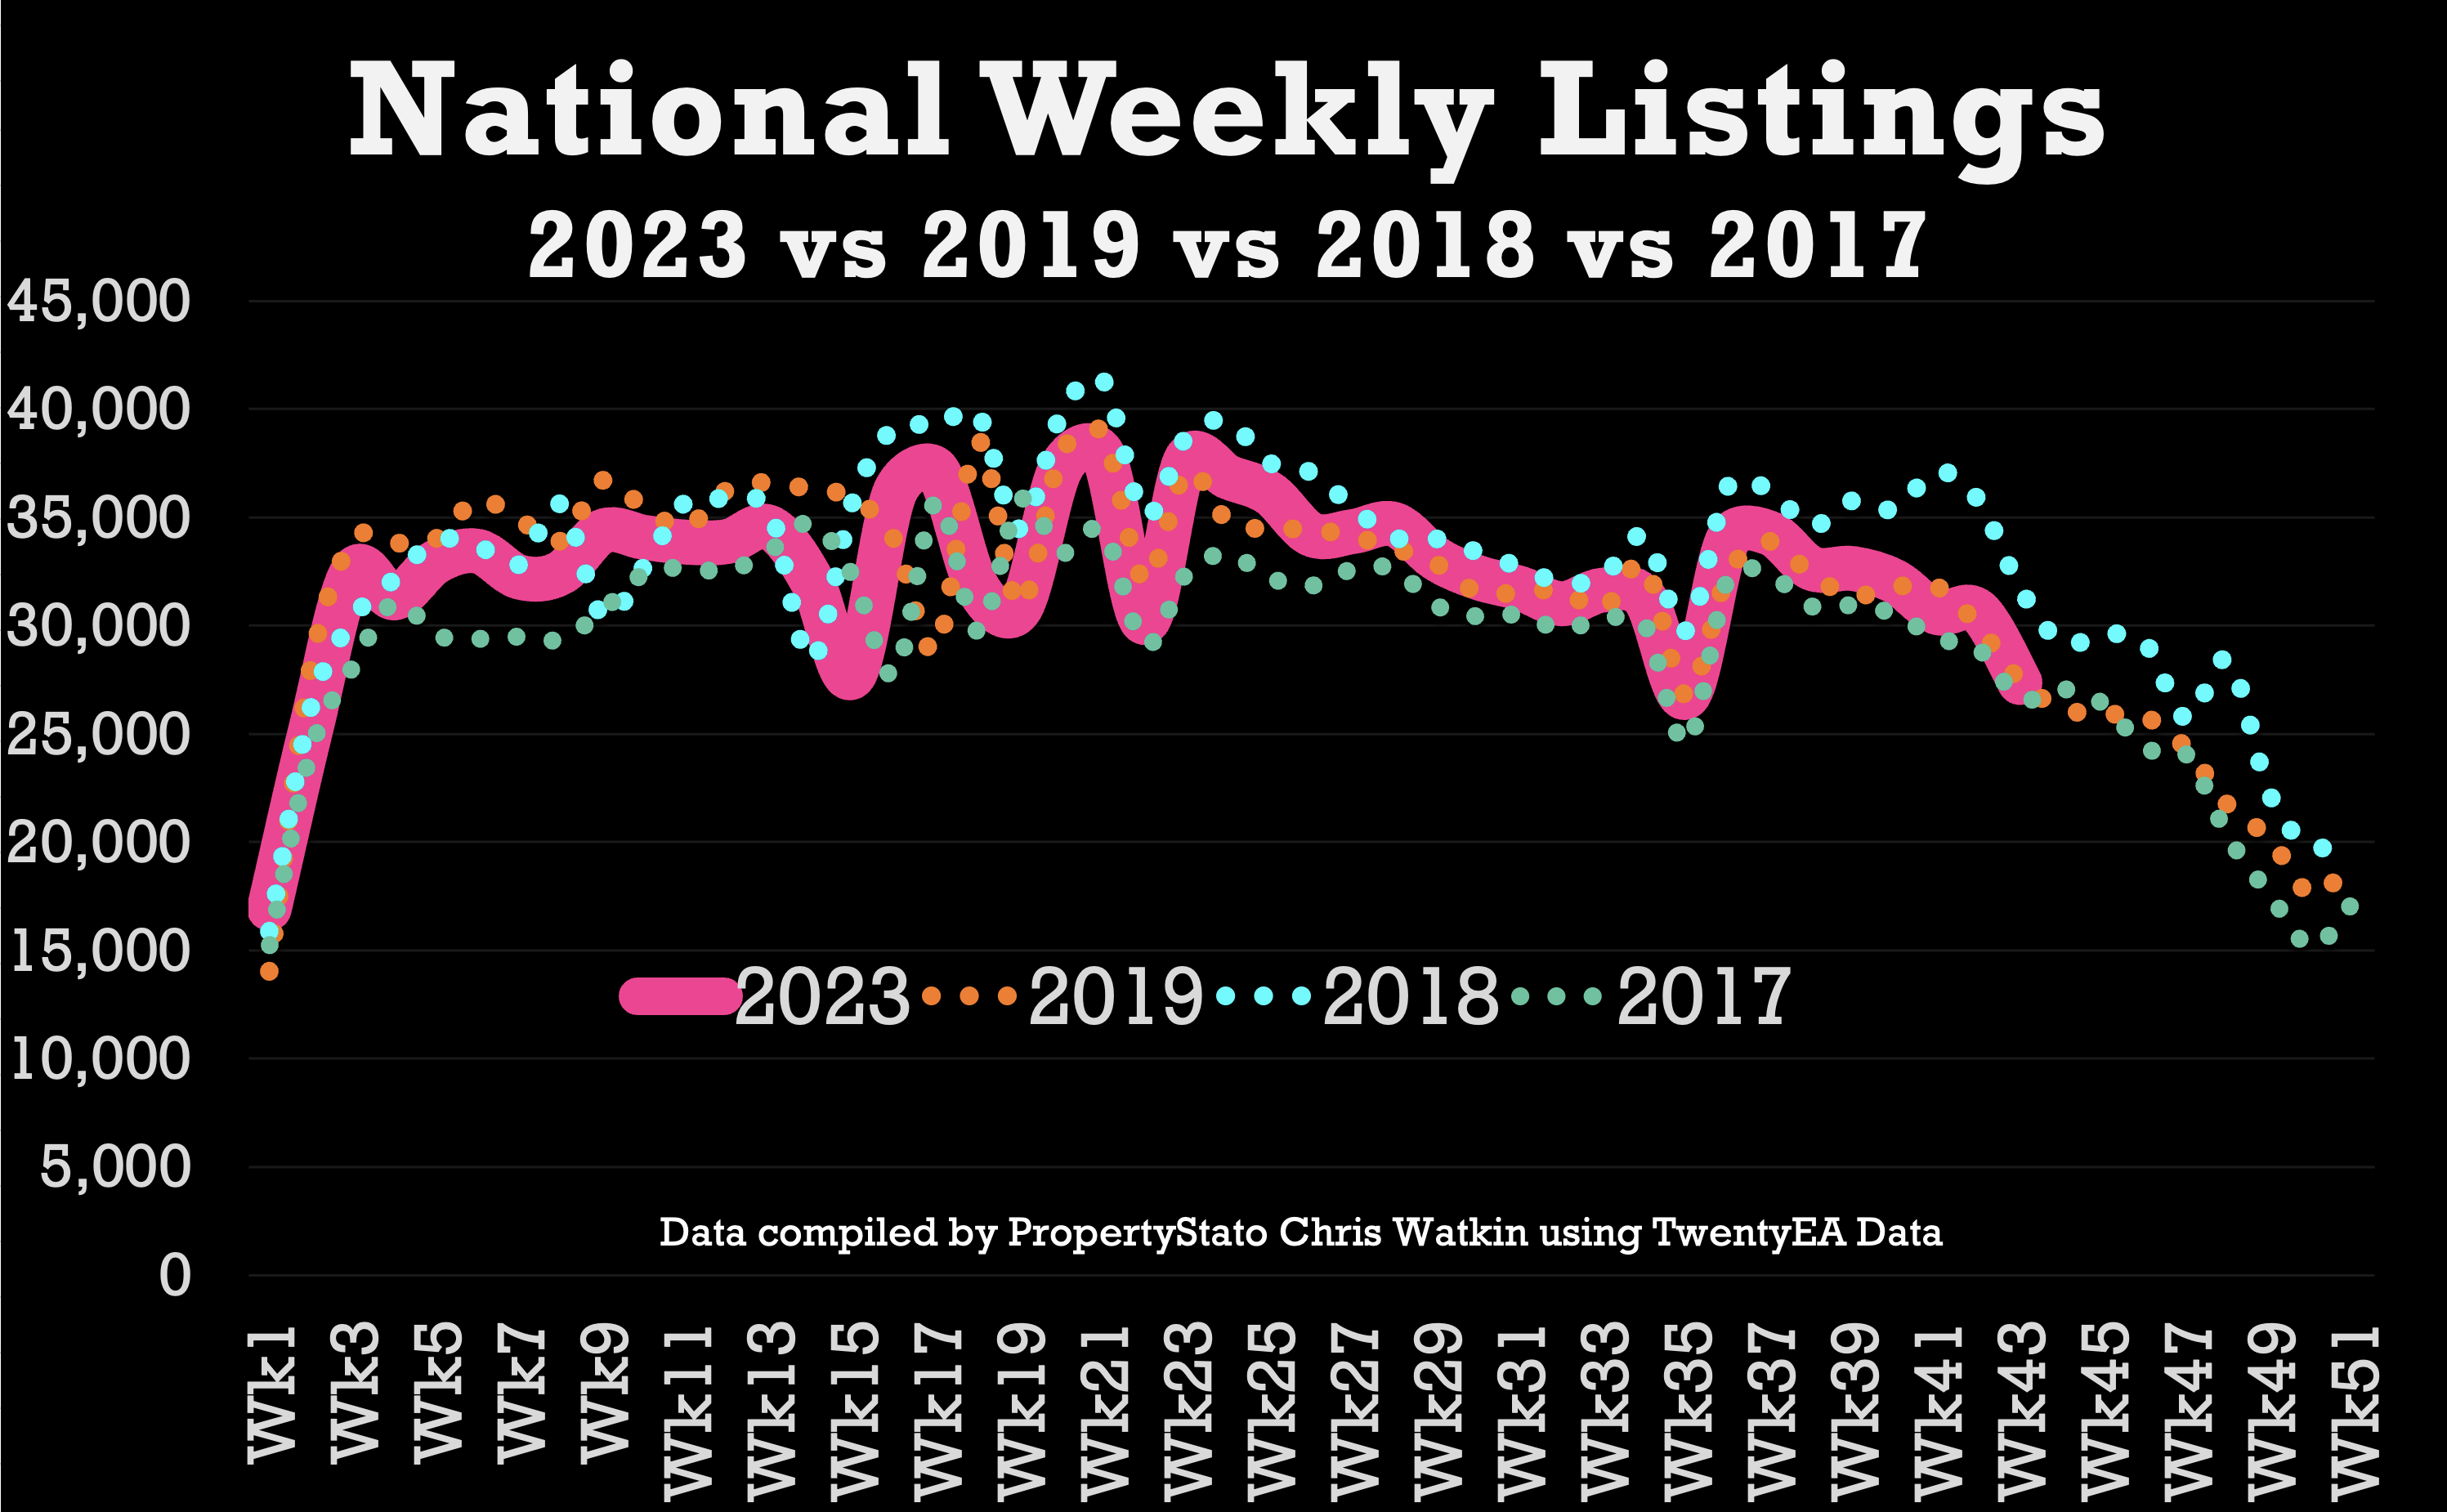
+ Listings YTD 2023 are 99.4% of the 2017/8/9 YTD average (last week 99.5%)
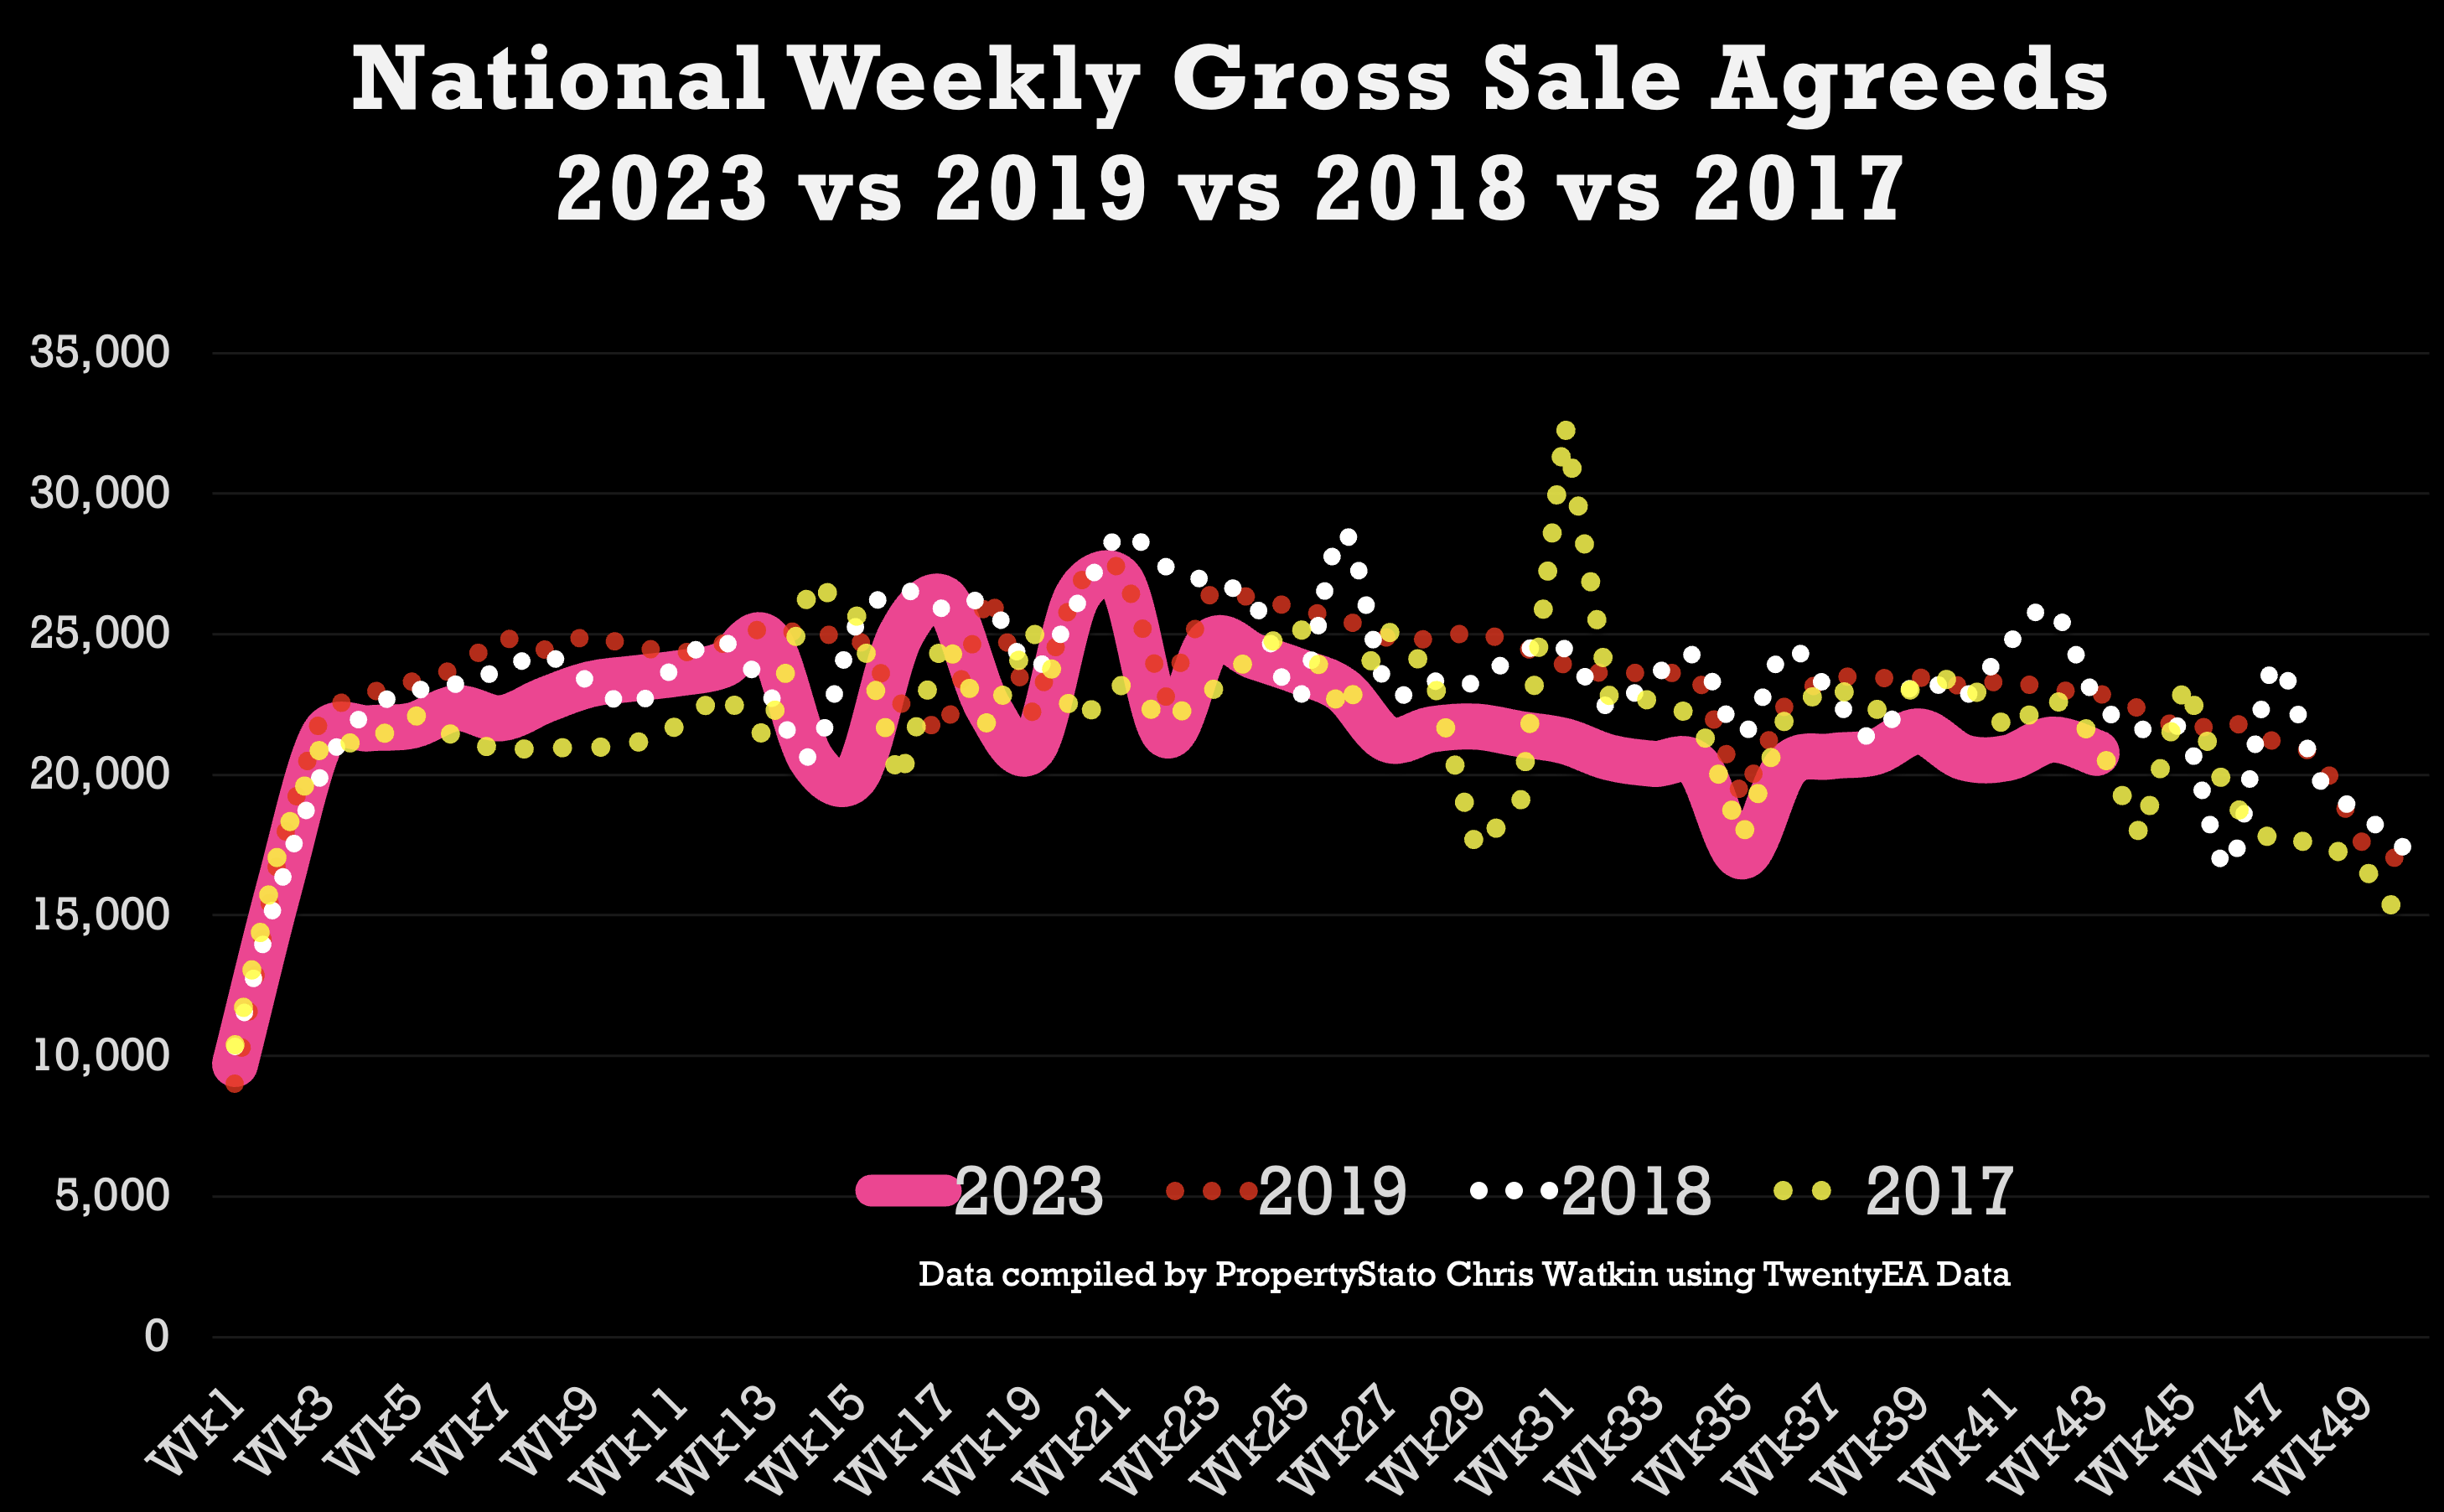
+ Gross Sales YTD 2023 are 94.0% of the 2017/8/9 YTD average (last week 94.0%)
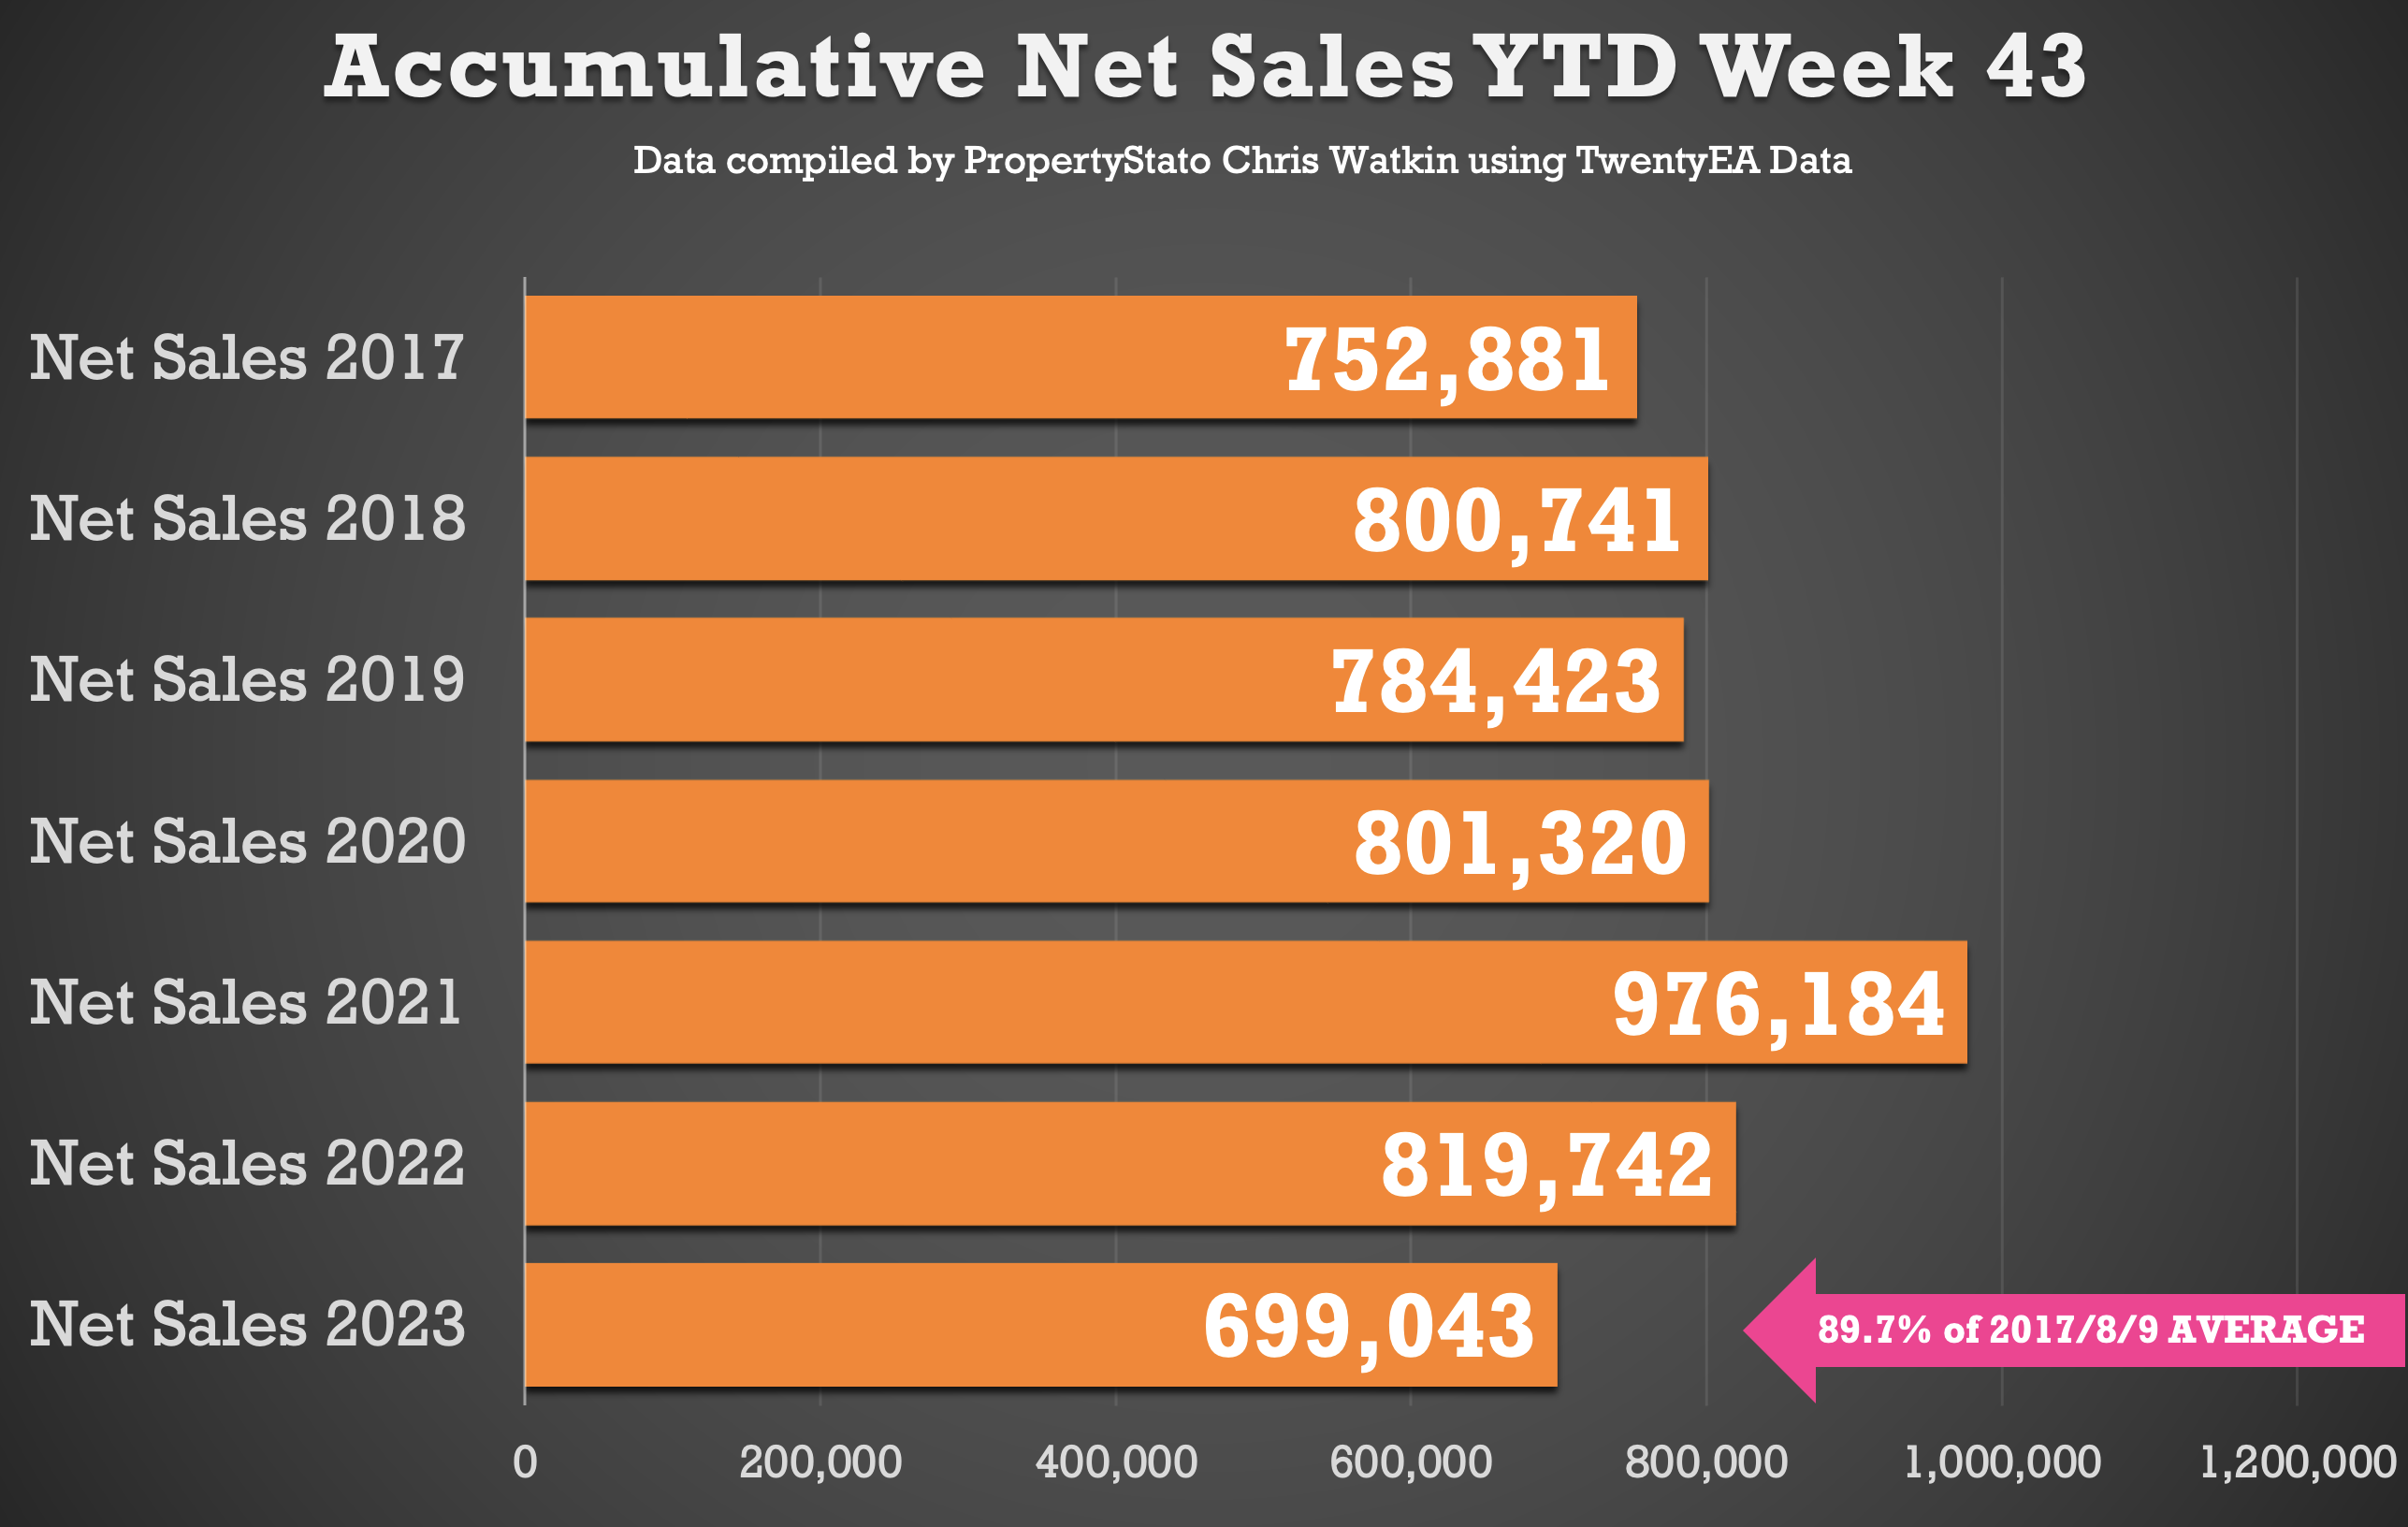
+ Net Sales YTD 2023 are 89.7% of the 2017/8/9 YTD average (last week 89.7%)
Looking at key statistics in more detail:
· New Properties to the Market (Listings): The number of listings last week was 27,389 (30,684). The 2023 YTD running weekly average stands strong at 32,460.
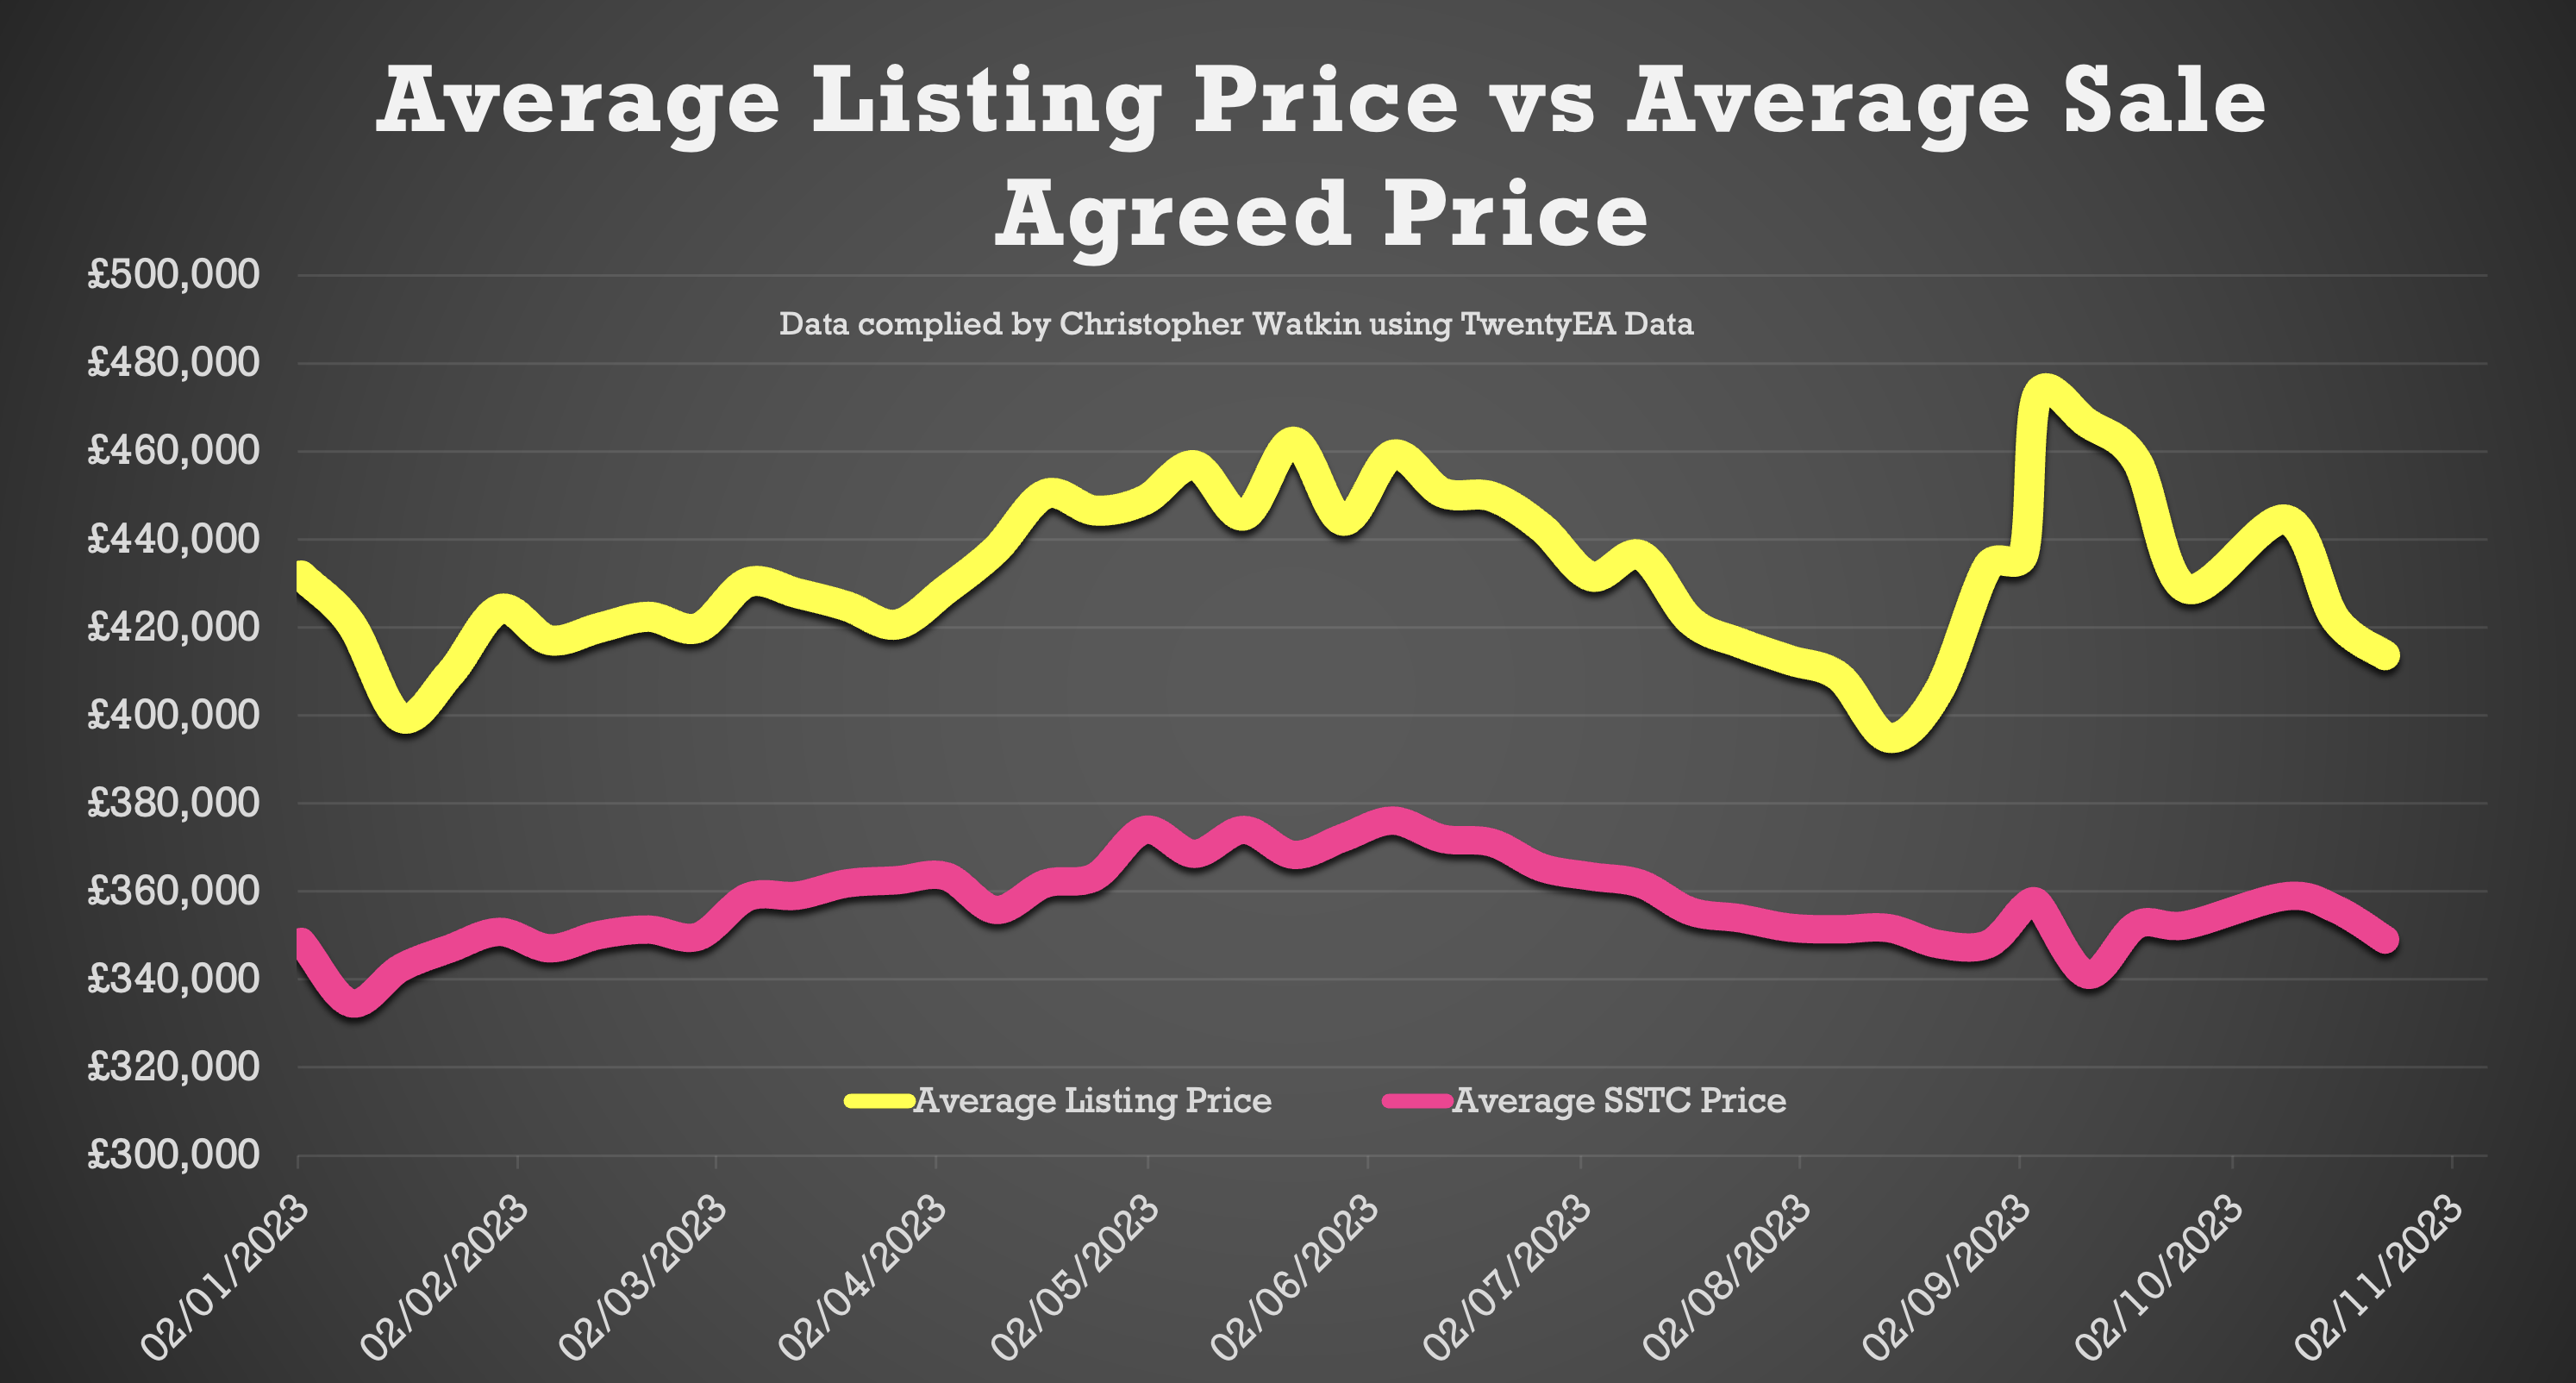
· Average Listing Price: The average listing price has now returned to the levels seen in the Summer. Average Listing price this week £413,704. The 2023 running weekly average of £432,493.
· % Difference between Listing and Sale Agreed Prices: This week it remains at 19% this week which means it’s below the important 20% barrier which is better for the property market. 2023 YTD average 21% and long term 7 year average 17%.
· Price Reductions: 21,029 price reductions were seen last week which is 10% lower than last week. The 2023 running weekly average is 20,362 per week. This means approximately 14.3% of Resi Stock is being reduced per month (ie just under 1 in 7)
· Average Asking Price of Properties Being Reduced: This week’s average asking price of reduced properties £399,021. The 2023 running weekly average of £403,460.
· Number of Properties Sold (Gross Sales): Gross sales were 2% down from last week. Total number of gross sales in the UK last week was 20,771. For comparison, the 2023 running weekly average is 21,714 weekly sales (stc).
· Average Asking Price of Properties Sold STC this Week: The average asking price of the properties selling last week was £348,997, which has remained quite static over the last few months. The 2023 running weekly average of £357,122.
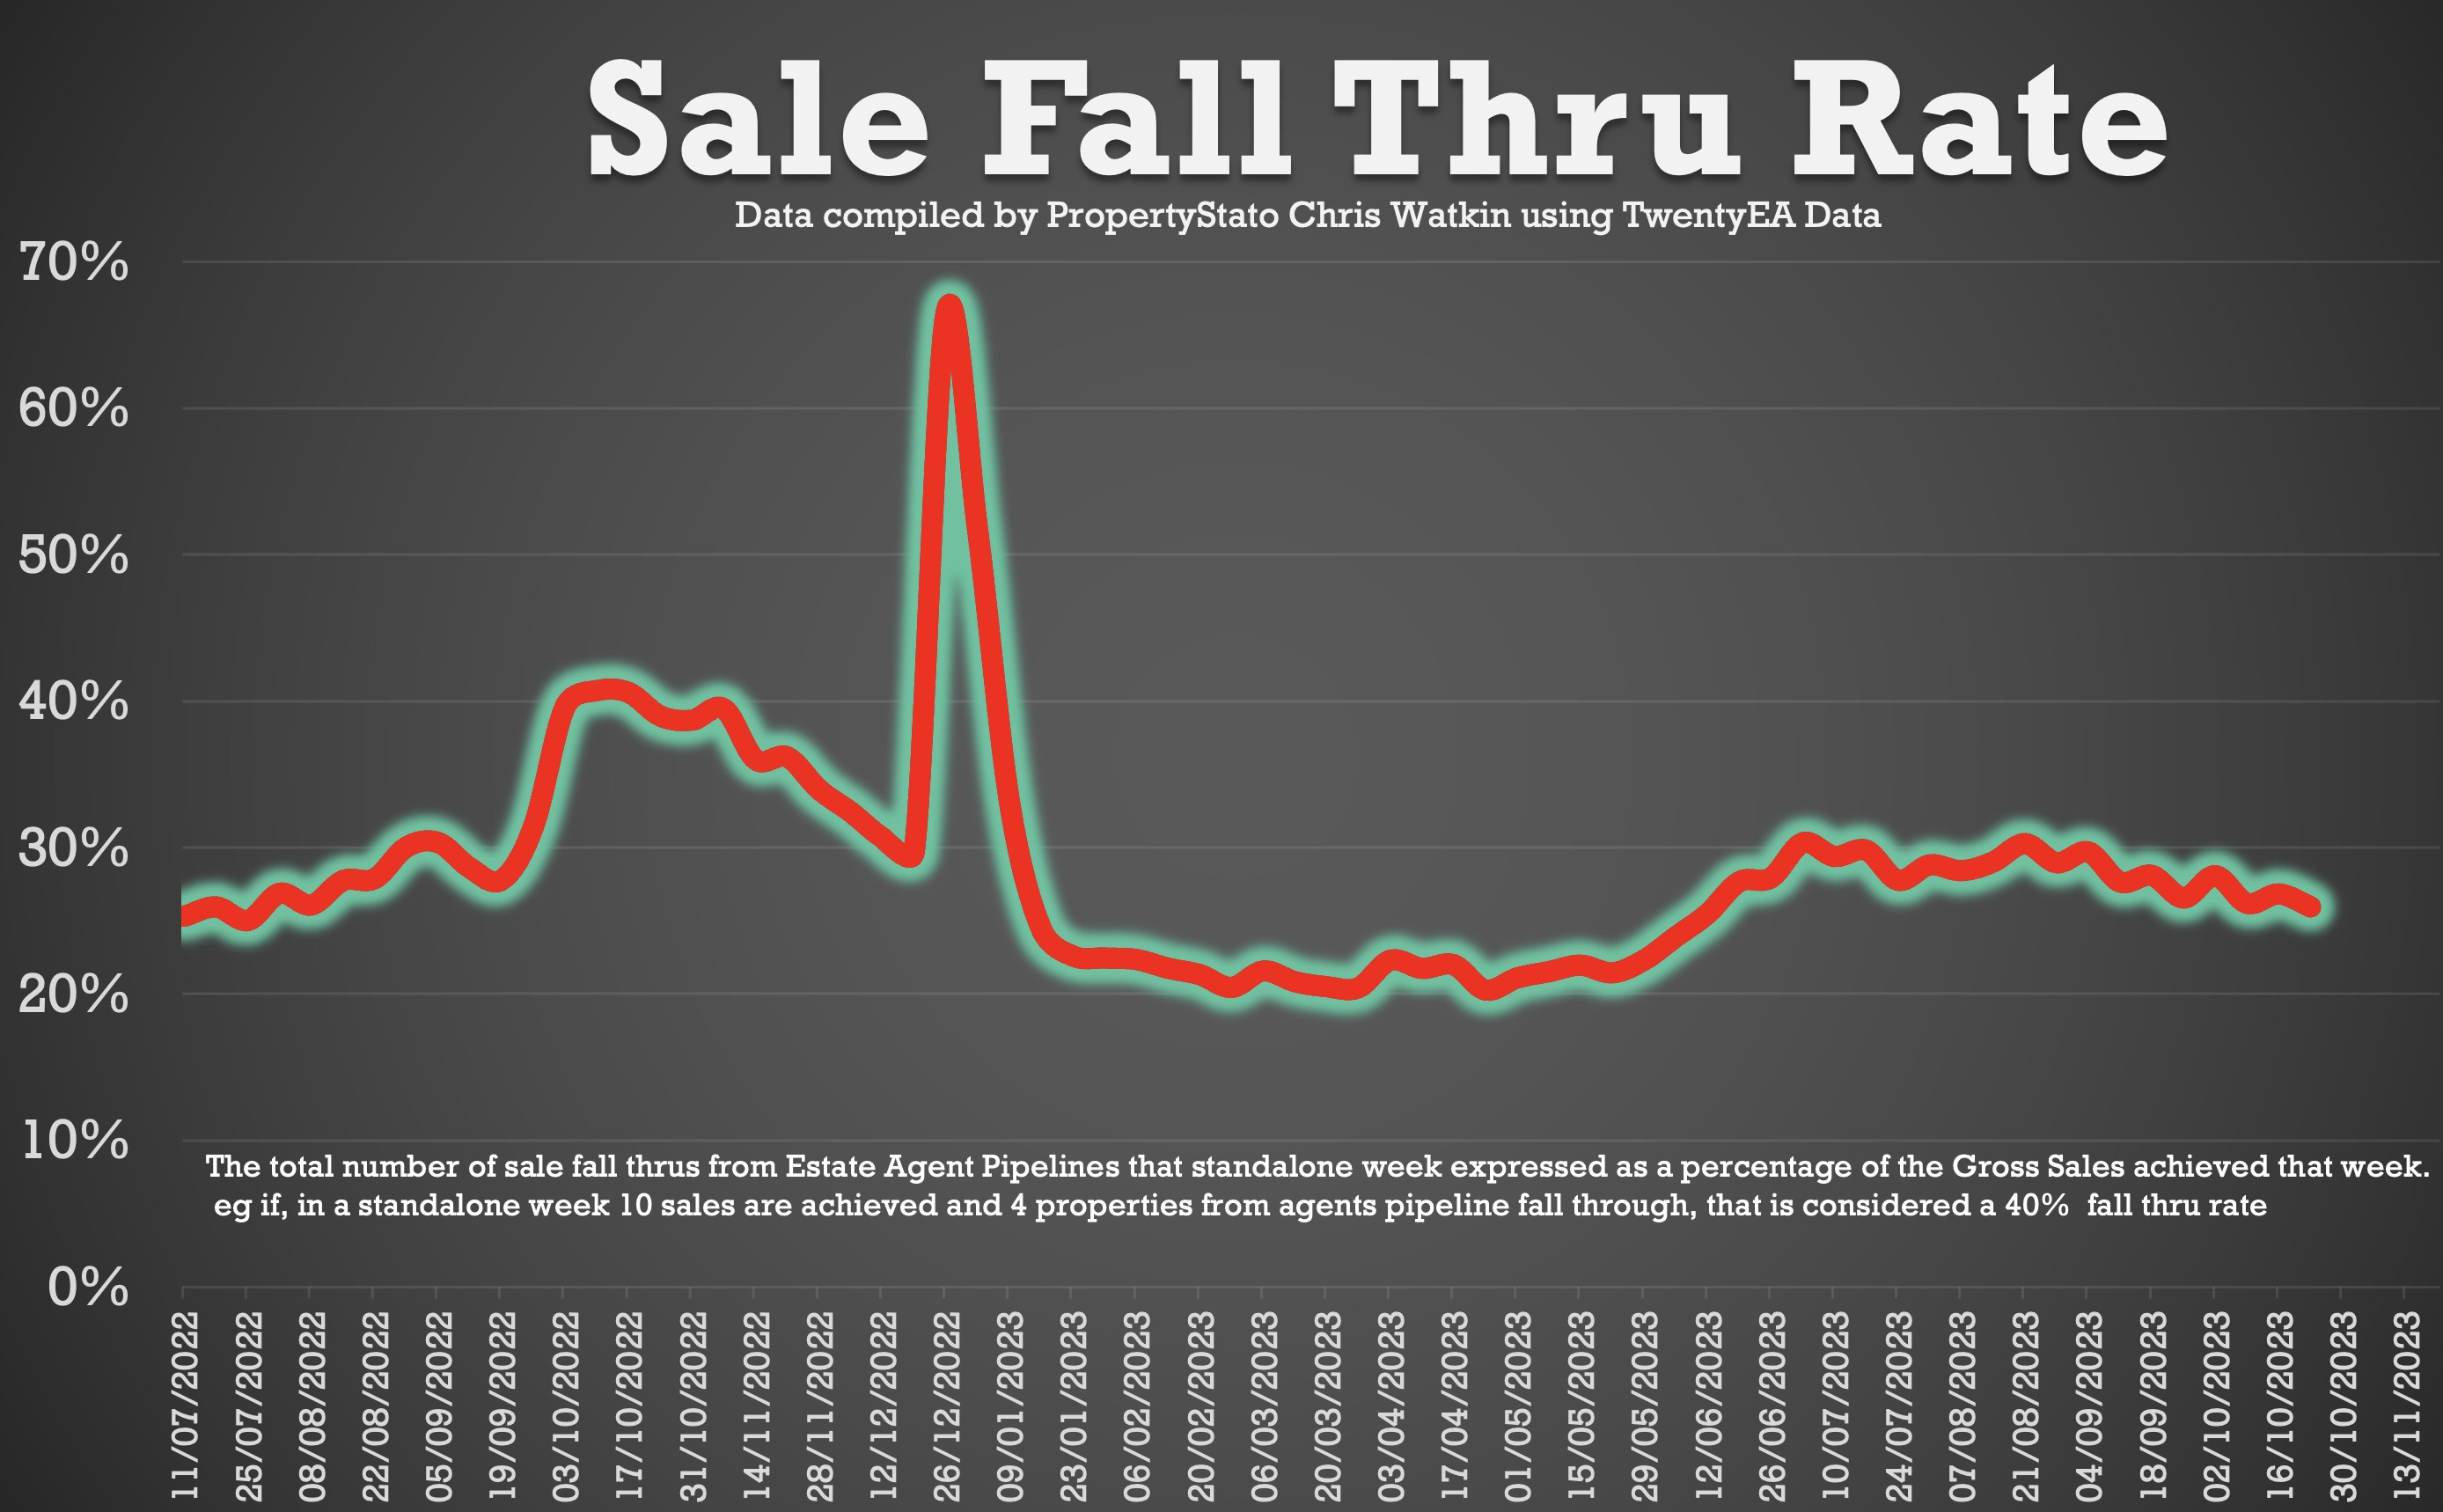
Sale Fall Throughs (Units): there are 5,389 sale for Throughs, which is a 5% reduction from the week’s before at 5,700. The running four-week average for Sale Fall Thrus is 5494 and the YTD figure average of 5,457.
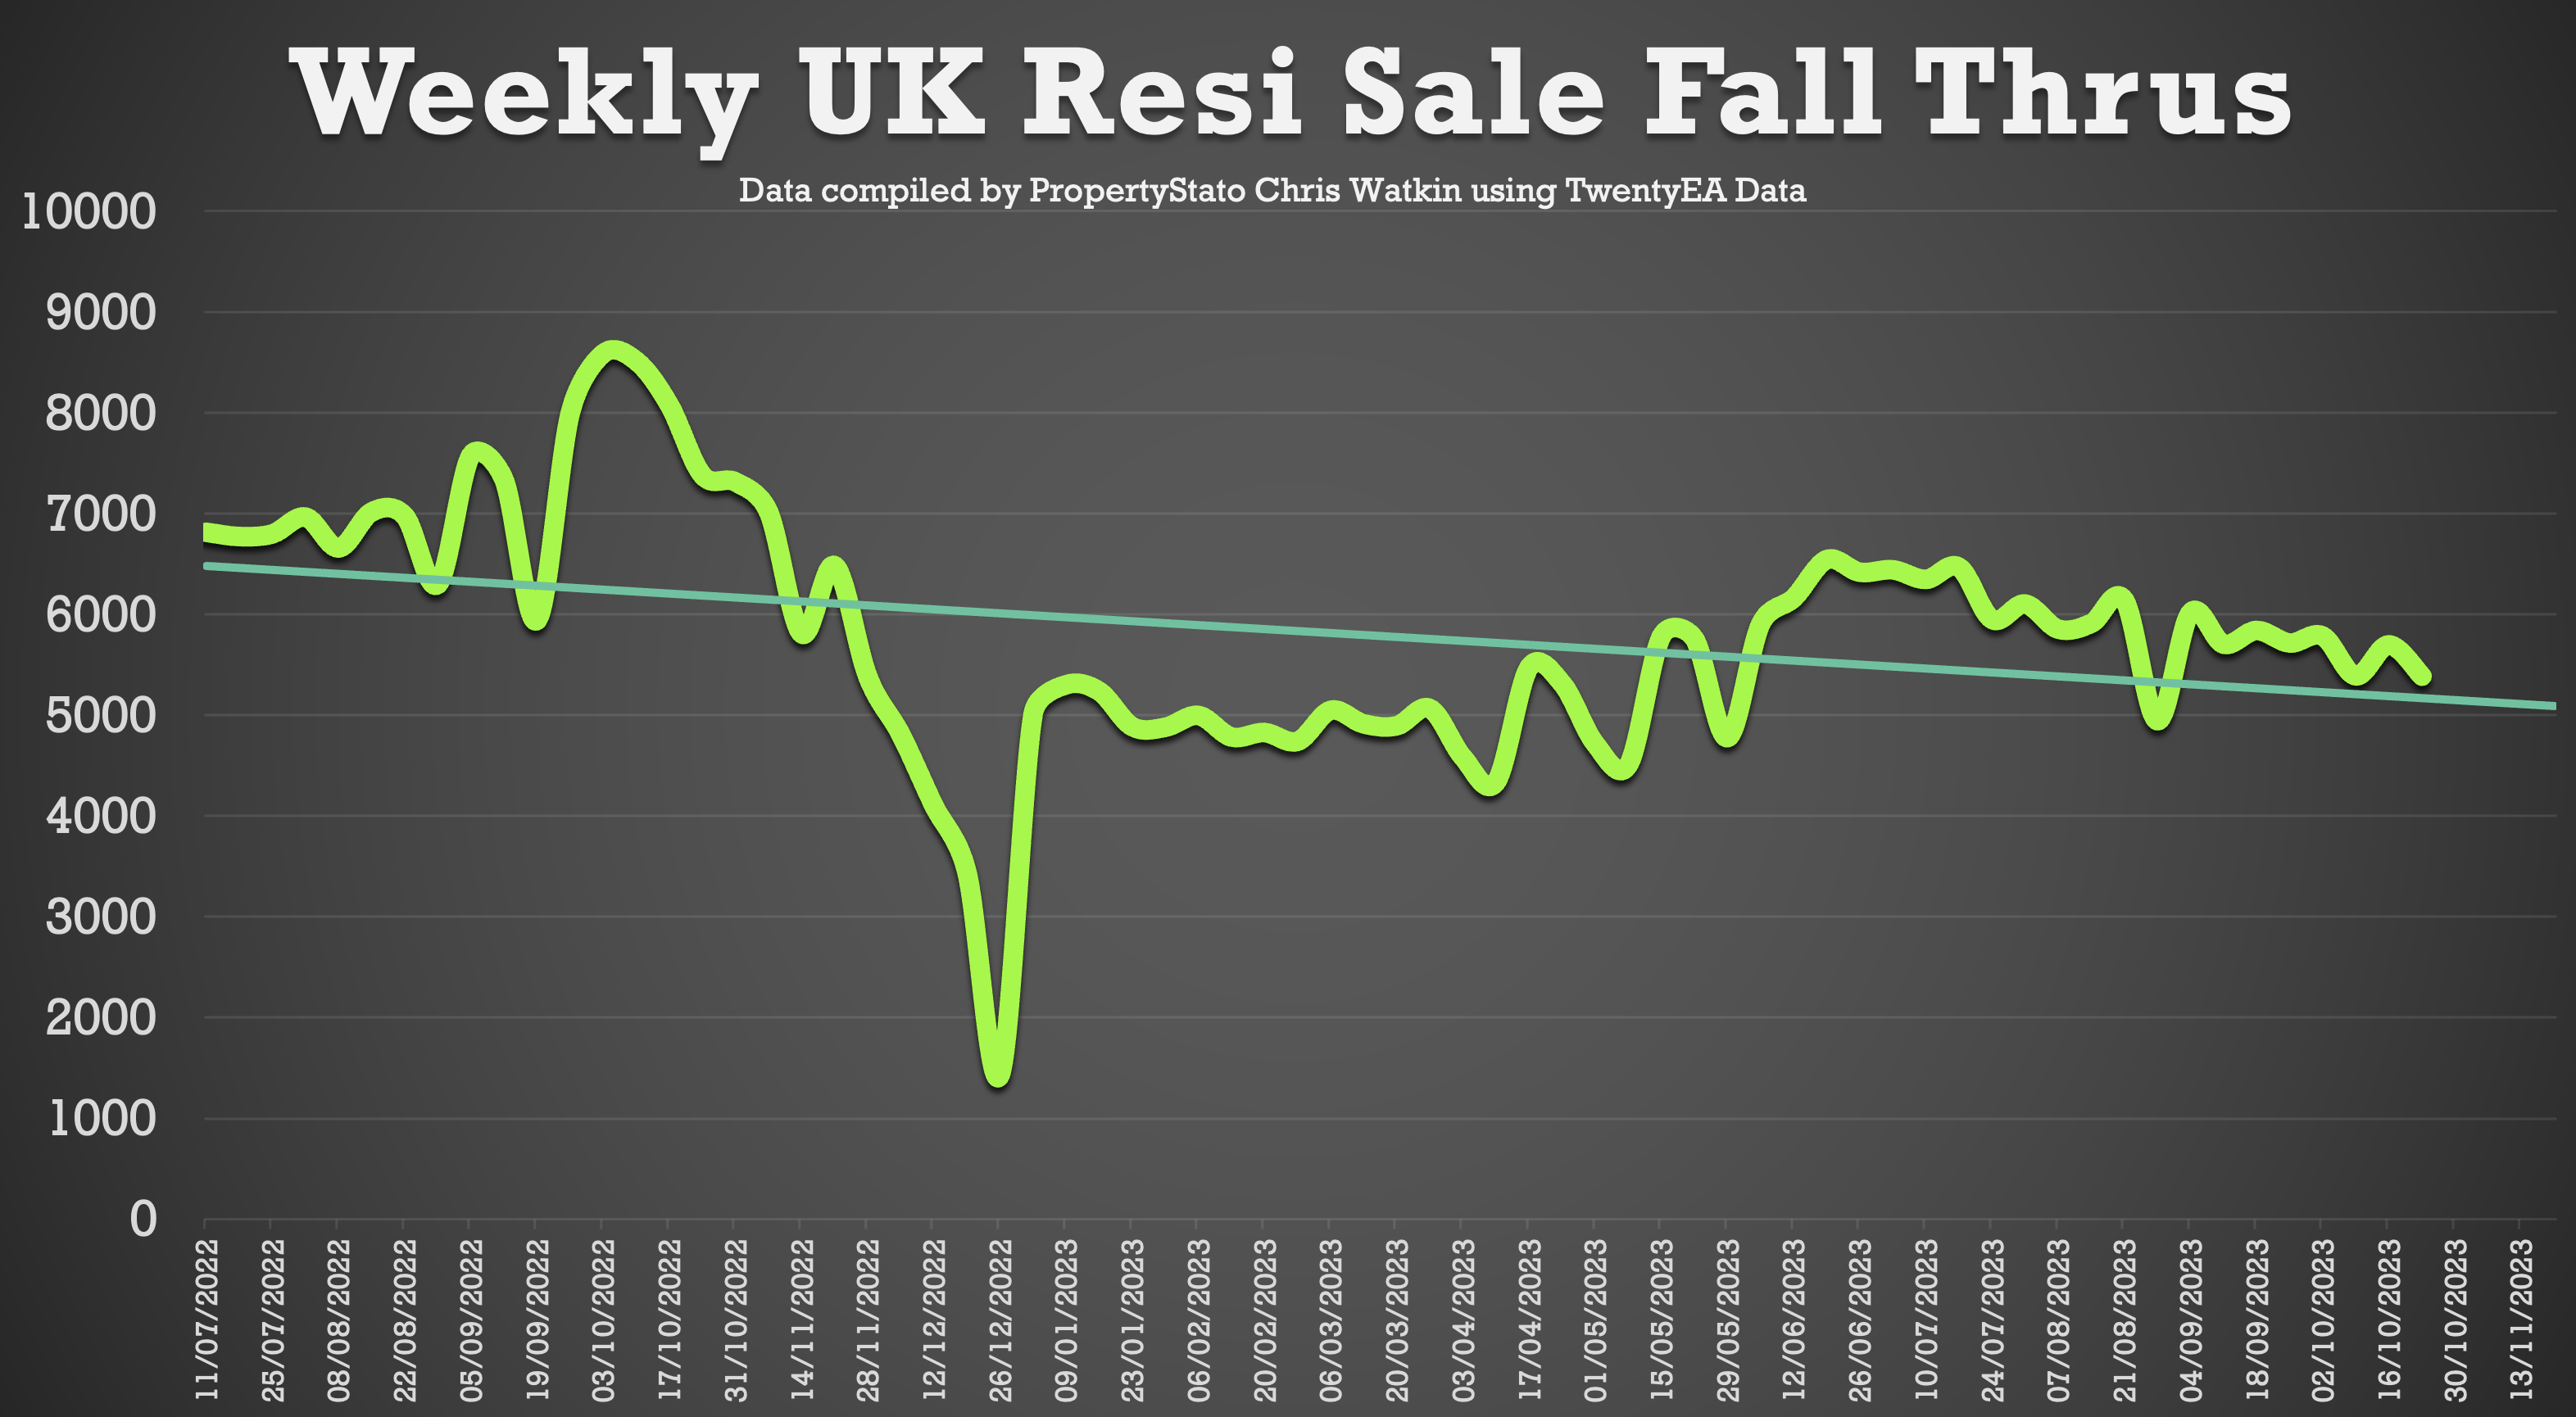
· Sale Fall Throughs (Percentage): The Sale fall Thru Rate % is the number of sales fall Thrus for the week expressed as a percentage of Gross Sales for the week). This week it is at 25.94%. This is a continuation of drop that started in early August 2023 when it was in the early 30%’s. The 2023 running weekly average is 25.69%. Let us not forget, in the same week of 2022 (Week 43), it was 38.9%). The seven-year long-term average is 24.3%.
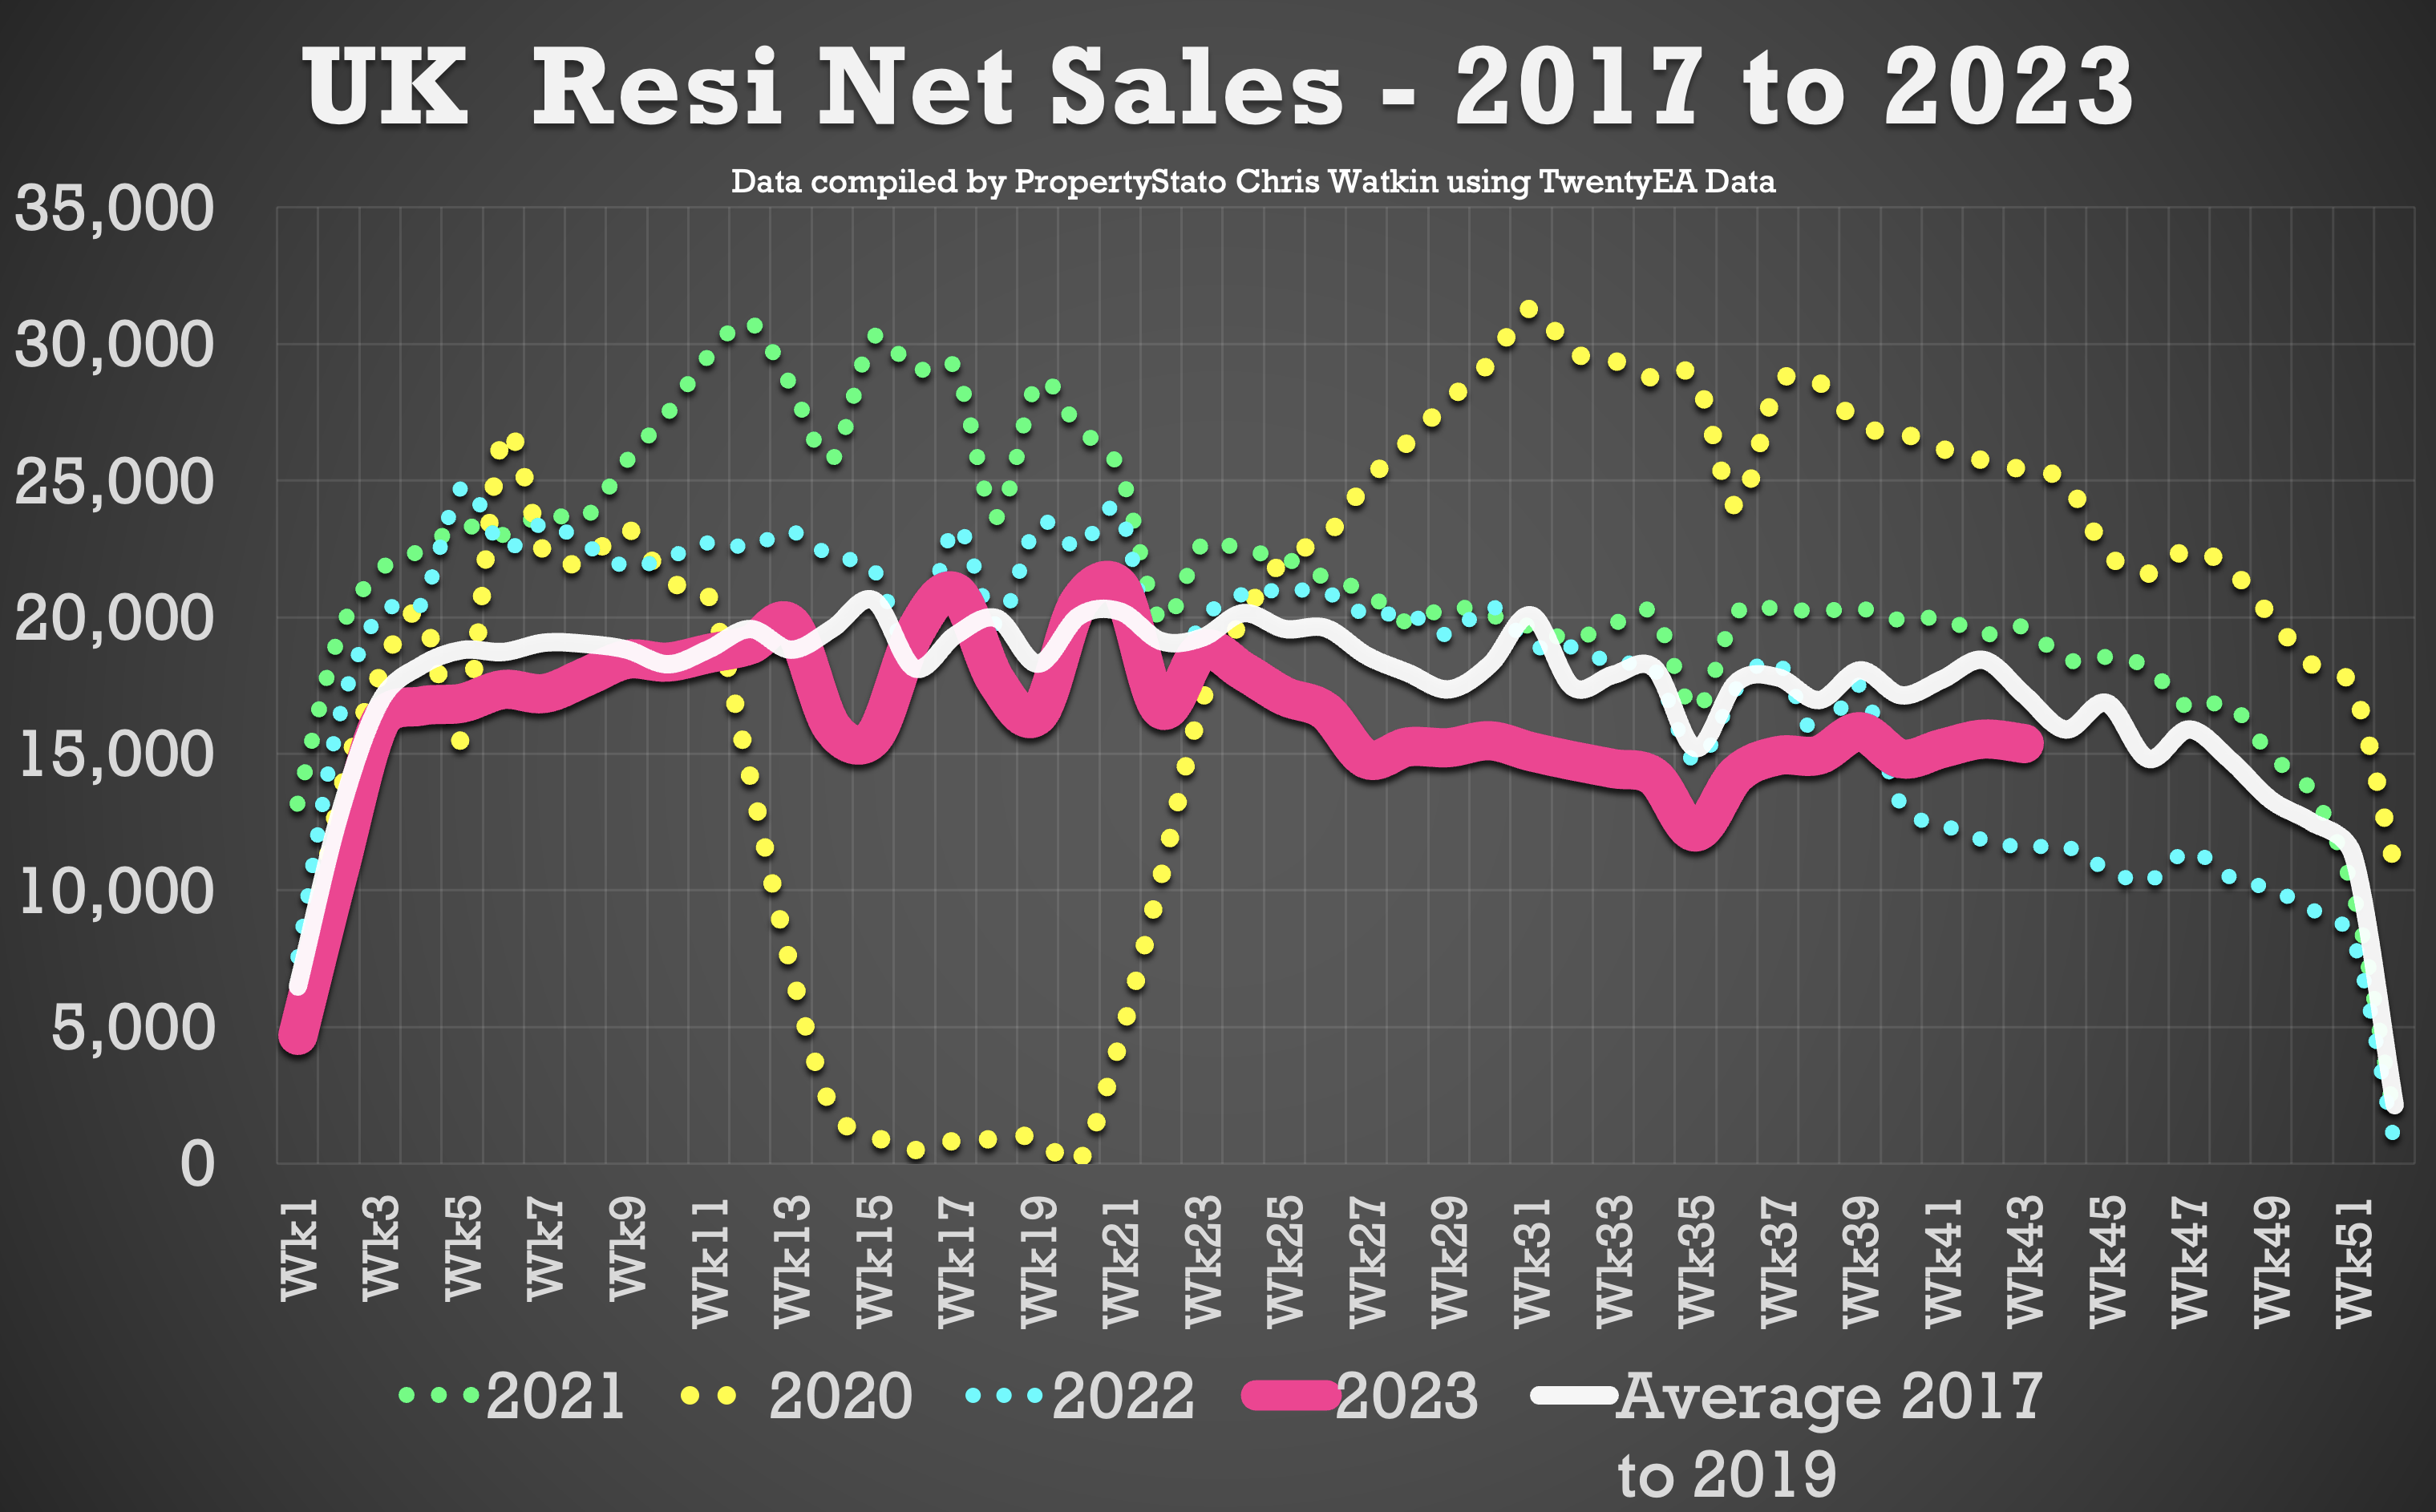
· Net Sales This Week: Net Sales increased to 15,387, excellent when compared to the running month average to 15,349. YTD running weekly average is 16,257.
· Net Sales Year-to-Date: Despite the challenges, the year-to-date net sales of 699k showcase despite the challenging economic news, the market is 10.3% behind the 2017/8/9 average YTD for net sales
· Sale Agreed £/sqft : Sales Agreed (ie went to Sold stc) in September 2023 achieved £330.54 /SqFt compared to Sale Agreed price of £328.93/SqFt in August 23. Interesting when you compare, September 22 when it’s £330.98 / SqFt (1.04% lower)
In the last 20 minutes of the show, there is the usual local focus, and this week it is on Weston-super-Mare.
Gross Sales as % of Listings
INNER LONDON 50.04%
OUTER LONDON 67.37%
SOUTH EAST 74.81%
SOUTH WEST 76.67%
EAST OF ENGLAND 71.39%
EAST MIDLANDS 77.79%
WEST MIDLANDS 79.14%
YORKSHIRE & HUMBER 82.83%
NORTH EAST 78.56%
NORTH WEST 78.60%
WALES 80.68%
SCOTLAND 93.42%
You must be logged in to like or dislike this comments.
Click to login
Don't have an account? Click here to register
% Sales that fell thru rate –
The Sale fall Thru Rate % is the number of Sales fall Thrus for the week expressed as a percentage of Gross Sales for the week.
INNER LONDON 25.25%
OUTER LONDON 28.04%
SOUTH EAST 28.26%
SOUTH WEST 28.54%
EAST OF ENGLAND 26.66%
EAST MIDLANDS 24.98%
WEST MIDLANDS 26.53%
YORKSHIRE & HUMBER 24.95%
NORTH EAST 25.72%
NORTH WEST 29.97%
WALES 26.05%
SCOTLAND 14.27%
You must be logged in to like or dislike this comments.
Click to login
Don't have an account? Click here to register
Price Changes as % of Listings this week
INNER LONDON 74.19%
OUTER LONDON 80.48%
SOUTH EAST 86.20%
SOUTH WEST 78.37%
EAST OF ENGLAND 84.66%
EAST MIDLANDS 90.33%
WEST MIDLANDS 83.08%
YORKSHIRE & HUMBER 72.80%
NORTH EAST 65.37%
NORTH WEST 71.87%
WALES 76.65%
SCOTLAND 43.95%
You must be logged in to like or dislike this comments.
Click to login
Don't have an account? Click here to register
Net Sales as % listing this week
INNER LONDON 37.41%
OUTER LONDON 48.48%
SOUTH EAST 53.67%
SOUTH WEST 54.79%
EAST OF ENGLAND 52.36%
EAST MIDLANDS 58.35%
WEST MIDLANDS 58.15%
YORKSHIRE & HUMBER 62.16%
NORTH EAST 58.35%
NORTH WEST 55.05%
WALES 58.15%
SCOTLAND 80.09%
You must be logged in to like or dislike this comments.
Click to login
Don't have an account? Click here to register