


Even if you’re not from Tooting and you are an agent who is suffering from overvaluing or cheap fees by your competitors, we are going to be using a bit of software that you can use yourselves to stop losing listings by proving that you are the better agent and enable you to charge higher fees.
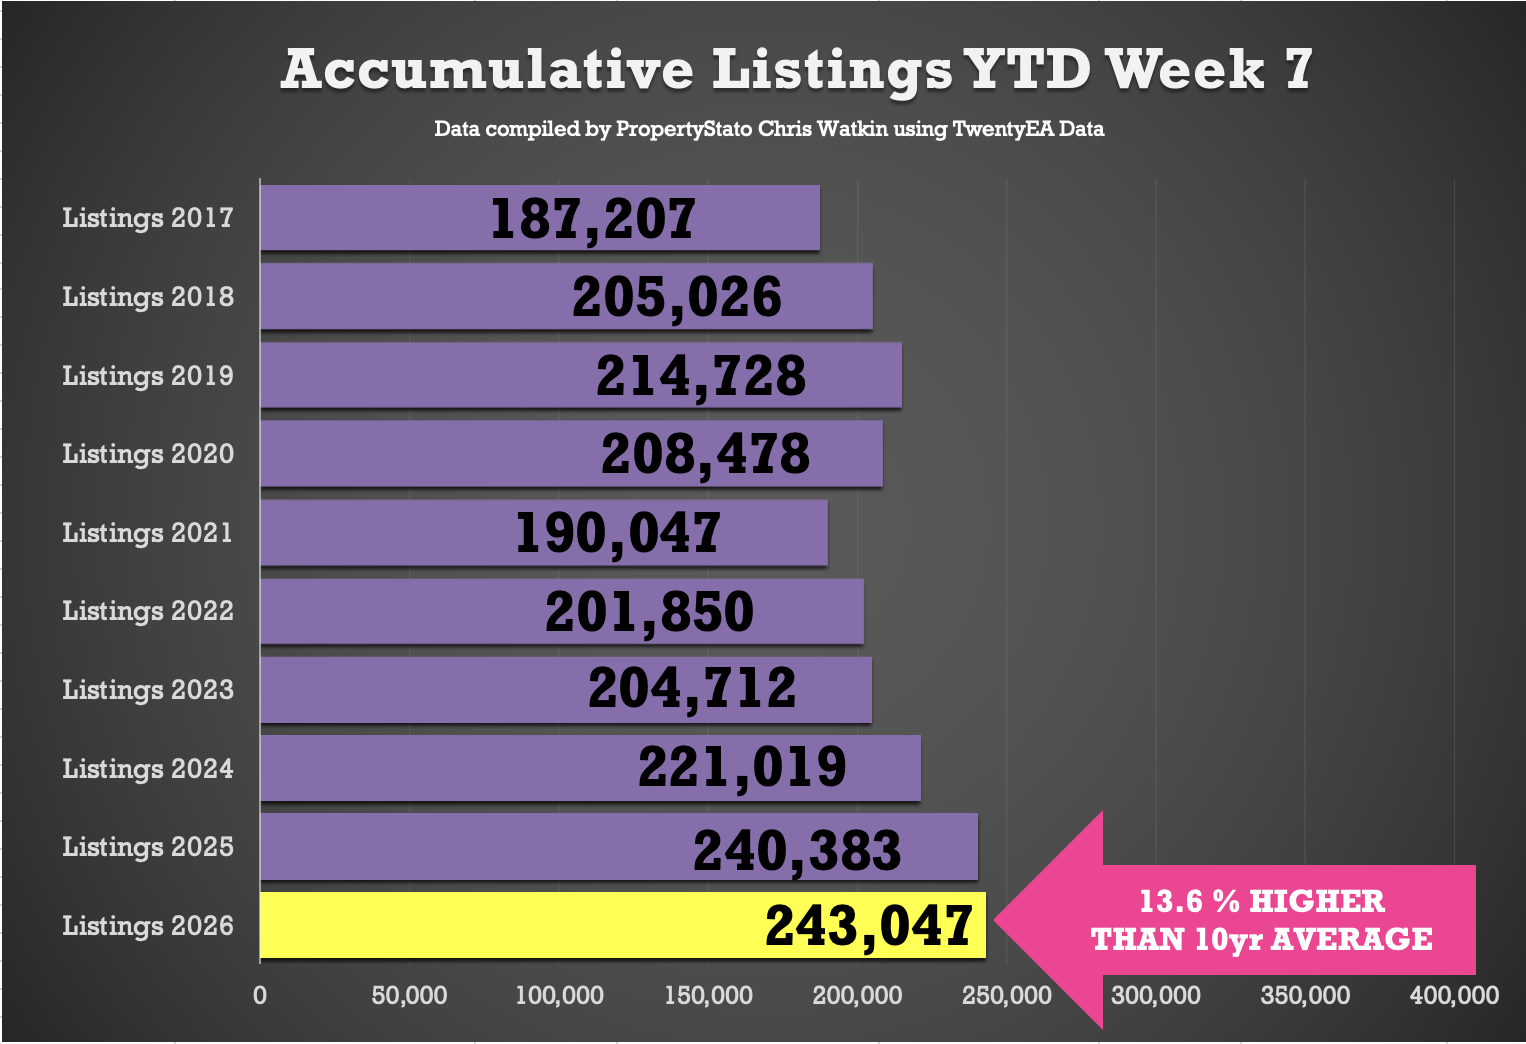
🟩 Listings YTD
243k new properties have come onto the market YTD , 1% ahead of 2025, 10% above 2024, and 20% higher than the 2017–19 average.
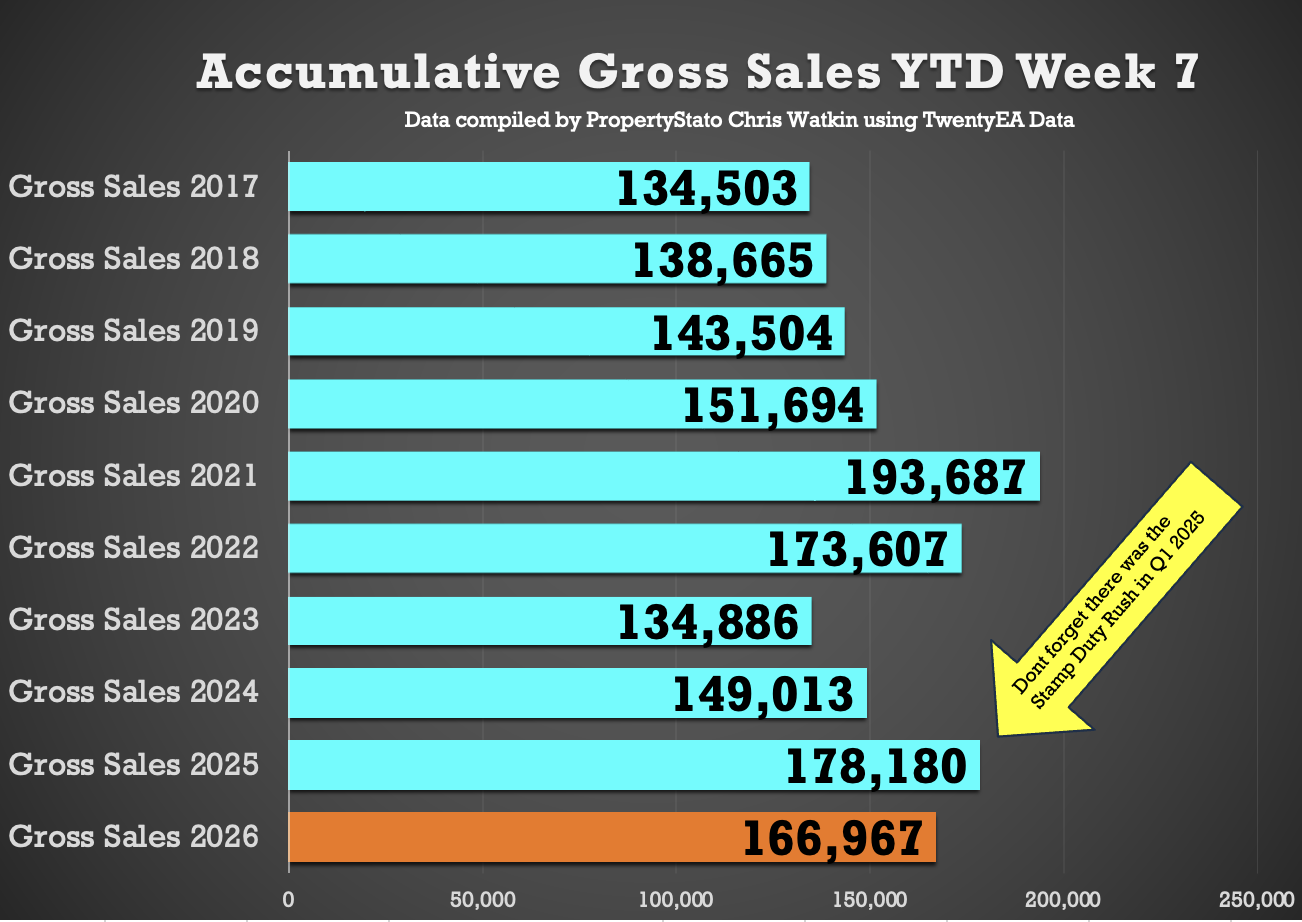
🟩 Gross Sales YTD
167k UK homes sold STC YTD , 6% lower than 2025, 12% higher than 2024 and 20% above pre Covid norms.
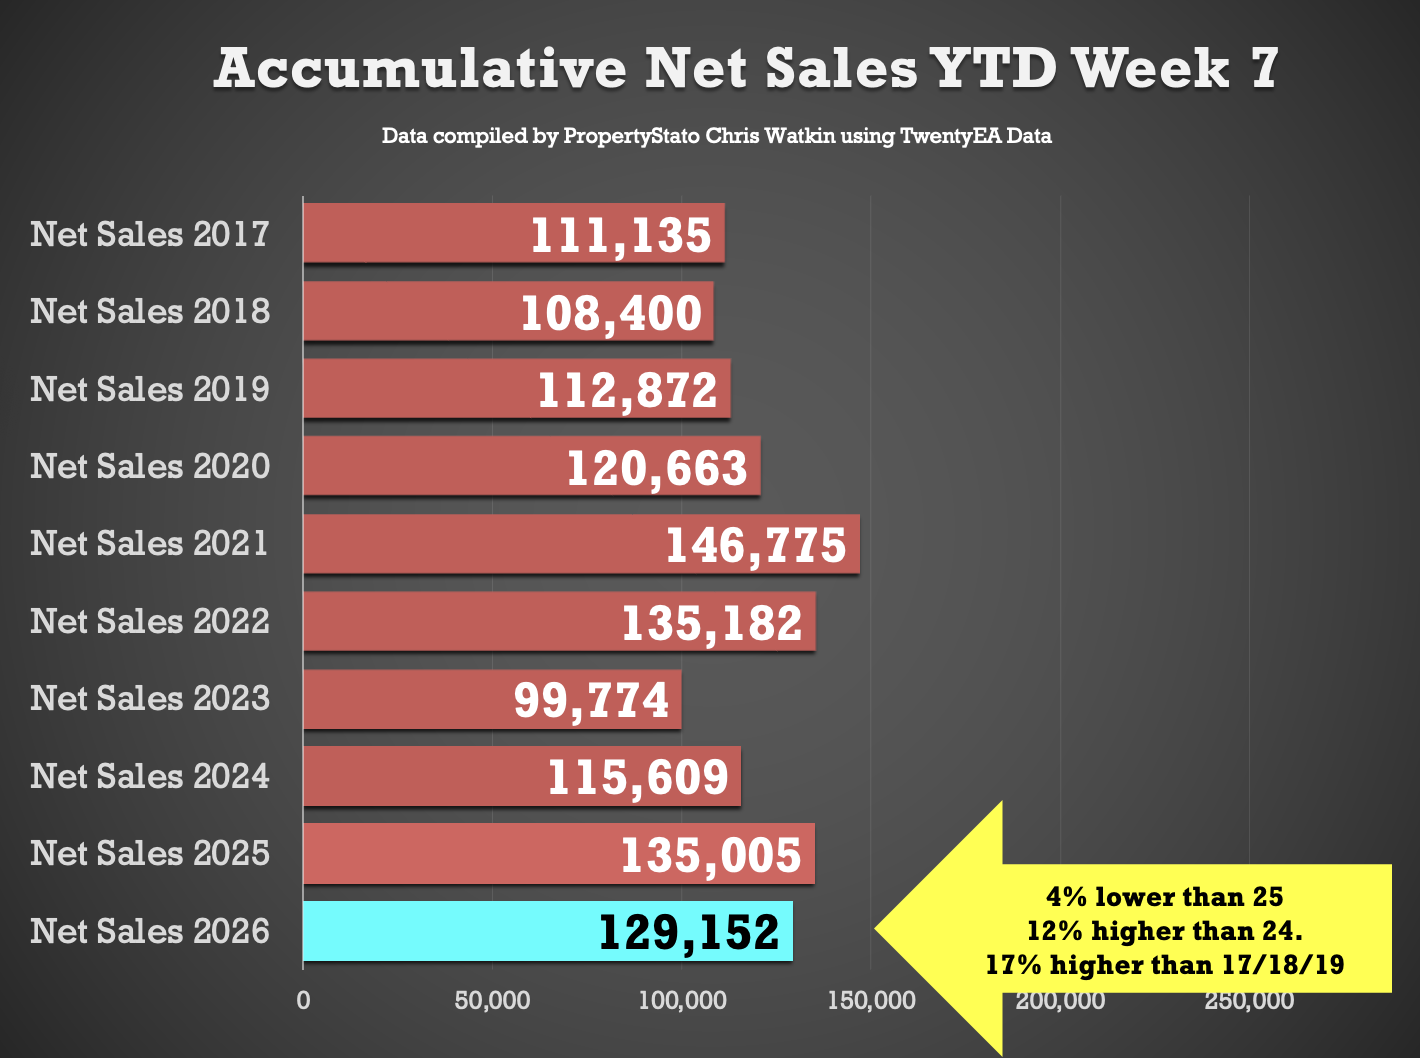
🟩 Net Sales YTD
129k UK net home sales YTD (Net Sales being Gross sales less Fall Thrus). 4% lower than 2025, 12% ahead of 2024, 29% ahead of 2023 and 17% above the 2017–19 average.
🟥 Overvaluing
47% of the homes that left UK Estate Agents books in January were withdrawn unsold. Main cause – blatant overvaluing supported by long sole agency agreements of 20+ weeks.
Detailed Breakdown …
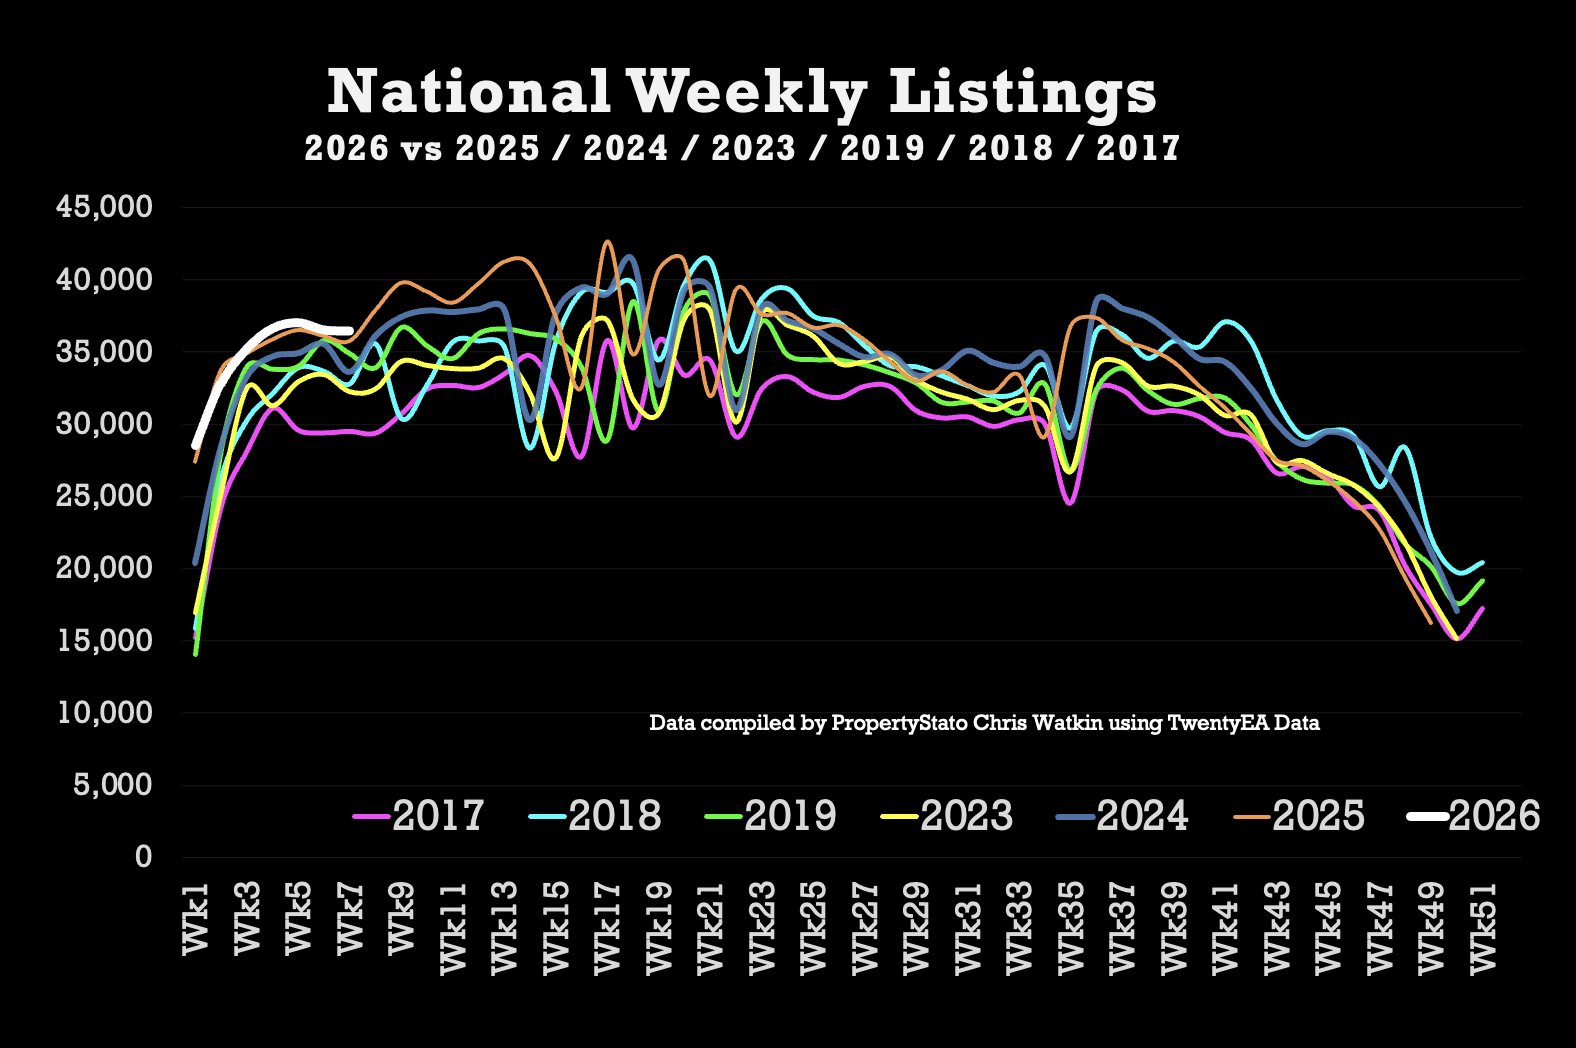
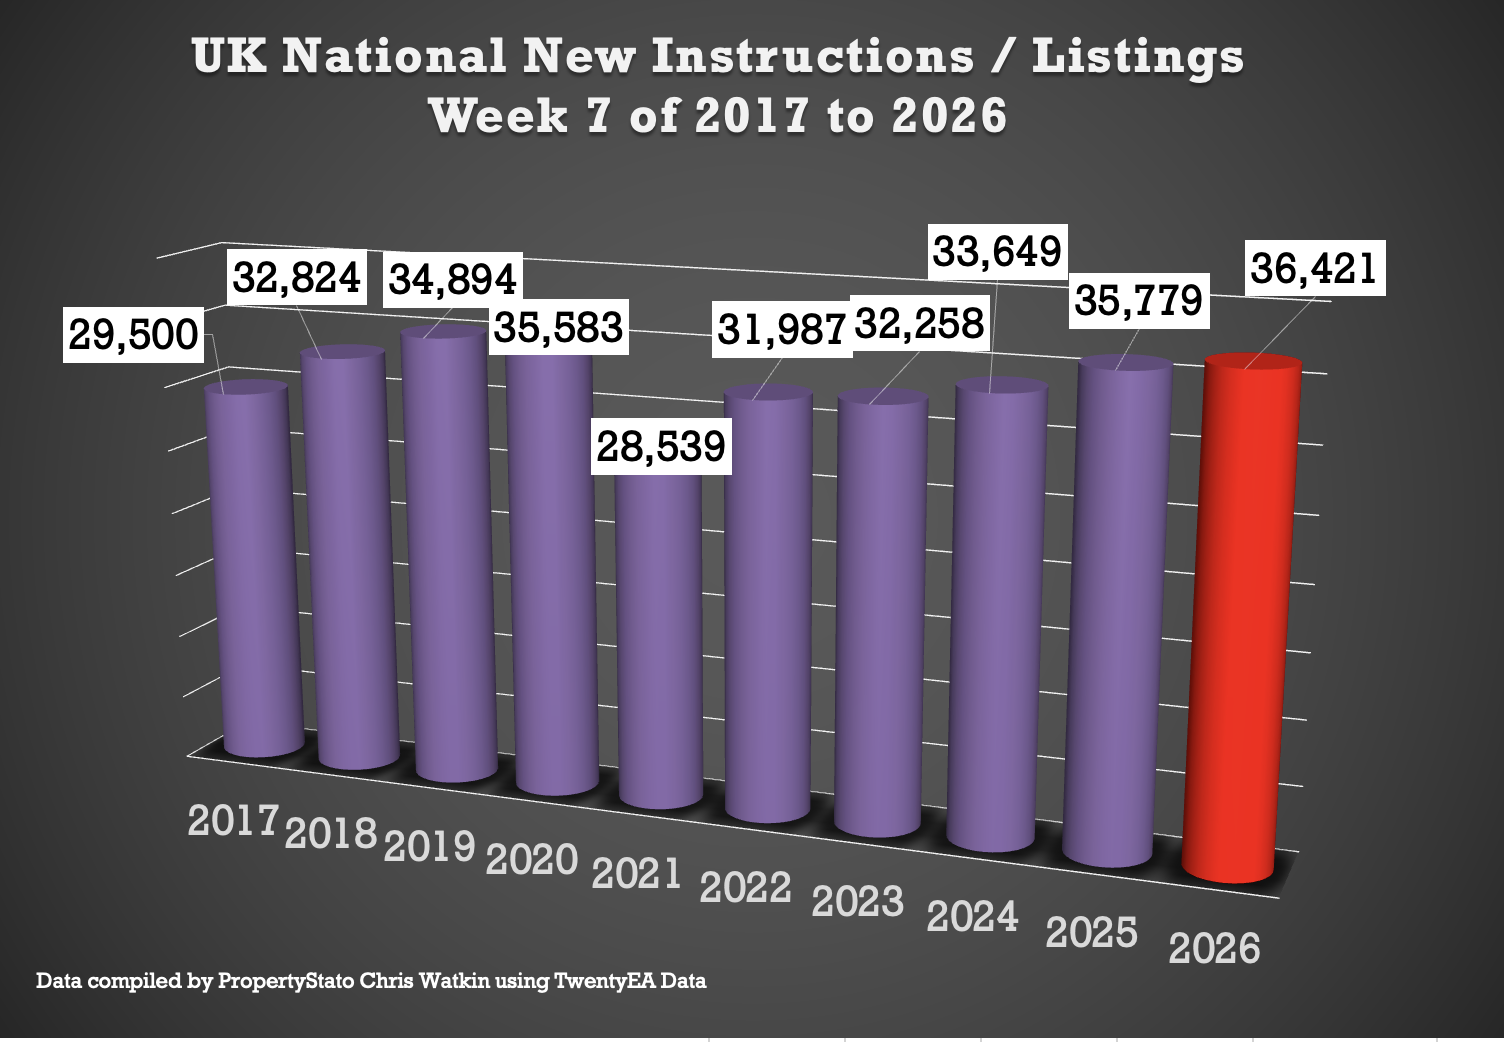
✅ New Listings
36.4k new properties came onto market this week in week 6, slightly down from 36.5k last week.
2025 weekly average: 30.6k.
10-year week 7 average : 33.1k.
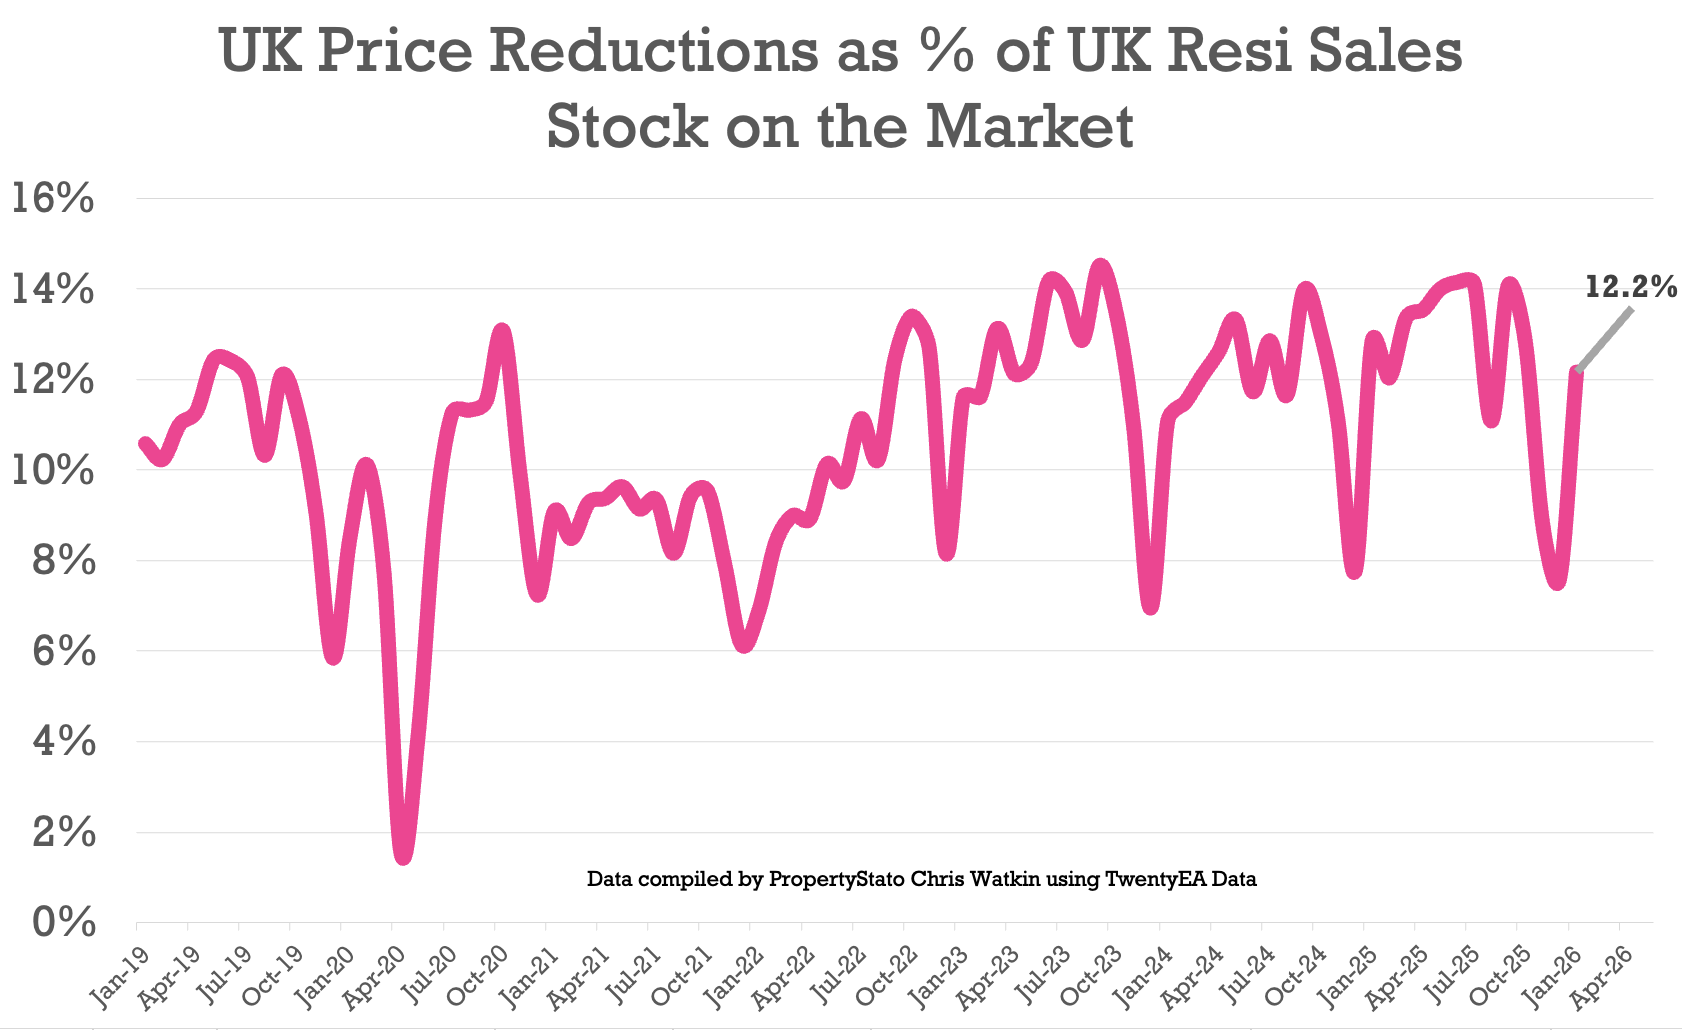
✅ Price Reductions
19.8k reductions this week
12.2% of resi homes for sale were reduced in January. Jan 25 – 12.8%. Jan 24 – 11.1%
2025 average was 12.8%, versus the 5-year long-term average of 10.74%.
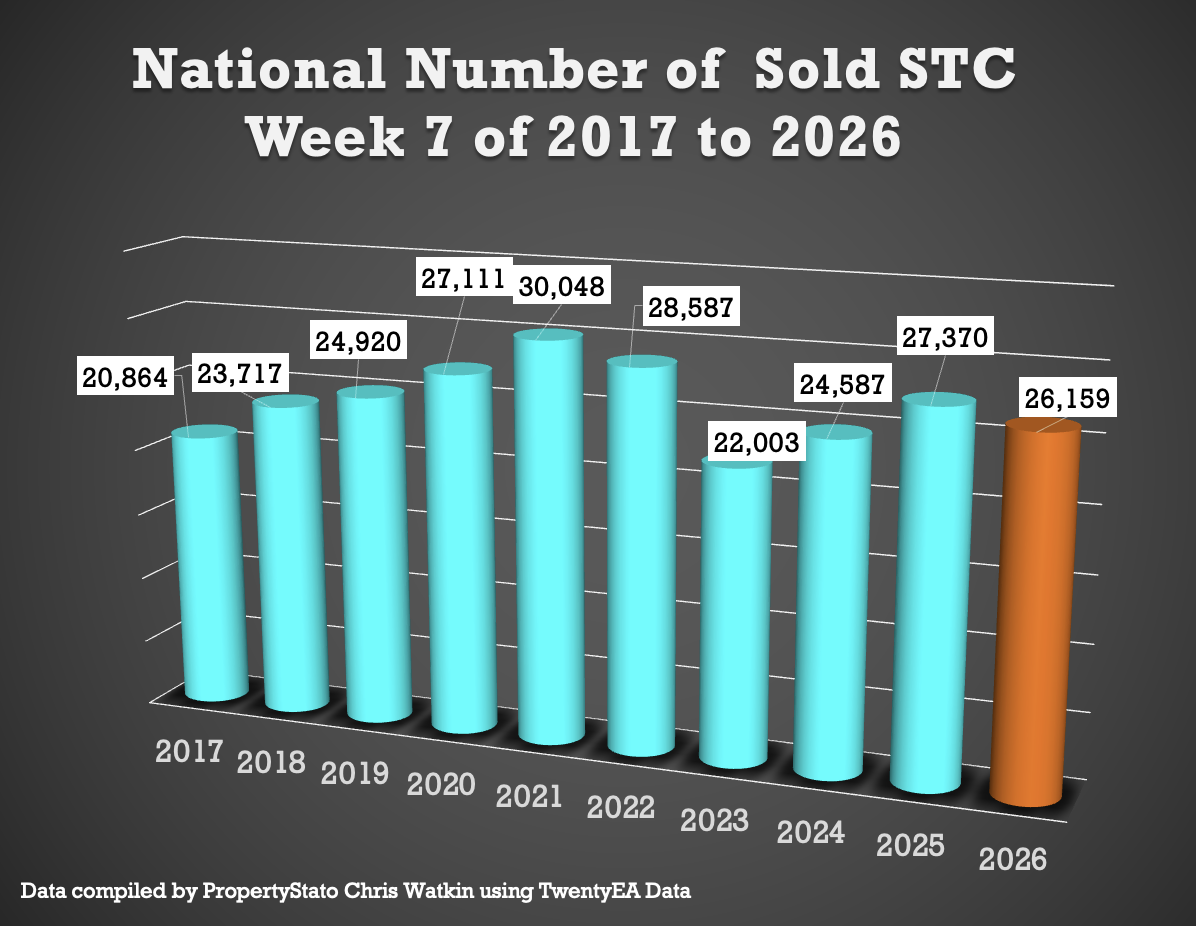
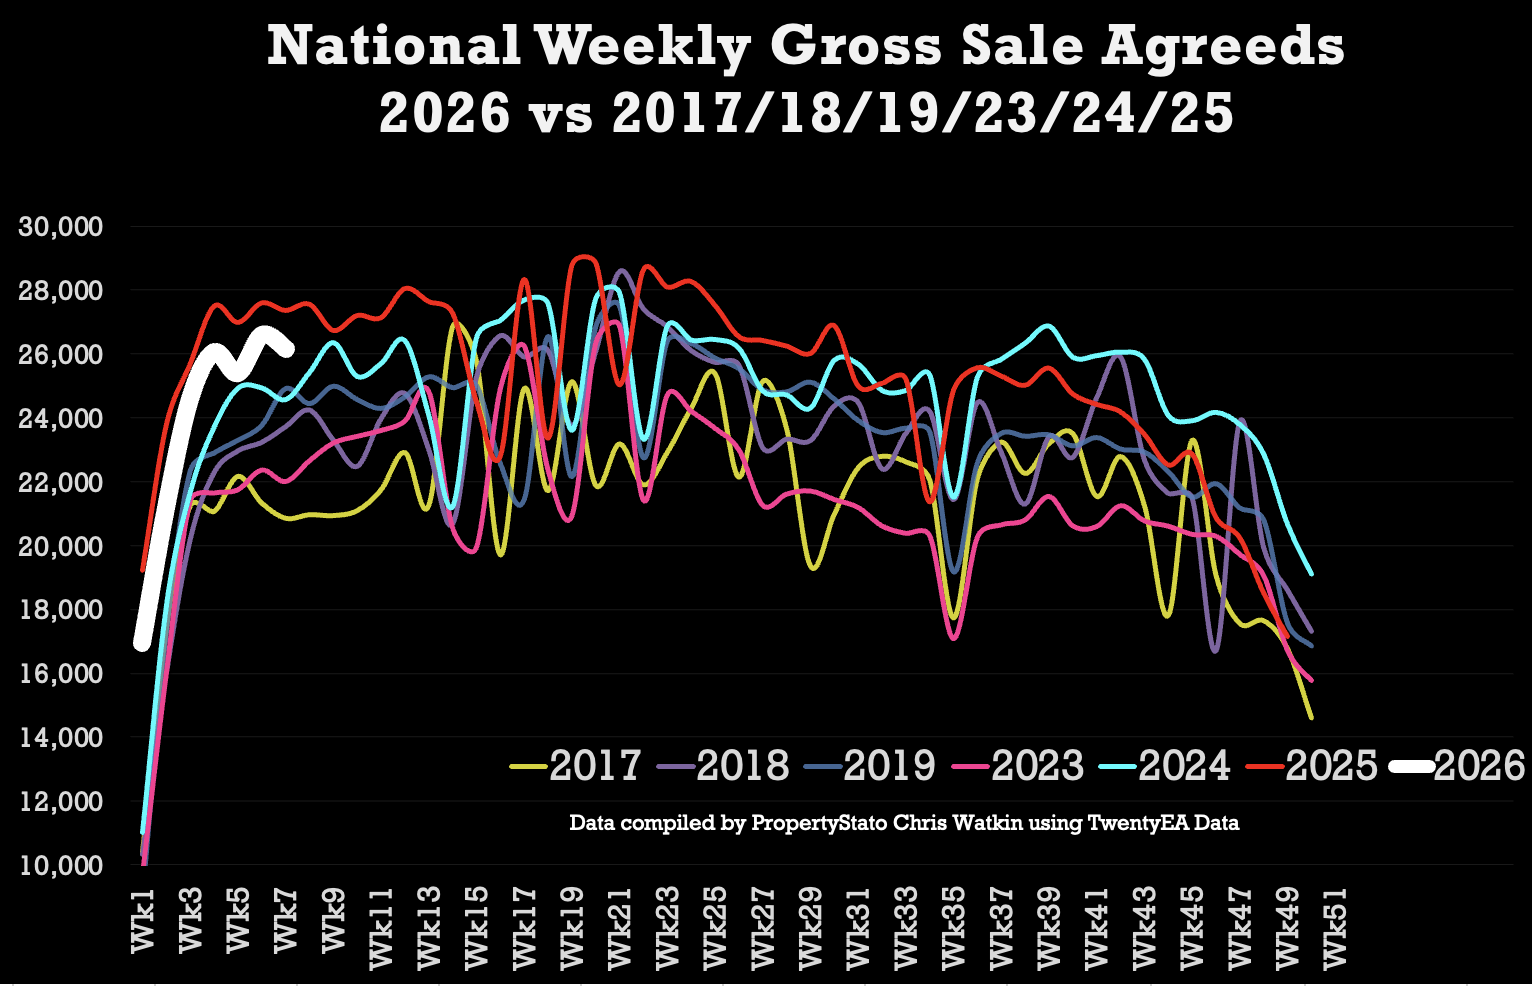
✅ Sales Agreed
26.2k homes sold stc this week 7, down slightly from 26.6k last week.
Week 7 average (for last 10 years) : 25.5k
2026 weekly average : 22.2k.
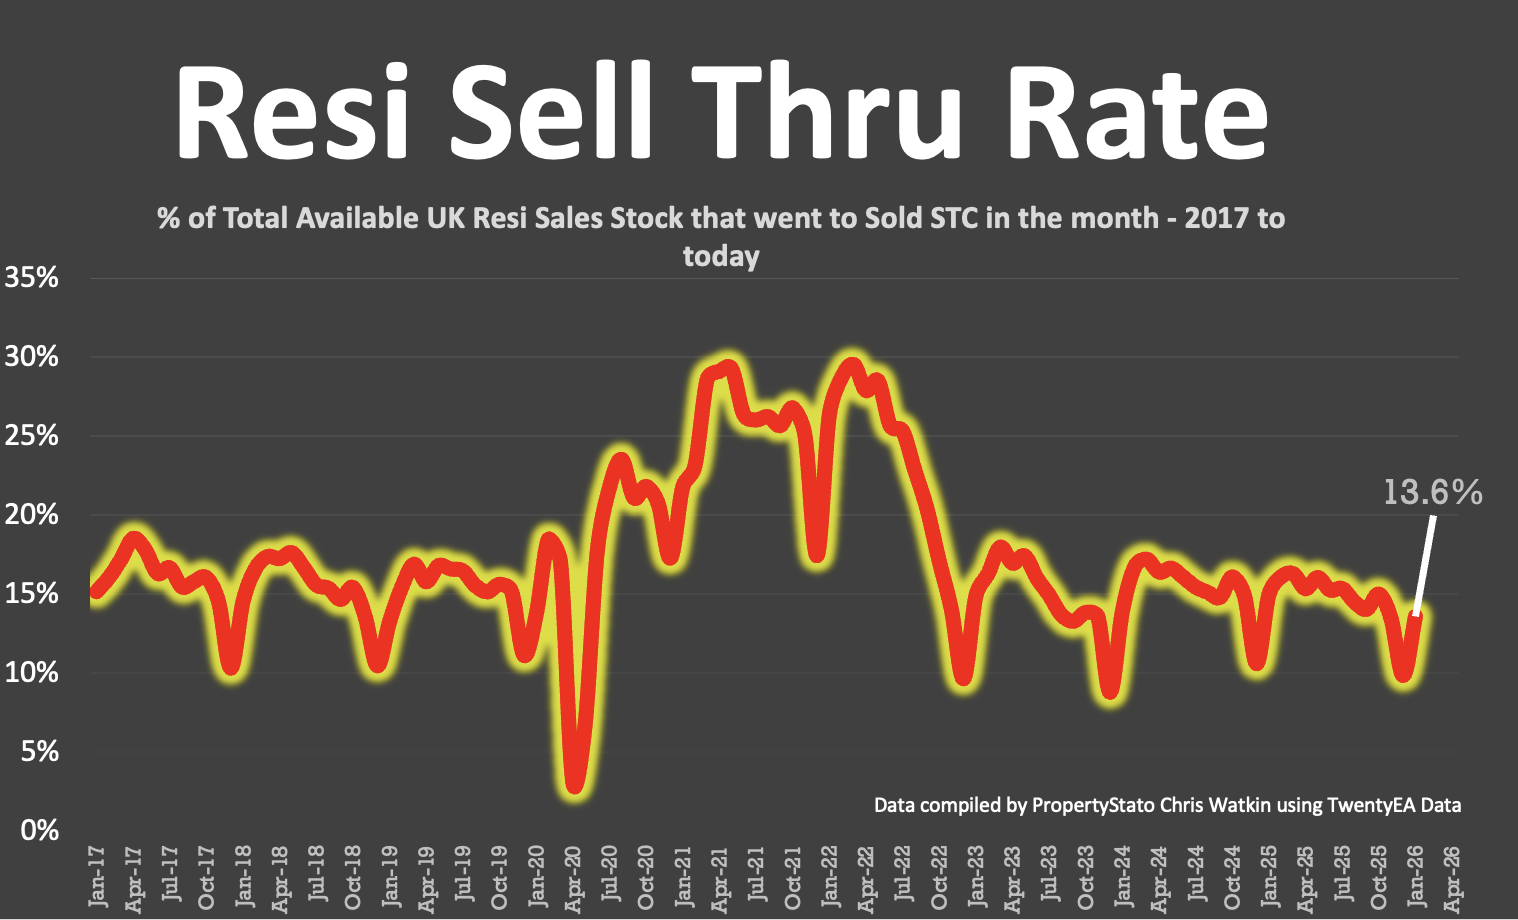
✅ Sell-Through Rate
3.6% of homes on agents’ books went SSTC in January ’26. (Jan ’25 – 15% / Jan ’24 – 13.9%)
Pre-Covid average: 15.5%.
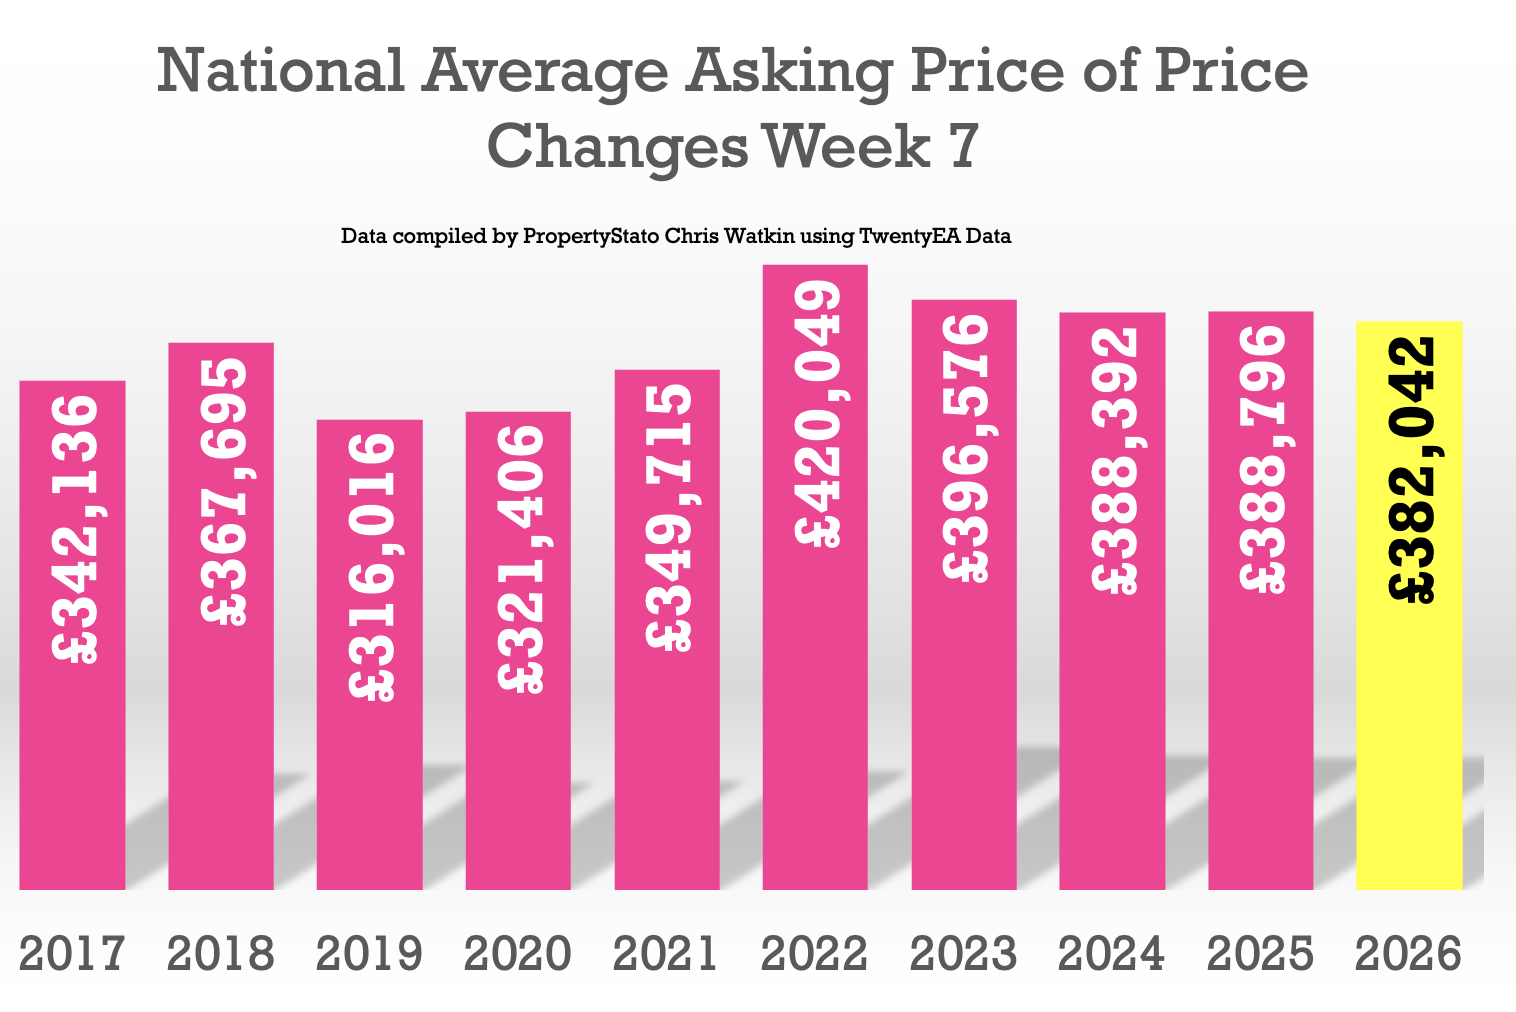
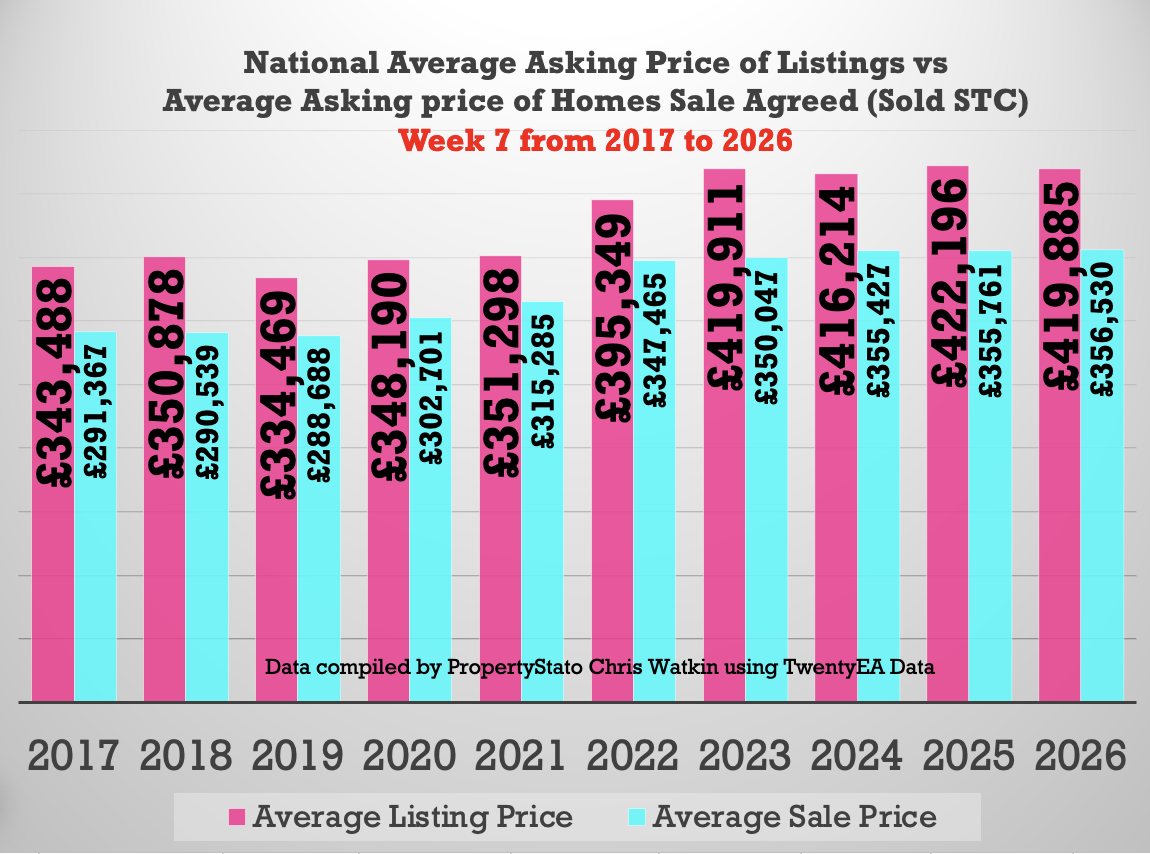
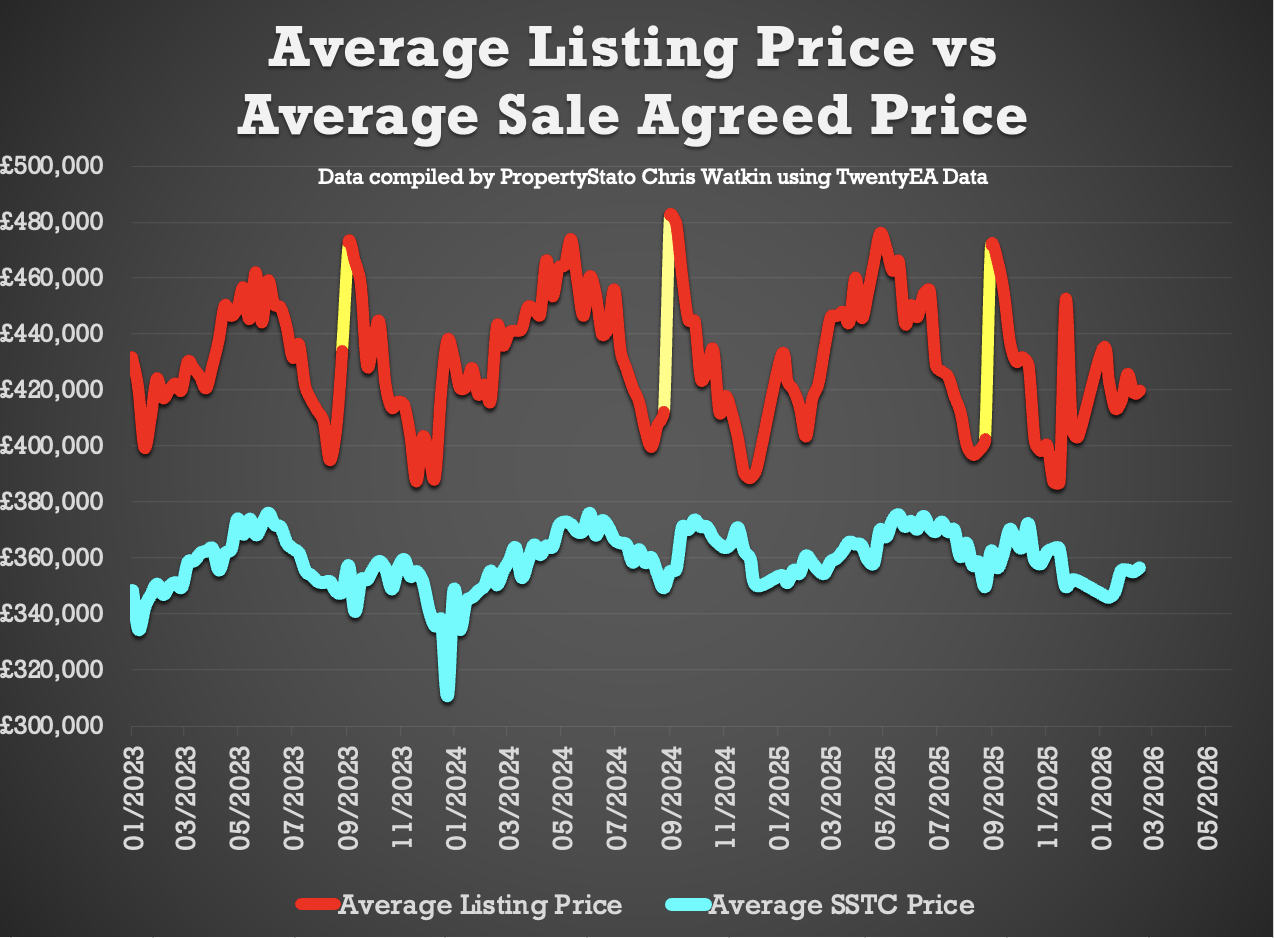
✅ Price Difference between Listings & Sales
17.8% difference (long-term 10 year average is 16% to 17%). (£425k ave Listing Ave Asking price vs £366k Sale Agreed ave Asking price). Note, this doesn’t mean the gap between what houses are coming on for Amber and what they’re selling is nearly £60k. A larger proportion of the lower price properties sell compared to the higher price properties, average price of the property selling is dragged down.
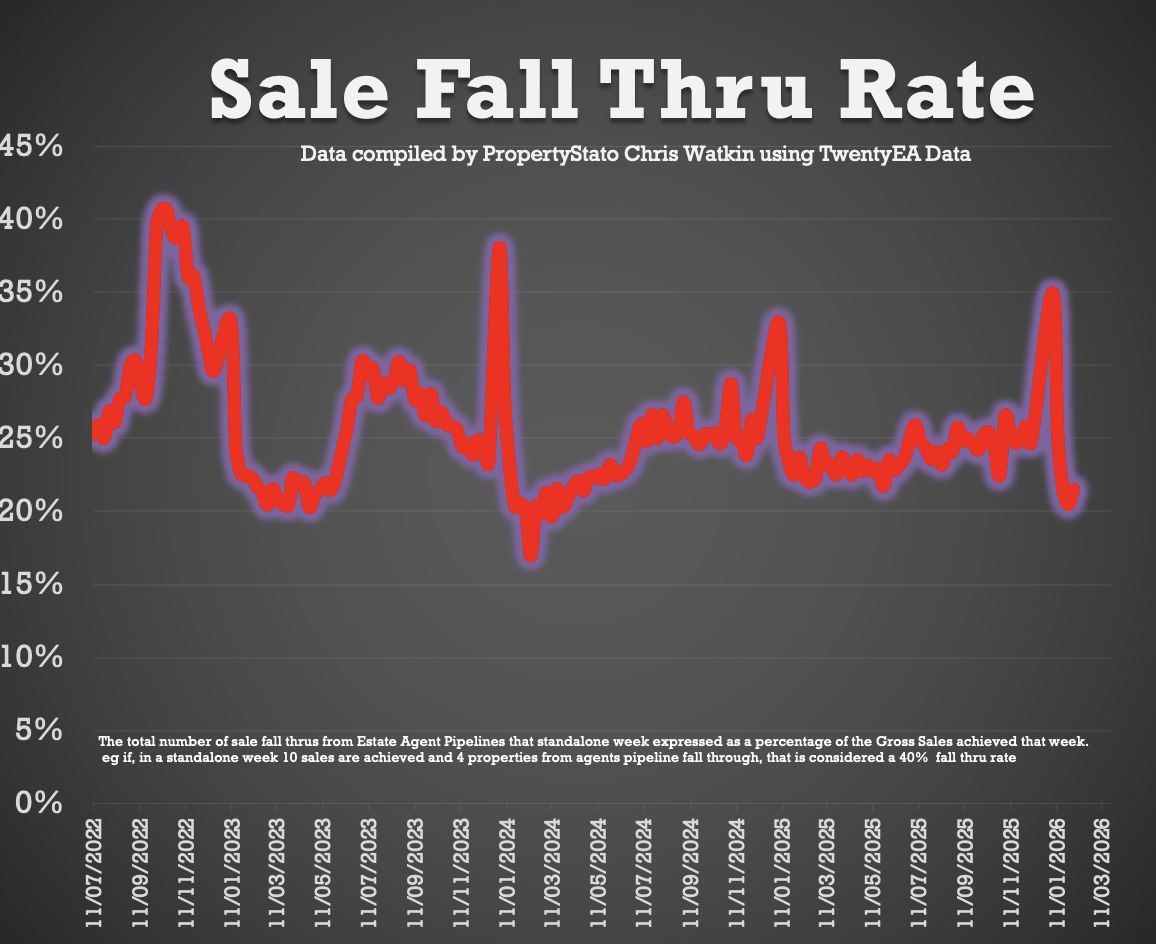
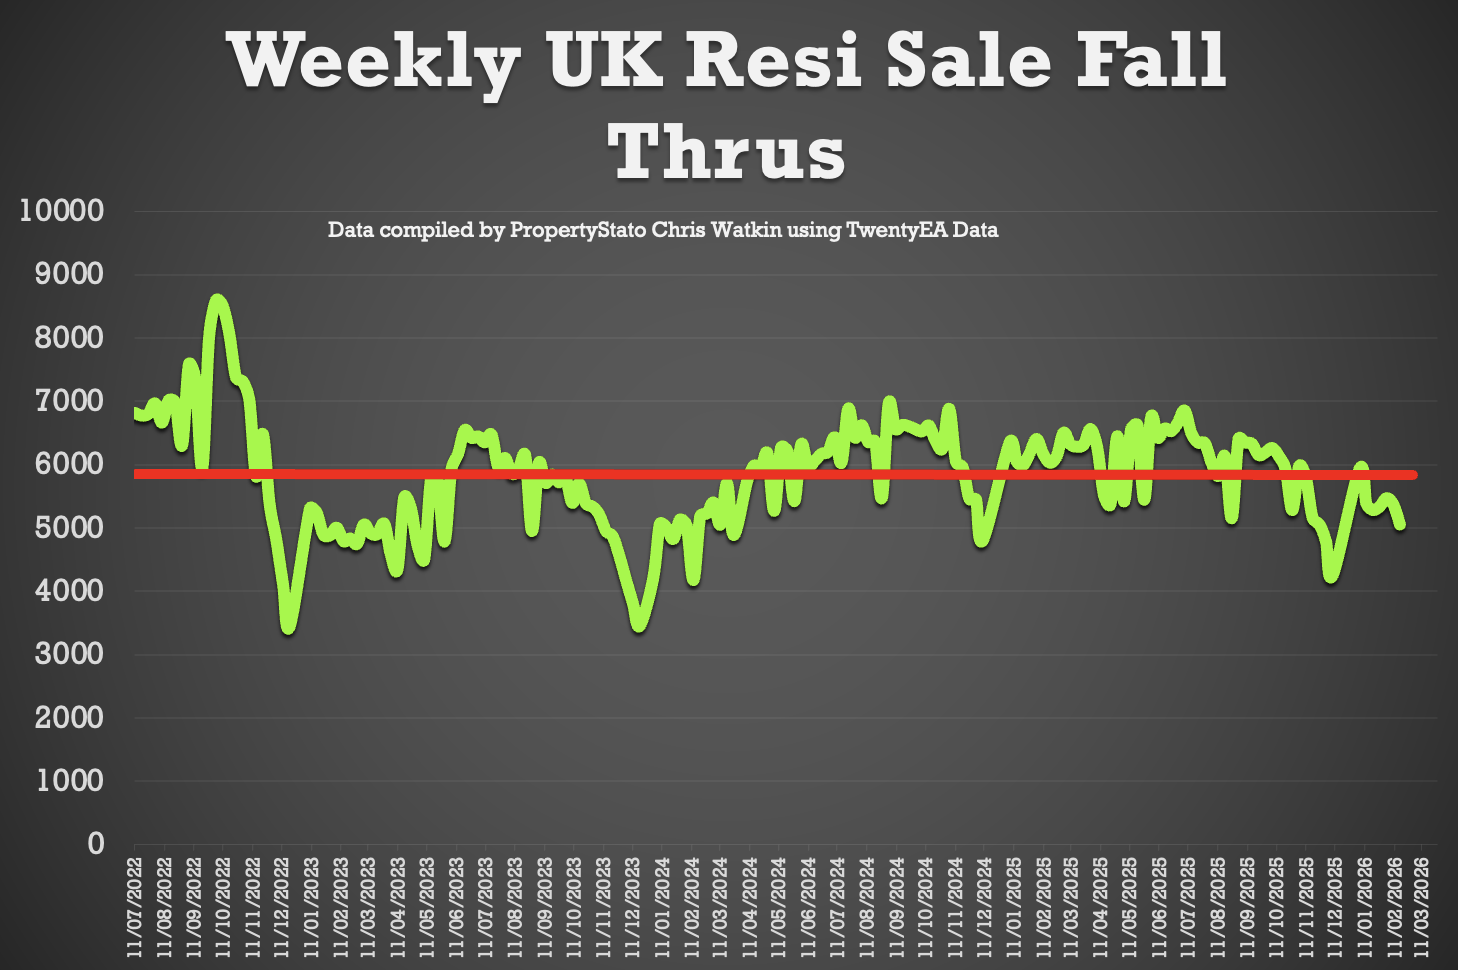
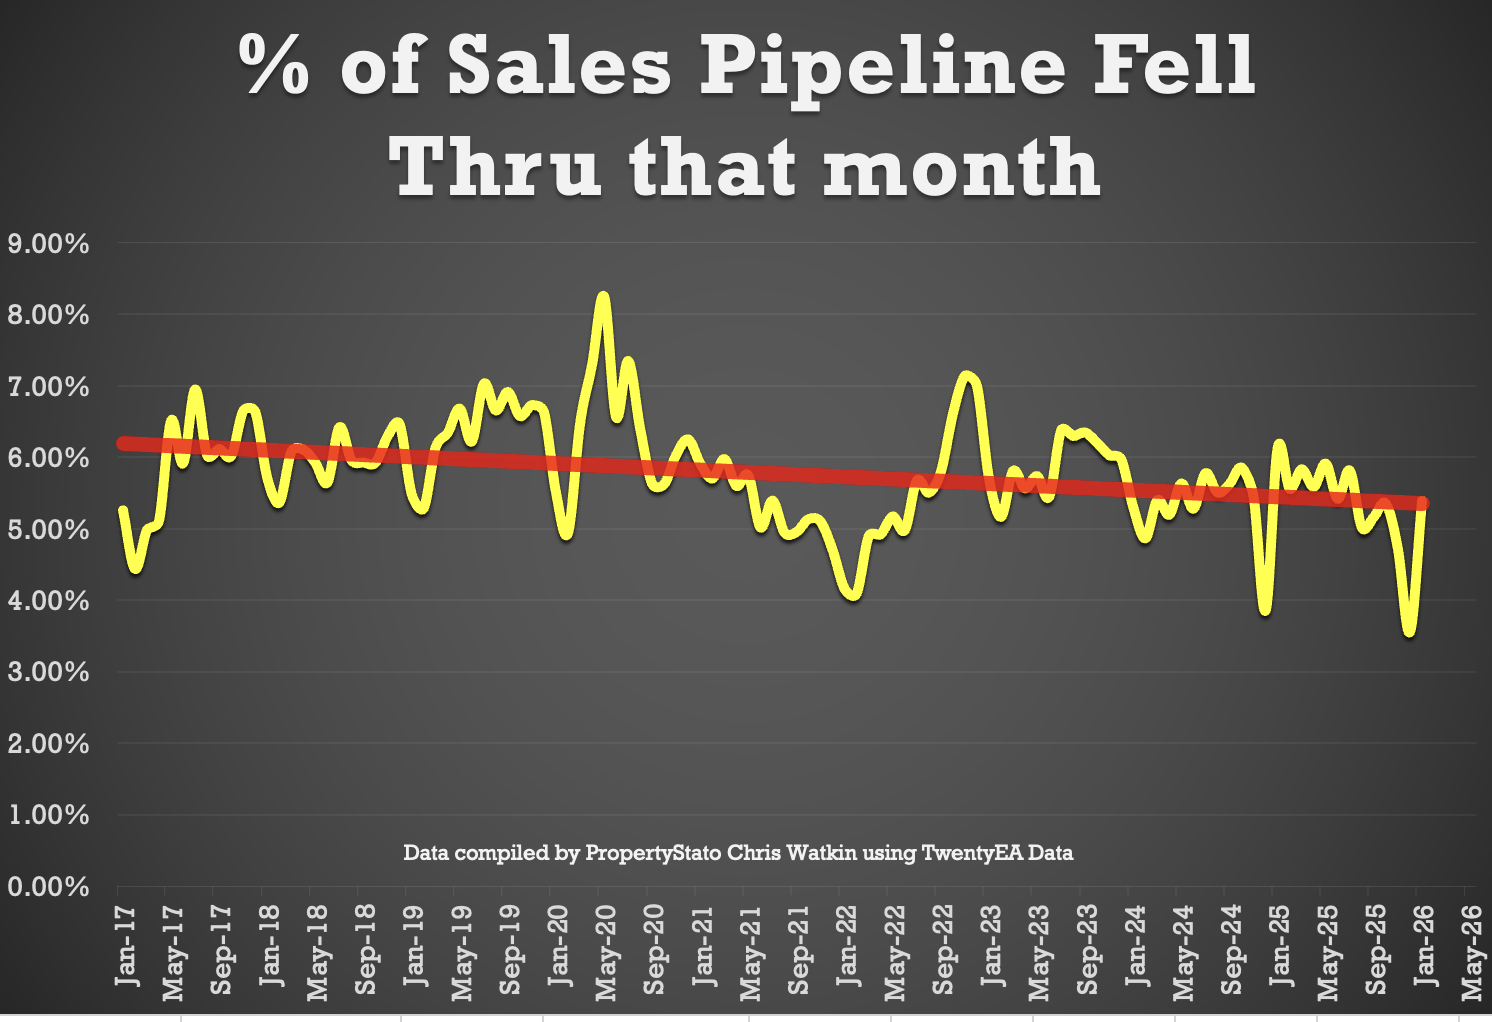
✅ Fall-Throughs
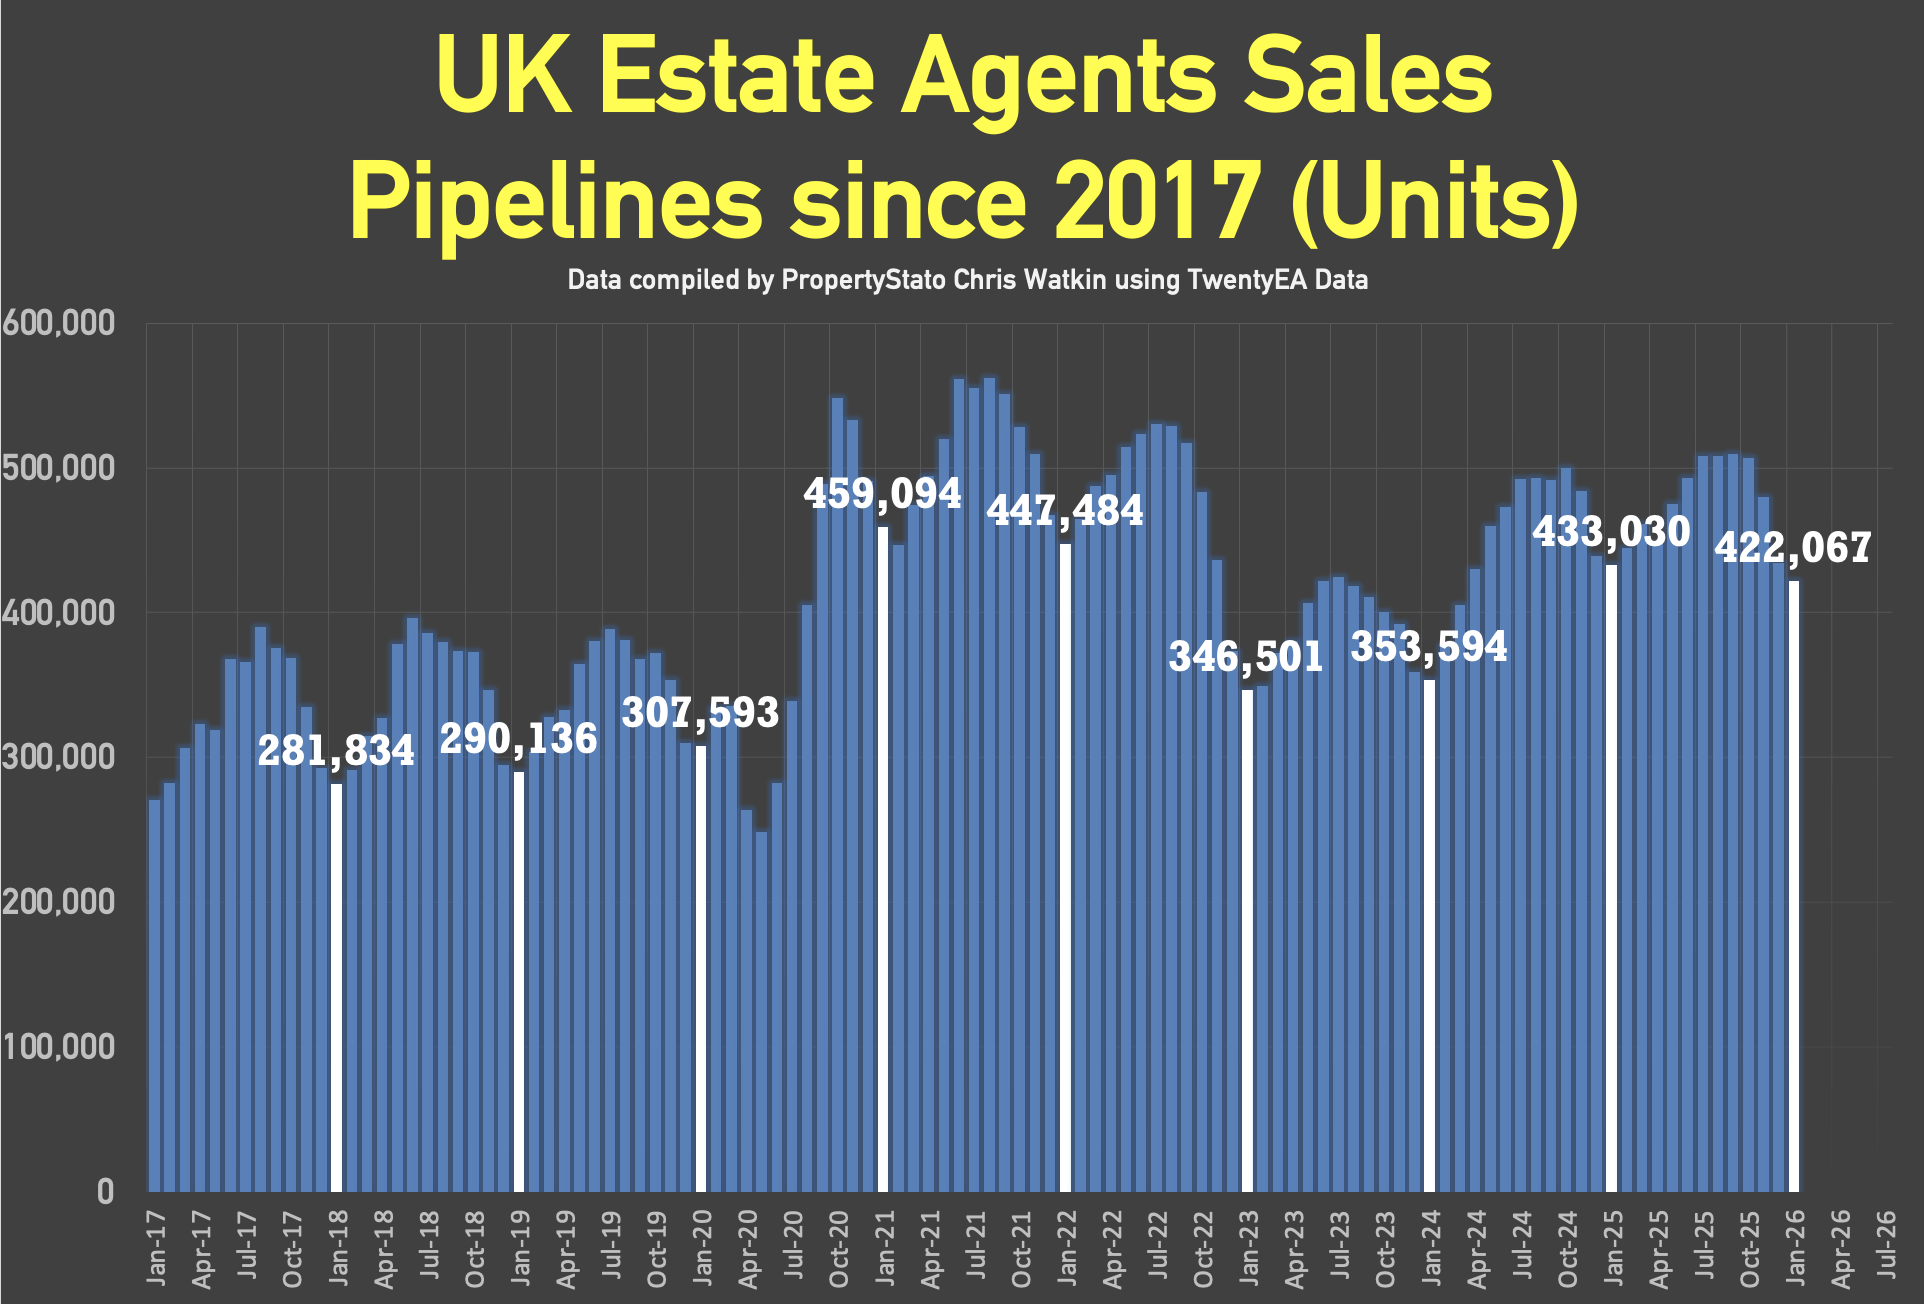
5,371 fall-throughs last week (pipeline of 422k home Sold STC).
Weekly average for 2025: 6,100.
Fall-through rate: 20.2%, down from 21.5% last week.
Long-term average: 24.2% (post-Truss chaos saw levels exceed 40%).
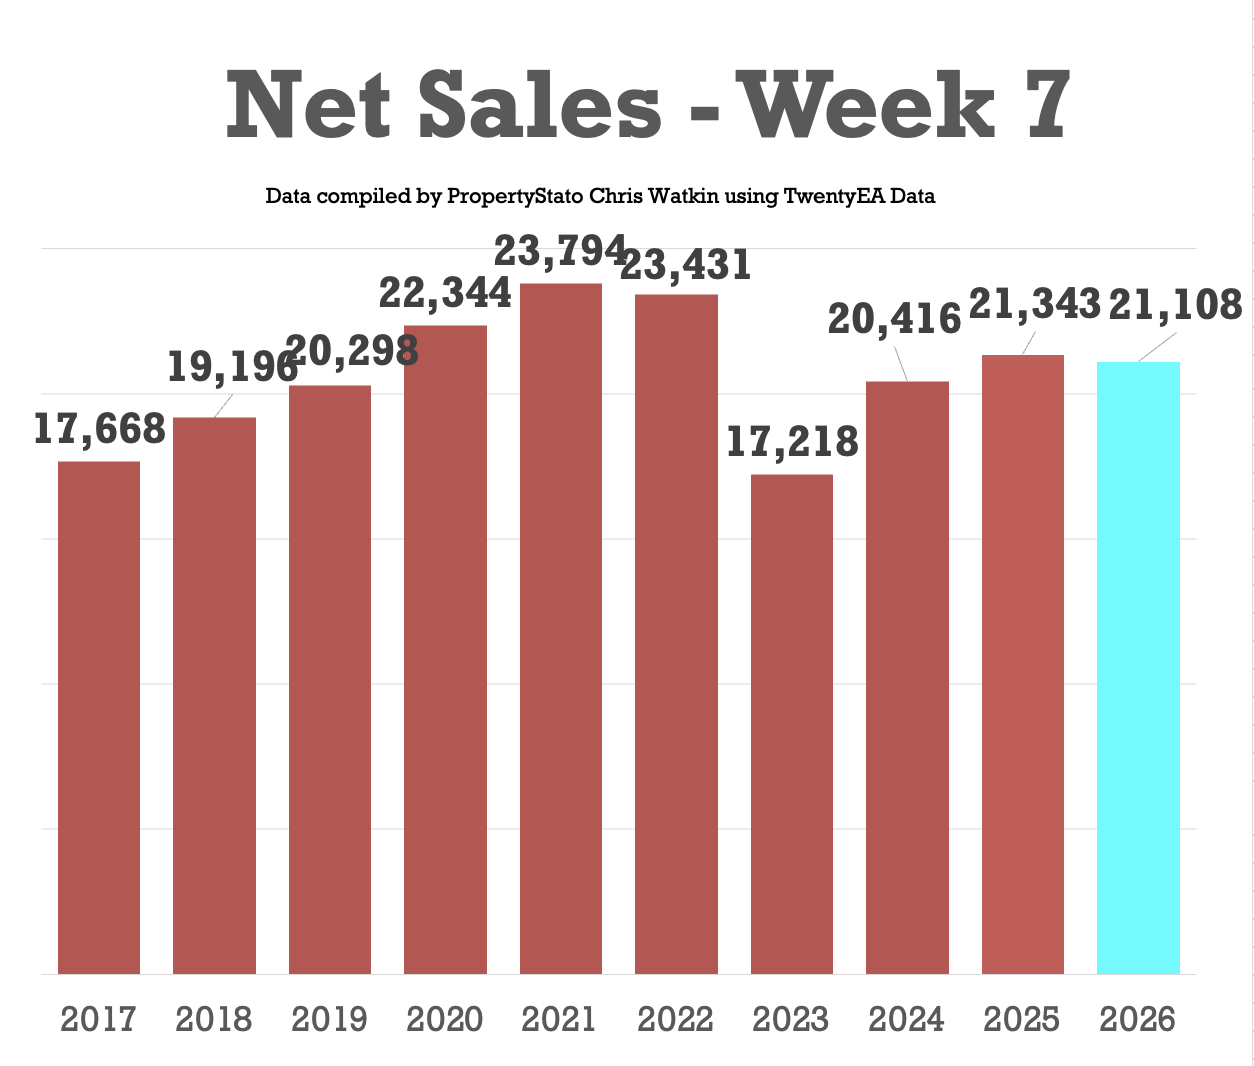
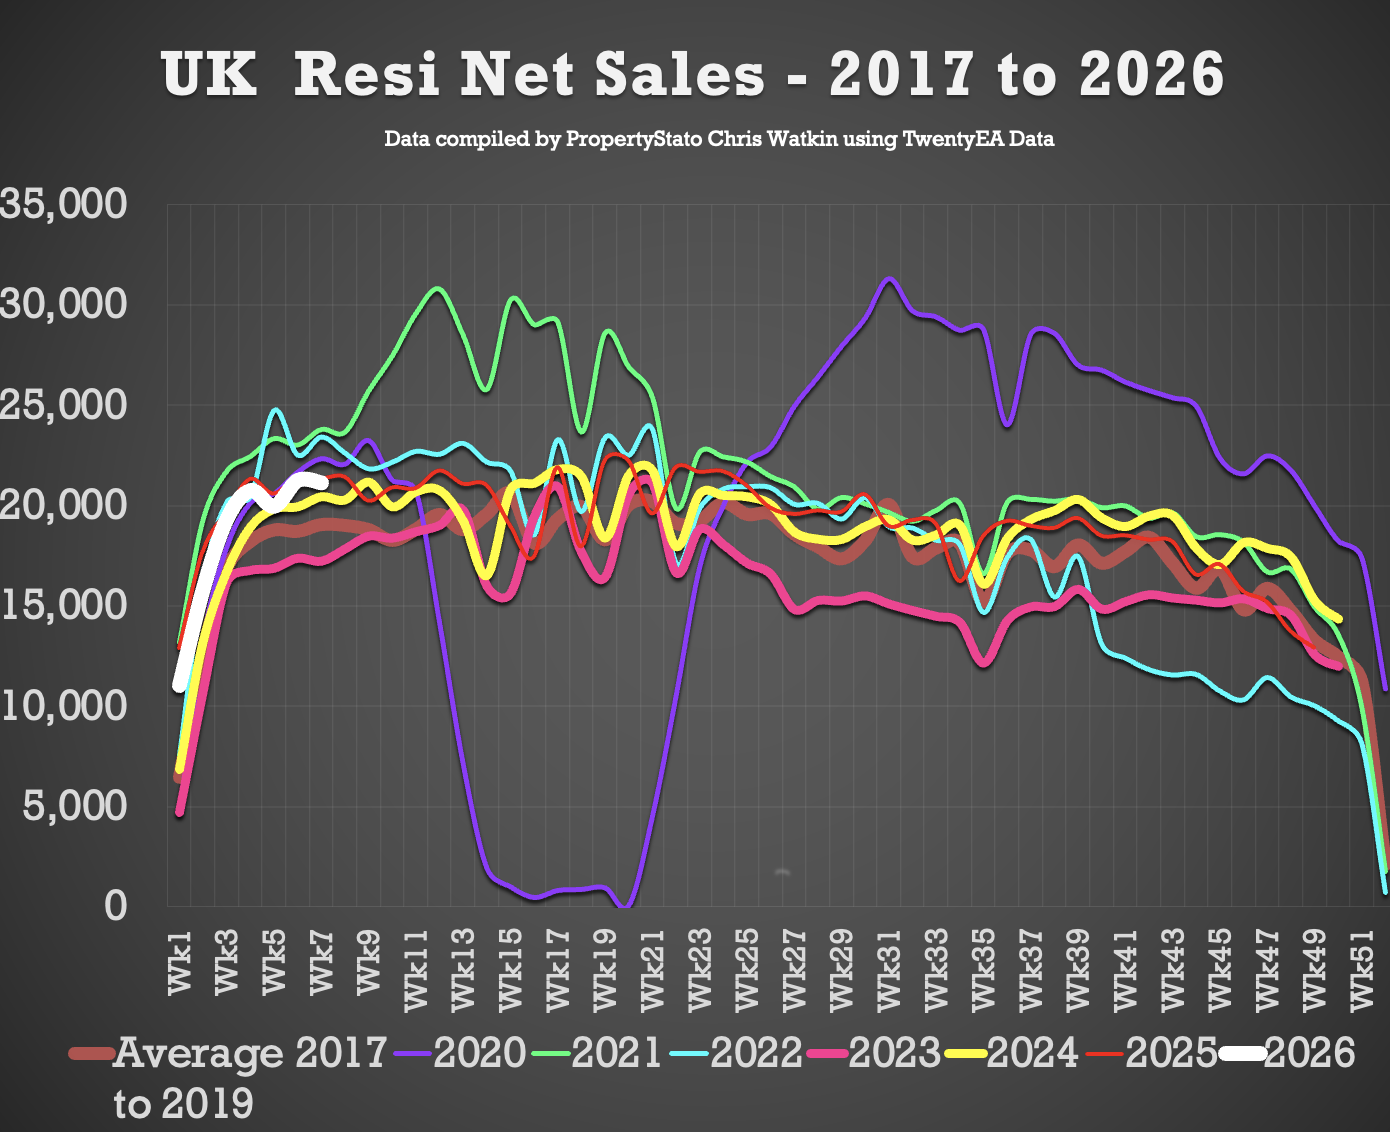
✅ Net Sales
21.1k Net Sales, down slightly from 21.2k last week
Ten-year Week 7 average: 20.7k.
Weekly average for 2026: 18k.
Weekly average for the whole of 2025: 18.4k.
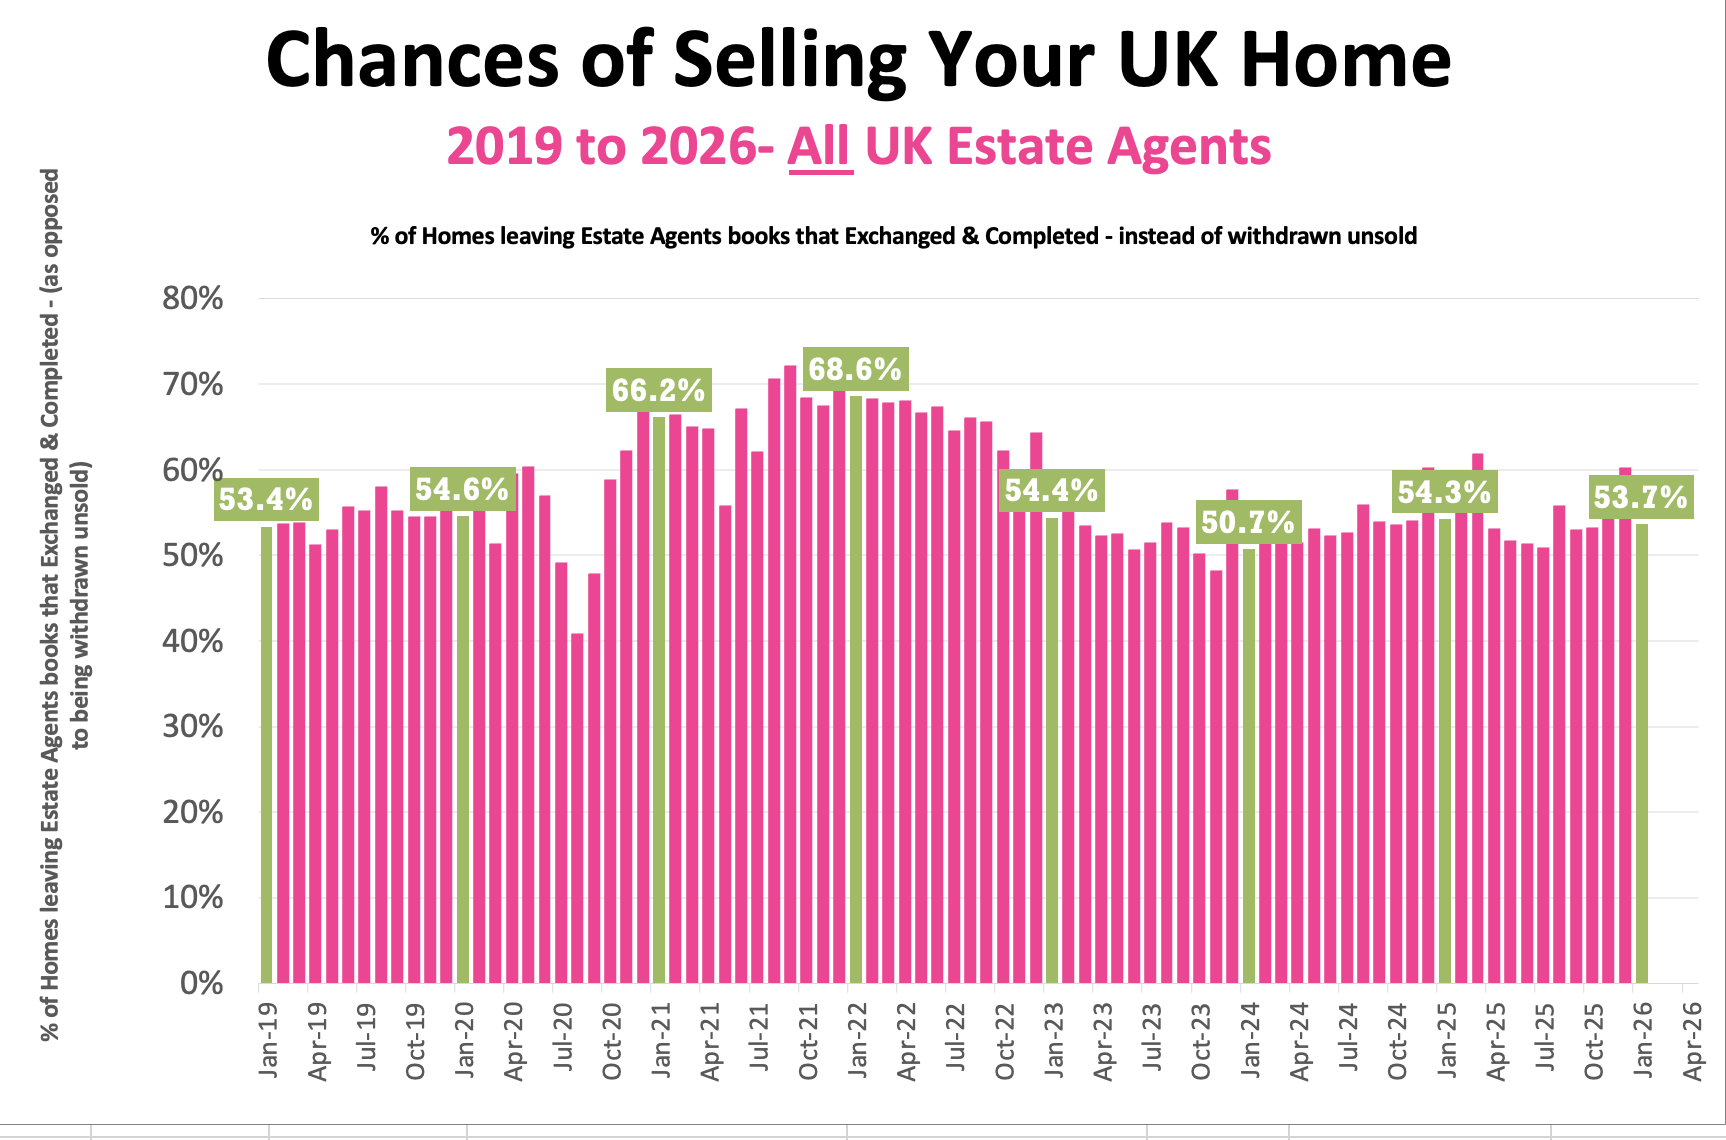
✅ Probability of Selling (% that Exchange vs withdrawal)
Jan ’26 Stats : 53.7% of homes that left agents’ books exchanged & completed in Jan. (Note this figure will change throughout the month as more Jan stats come in).
December 60.2% / November 55.2% / October 53.3% / September: 53.1% / August :55.8% / July: 50.9% / June: 51.3% / May: 51.7% / April: 53.2%.
Jan 25: 54.3% / Jan 24: 50.7% / Jan 23: 54.4% / Jan 22: 68.6%.
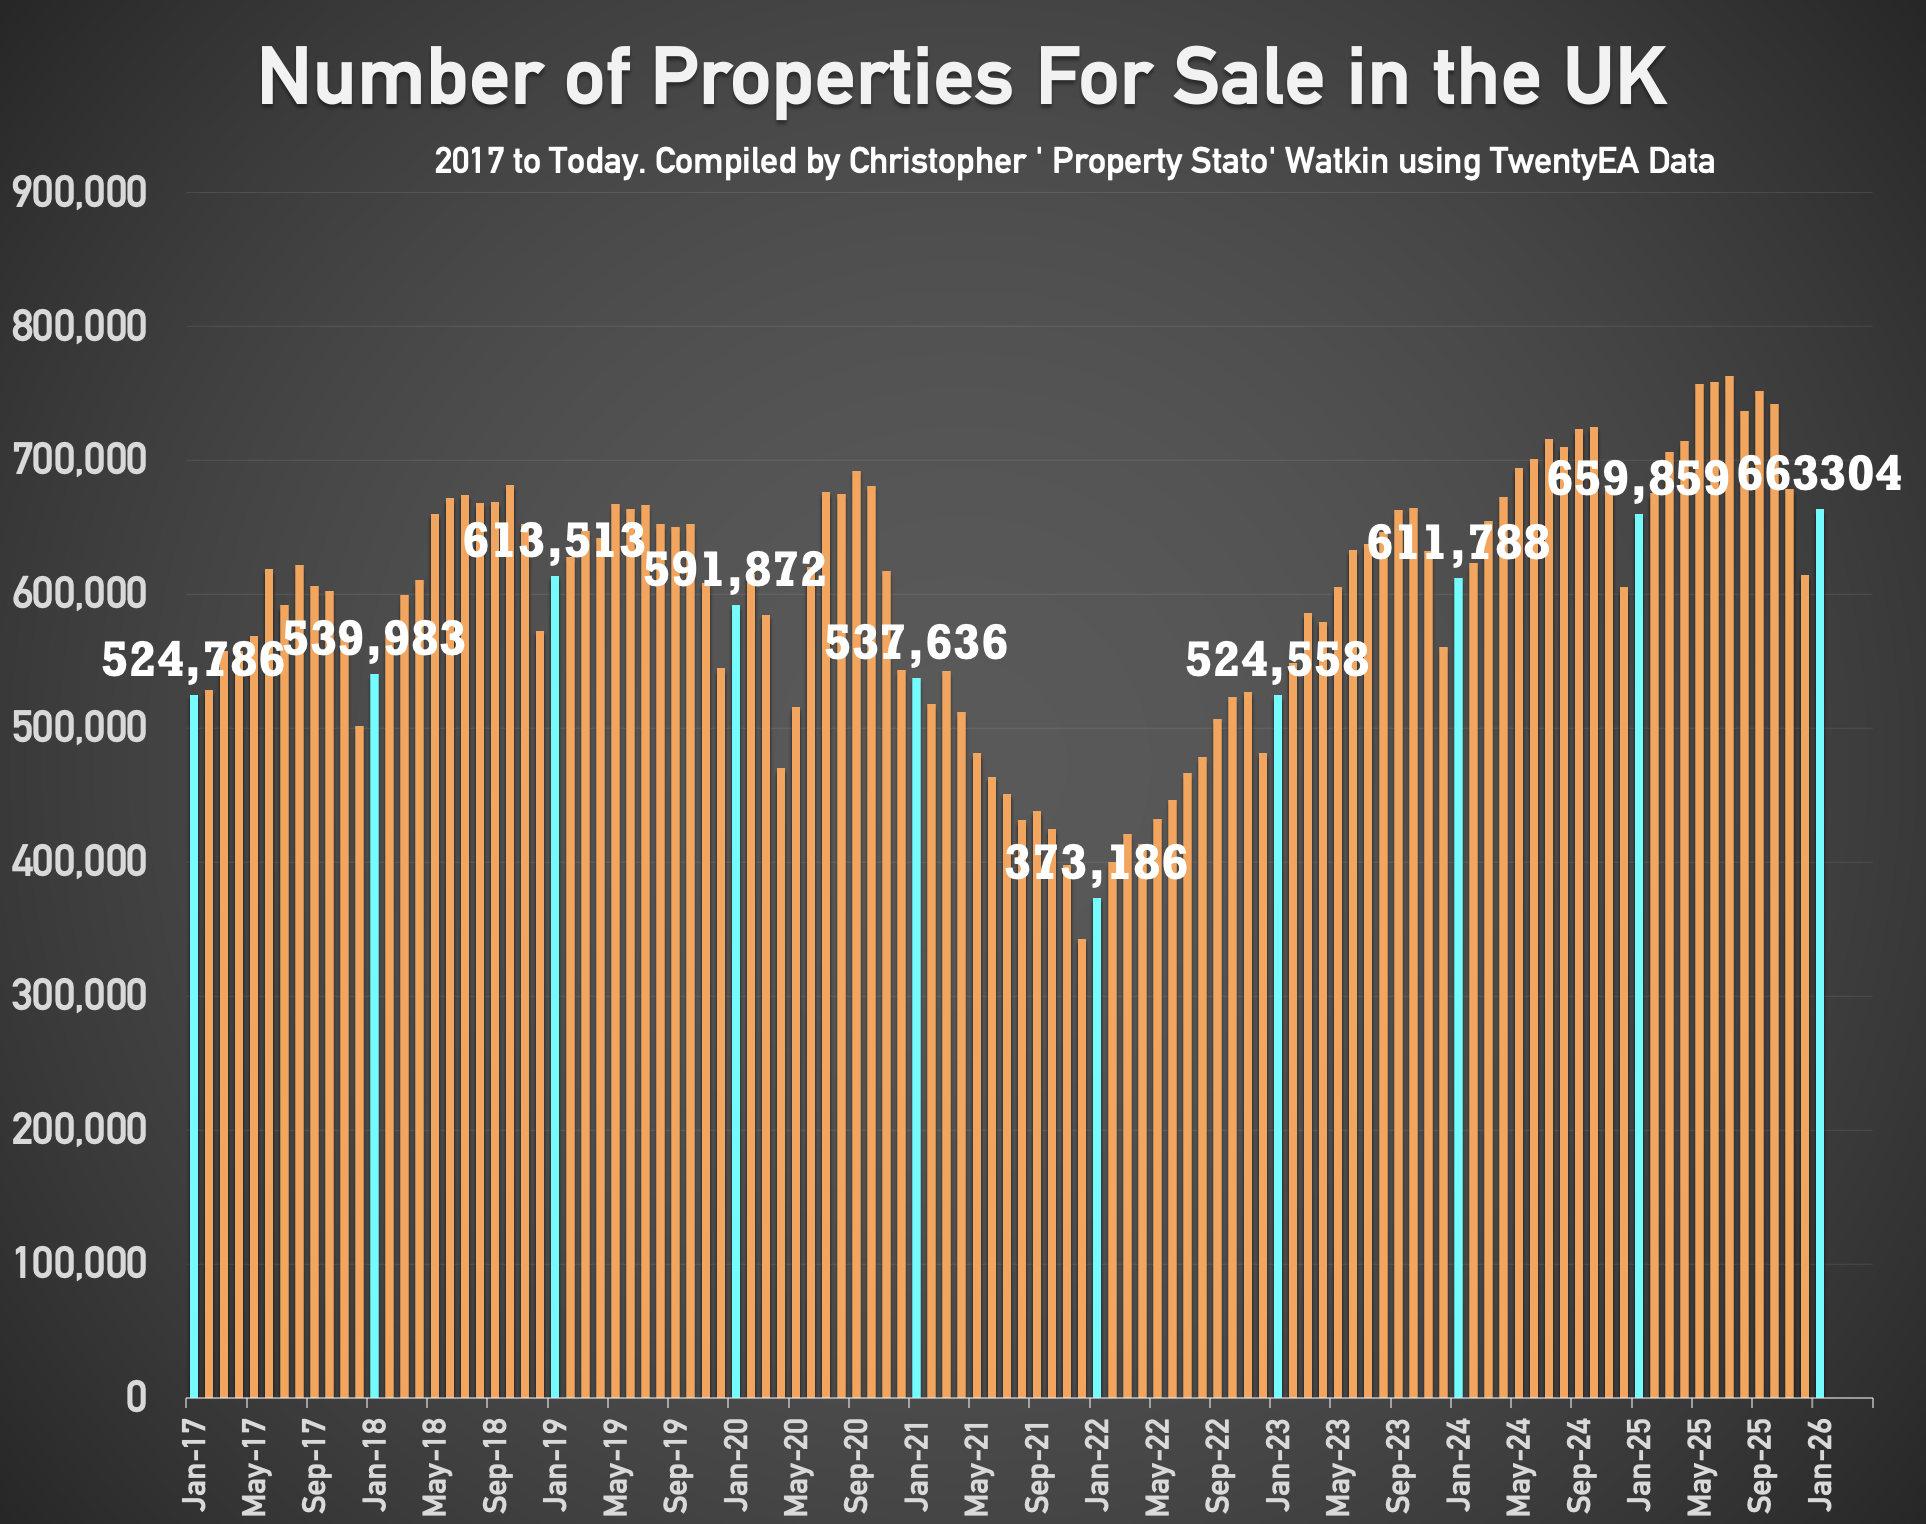
✅ Stock Levels
663k homes on the market on the 1st of February ’26. (660k – Jan 25)
422k homes in agent’s sales pipeline on the 1st Feb 2026, slightly lower than 12 months ago on 1st Feb ’25 (433k).
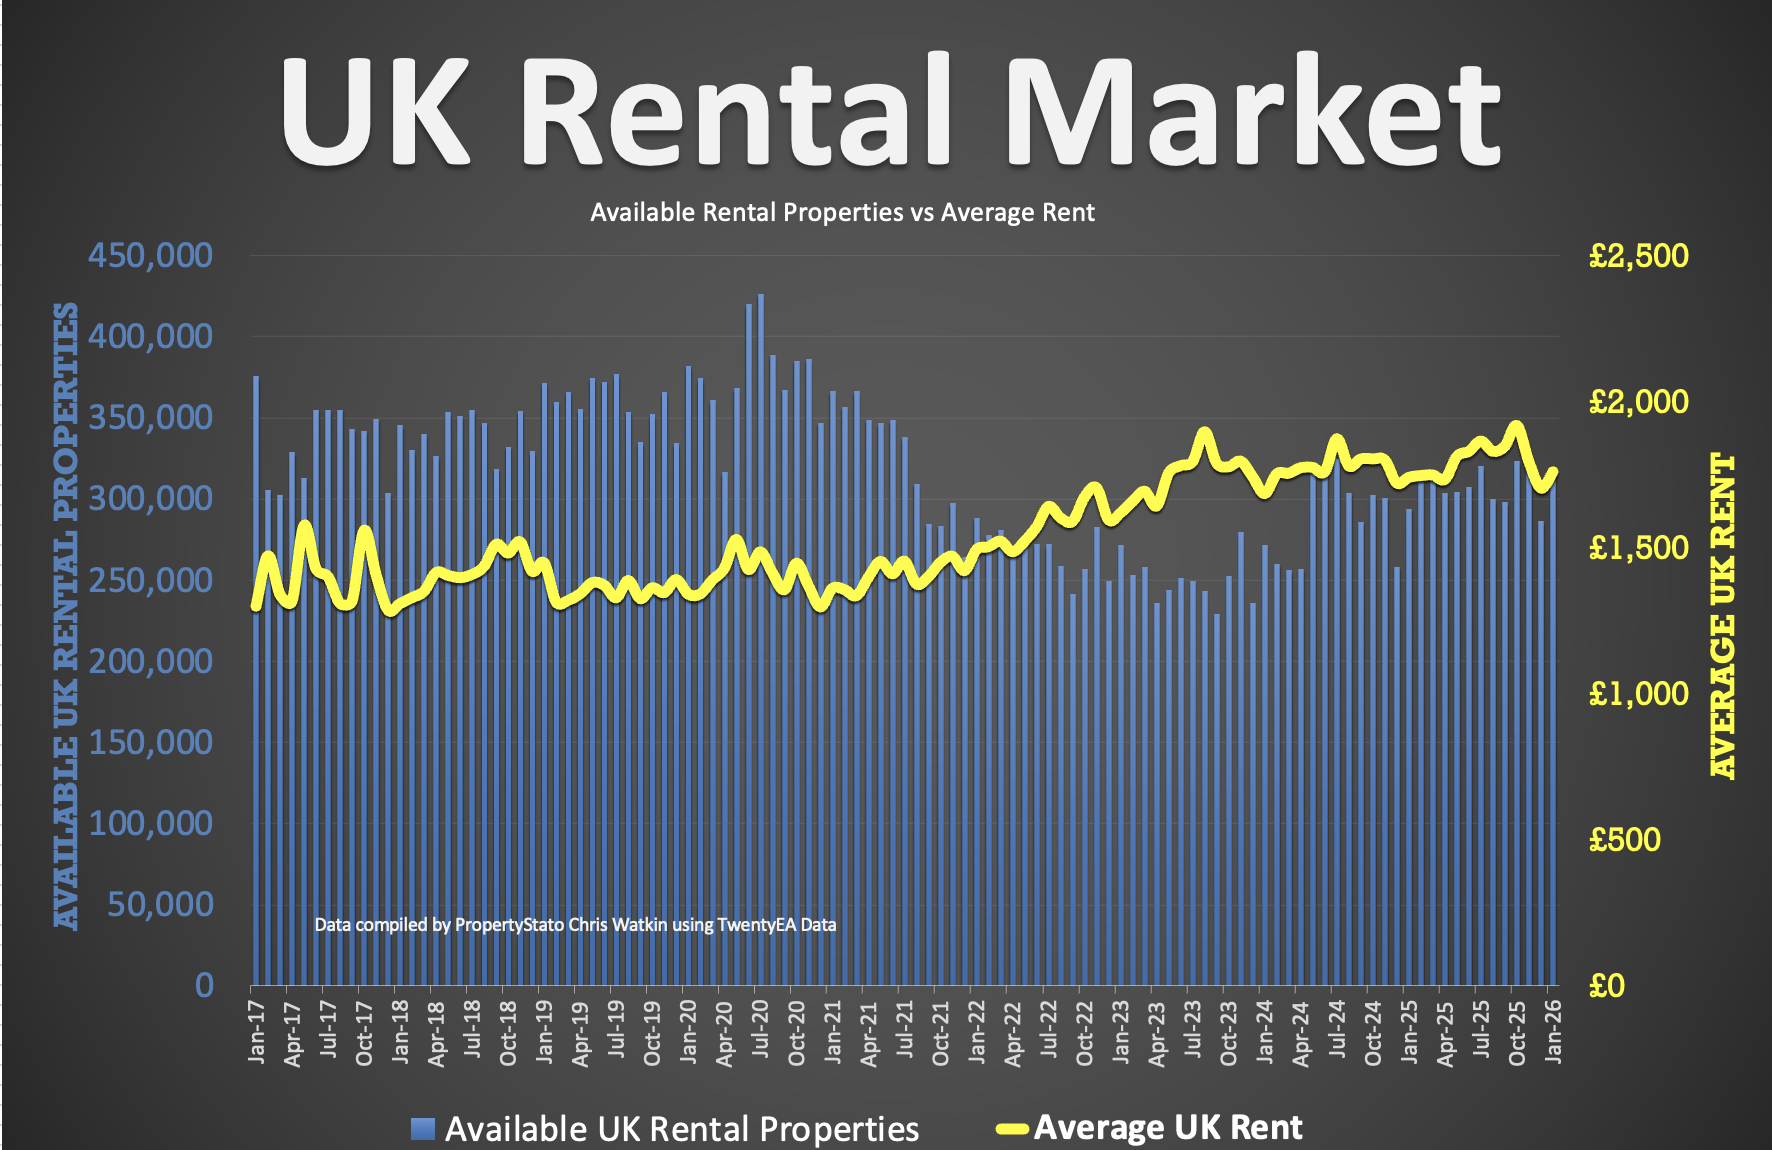
✅ UK Rental Data
Average Rent in Jan 2026 – £1,758 pcm (£1,739 in Jan 25)
318k UK Rental Stock available to rent (293k in Jan 2025.
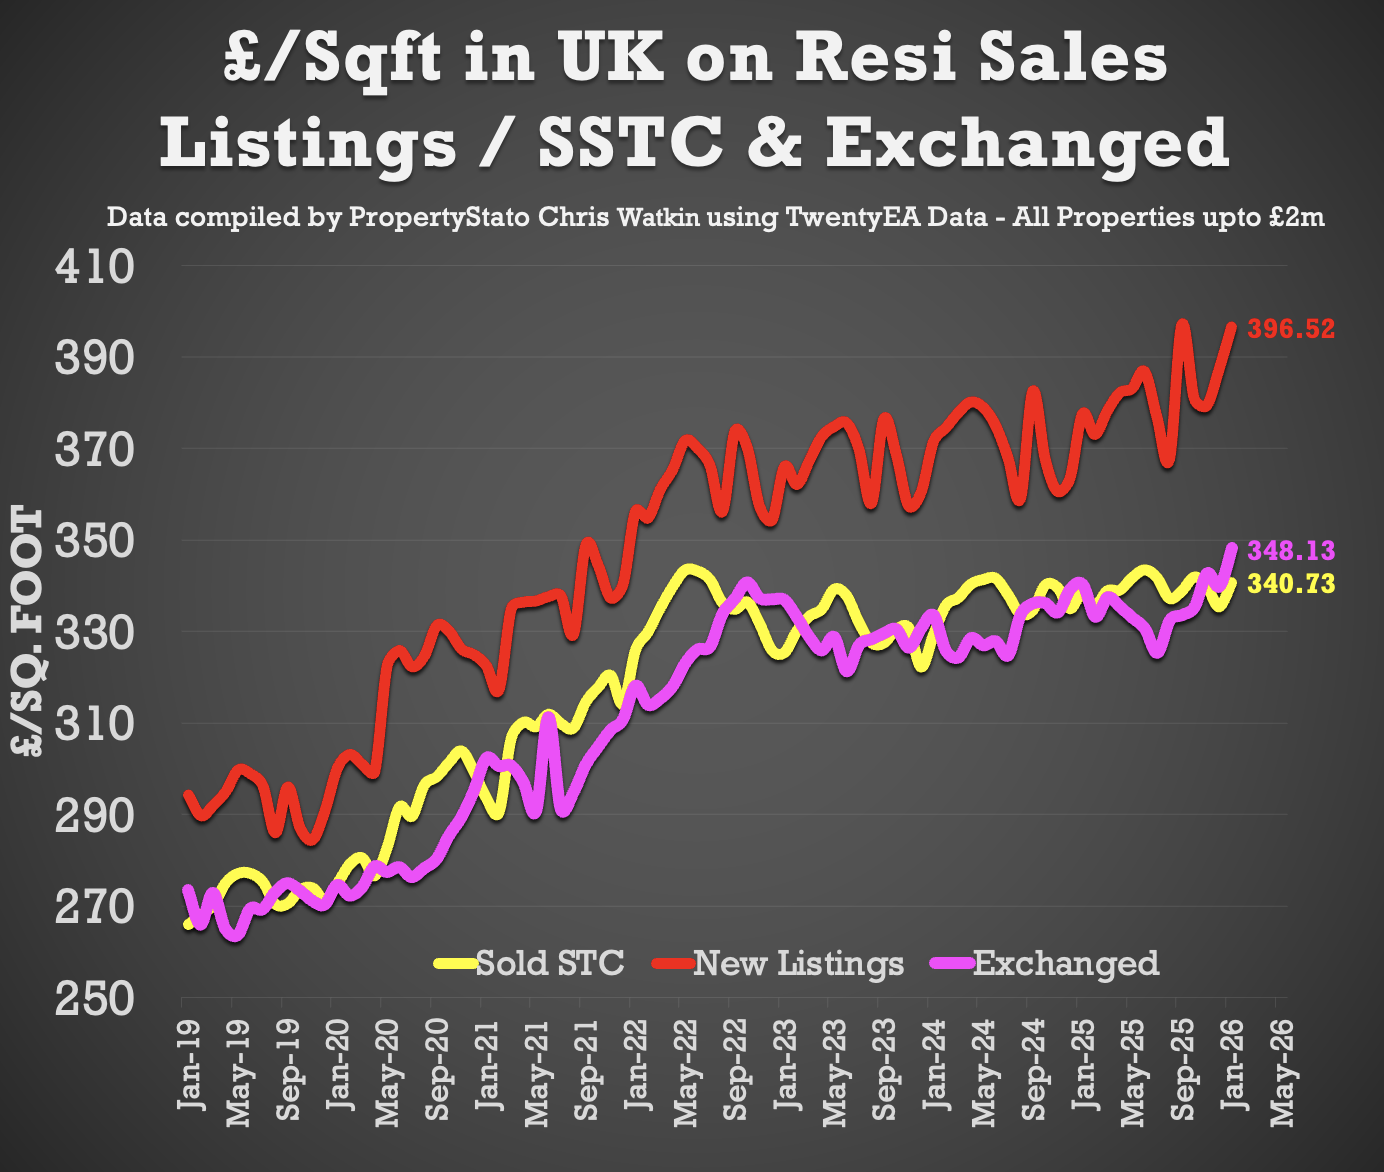
✅ House Prices (£/sq.ft)
January ’26 agreed sales averaged £340.73 per sq.ft. 0.63% higher than 12 months ago (£338.59) and 16% than 5 years ago (£293.54). The £/sqft at sale agreed matches the HM Land Registry Index with a 98% accuracy, 5 months in advance. That is why it is so important.
✅ Local Focus
Tooting (SW17)

Comments are closed.