

 In this week’s ‘UK Property Market Stats’ Show, the first segment covers the property market for the week ending Sunday 15 February 2026 (week 6), with Simon Gates.
In the second segment, Simon and I analyse which estate and letting agent performs best in Maidenhead. The discussion also demonstrates software that agents can use to show their value, counter competitor underpricing, and retain listings, even if you are outside Maidenhead.
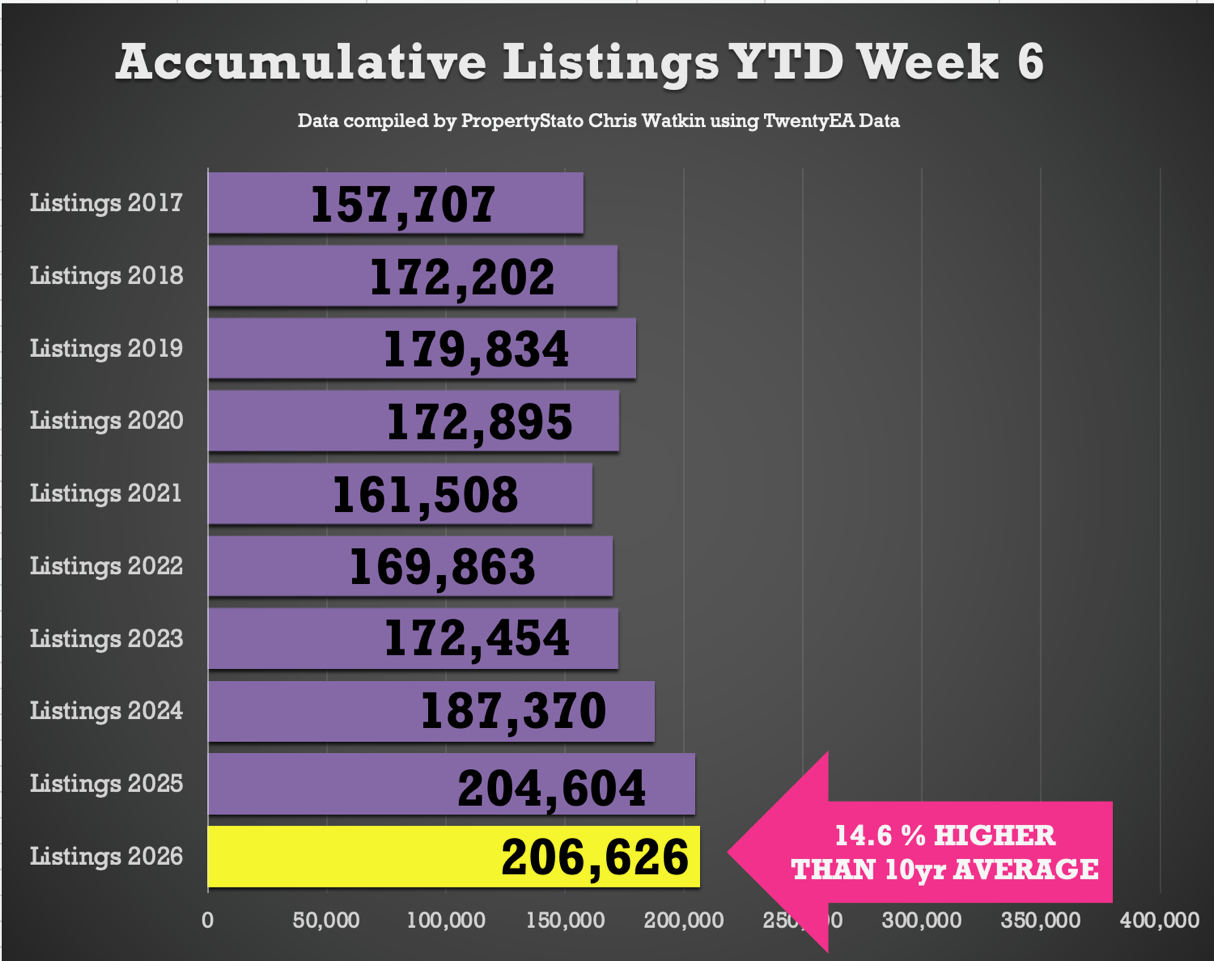
🟩 Listings
207k new properties have come onto the market YTD , 1% ahead of 2025, 10% above 2024, and 22% higher than the 2017–19 average.
🟩 Gross Sales
141k UK homes sold STC YTD , 13% higher than 2024 and 22% above pre Covid norms.
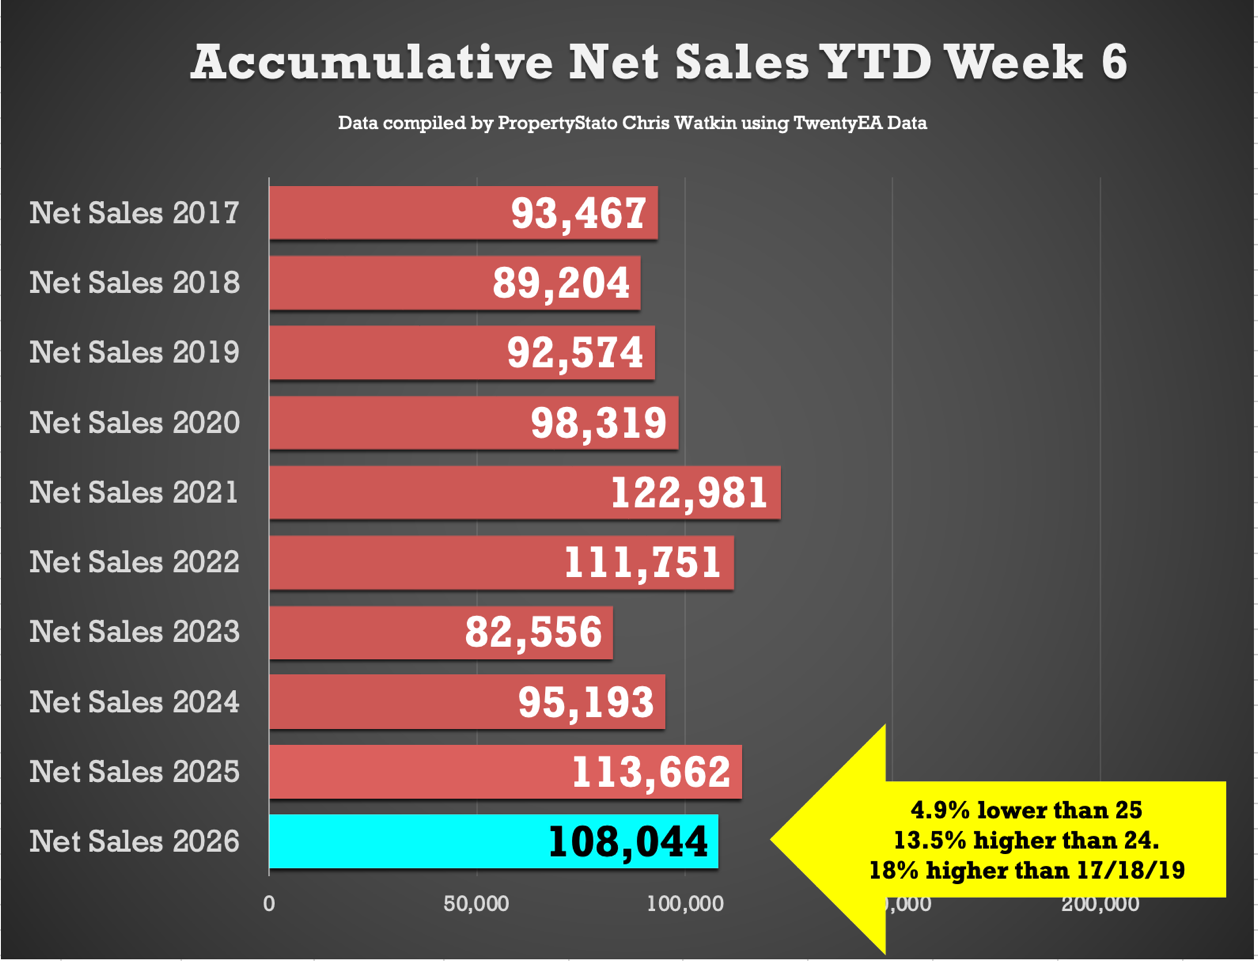
🟩 Net Sales
108k UK net home sales YTD (Gross sales less Fall Thrus) running 14% ahead of 2024, 31% ahead of 2023 and 18% above the 2017–19 average.
🟥 Overvaluing
47% of the homes that left UK Estate Agents books in January were withdrawn unsold. Main cause – blatant overvaluing supported by long sole agency agreements of 20+ weeks. Until this is sorted, this is a blight on on industry.
For those that like their stats, here is a more detailed breakdown:
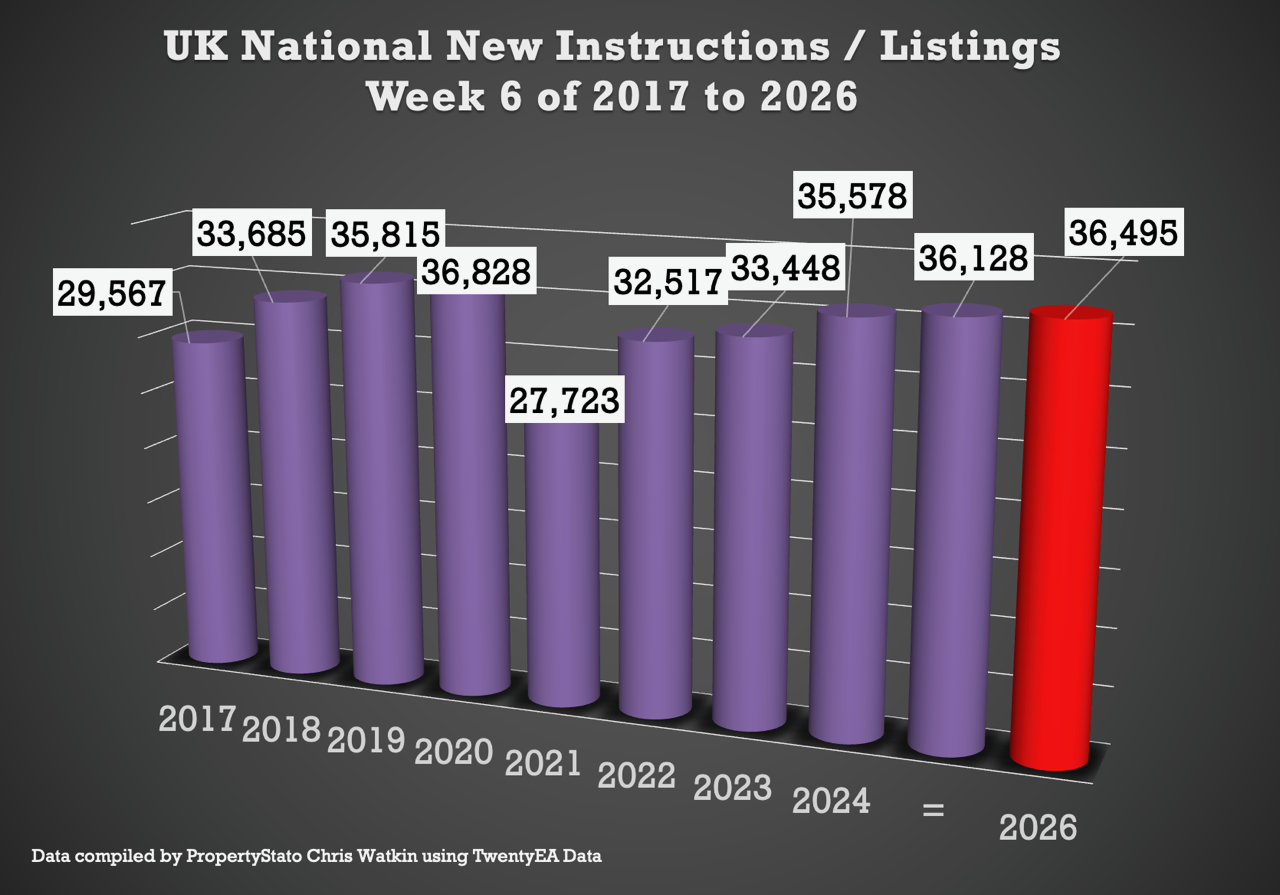
✅ New Listings
+ 36.5k new properties came onto market this week in week 6, slightly down from 36.9k last week.
+ 2025 weekly average: 30.6k.
+ 10-year week 6 average : 33.8k.
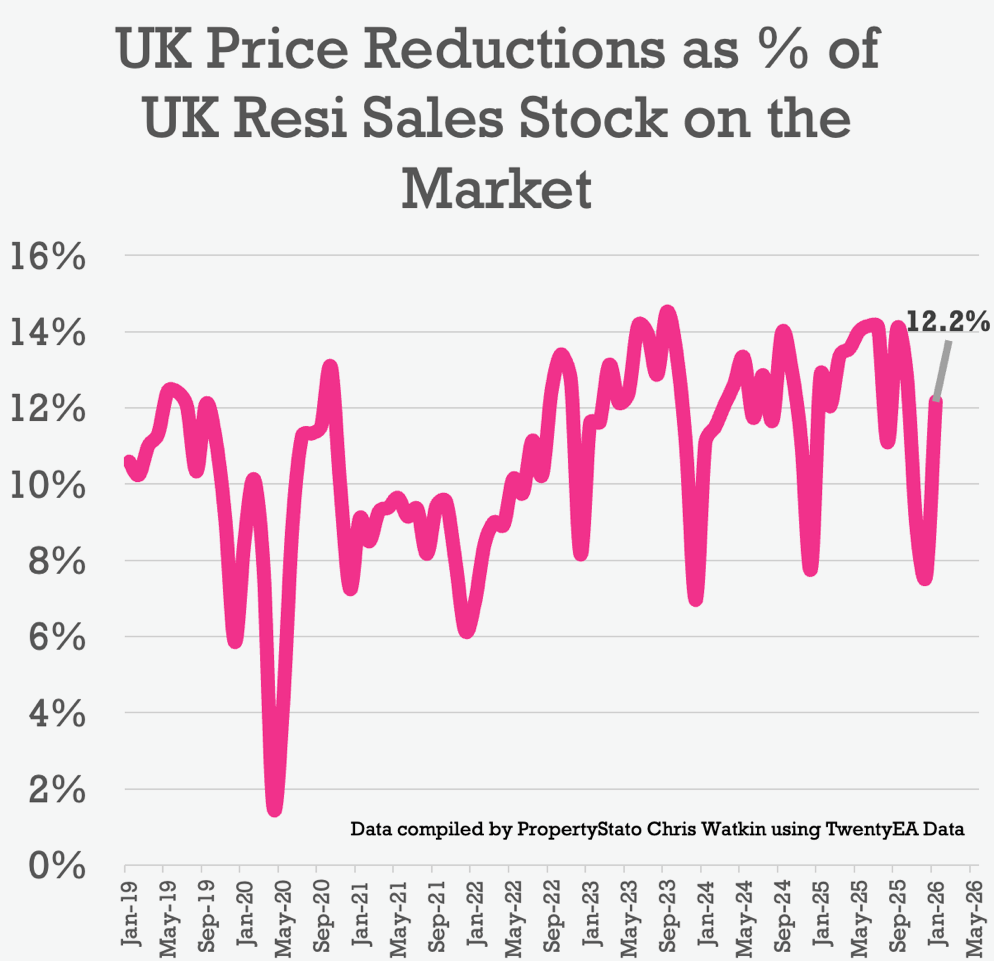
✅ Price Reductions
+ 20.5k reductions this week.
+ 12.2% of resi homes for sale were reduced in January. Jan 25 – 12.8%. Jan 24 – 11.1%.
+ 2025 average was 12.8%, versus the 5-year long-term average of 10.74%.
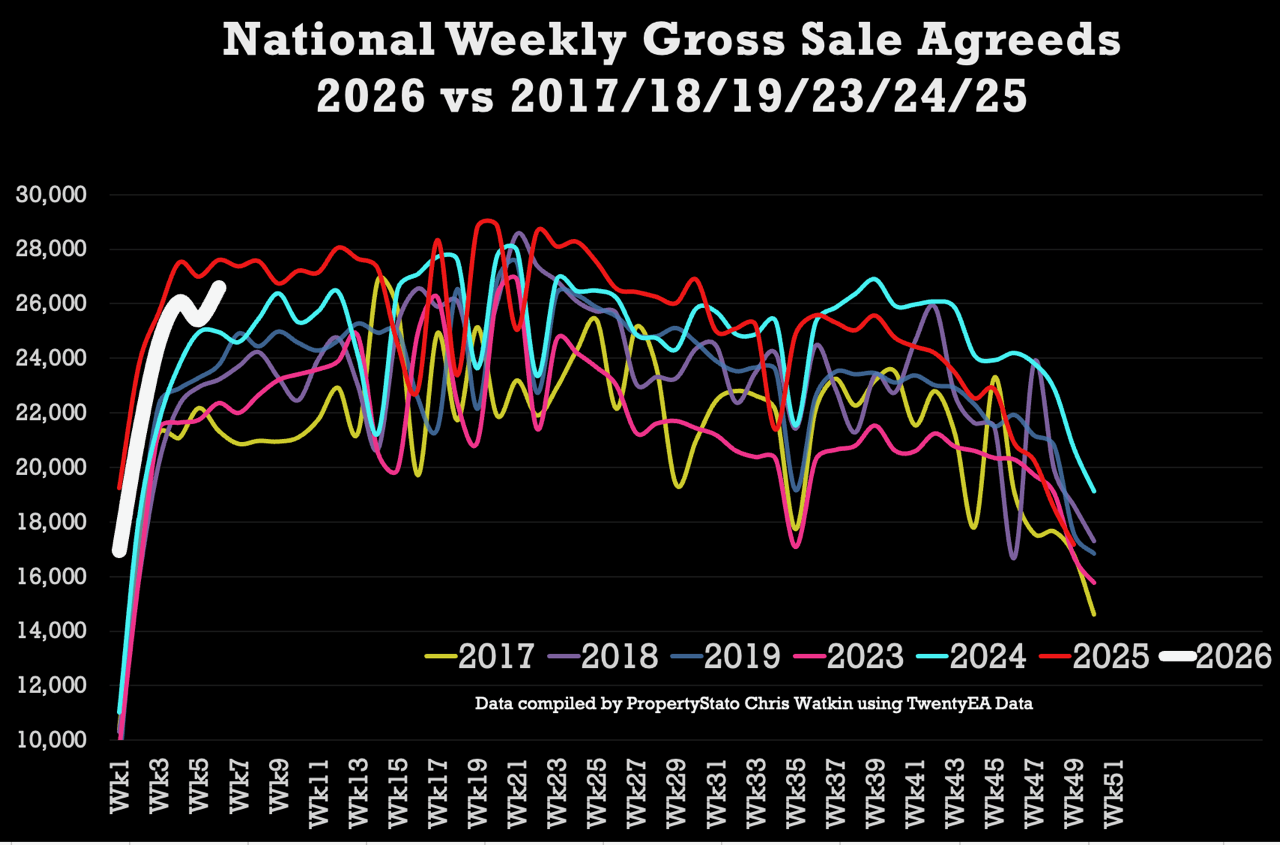
✅ Sales Agreed
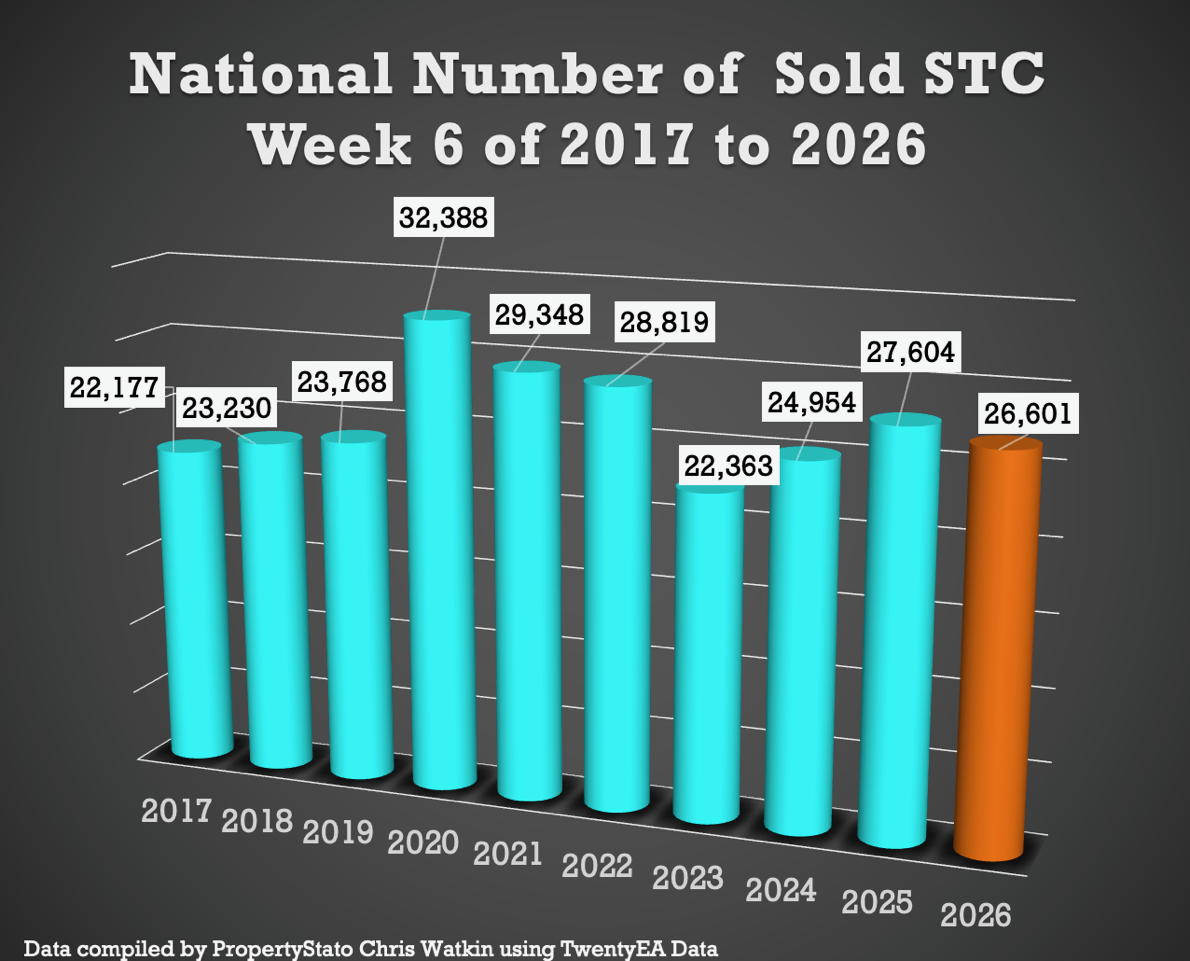
+ 26.6k homes sold stc this week 6, up from 25.4k last week.
+ Week 6 average (for last 10 years) : 26.1k.
+ 2026 weekly average: 22.2k.
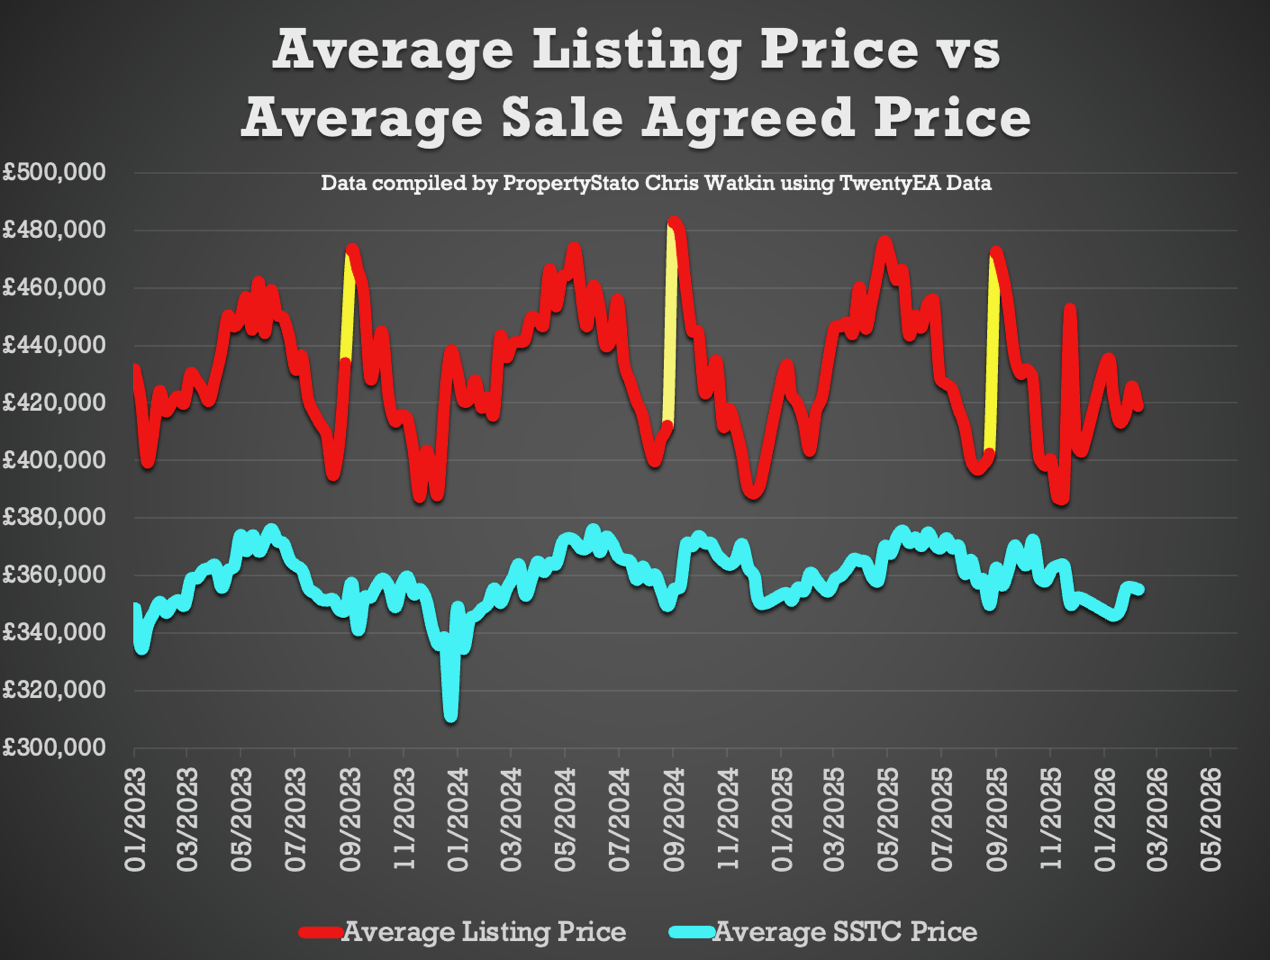
✅ Price Difference between Listings & Sales
18% difference (long term 10 year average is 16% to 17%). (£425k ave Listing Ave Asking price vs £366k Sale Agreed ave Asking price).
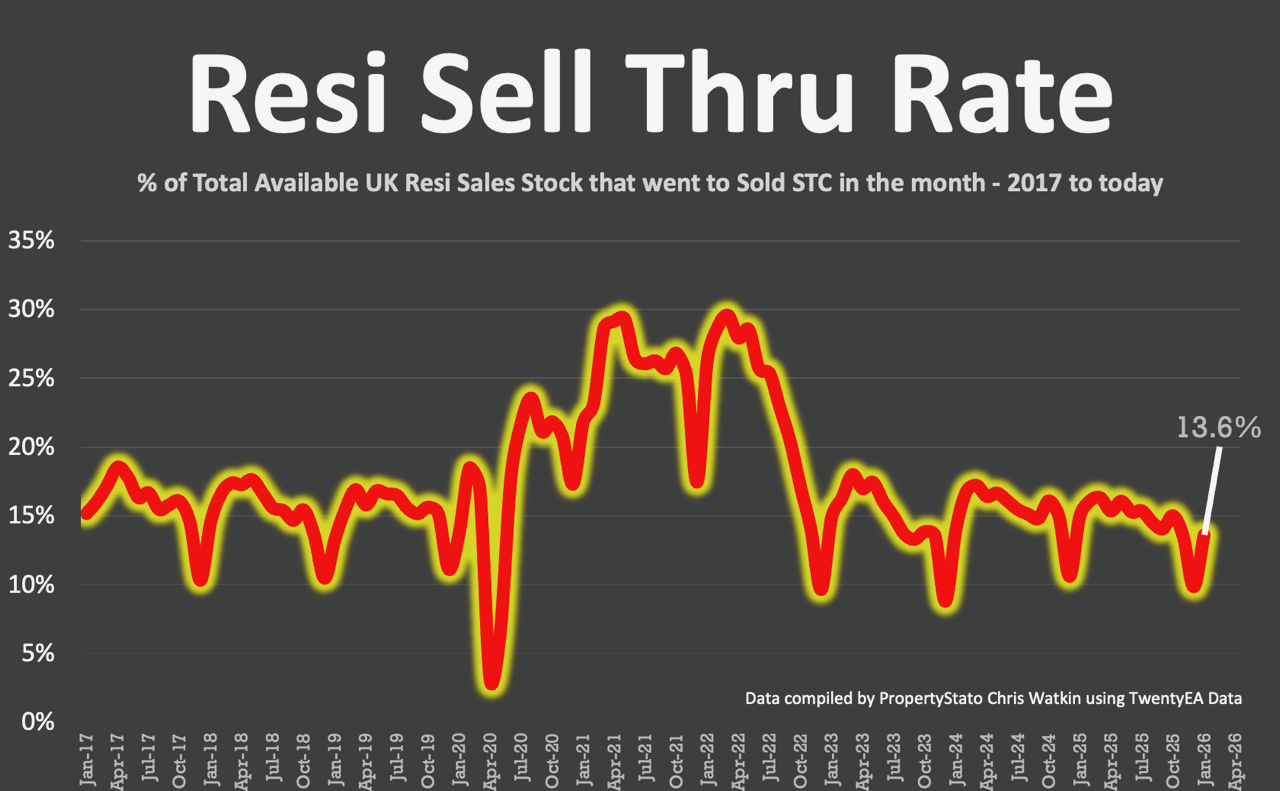
✅ Sell-Through Rate
+ 13.6% of homes on agents’ books went SSTC in January ’26. (Jan ’25 – 15% / Jan ’24 – 13.9%).
+ Pre-Covid average: 15.5%.
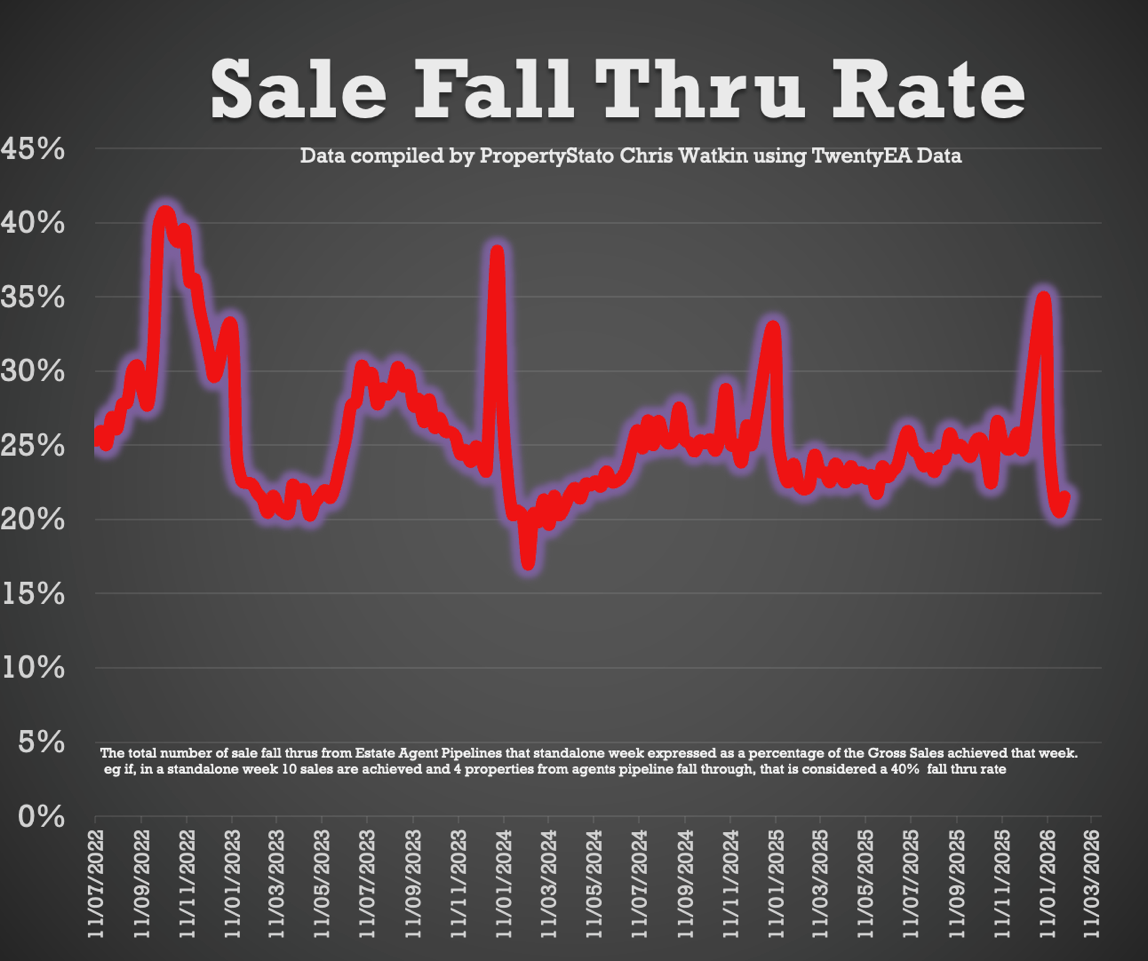
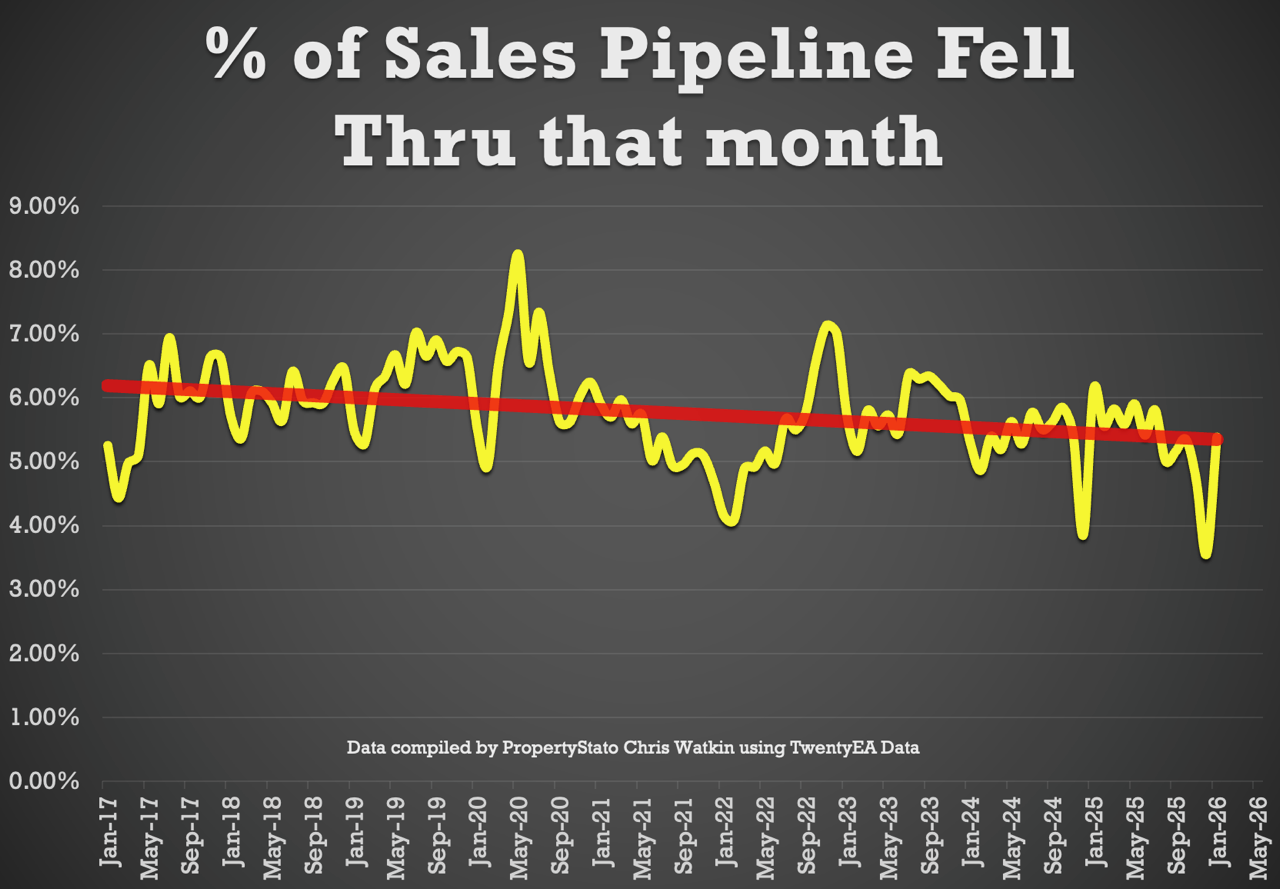
✅ Fall-Throughs
+ 5,371 fall-throughs last week (pipeline of 422k home Sold STC).
+ Weekly average for 2025: 6,100.
+ Fall-through rate: 20.2%, down from 21.5% last week.
+ Long-term average: 24.2% (post-Truss chaos saw levels exceed 40%).
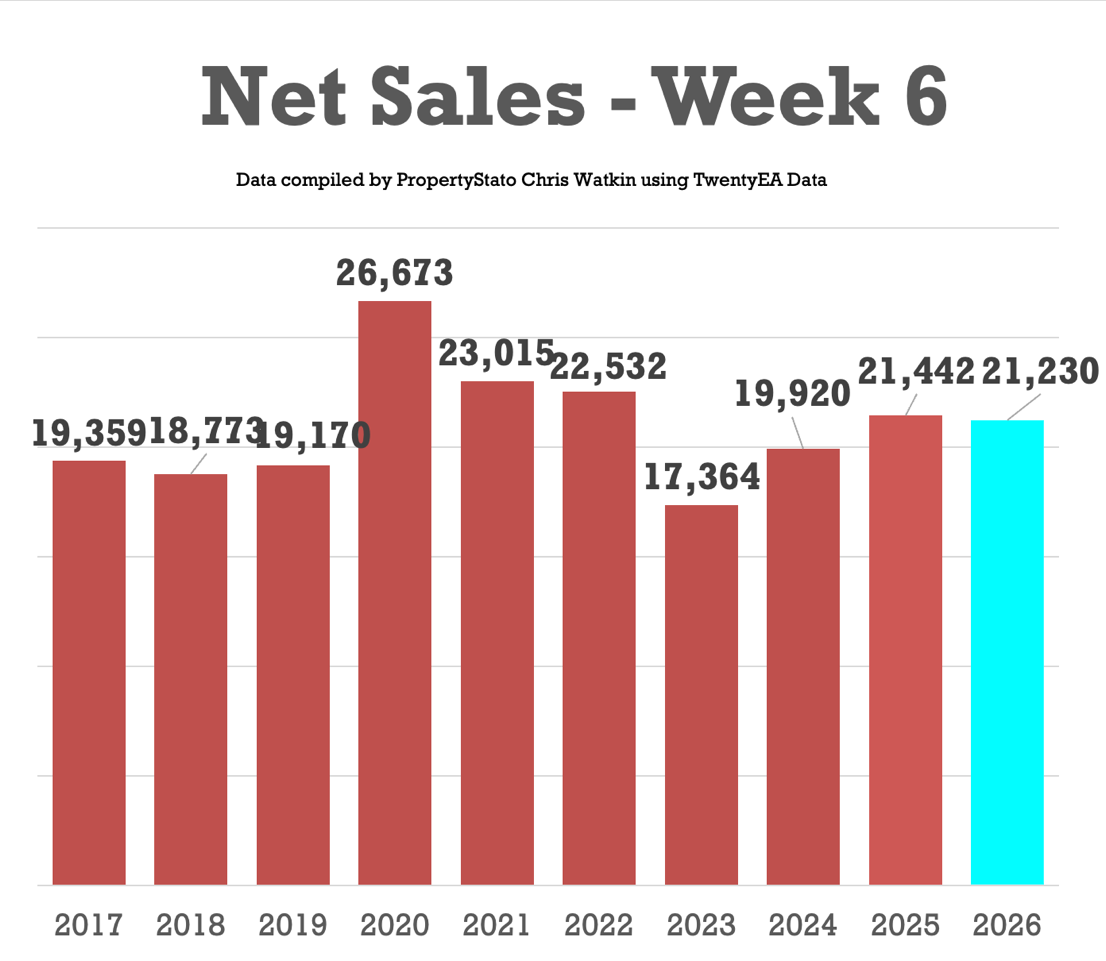
✅ Net Sales
+ 21.2k Net Sales, up from 20k last week
+ Ten-year Week 6 average: 21k.
+ Weekly average for 2026: 18k.
+ Weekly average for the whole of 2025: 19.2k.
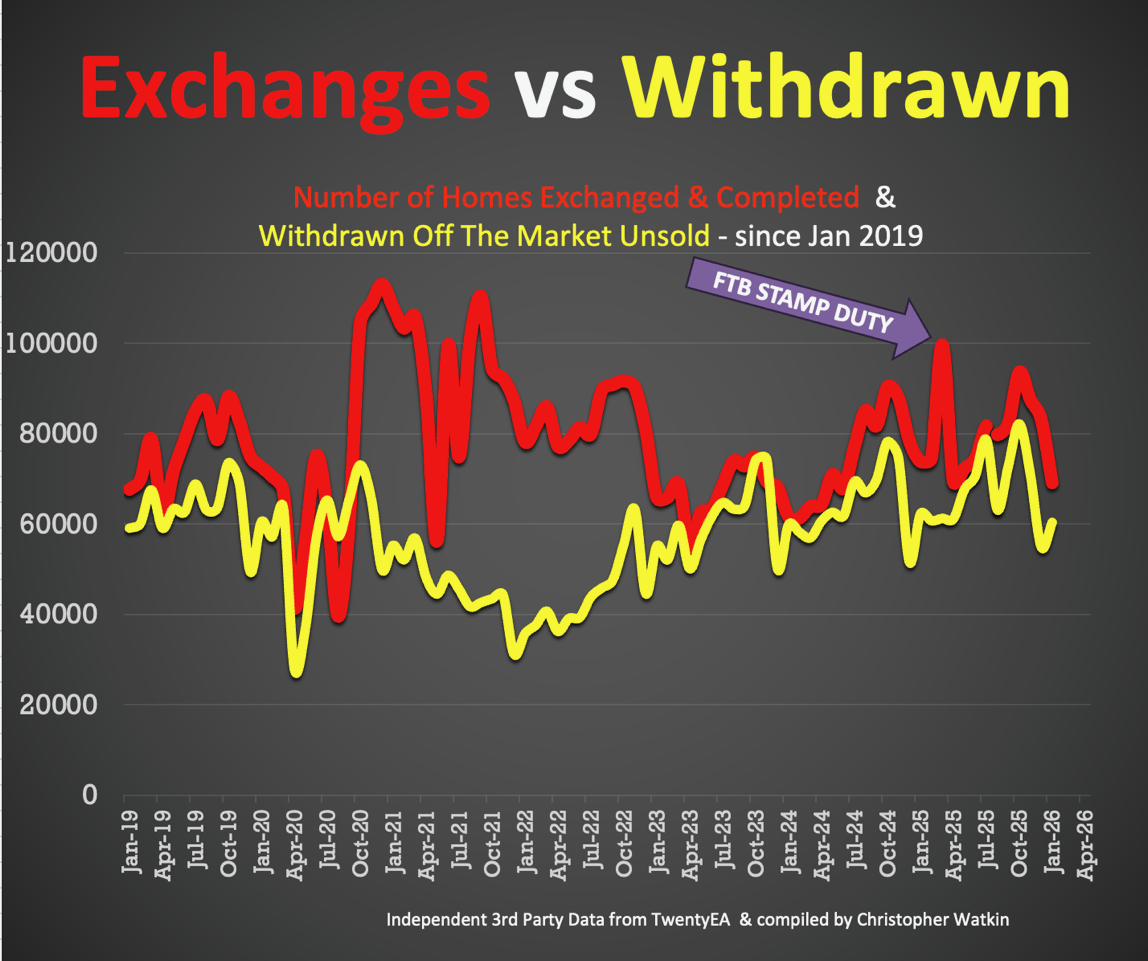
✅ Probability of Selling (% that Exchange vs withdrawal)
+ Jan ’26 Stats : 53.4% of homes that left agents’ books exchanged & completed in Jan. (Note this figure will change throughout the month as more Jan stats come in).
+ December 60.2% / November 55.2% / October 53.3% / September: 53.1% / August :55.8% / July: 50.9% / June: 51.3% / May: 51.7% / April: 53.2%.
+ Jan 25: 54.3% / Jan 24: 50.7% / Jan 23: 54.4% / Jan 22: 68.6%.

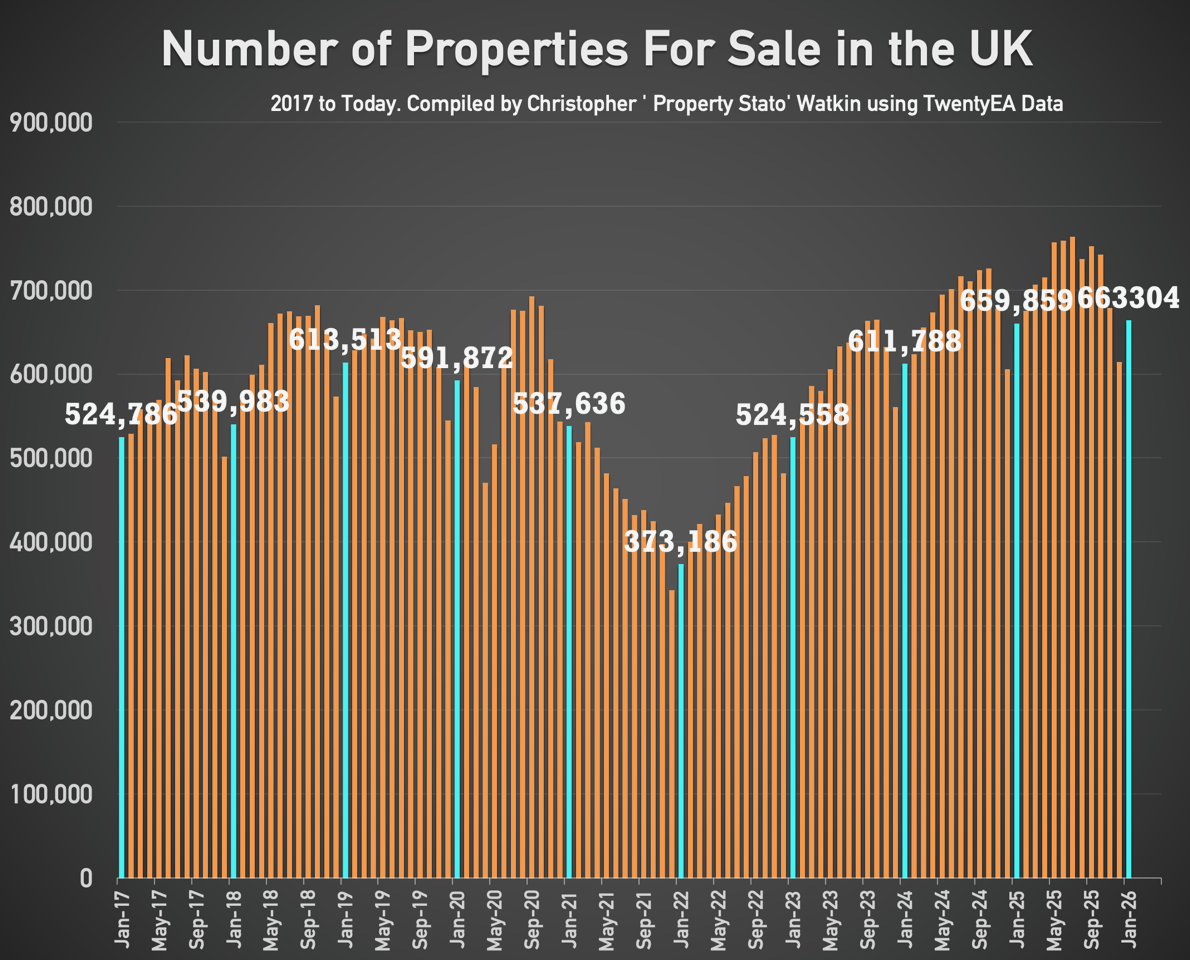
✅ Stock Levels
+ 663k homes on the market on the 1st of February ’26. (660k – Jan 25)
+ 422k homes in agent’s sales pipeline on the 1st Feb 2026, slightly lower than 12 months ago on 1st Feb ’25 (433k).

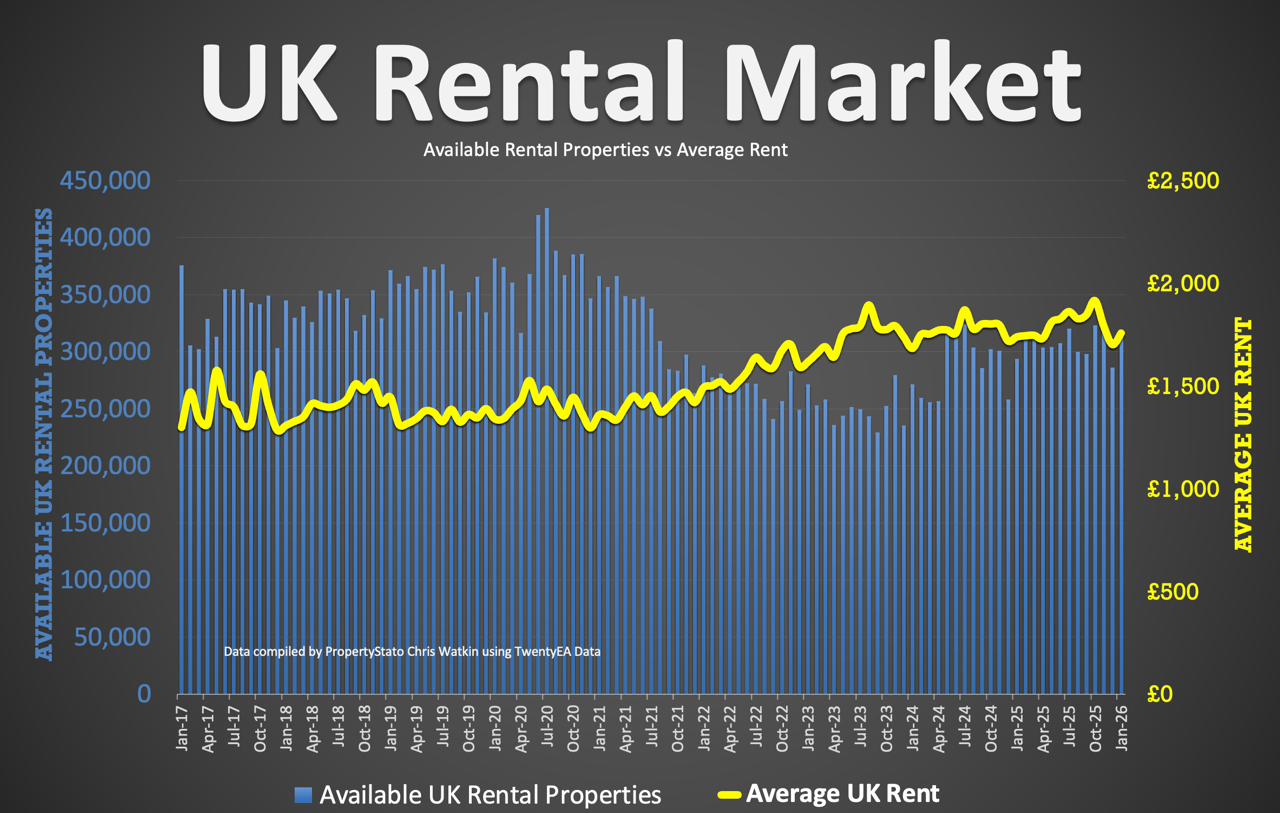
✅ UK Rental Data
+ Average Rent in Jan 2026 – £1,758 pcm (£1,739 in Jan 25)
+ 318k UK Rental Stock available to rent (293k in Jan 2025.
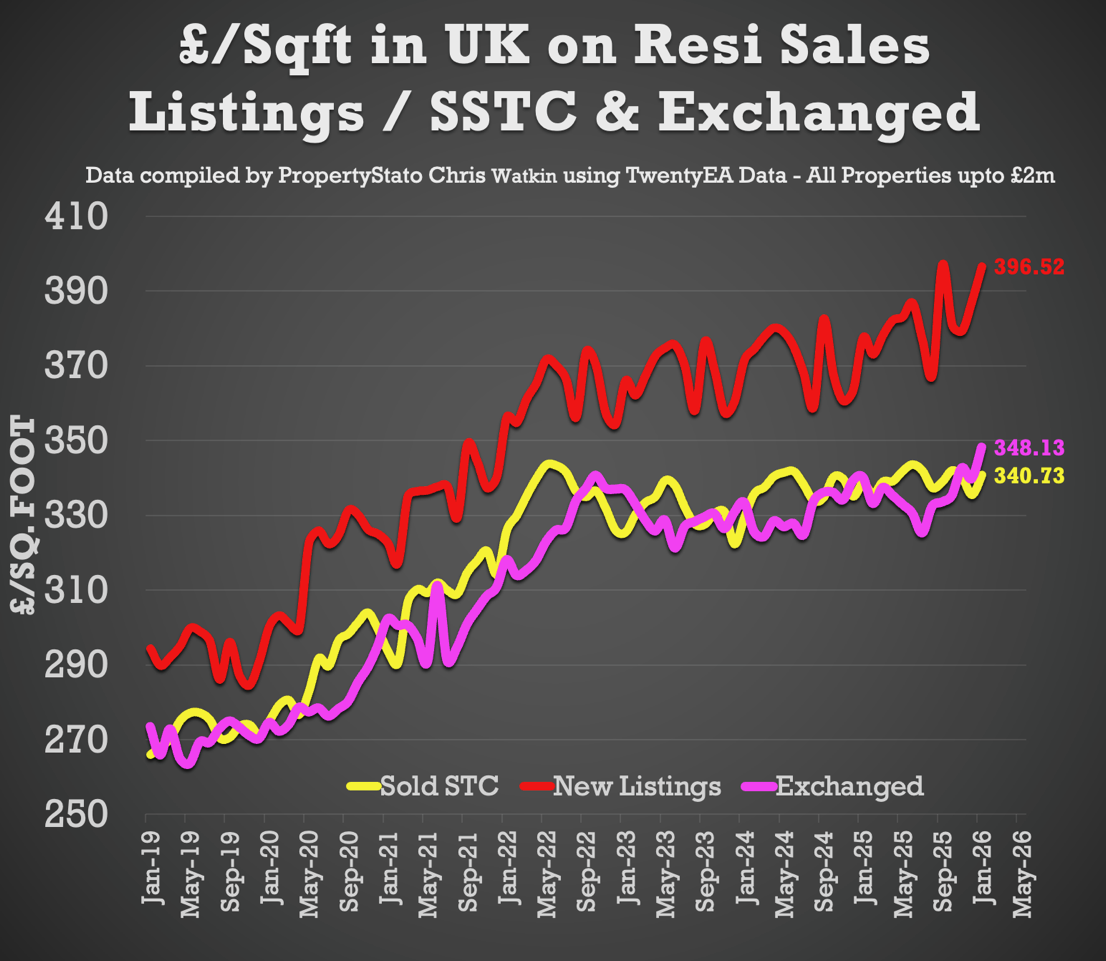
✅ House Prices (£/sq.ft)
+ January ’26 agreed sales averaged £340.73 per sq.ft. 0.63% higher than 12 months ago (£338.59) and 16% than 5 years ago (£293.54). The £/sqft at sale agreed matches the HM Land Registry Index with a 98% accuracy, 5 months in advance. That is why it is so important.
✅ Local Focus
Maidenhead

Comments are closed.