

 Here are the headlines for the fifth week of the 2026 UK property market (week ending Sunday 8 February 2026).
I, together with Alice Bullard from Nested, analyse the market in the weekly UK Property Market Stats Show.
🟩 Listings – Strong
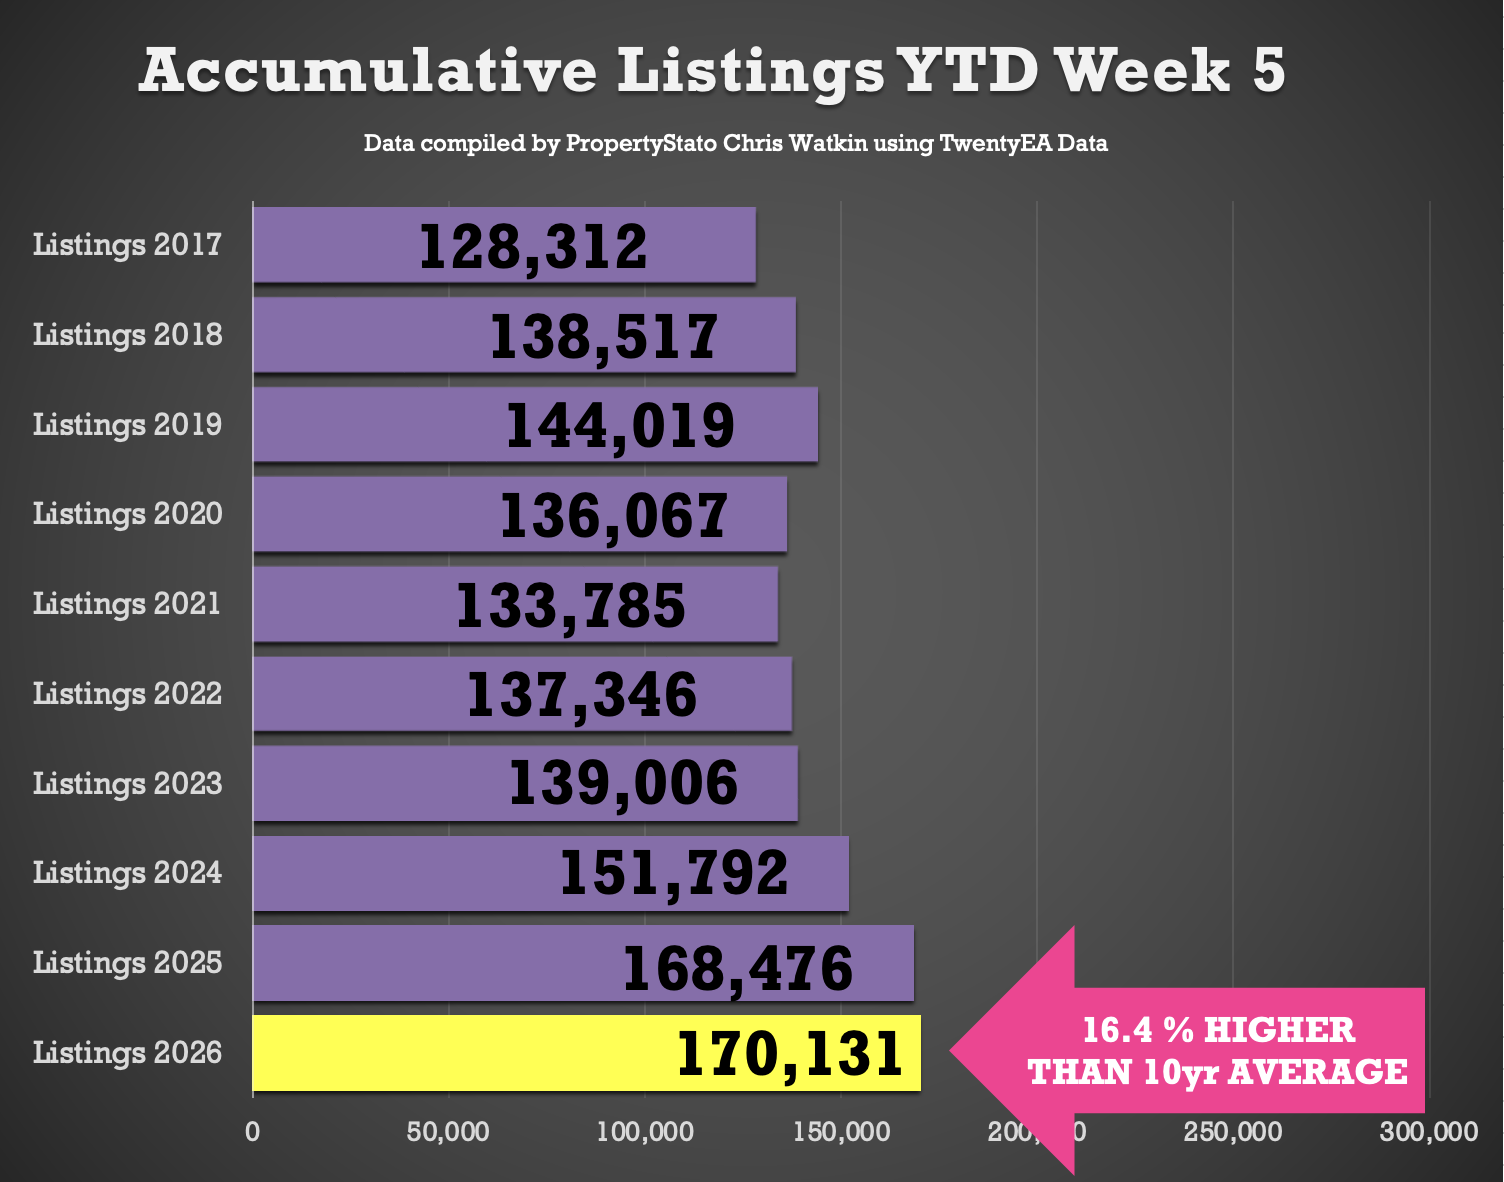
170k new properties have come onto the market YTD , 1% ahead of 2025, 12% above 2024, and 24% higher than the 2017–19 average.
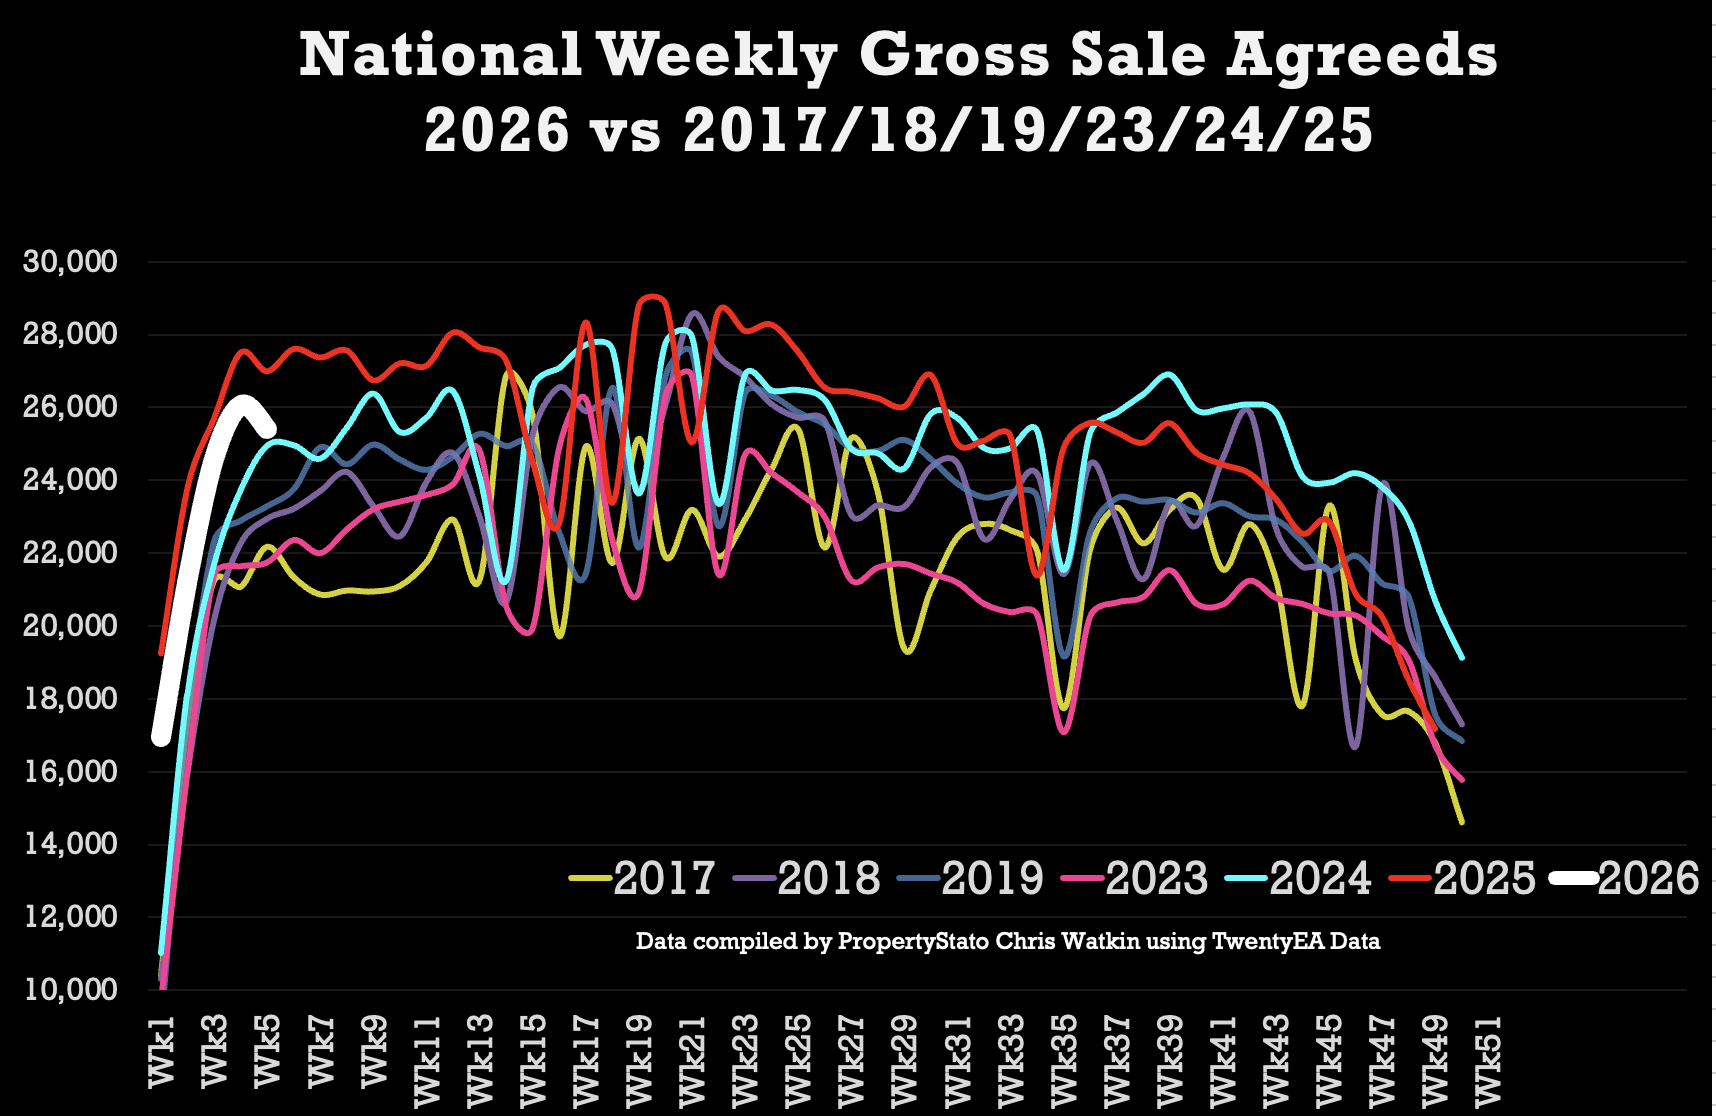
🟩 GrossSales – Strong
114k UK homes sold STC YTD , 15% higher than 2024 and 23% above pre Covid norms.
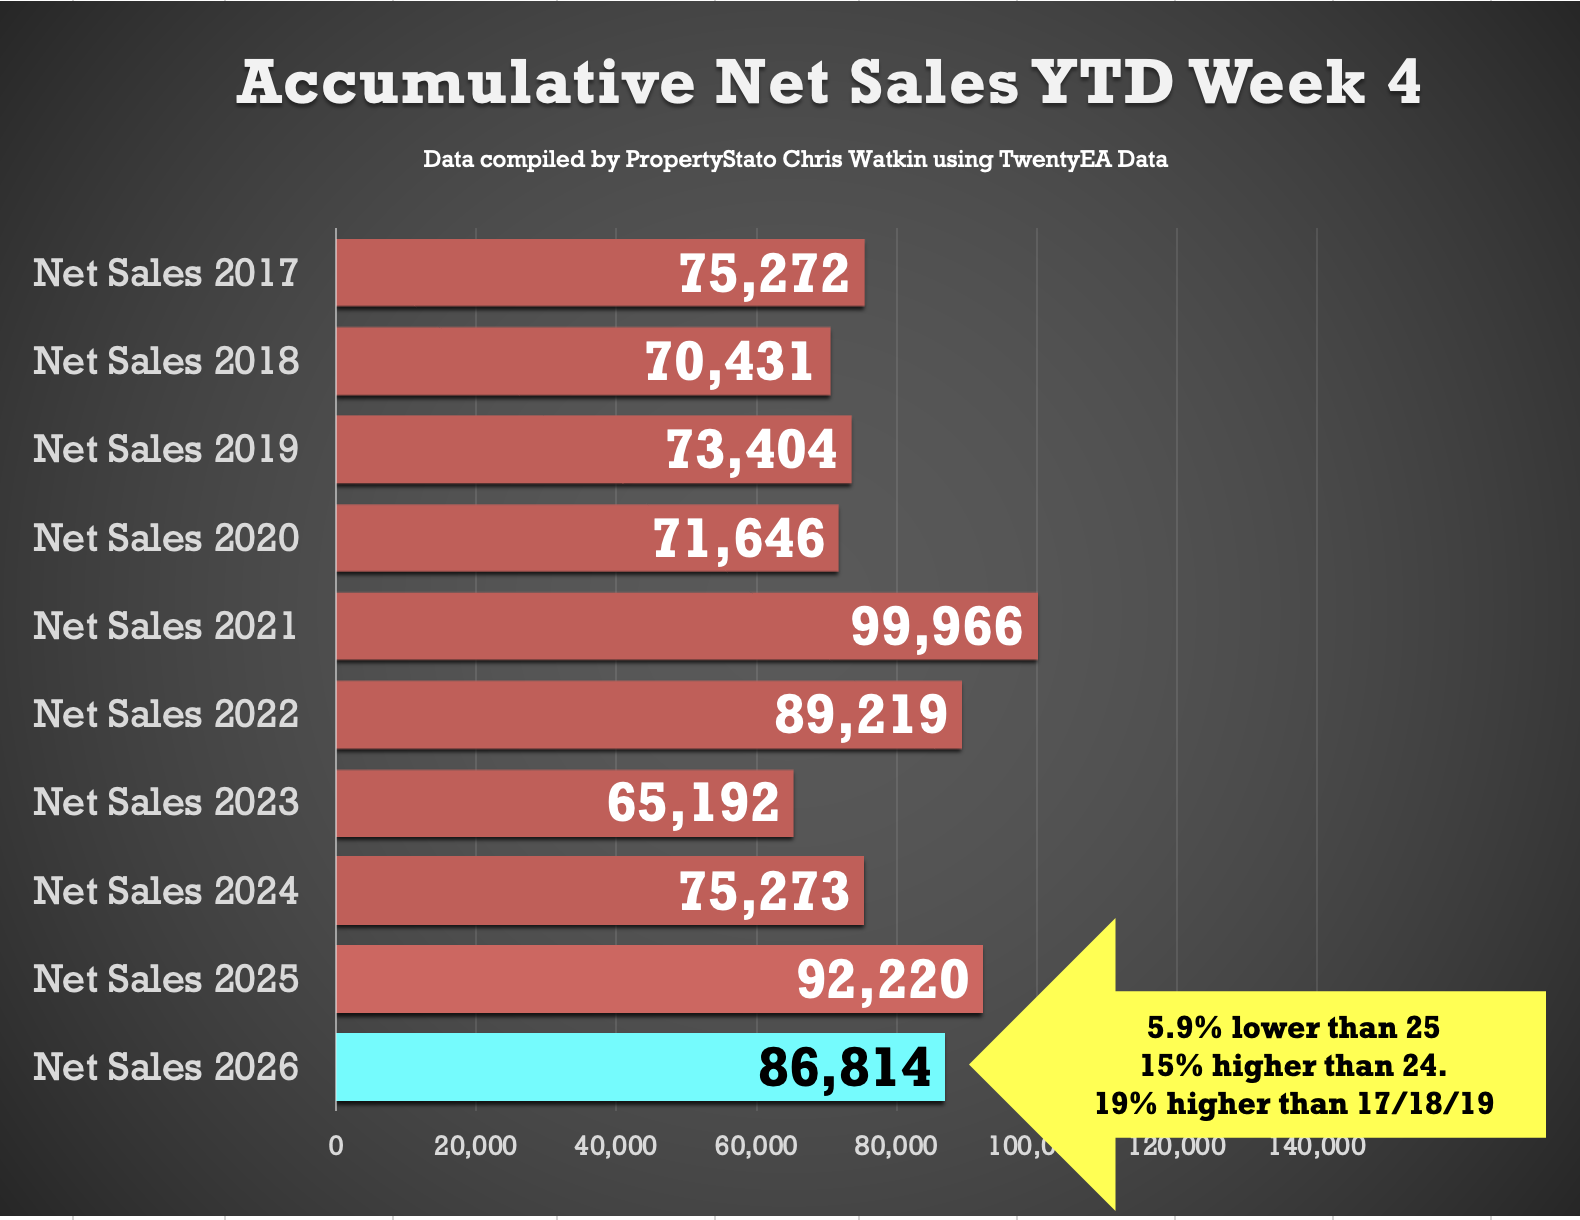
🟩Net Sales – Strong
87k UK net home sales YTD (Gross sales less Fall Thrus) running 15% ahead of 2024, 33% ahead of 2023 and 19% above the 2017–19 average.
🟩Overvaluing – Awful
Some 47% of the homes that left UK Estate Agents books in January were withdrawn unsold. Main cause – blatant overvaluing supported by long sole agency agreements of 20+ weeks.
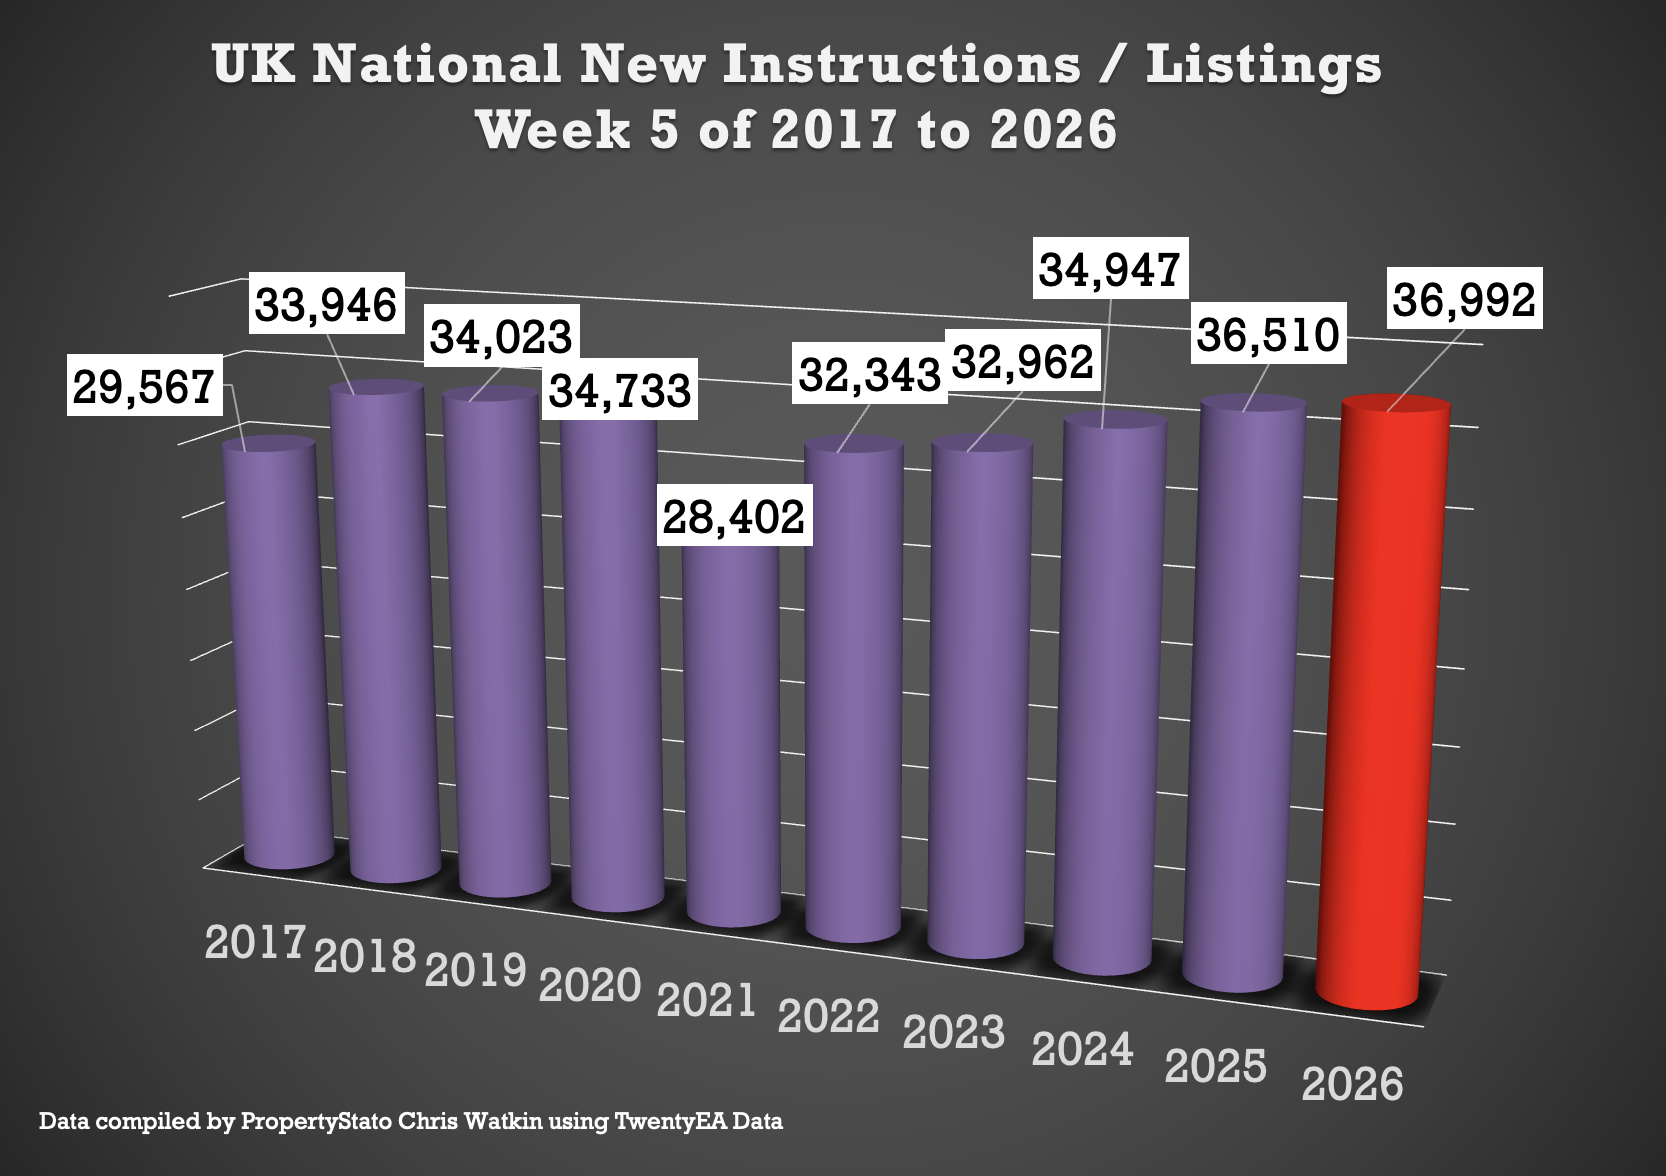
✅ New Listings
+ 36.9k new properties came onto market this week in week 5, up from 36.6k last week.
+ 2025 weekly average: 30.6k.
+ 10-year week 5 average : 33.4k.
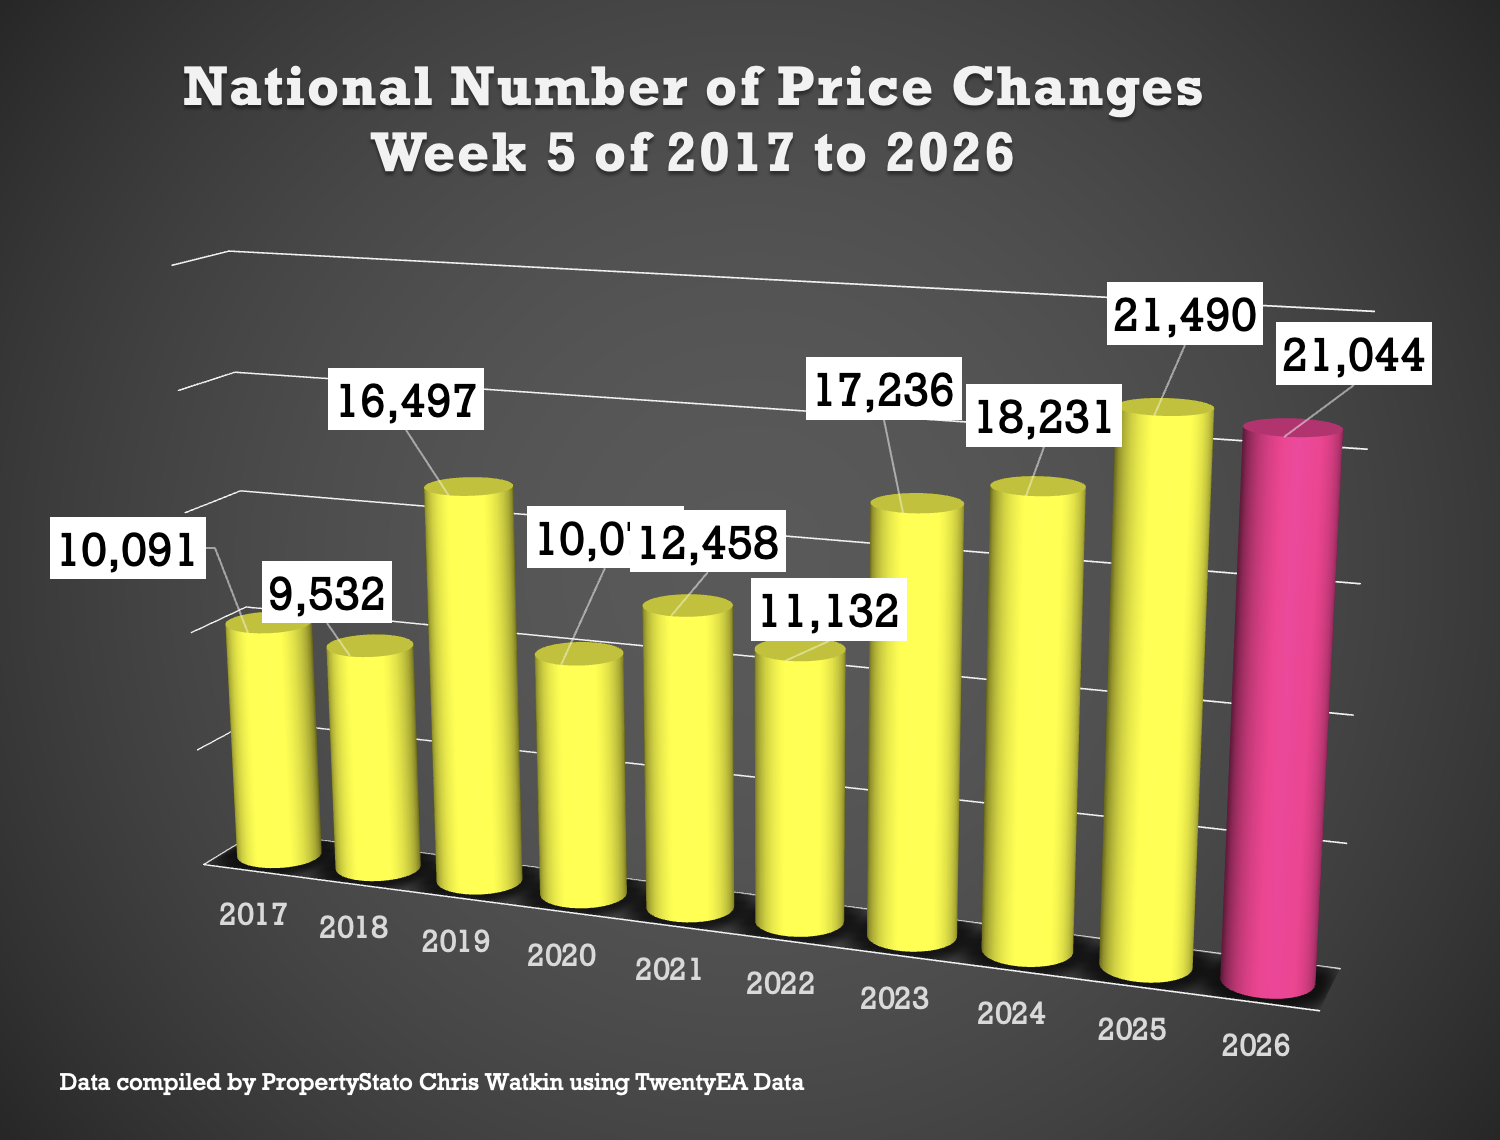
✅ Price Reductions
+ 21k reductions this week
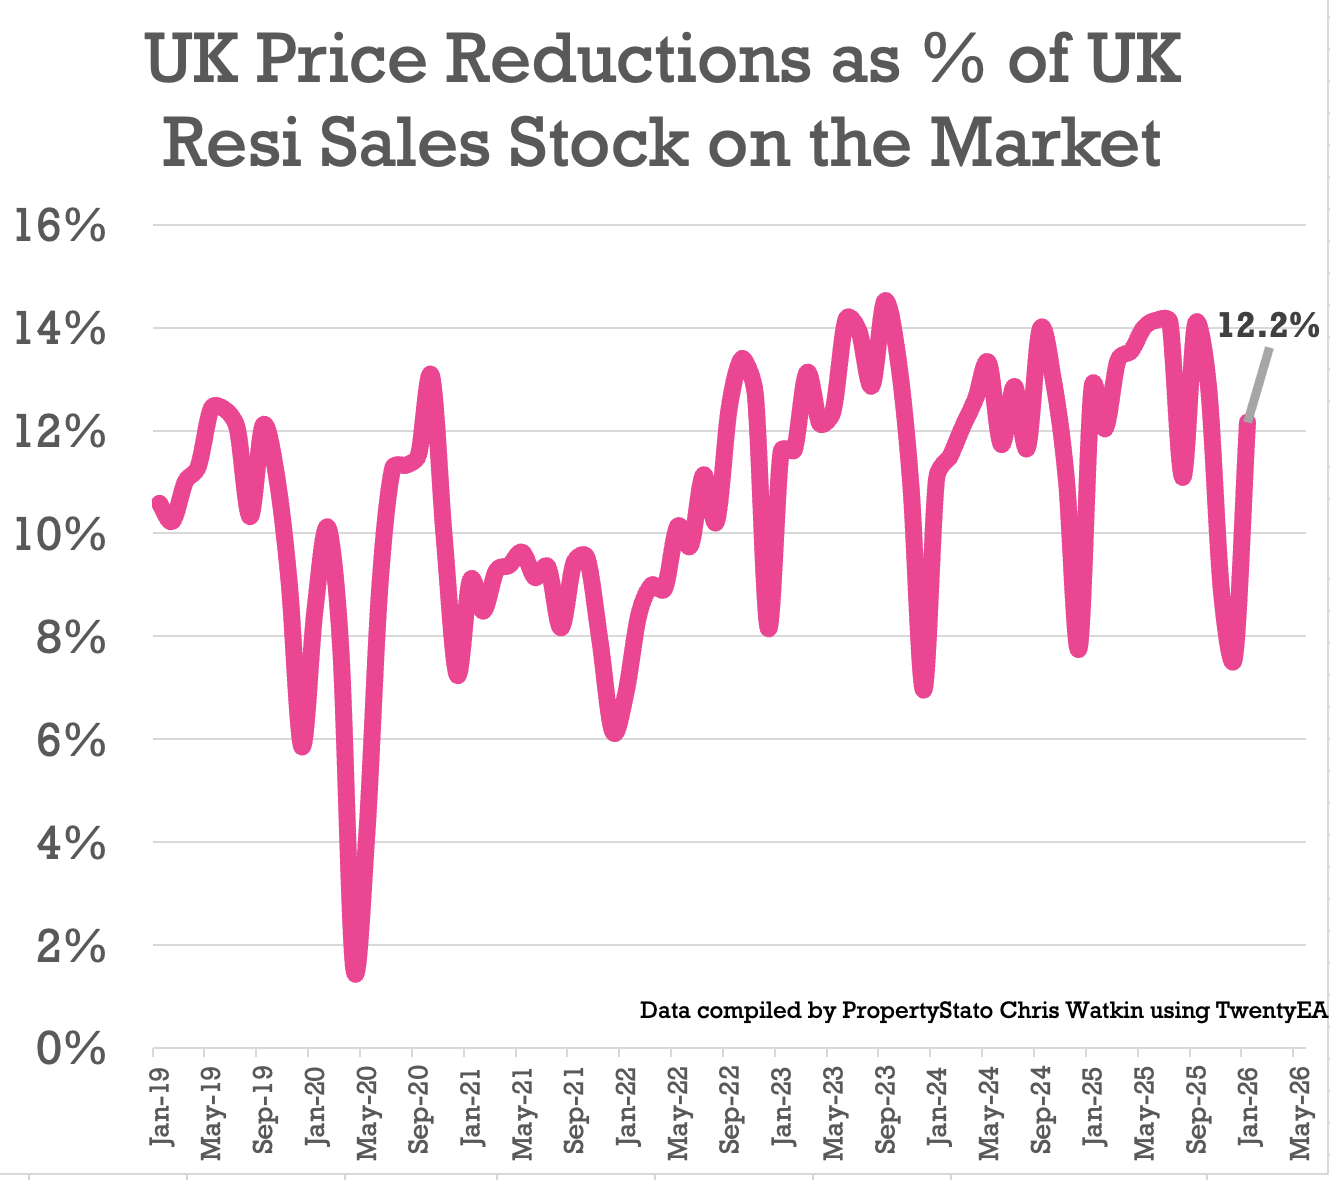
+ 12.2% of resi homes for sale were reduced in January. Jan 25 – 12.8%. Jan 24 – 11.1%
+ 2025 average was 12.8%, versus the 5-year long-term average of 10.74%.
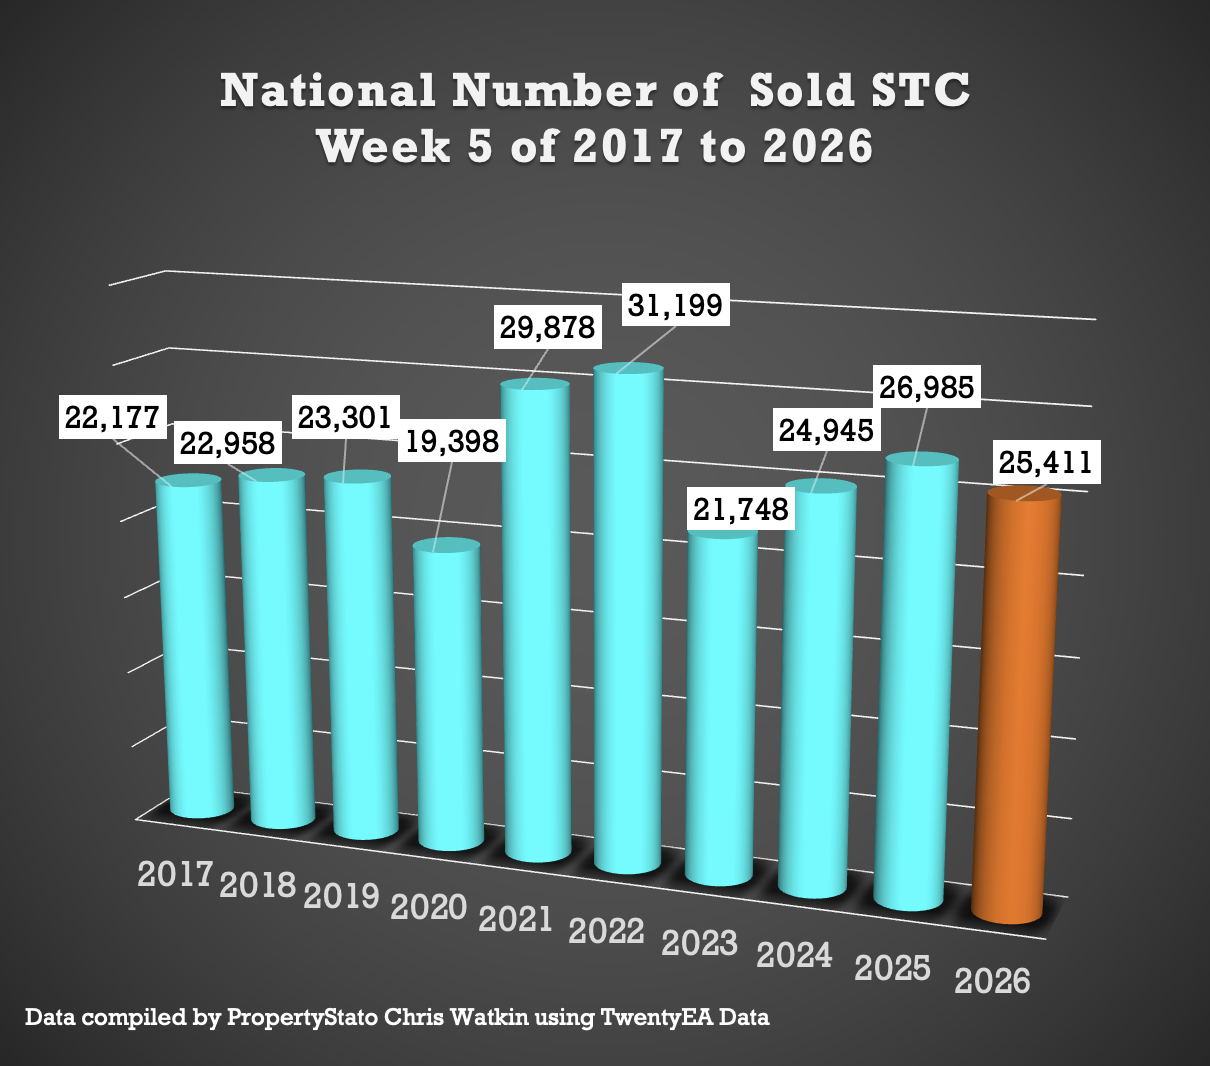
✅ Sales Agreed
+ 25.4k homes sold stc this week 5, slightly down as expected from 26k last week.
+ Week 5 average (for last 10 years) : 24.8k
+ 2026 weekly average : 22.2k.
✅ Price Difference between Listings & Sales
+ 19.7% difference (long term 10 year average is 16% to 17%). (£425k ave Listing Ave Asking price vs £366k Sale Agreed ave Asking price)
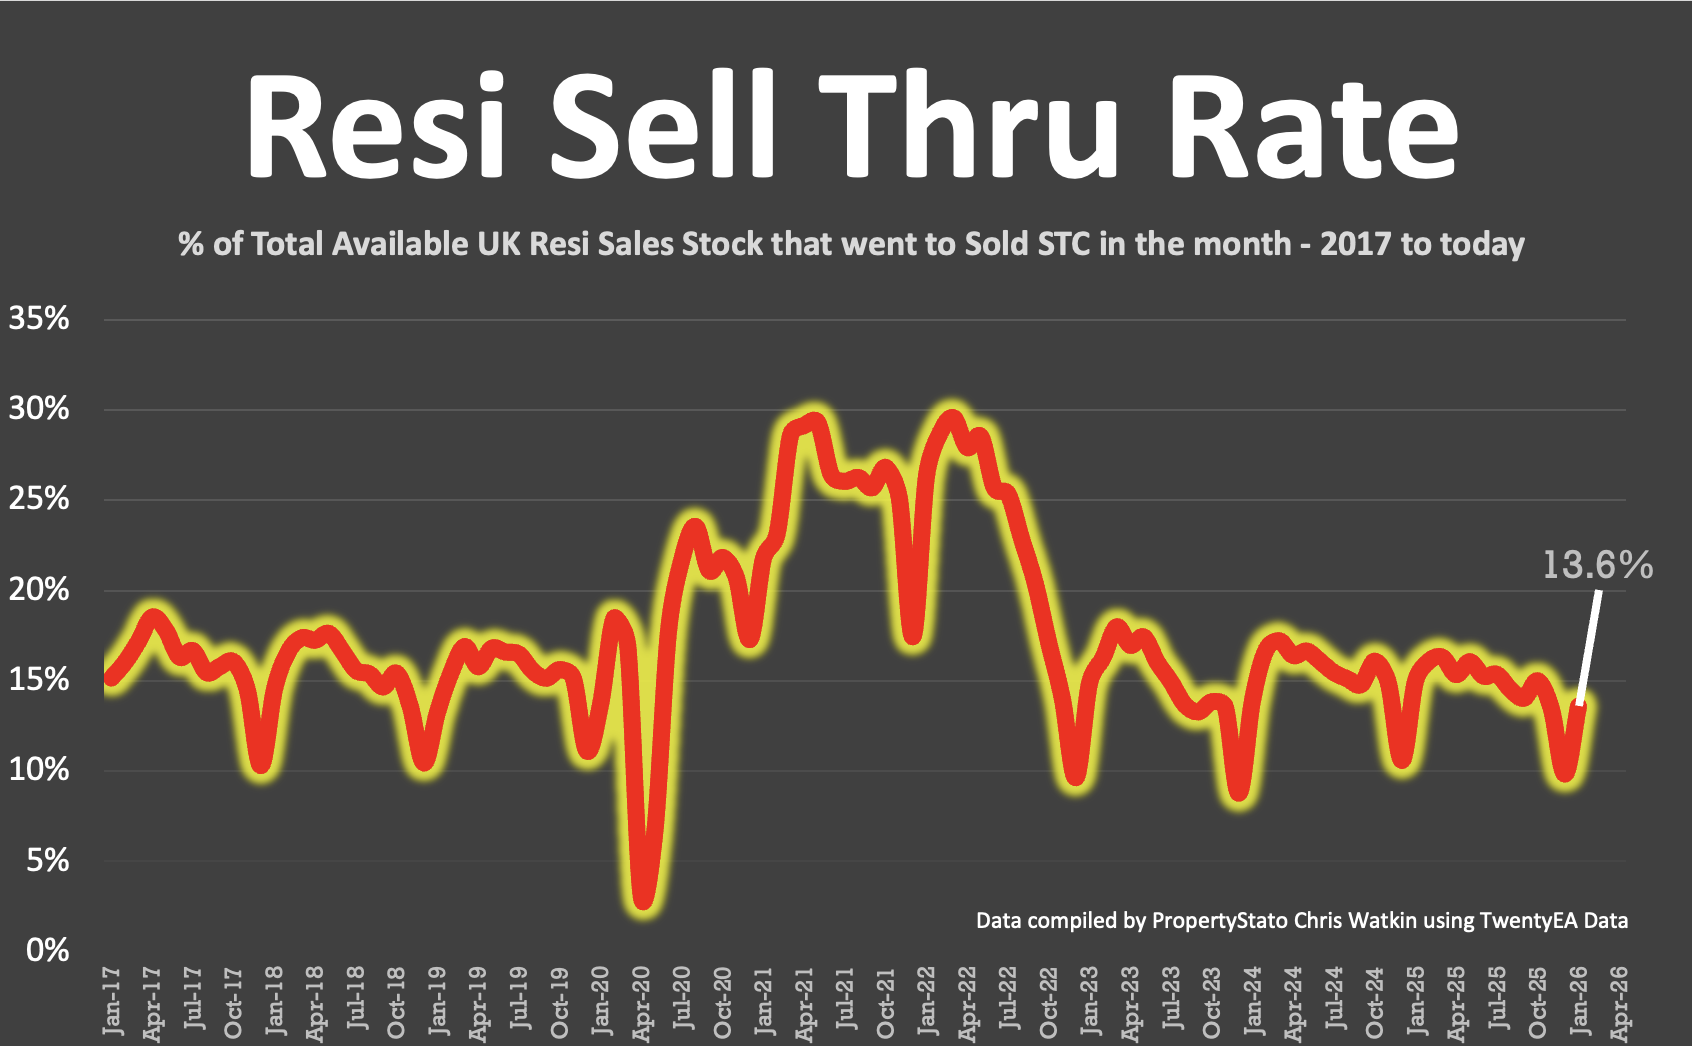
✅ Sell-Through Rate
+ 13.6% of homes on agents’ books went SSTC in January ’26. (Jan ’25 – 15% / Jan ’24 – 13.9%)
+ Pre-Covid average: 15.5%.
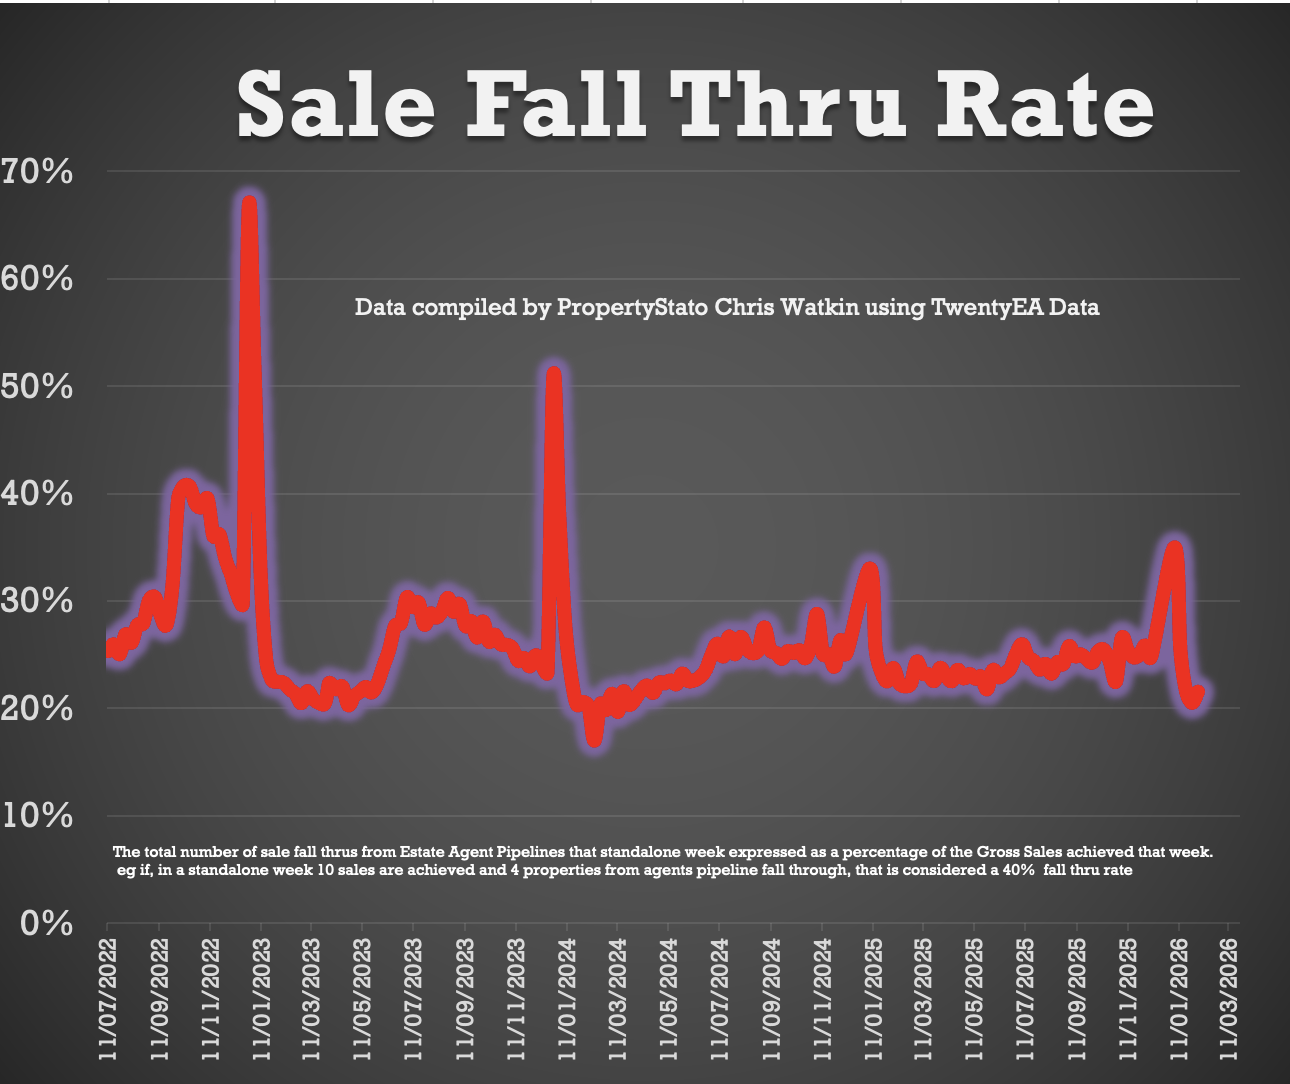
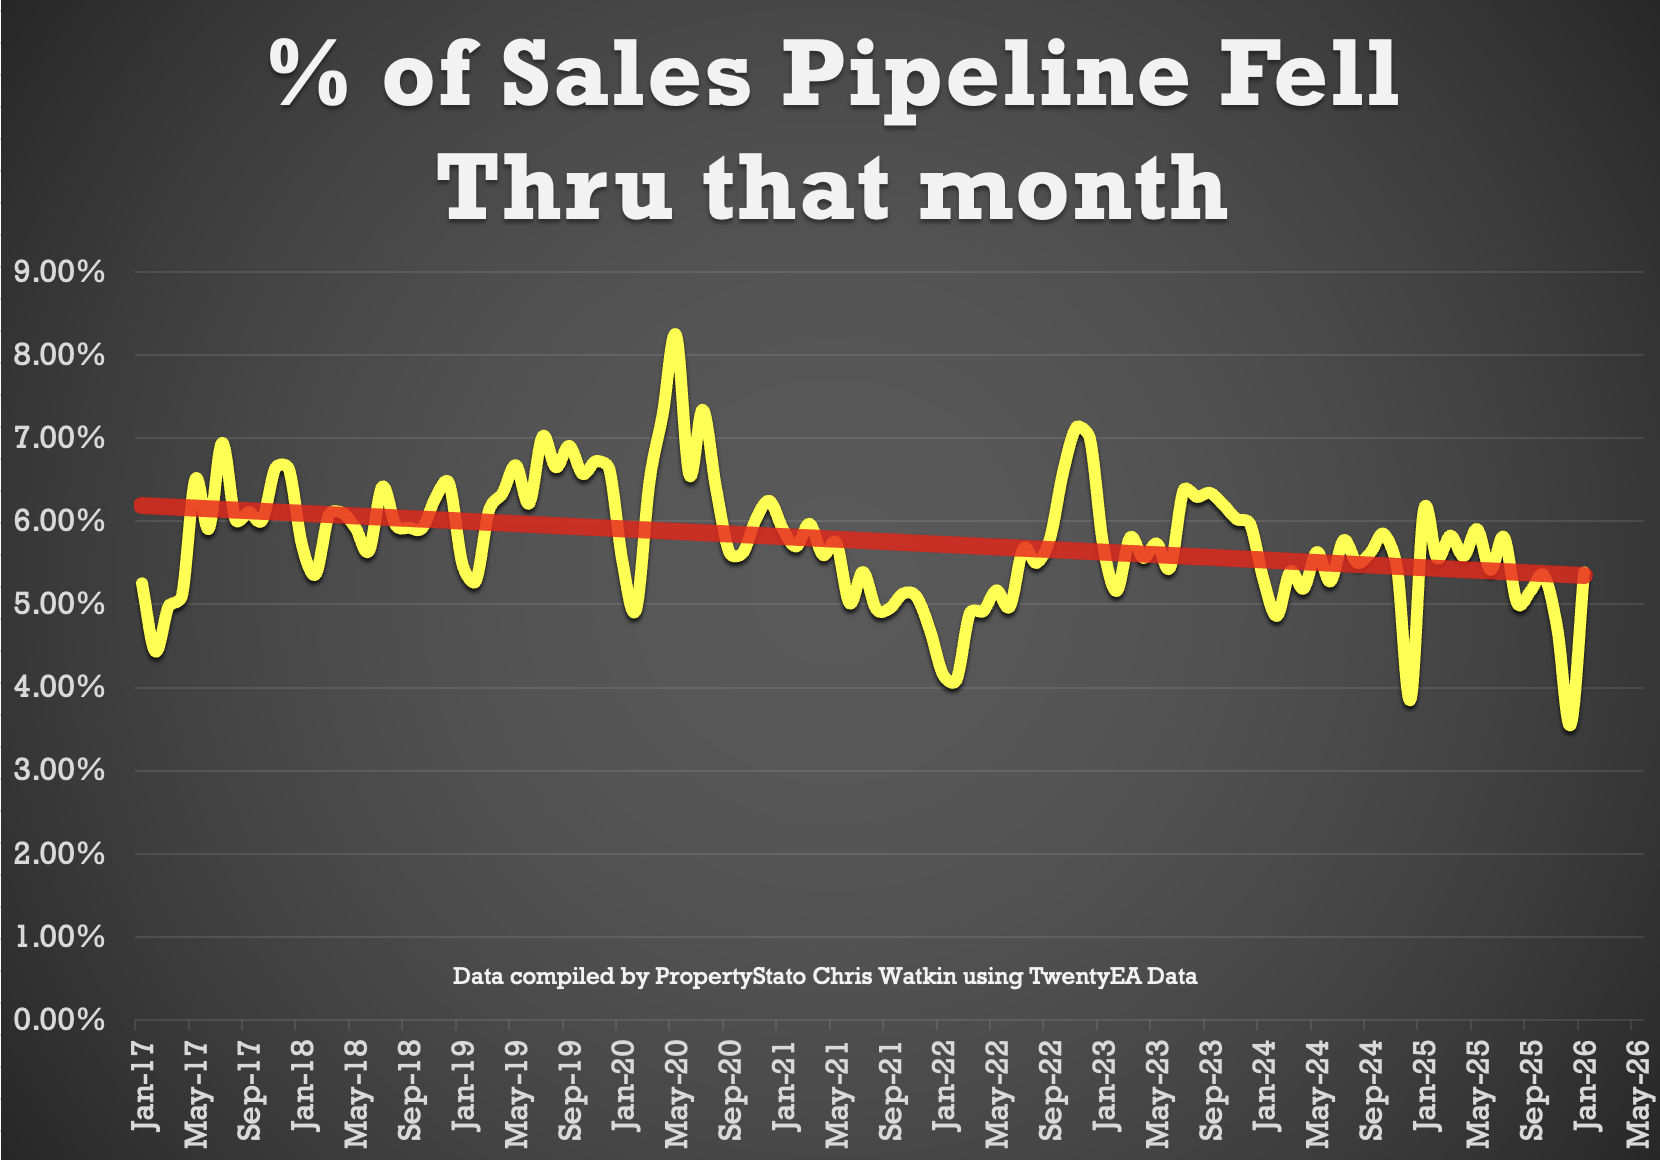
✅ Fall-Throughs
+ 5,468 fall-throughs last week (pipeline of 423k home Sold STC).
+ Weekly average for 2025: 6,100.
+ Fall-through rate: 21.5%, slightly up from 20.5% last week.
+ Long-term average: 24.2% (post-Truss chaos saw levels exceed 40%).
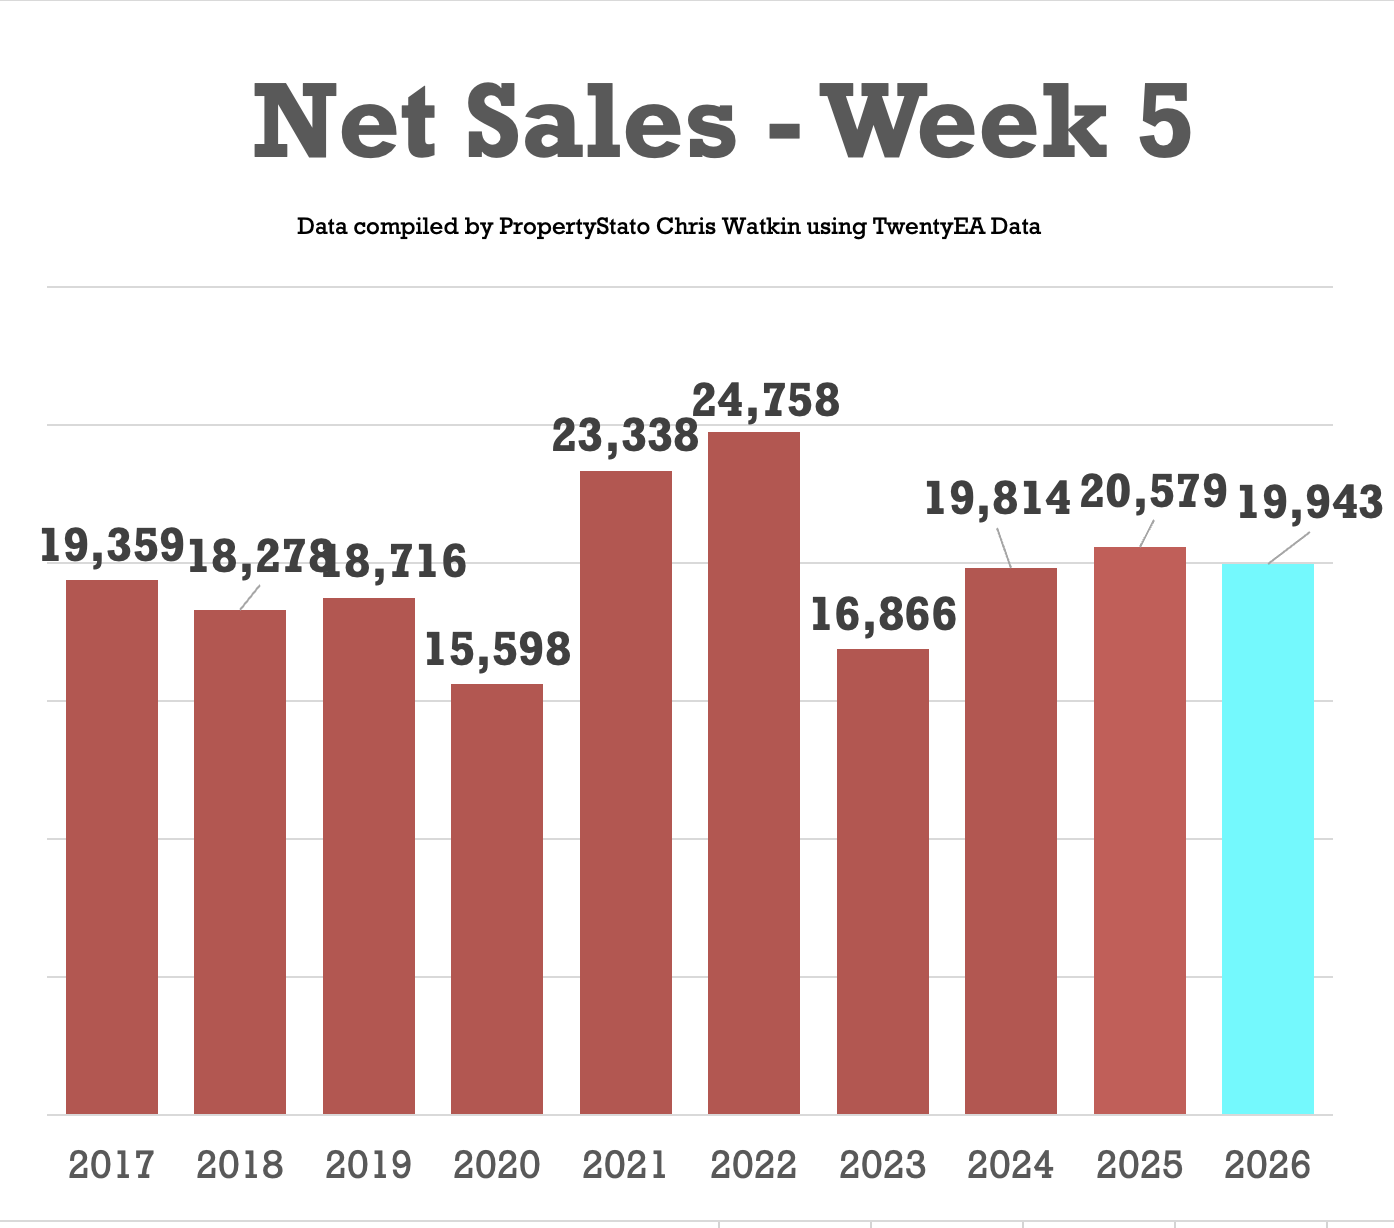
✅ Net Sales
+ 20k Net sales, down slightly from 20.7k last week
+ Ten-year Week 5 average: 19.7k.
+ Weekly average for 2026: 17.4k.
+ Weekly average for the whole of 2025: 19.2k.
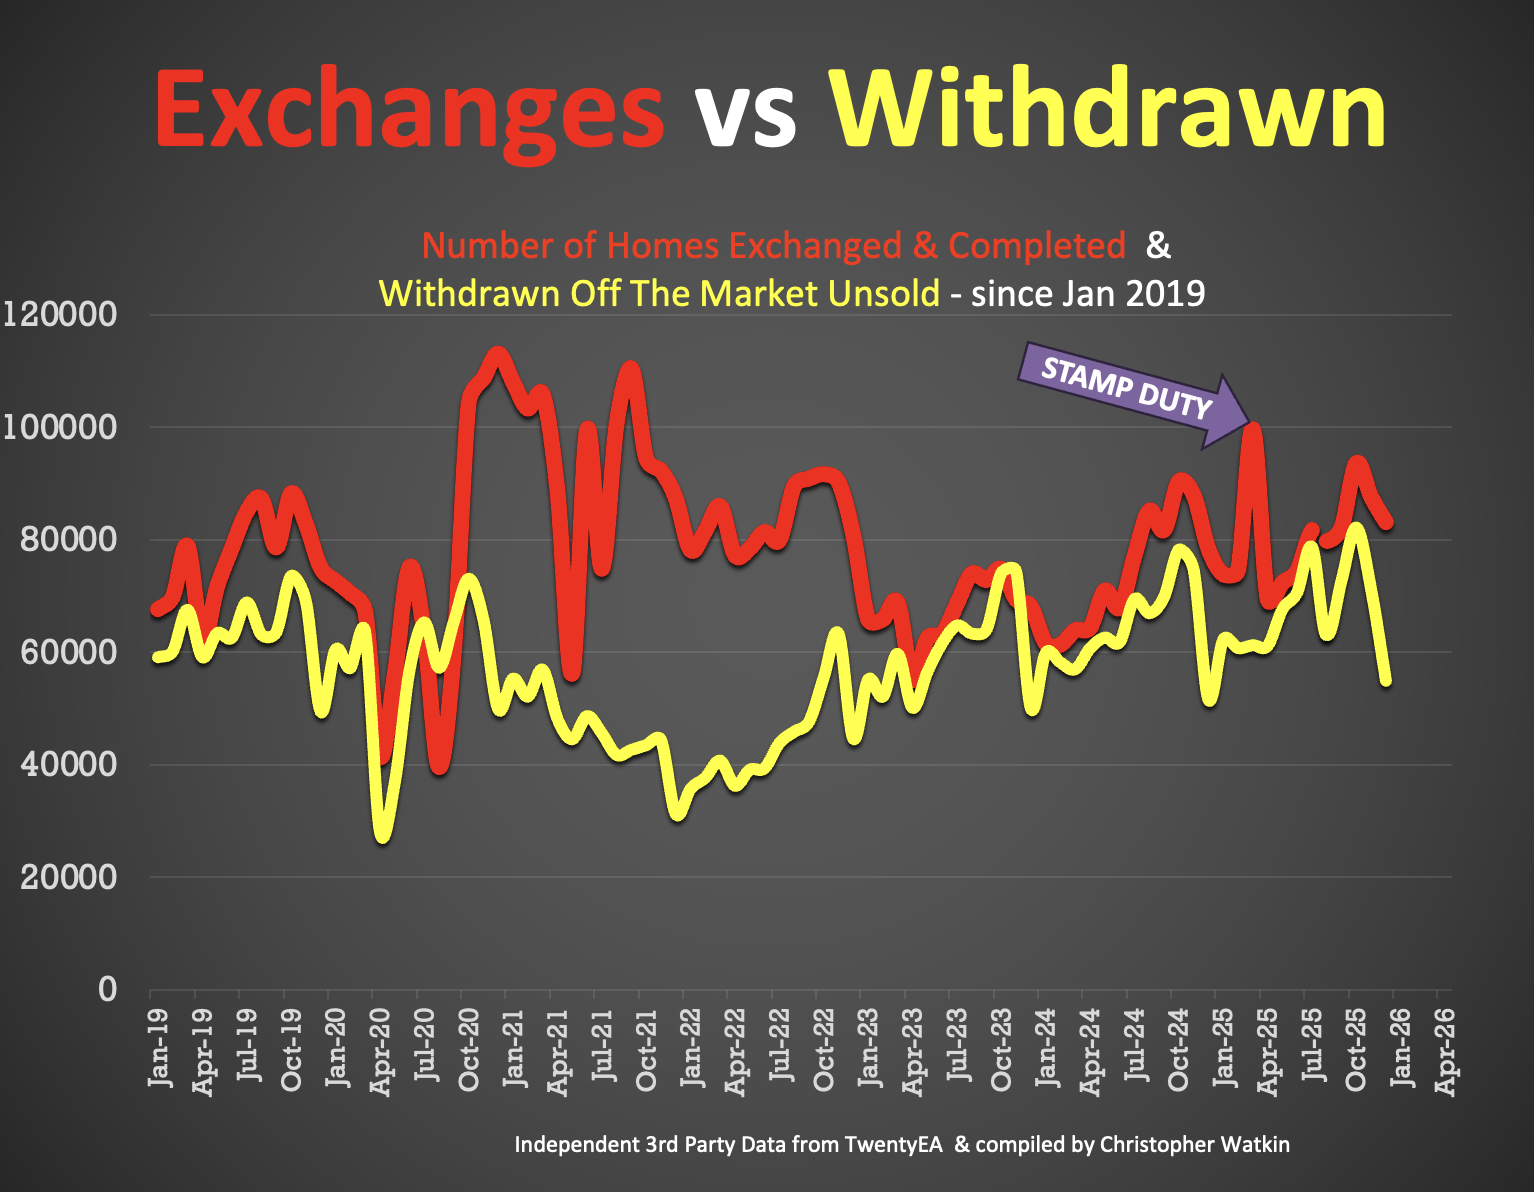
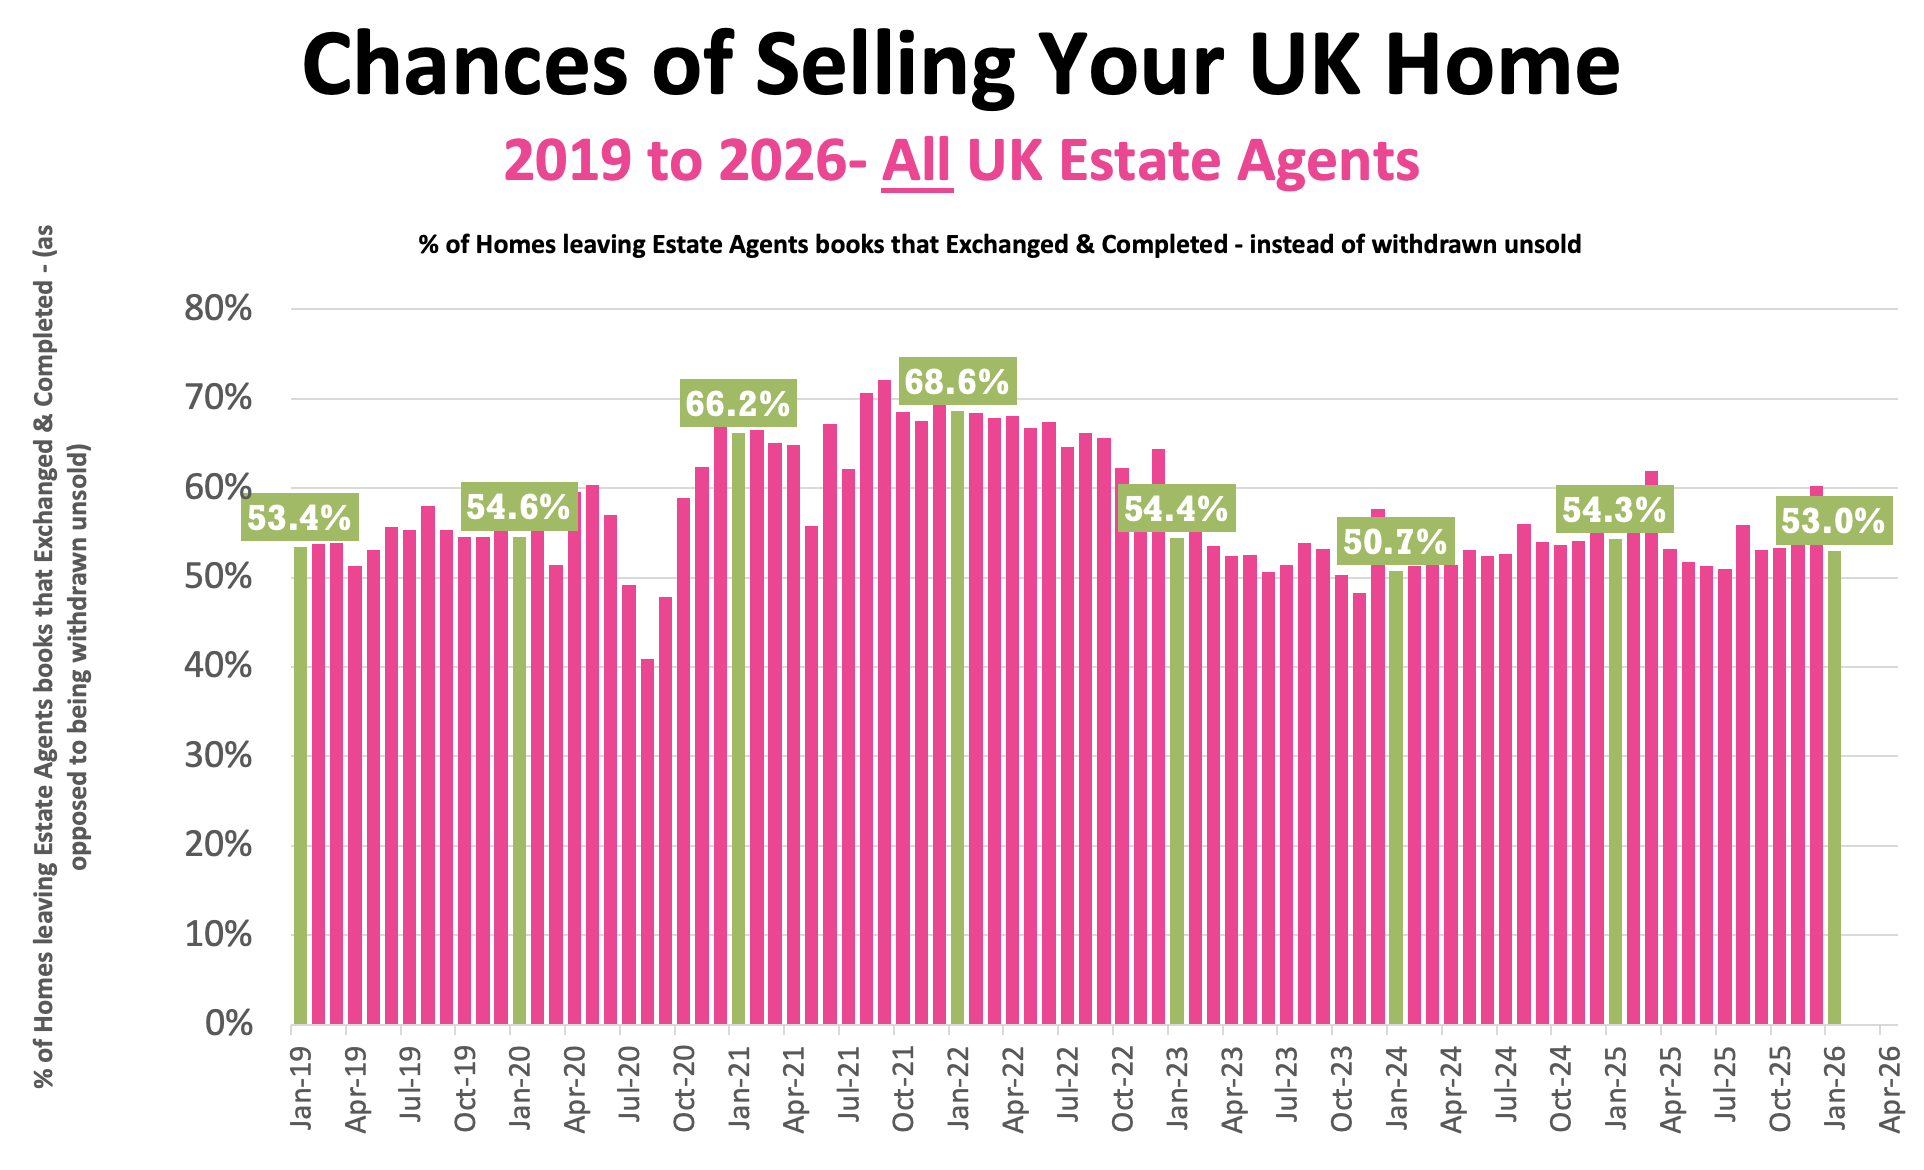
✅ Probability of Selling (% that Exchange vs withdrawal)
+ Jan ’26 Stats : 53% of homes that left agents’ books exchanged & completed in Jan. (Note this figure will change throughout the month as more Feb stats come in).
+ December 60.2% / November 55.2% / October 53.3% / September: 53.1% / August :55.8% / July: 50.9% / June: 51.3% / May: 51.7% / April: 53.2%.
+ Jan 25: 54.3% / Jan 24: 50.7% / Jan 23: 54.4% / Jan 22: 68.6%.
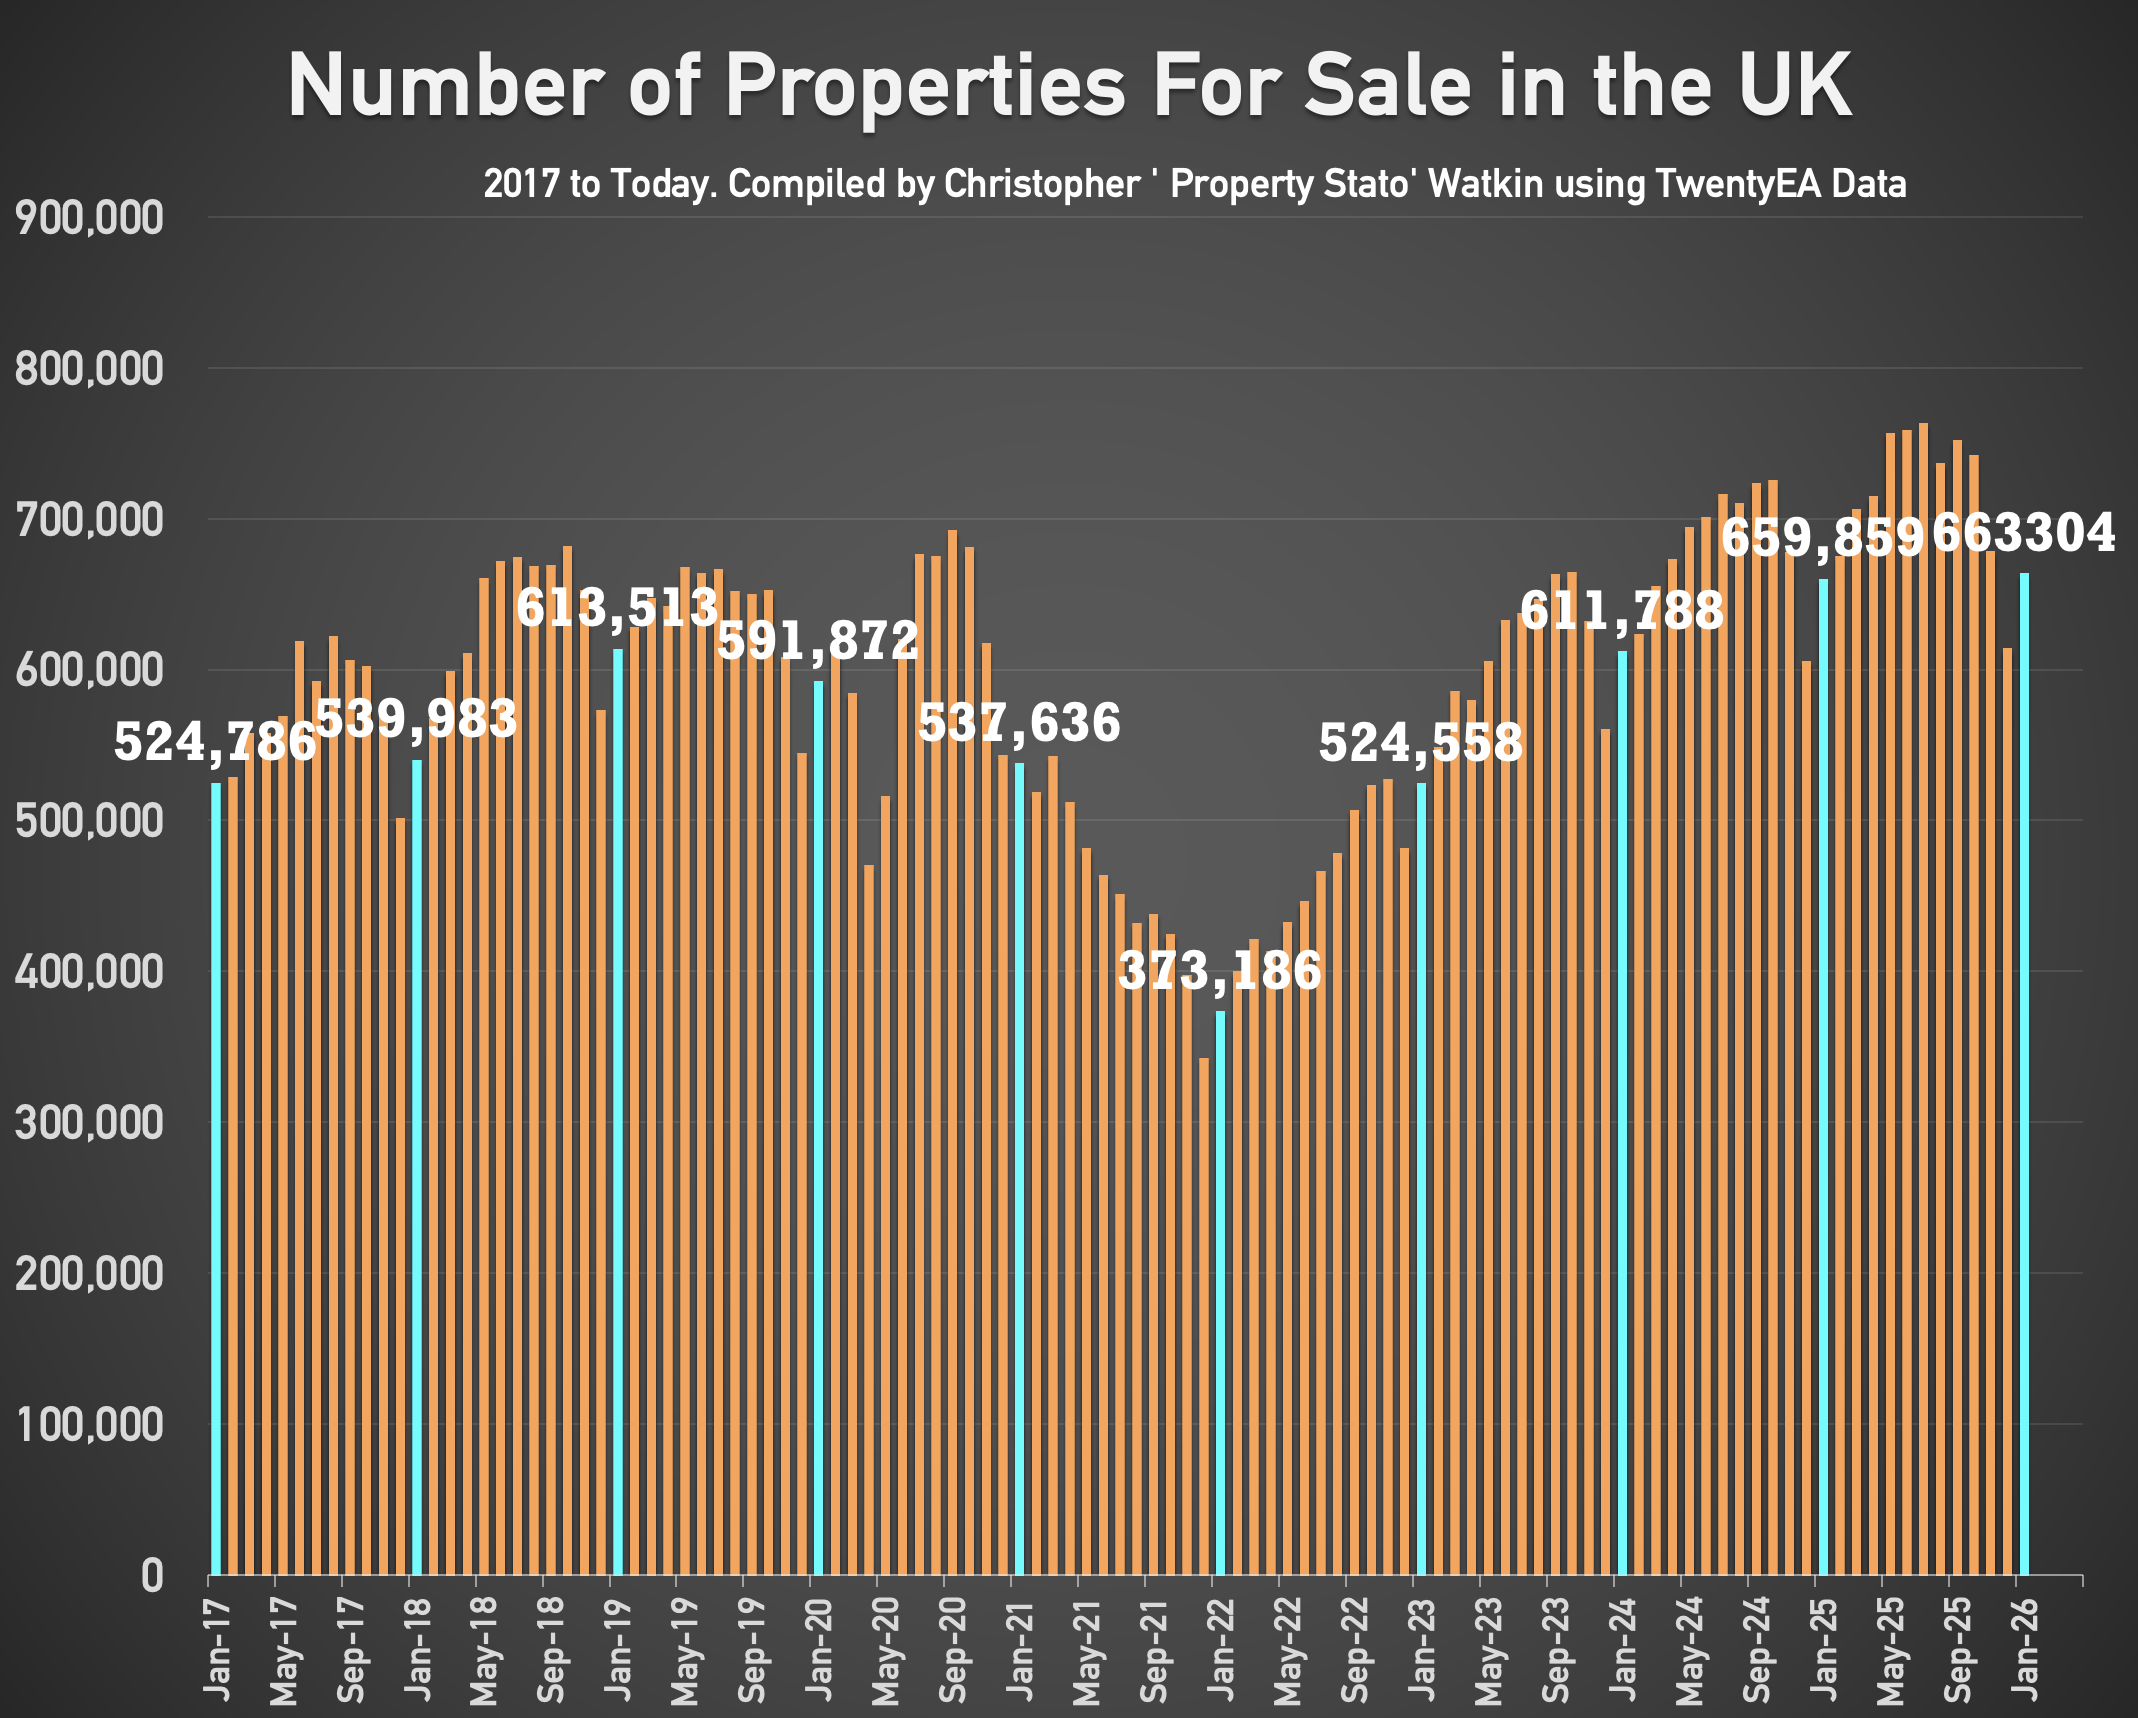
✅ Stock Levels
+ 663k homes on the market on the 1st of February ’26. (660k – Jan 25)
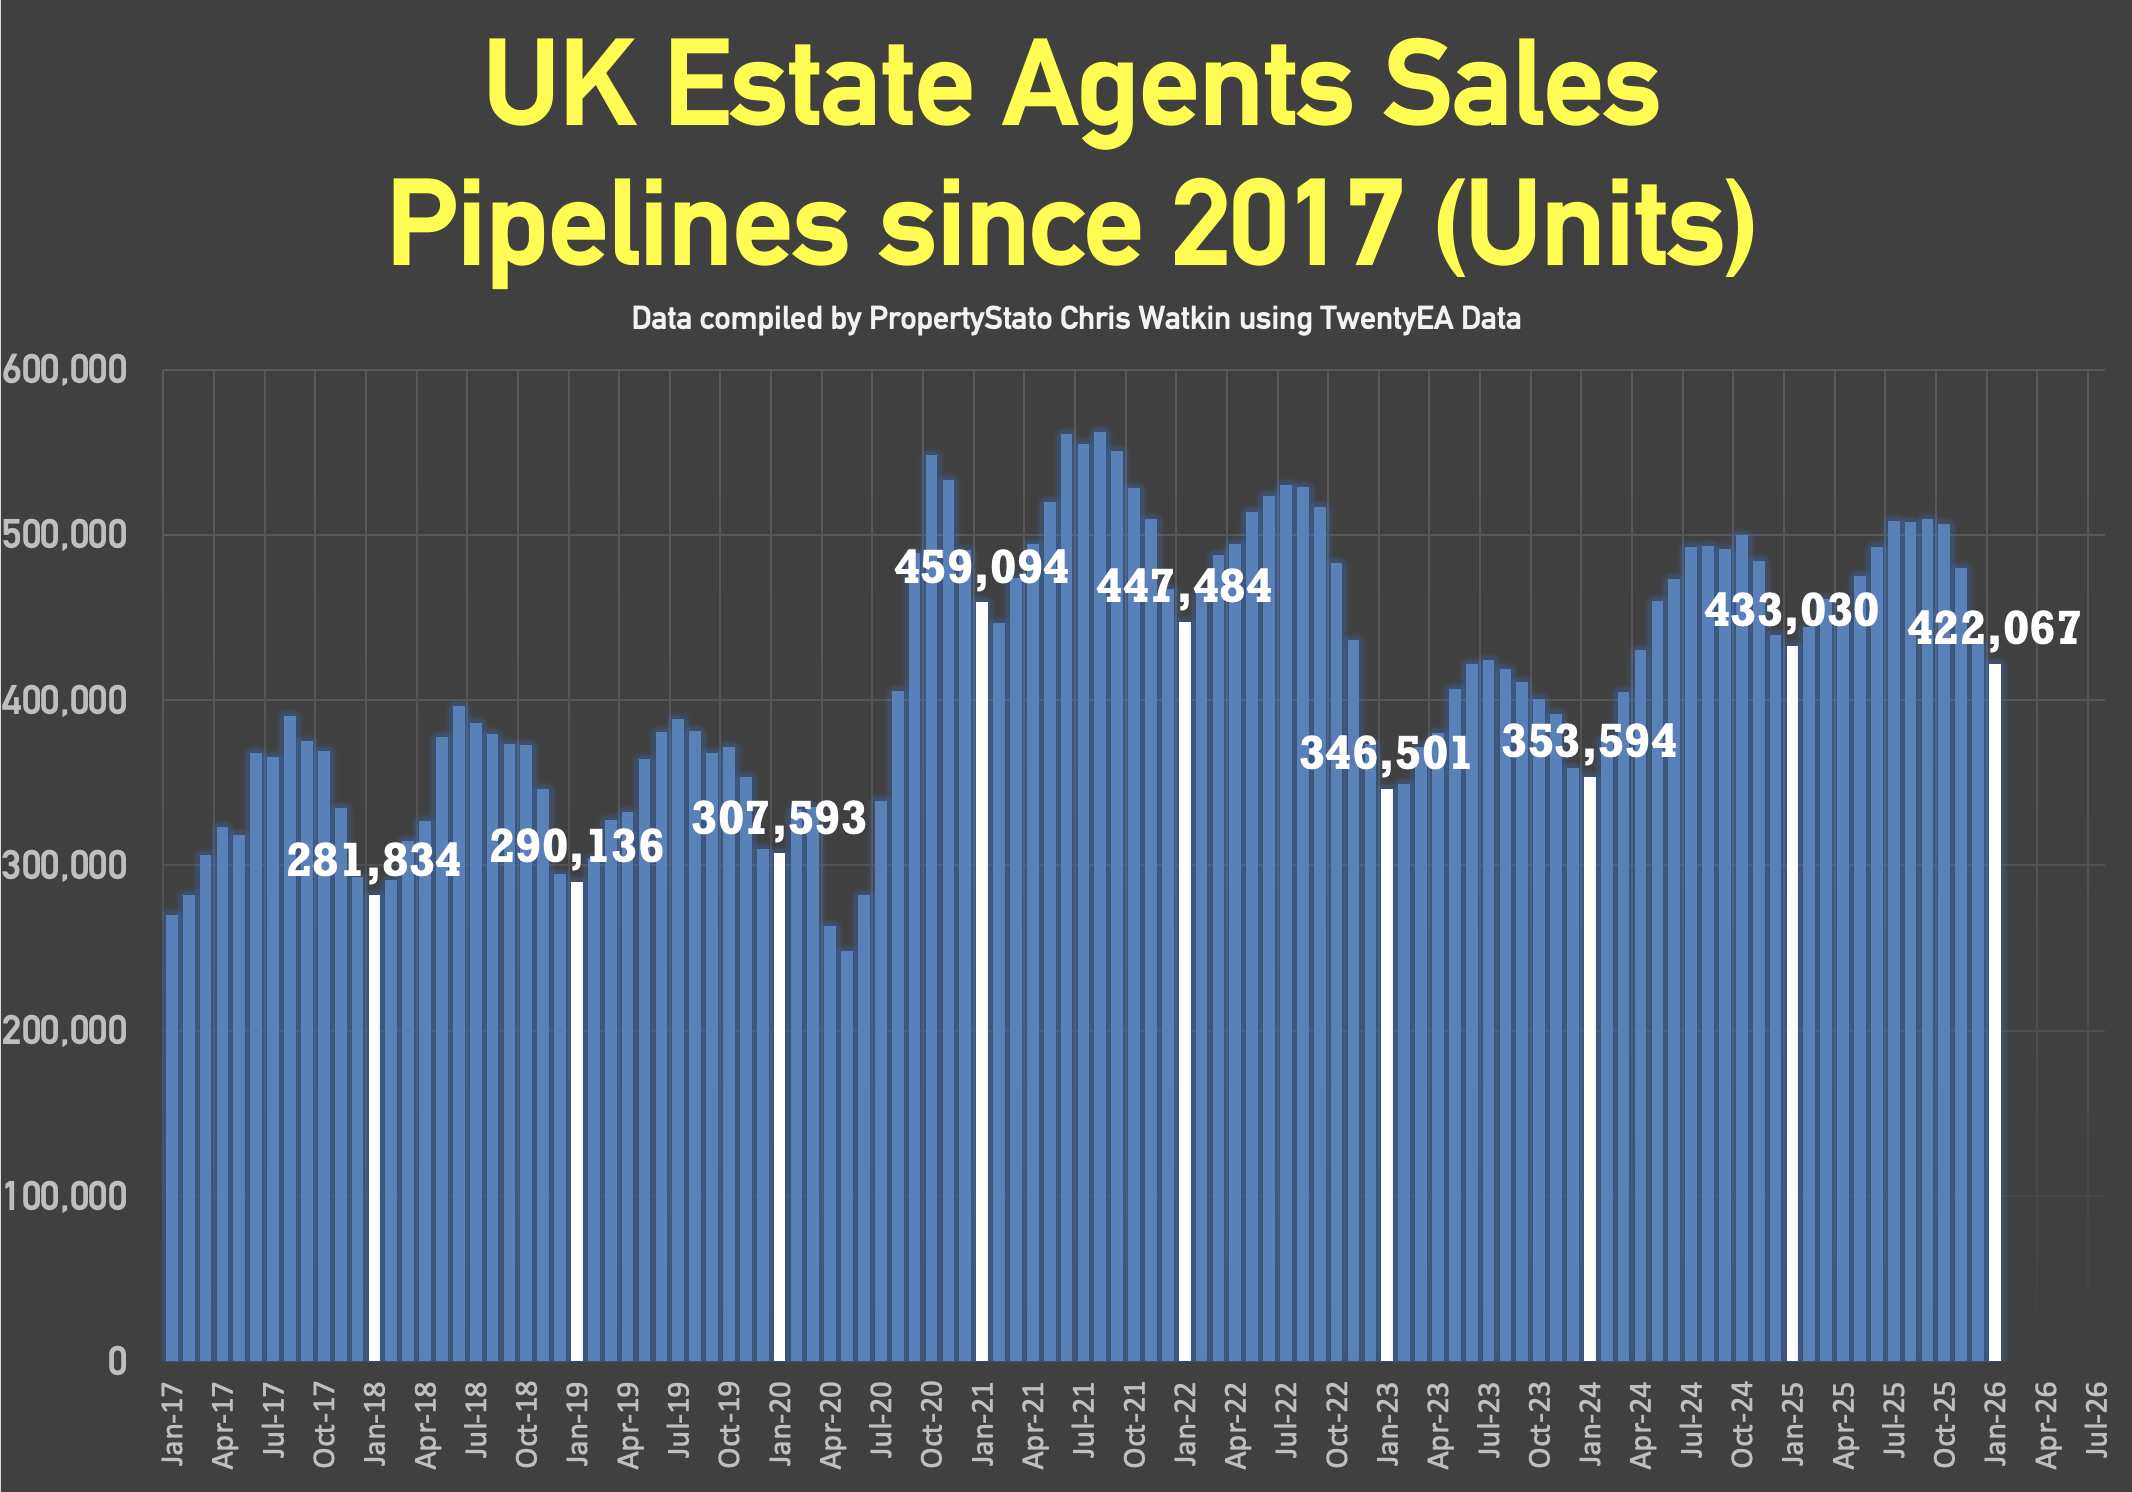
+ 422k homes in agent’s sales pipeline on the 1st Feb 2026, slightly lower than 12 months ago on 1st Feb ’25 (433k).
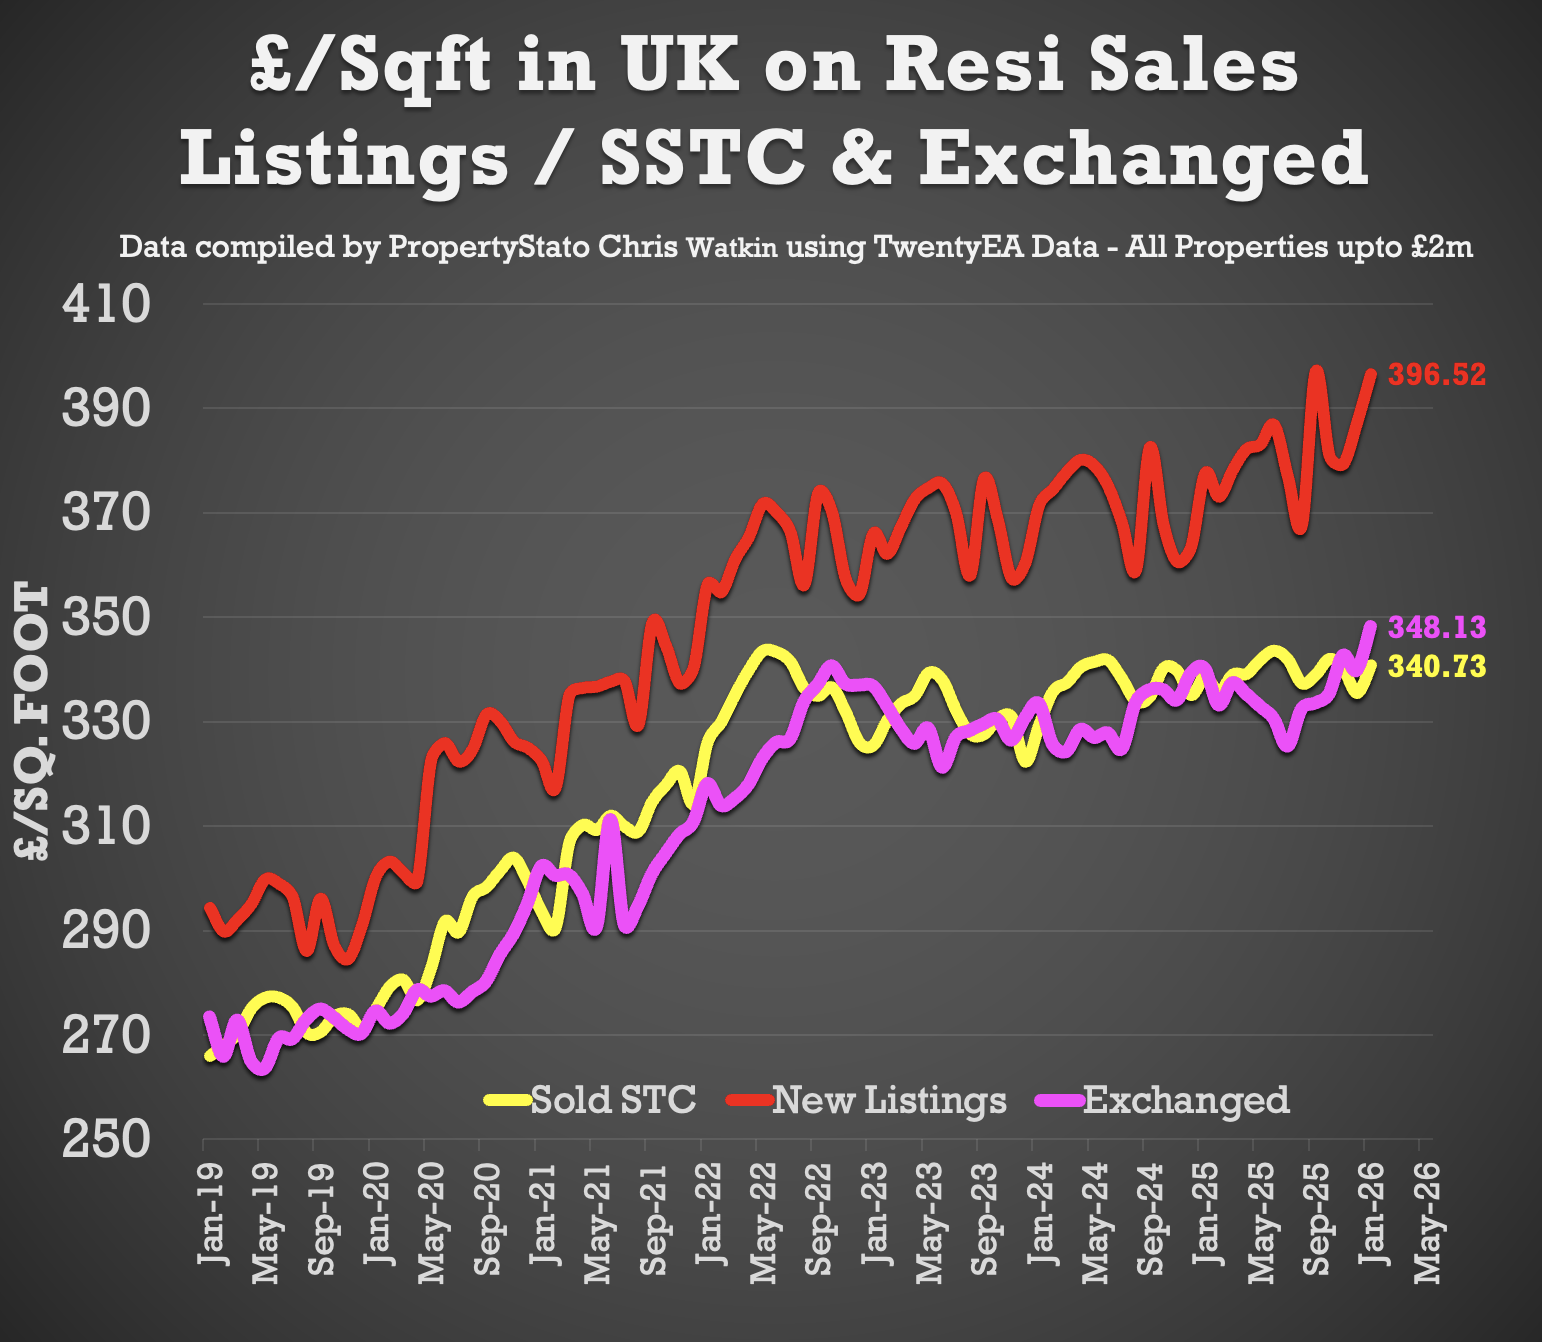
✅ House Prices (£/sq.ft)
+ January ’26 agreed sales averaged £340.73 per sq.ft. 0.63% higher than 12 months ago (£338.59) and 16% than 5 years ago (£293.54). The £/sqft at sale agreed matches the HM Land Registry Index with a 98% accuracy, 5 months in advance. That is why it is so important.
✅ Local Focus
Ashford (Kent)
One thing discussed in the video is the the “Canary in the Mine” metric most agents ignore
One of the most important conversations in this week’s show wasn’t about house prices at all.
It was about stock levels by property type.
Most agents track how many homes are on the market. Almost none track:
Detached vs semi vs terrace vs flats
Two beds vs three beds
What is selling vs what is sticking
That is your early warning system.
Markets do not turn overnight. They whisper first.
And the whisper usually starts in one segment before spreading.
If you want to know where your market is heading, track supply and sold STC levels by property type every single month.
That is how you stay ahead instead of reacting six months late.
You must be logged in to like or dislike this comments.
Click to login
Don't have an account? Click here to register
In the Ashford section, I said overvaluing on its own isn’t the problem. Vendor Management Is.
You see some agents in Ashford are overvaluing.
And still outperforming on exchanges.
Why?
Because they are getting prices adjusted quickly and professionally.
There is a huge difference between:
Overvaluing and ignoring it
Overvaluing and actively managing it
If you are going to stretch the price, you must:
Book the 3 week face to face review at the listing
Control reductions early
Stay in front of the client
The real issue is not price.
It is silence.
You must be logged in to like or dislike this comments.
Click to login
Don't have an account? Click here to register
The Estate Agency’s Industry’s Dirty Secret About Sole Agency Agreements
Let me say this plainly.
Long sole agency agreements protect bad pricing.
If 47% of homes are leaving agents’ books unsold, yet tie in periods are stretching 20 weeks plus, that is not confidence.
That is insulation.
If you truly believe in your pricing, your marketing and your negotiation ability, you do not need five months of protection.
You need performance.
Vendors should be asking:
Why do you need that long?
What happens if you are wrong?
Where is my exit if you overvalue me?
An agent who is confident in their ability to sell should be equally confident in being held accountable.
If that feels uncomfortable, good.
You must be logged in to like or dislike this comments.
Click to login
Don't have an account? Click here to register
Most estate agent social media looks identical.
Listing.
Listing.
Sold board.
Testimonial.
Market share pie chart.
Listing.
Listing.
Listing.
Listing.
Sold board.
Testimonial.
Market share pie chart.
Listing.
Listing.
No homeowner lies awake at night worrying about your market share.
They worry about one thing.
“Will my house actually sell?”
The only number that truly matters to a vendor is your probability of getting them to exchange and complete.
If your exchange ratio is below the local average, your pie chart is irrelevant.
If it is above the local average and you are not shouting about it, you are underselling yourself.
Market share is ego.
Exchange ratio is competence.
Choose which one you want to be known for.
You must be logged in to like or dislike this comments.
Click to login
Don't have an account? Click here to register
To prevent the real estate market from skyrocketing in price, developers need to adopt cutting-edge, modern solutions. I’m referring to modern CRM systems for developers, such as https://re-platform.io/ . Such systems will clearly reduce various costs, which can have a positive impact on both the number of sales themselves and the overall cost (including for the end consumer)
You must be logged in to like or dislike this comments.
Click to login
Don't have an account? Click here to register