

 This week on the UK Property Market, which looks at the week ending 1 February 2026, I am joined by McKenzie from the Guild of Property Professionals.
🟩 Listings – Strong
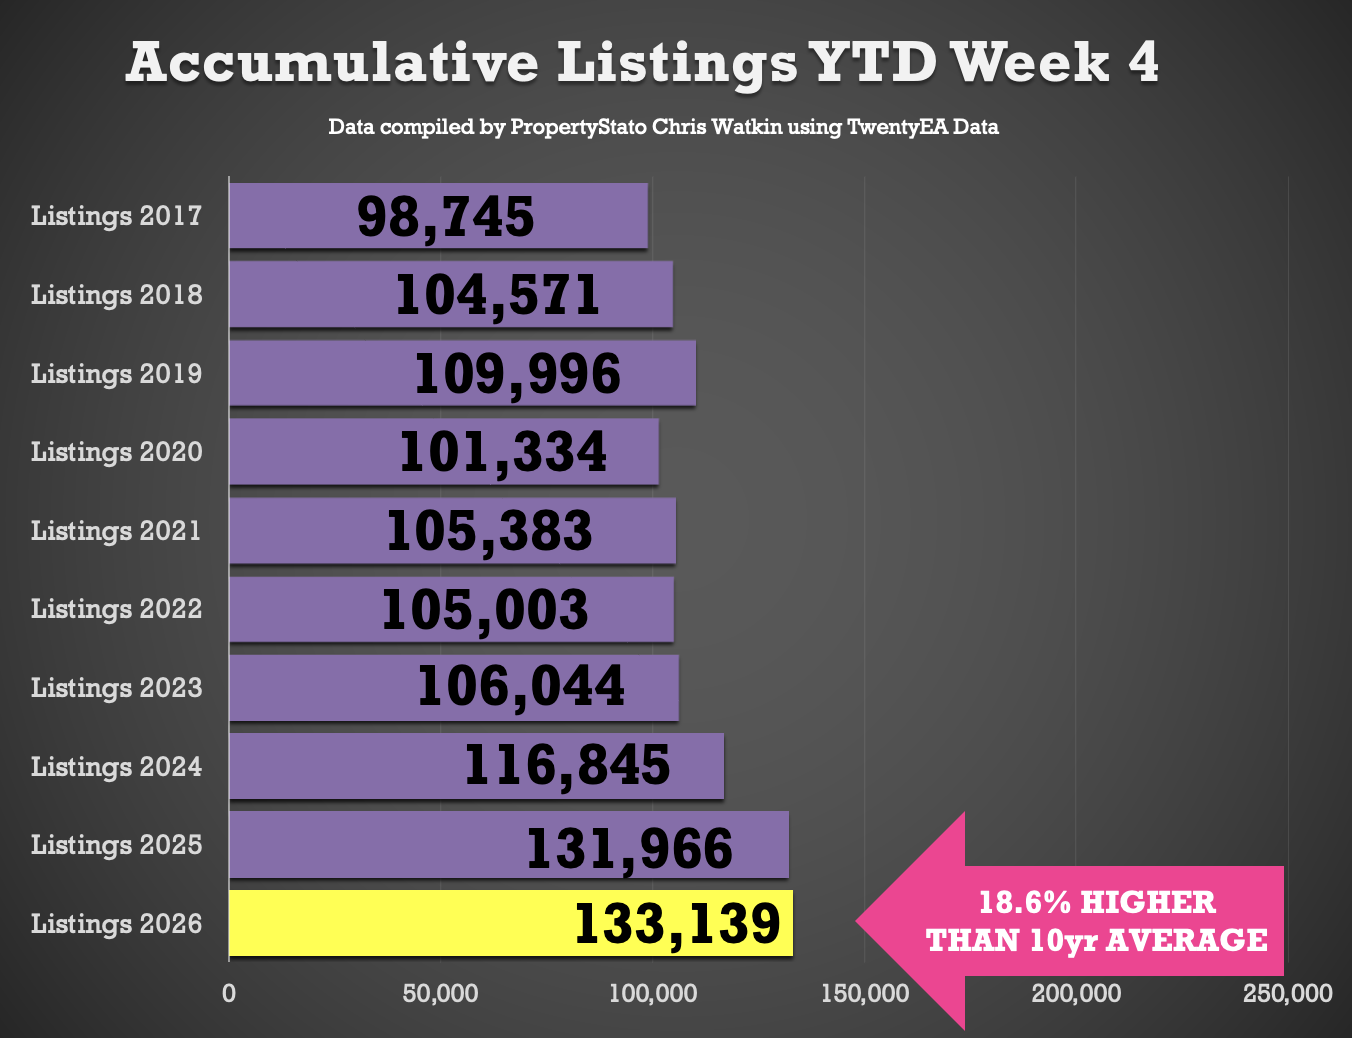
133k new properties have come onto the market YTD , already 1% ahead of 2025, 14% above 2024, and 28% higher than the 2017–19 average.
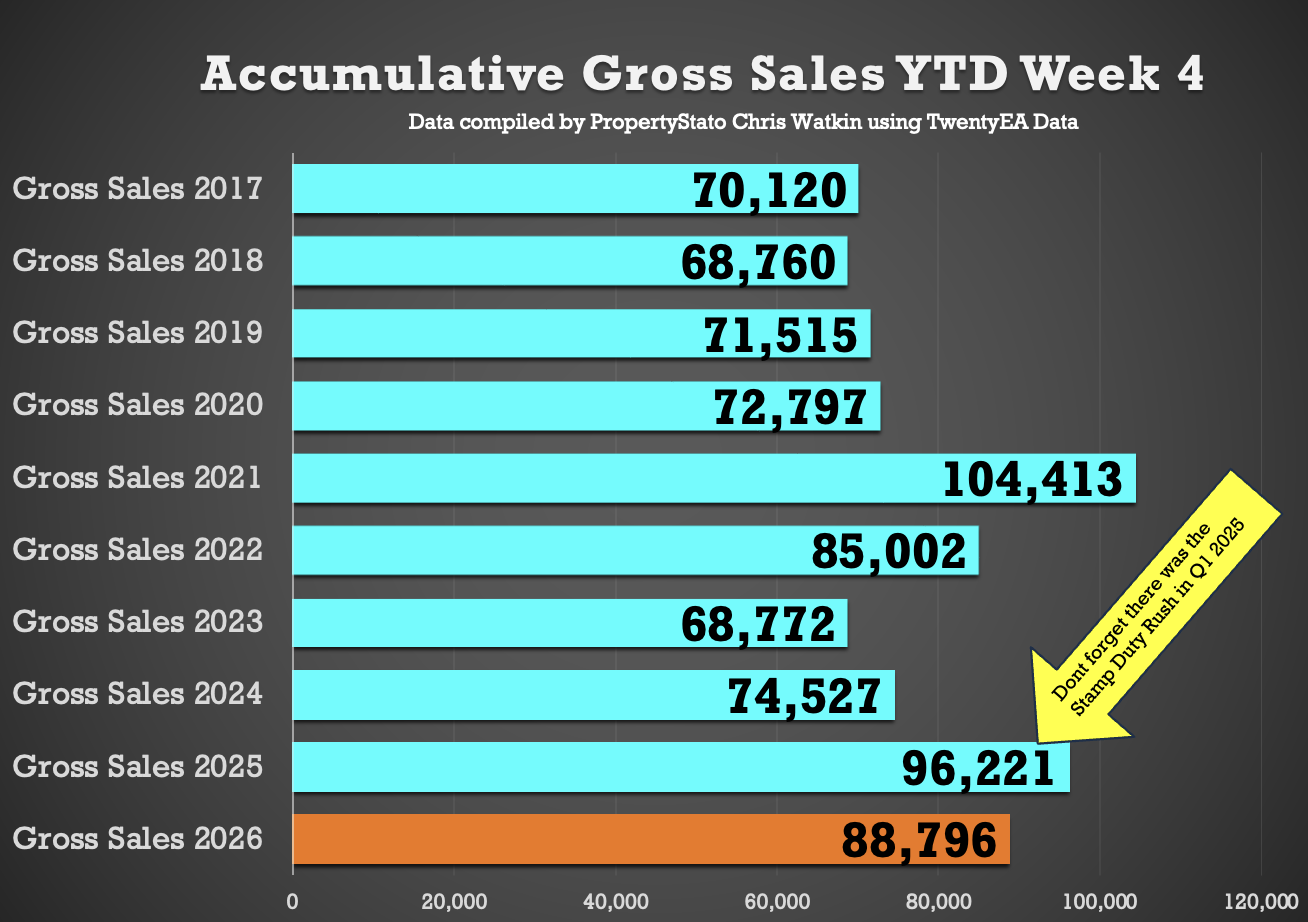
🟩 Gross Sales – Strong
89k UK homes sold STC YTD house, 19% higher than 2024 and 27% above pre Covid norms.
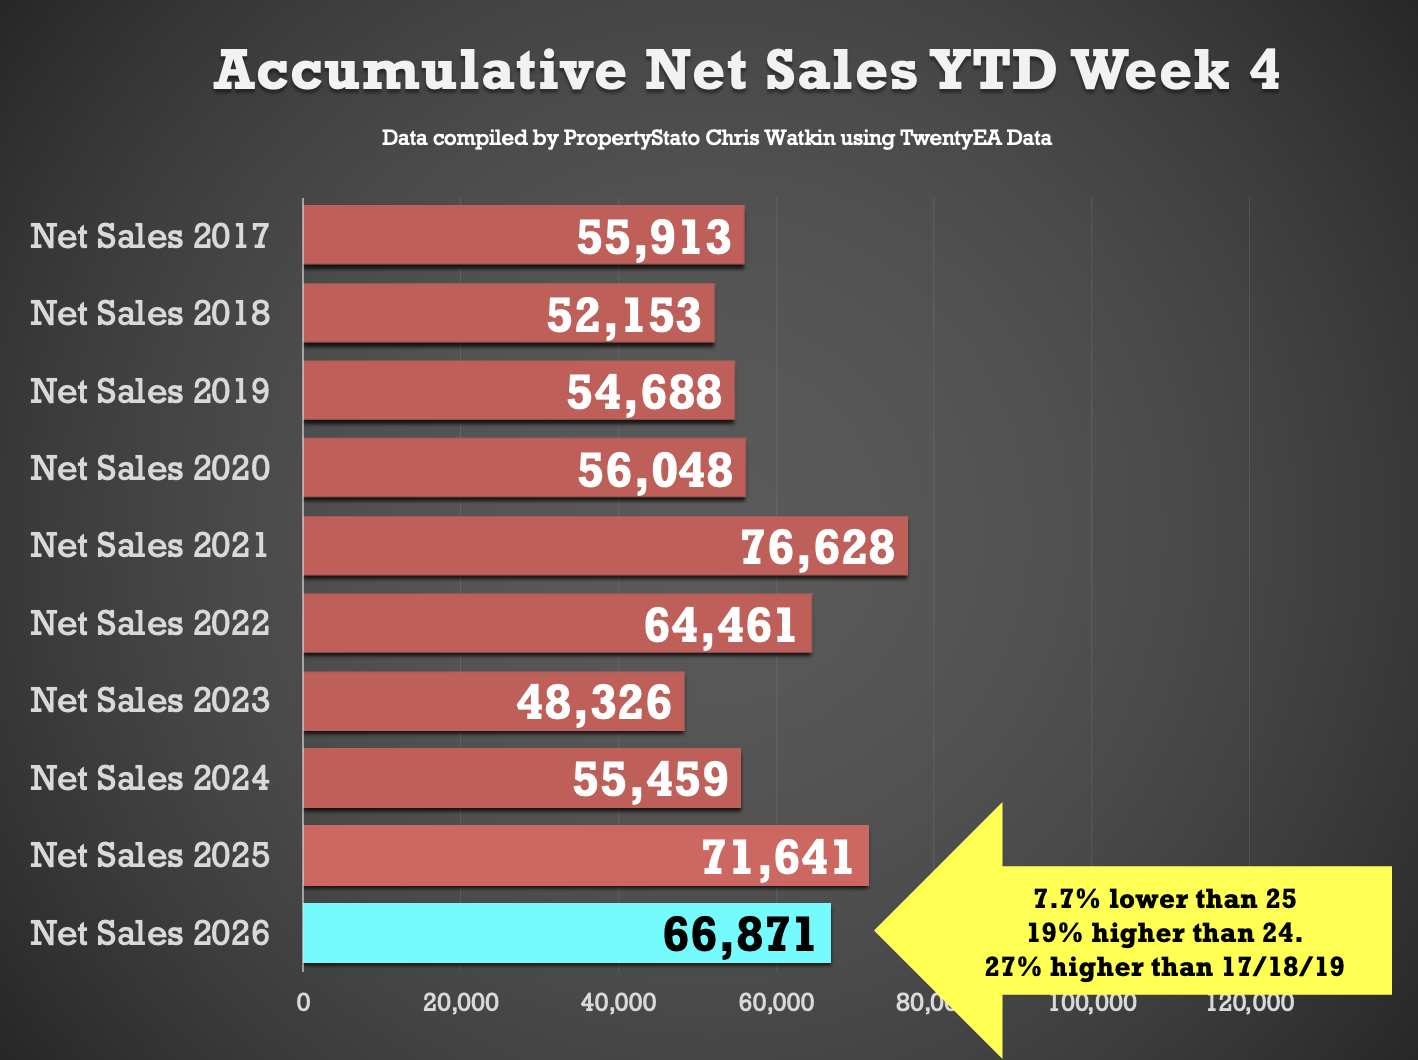
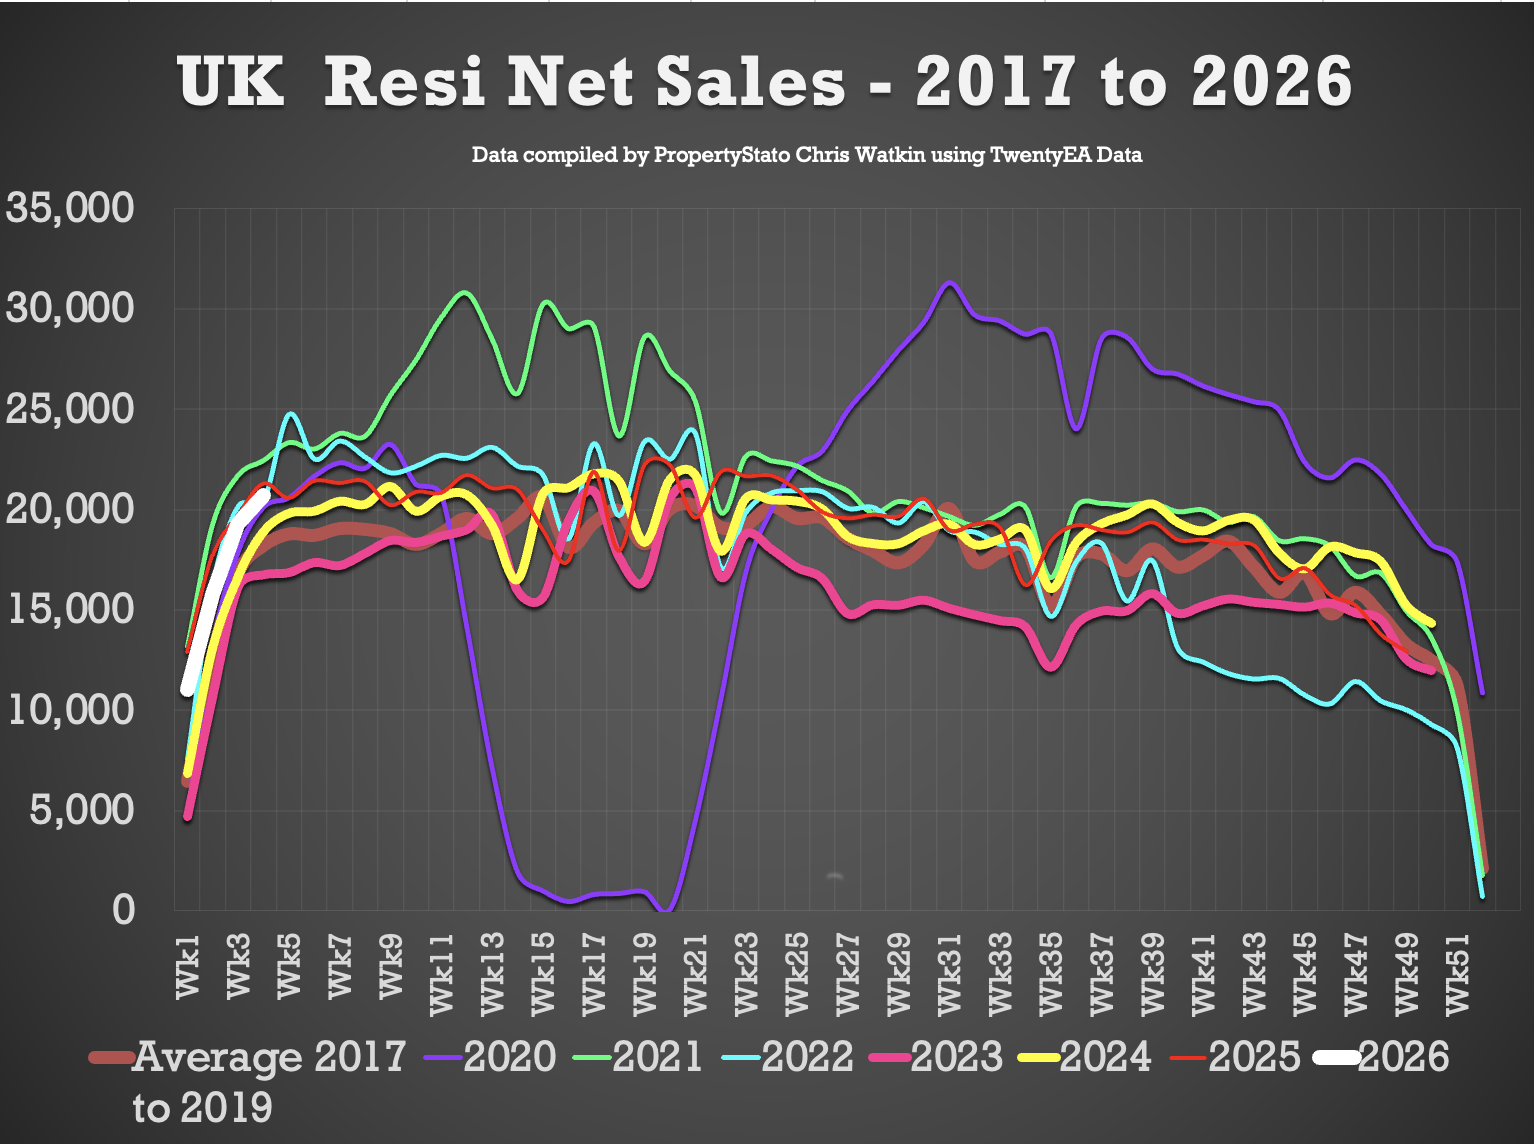
🟩 Net Sales – Strong
67k UK net home sales YTD (Gross sales less fall throughs) running 21% ahead of 2024, 38% ahead of 2023 and 23% above the 2017–19 average.
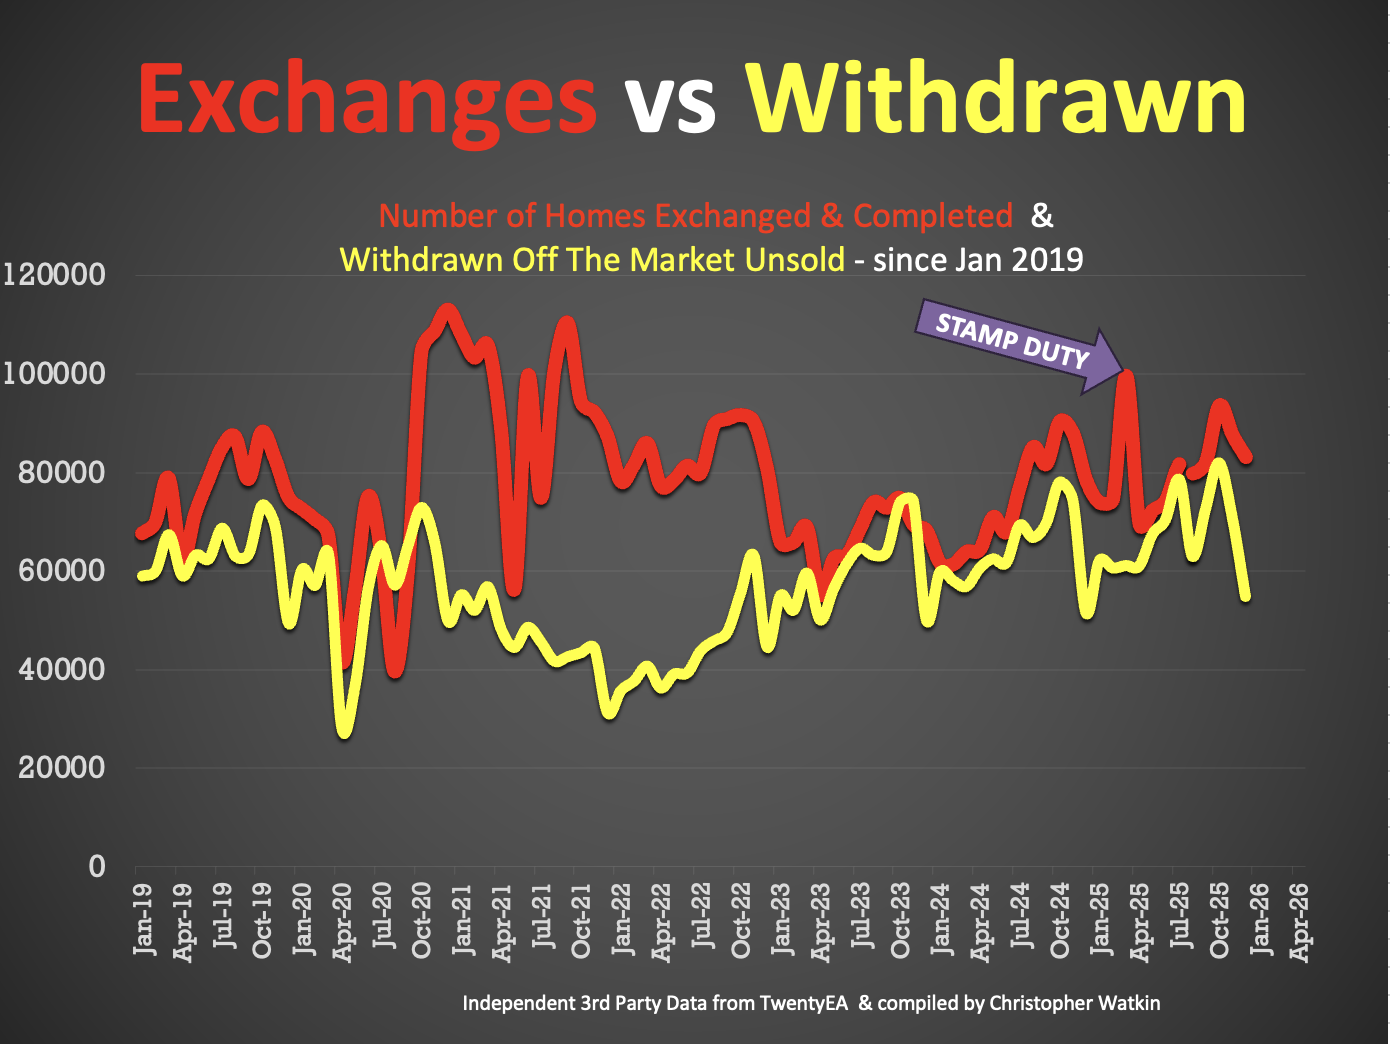
🟩 Overvaluing – Awful
48.4% of the homes that left UK Estate Agents books in January were withdrawn unsold. Main cause – blatant overvaluing supported by long sole agency agreements of 20+ weeks. Discussed in greater length in the YouTube video.
Detailed Breakdown …
✅ New Listings
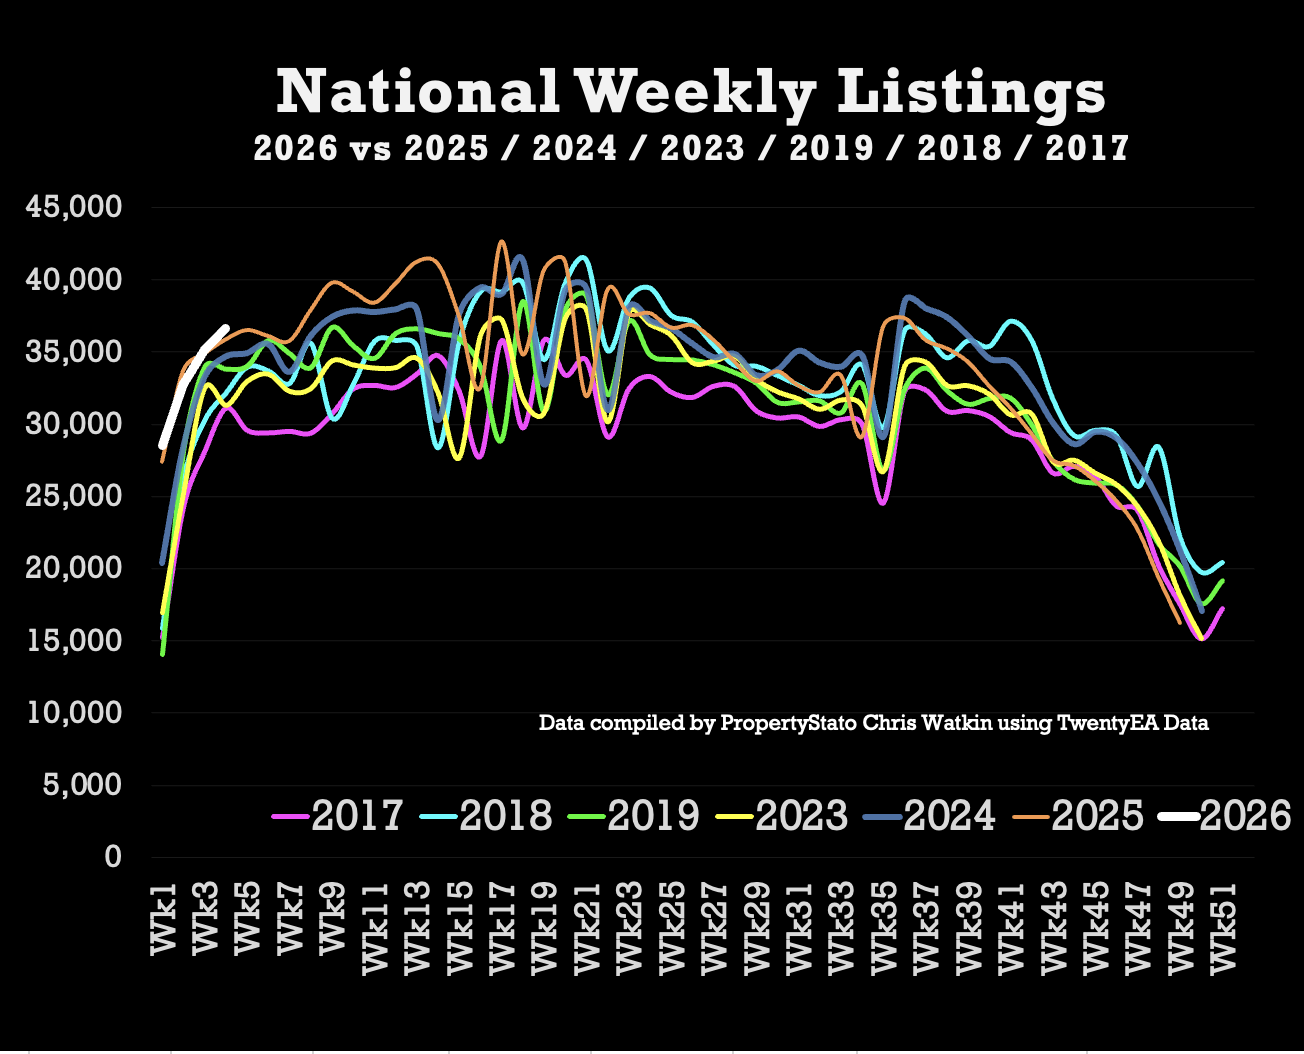
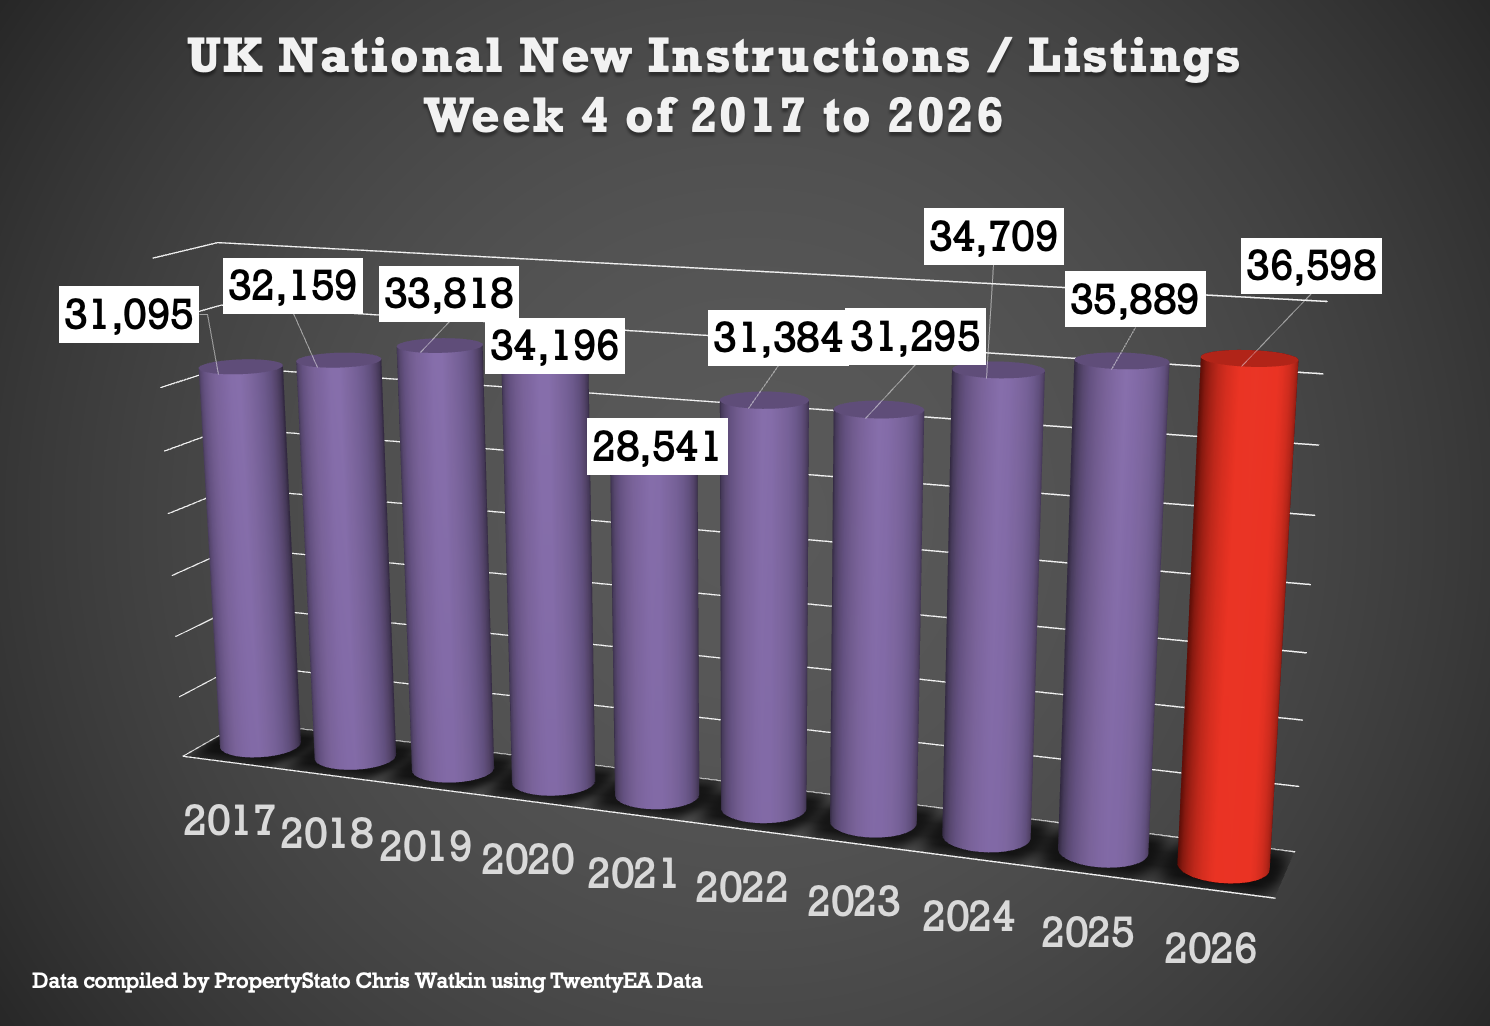
+ 36.6k new properties came onto market this week in week 4, up as expected from 35.2k last week.
+ 2025 weekly average: 30.6k.
+ 10-year week 34average : 33k
+ Year-to-date (YTD): 133.1k new listings, 0.1% above than 2025 YTD (132k), 13.9% above 2024 YTD (116.8k) and 27.5% above the 2017–19 average (104.4k).
✅ Price Reductions
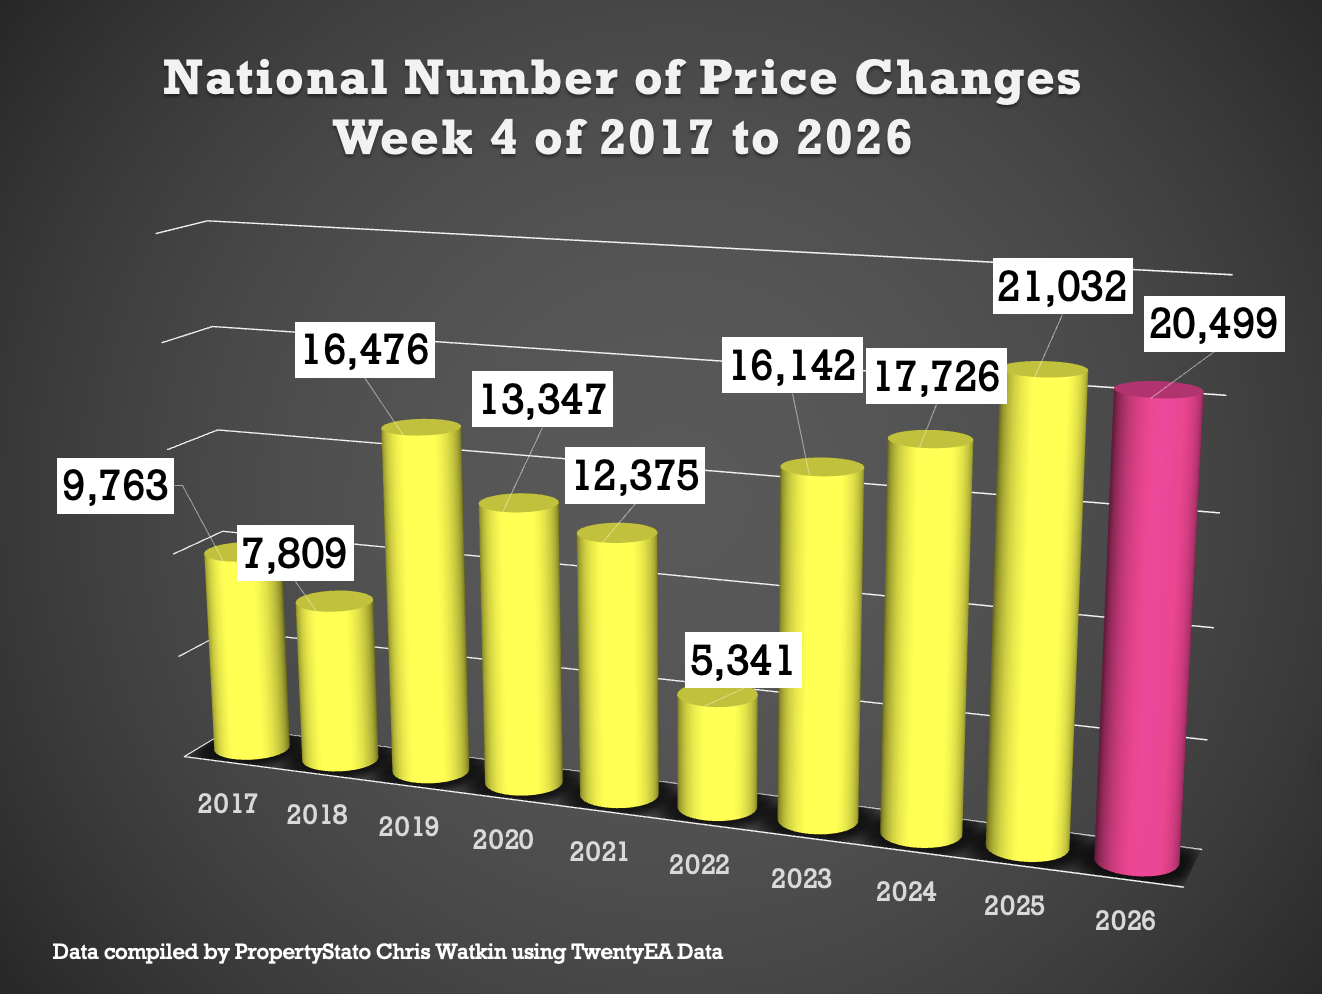
+ 20.5k reductions this week
+ 12.2% of resi homes for sale were reduced in January. Compared to Dec 7.6%, Nov 8.8%, Oct 12.8%, Sept 14.1%. Jan 25 – 12.8%. Jan 24 – 11.1%
+ 2025 average was 12.8%, versus the five-year long-term average of 10.74%.
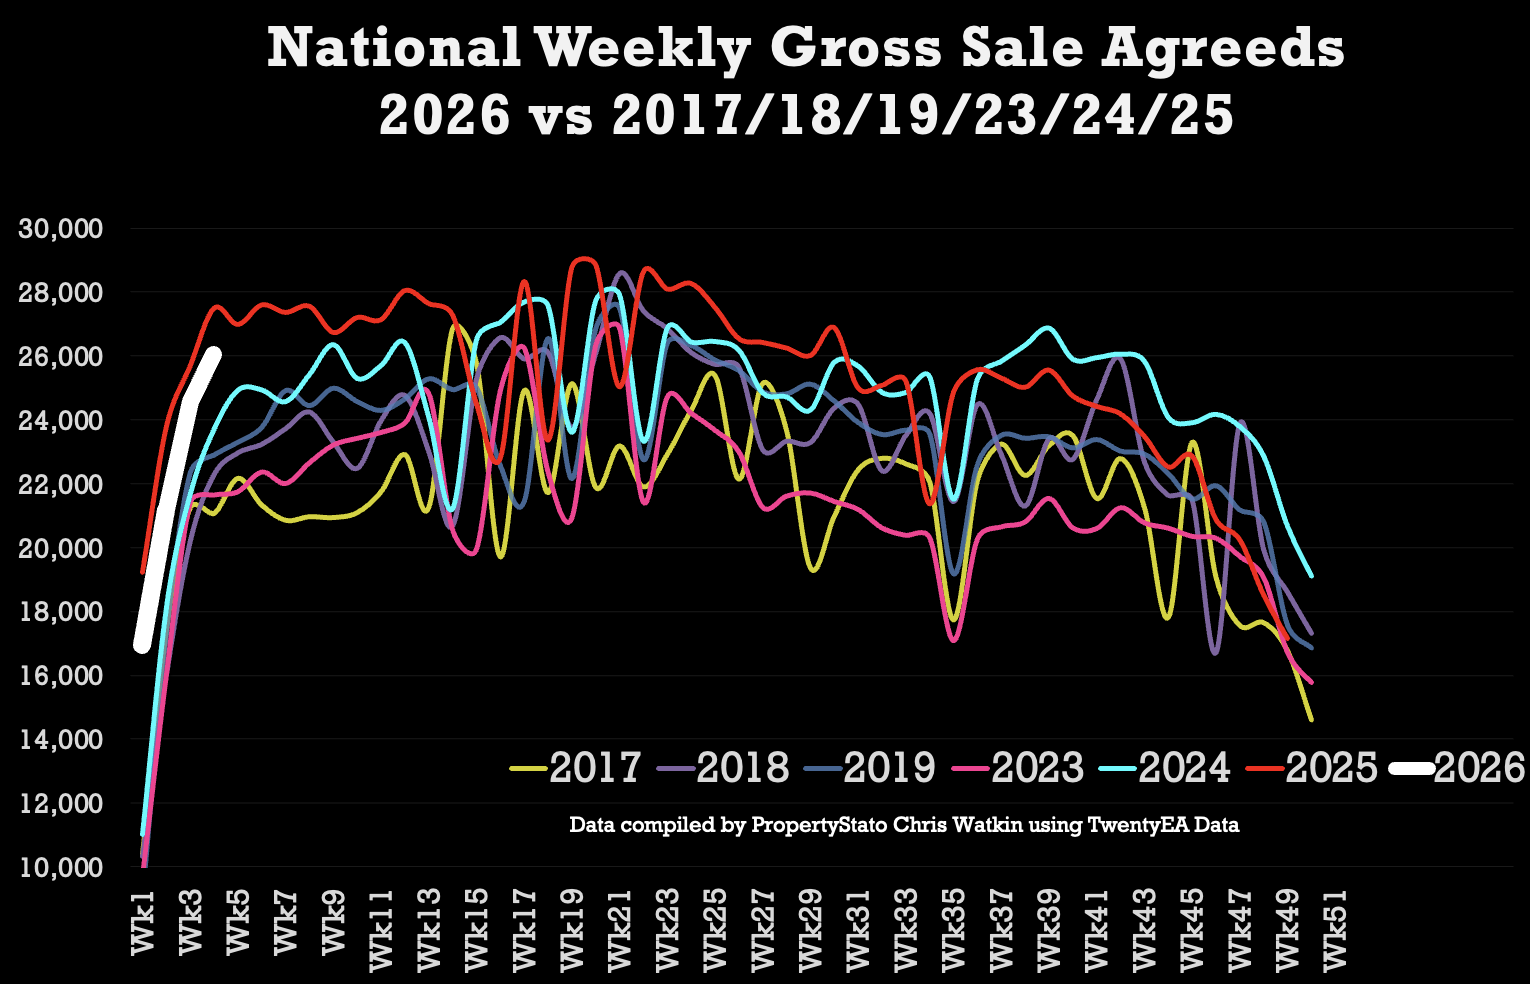
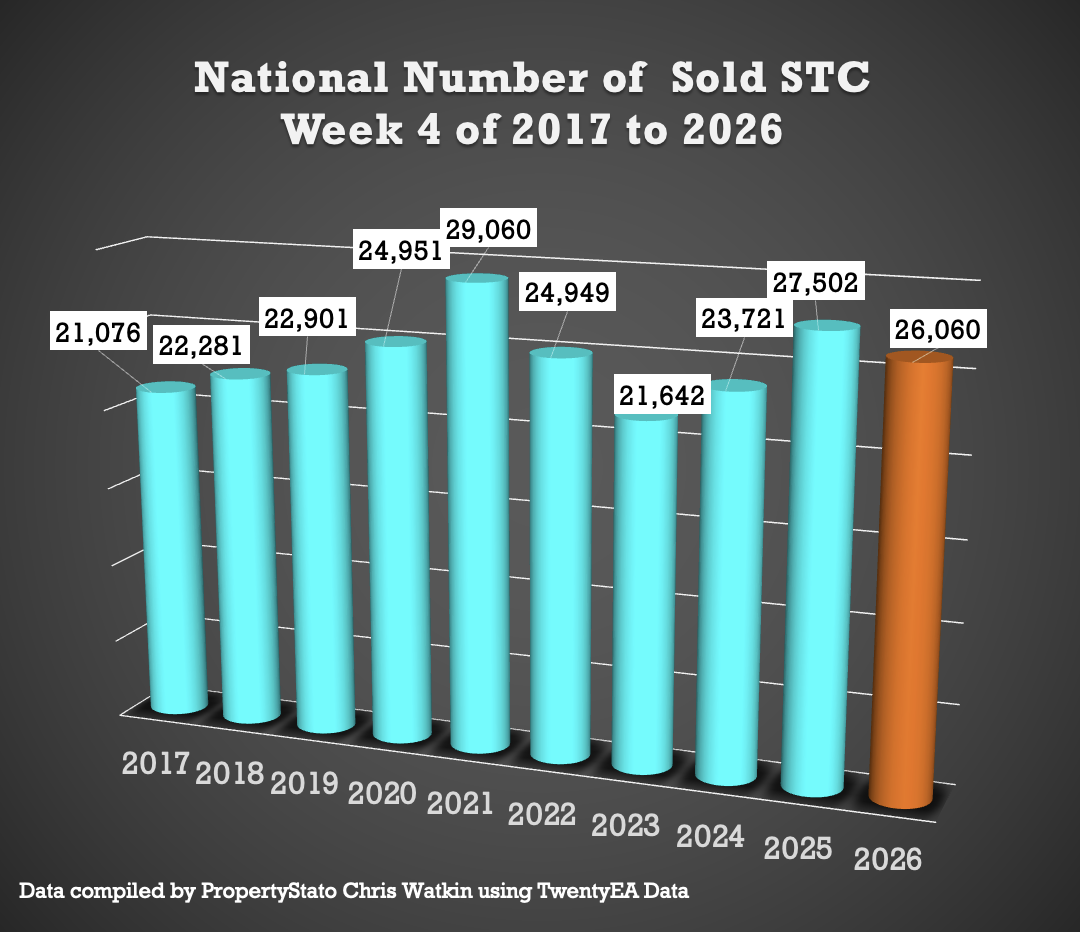
✅ Sales Agreed
+ 26.1k homes sold stc this week 4, up from 24.6k last week.
+ Week 4 average (for last 10 years) : 24.4k
+ 2026 weekly average : 22.2k.
+ YTD: 88.8k gross sales, which is 7.7% behind Week 4 YTD of 2025 (96.2k), yet 19.1% ahead of wk.4 2024 (k) and 26.6% above the 2017–19 average (70.1k).
+ Thoughts – January 2025 was an exceptional month as we had the stamp duty deadline for April 2025 – here it was a good sales month. To be ahead of 2024 and pre Covid years by such an amount is good to see.
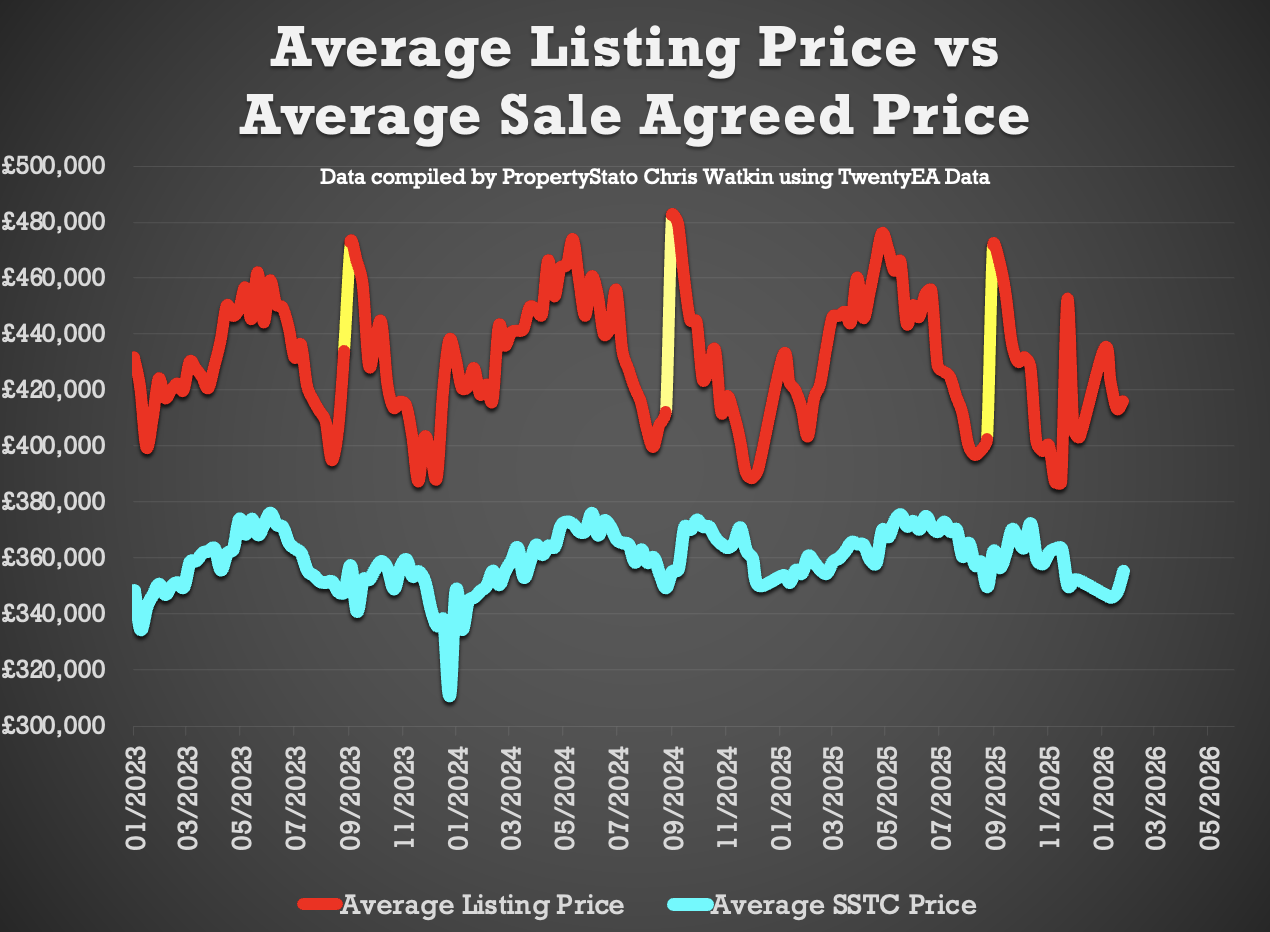
✅ Price Diff between Listings & Sales
+ Average Asking Price of listings last week £416k
+ Average asking price of Sales Agreed (SSTC)last week was £355k
+ A 17.1% difference (long term 10 year average is 16% to 17%).
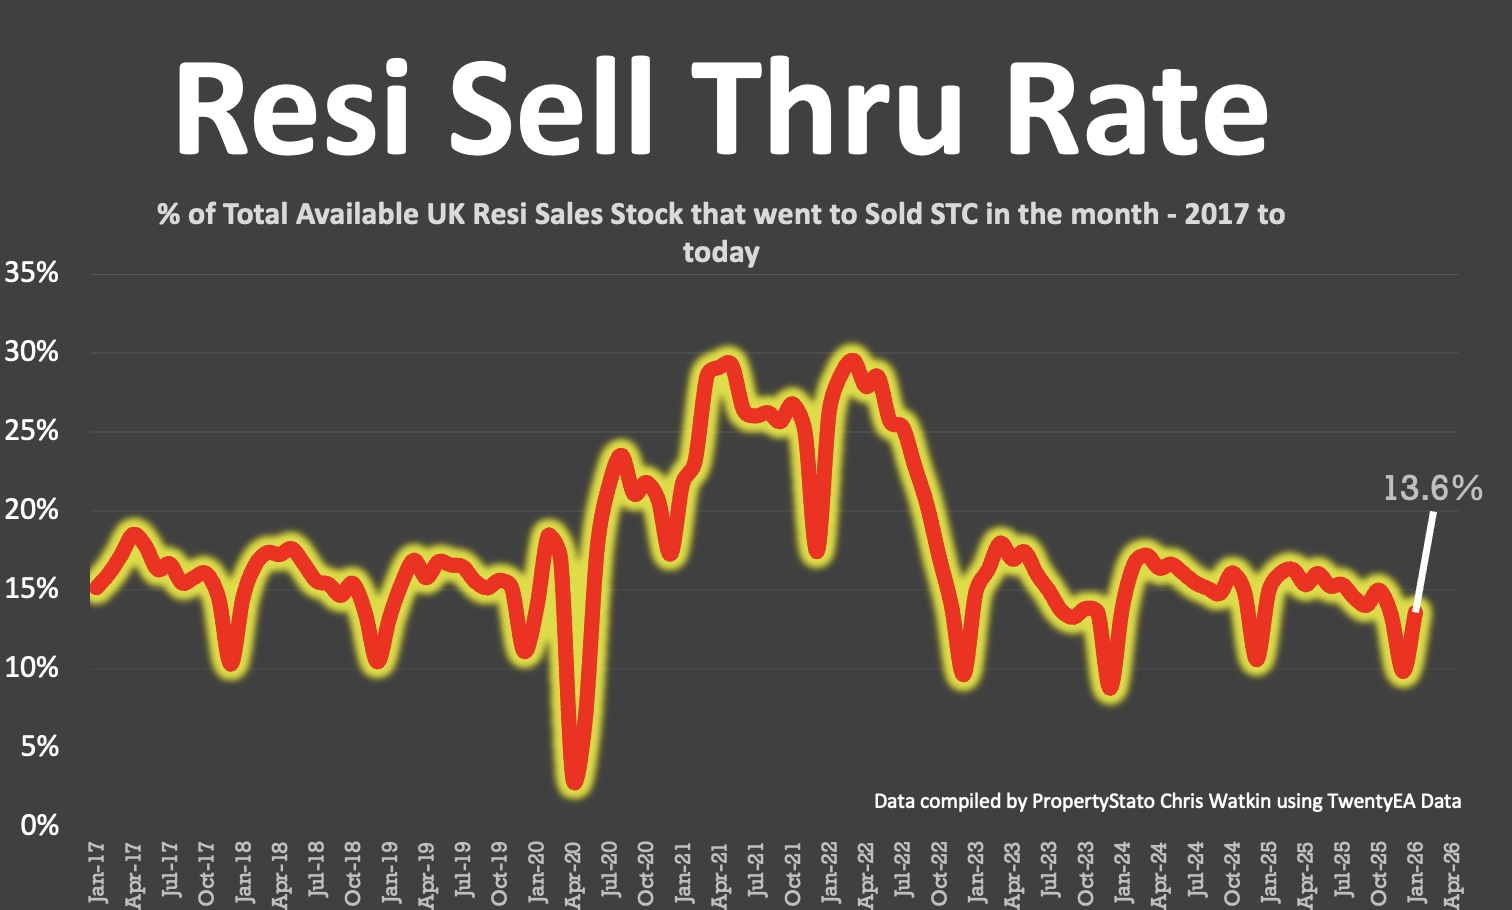
✅ Sell-Through Rate
+ 13.6% of homes on agents’ books went SSTC in January ’26. (Jan ’25 – 15% / Jan ’24 – 13.9%)
+ Pre-Covid average: 15.5%.
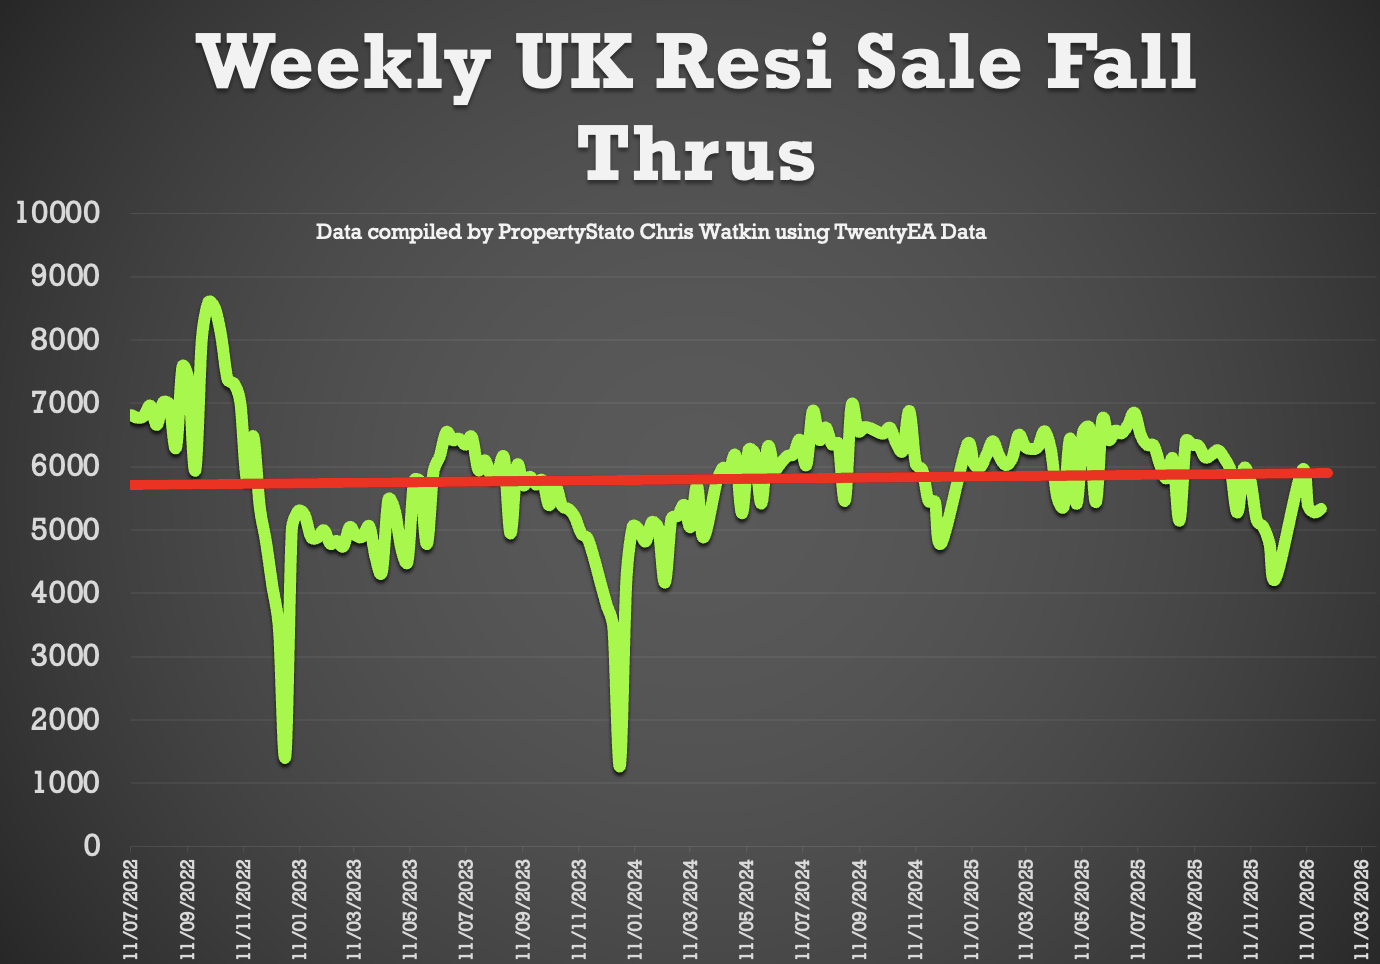
✅ Fall-Throughs
+ 5,336 fall-throughs last week (pipeline of 482k home Sold STC).
+ Weekly average for 2025: 6,100.
+ Fall-through rate: 20.5%, slightly down from 21.5% last week.
+ Long-term average: 24.2% (post-Truss chaos saw levels exceed 40%).
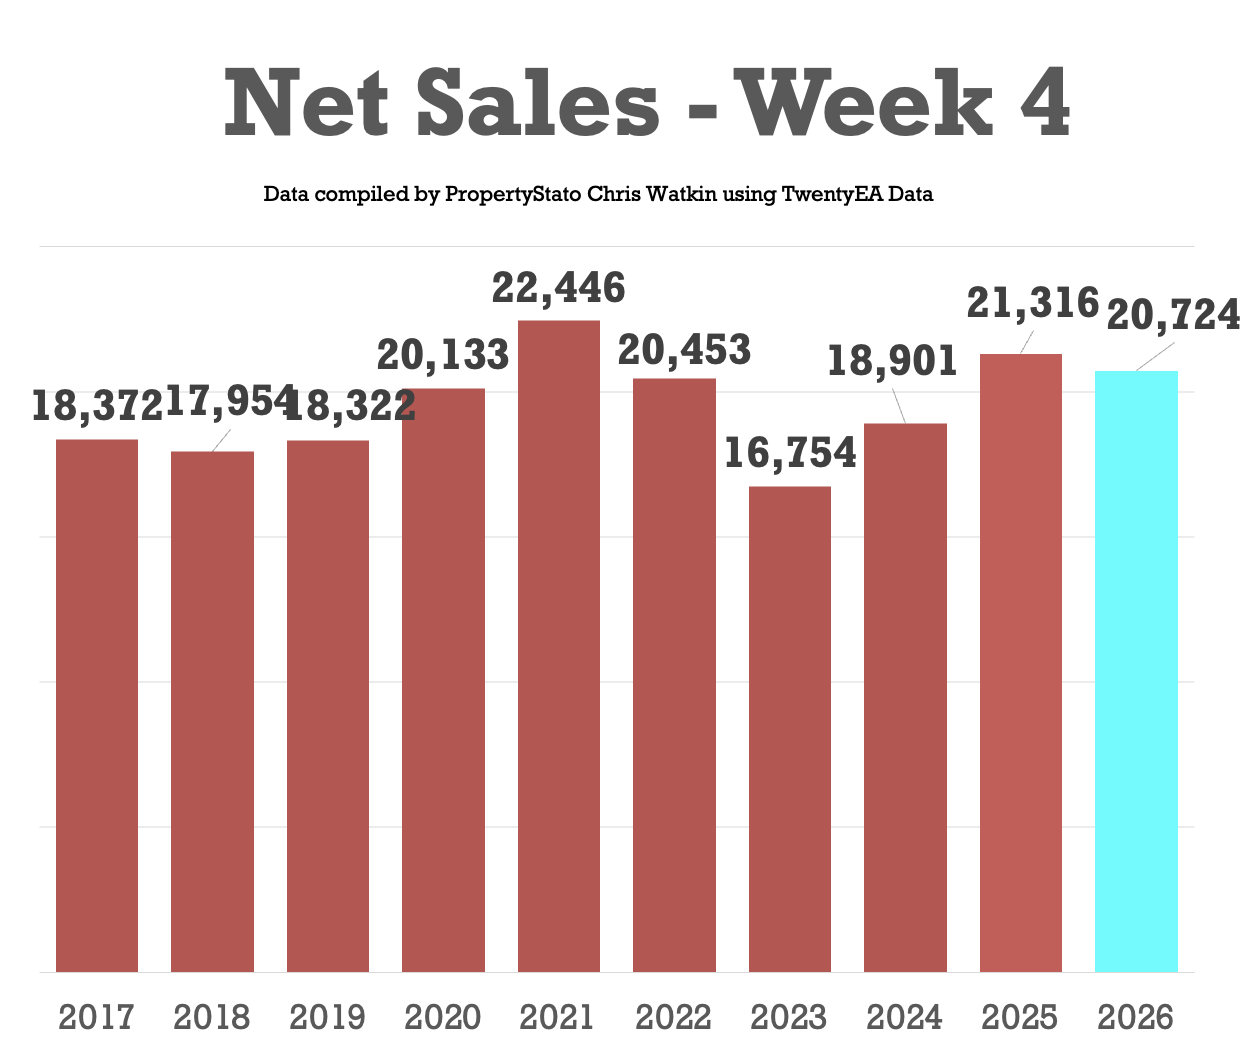
✅ Net Sales
+ Big jump in net sales from last week. 20.7k, up from 19.3k last week and 15.8k the week before).
+ Ten-year Week 3 average: 19.5k.
+ Weekly average for 2026: 16.7k.
+ Weekly average for the whole of 2025: 19.2k.
+ YTD: 66.8k, which is 6.7% behind Wk.4 of 2025 (71.6k), 21% ahead of wk4 2024 (55.4k) and 23% ahead of wk4 2017–19 (54.2k).
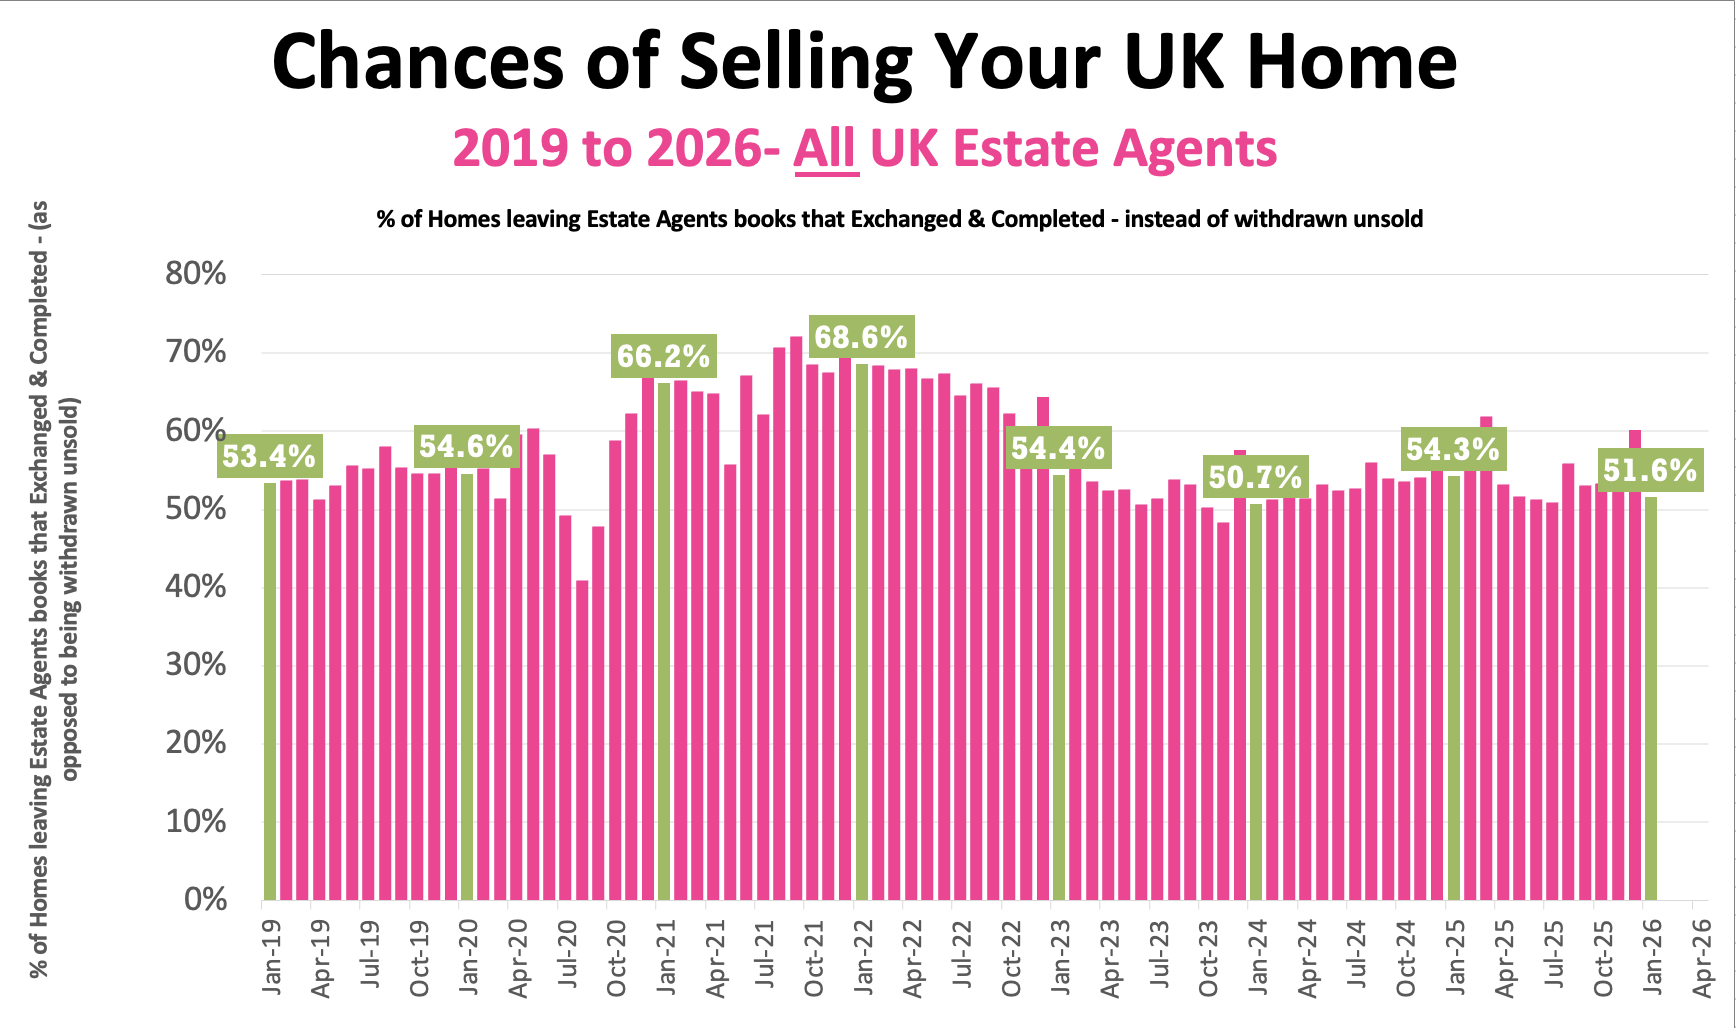
✅ Probability of Selling (% that Exchange vs withdrawal)
+ Jan ’26 Stats : 51.6% of homes that left agents’ books exchanged & completed in Jan. (Note this figure will change throughout the month as more Feb stats come in).
+ December 60.2% / November 55.2% / October 53.3% / September: 53.1% / August :55.8% / July: 50.9% / June: 51.3% / May: 51.7% / April: 53.2%.
+ Jan 25: 54.3% / Jan 24: 50.7% / Jan 23: 54.4% / Jan 22: 68.6%
Local focus this week
Walthamstow
Comments are closed.