

 Myself and Toby Martin from We Are Unchained review activity in Week 48 of the UK property market, covering the seven days to Sunday 7 December 2025.
✅ New Listings
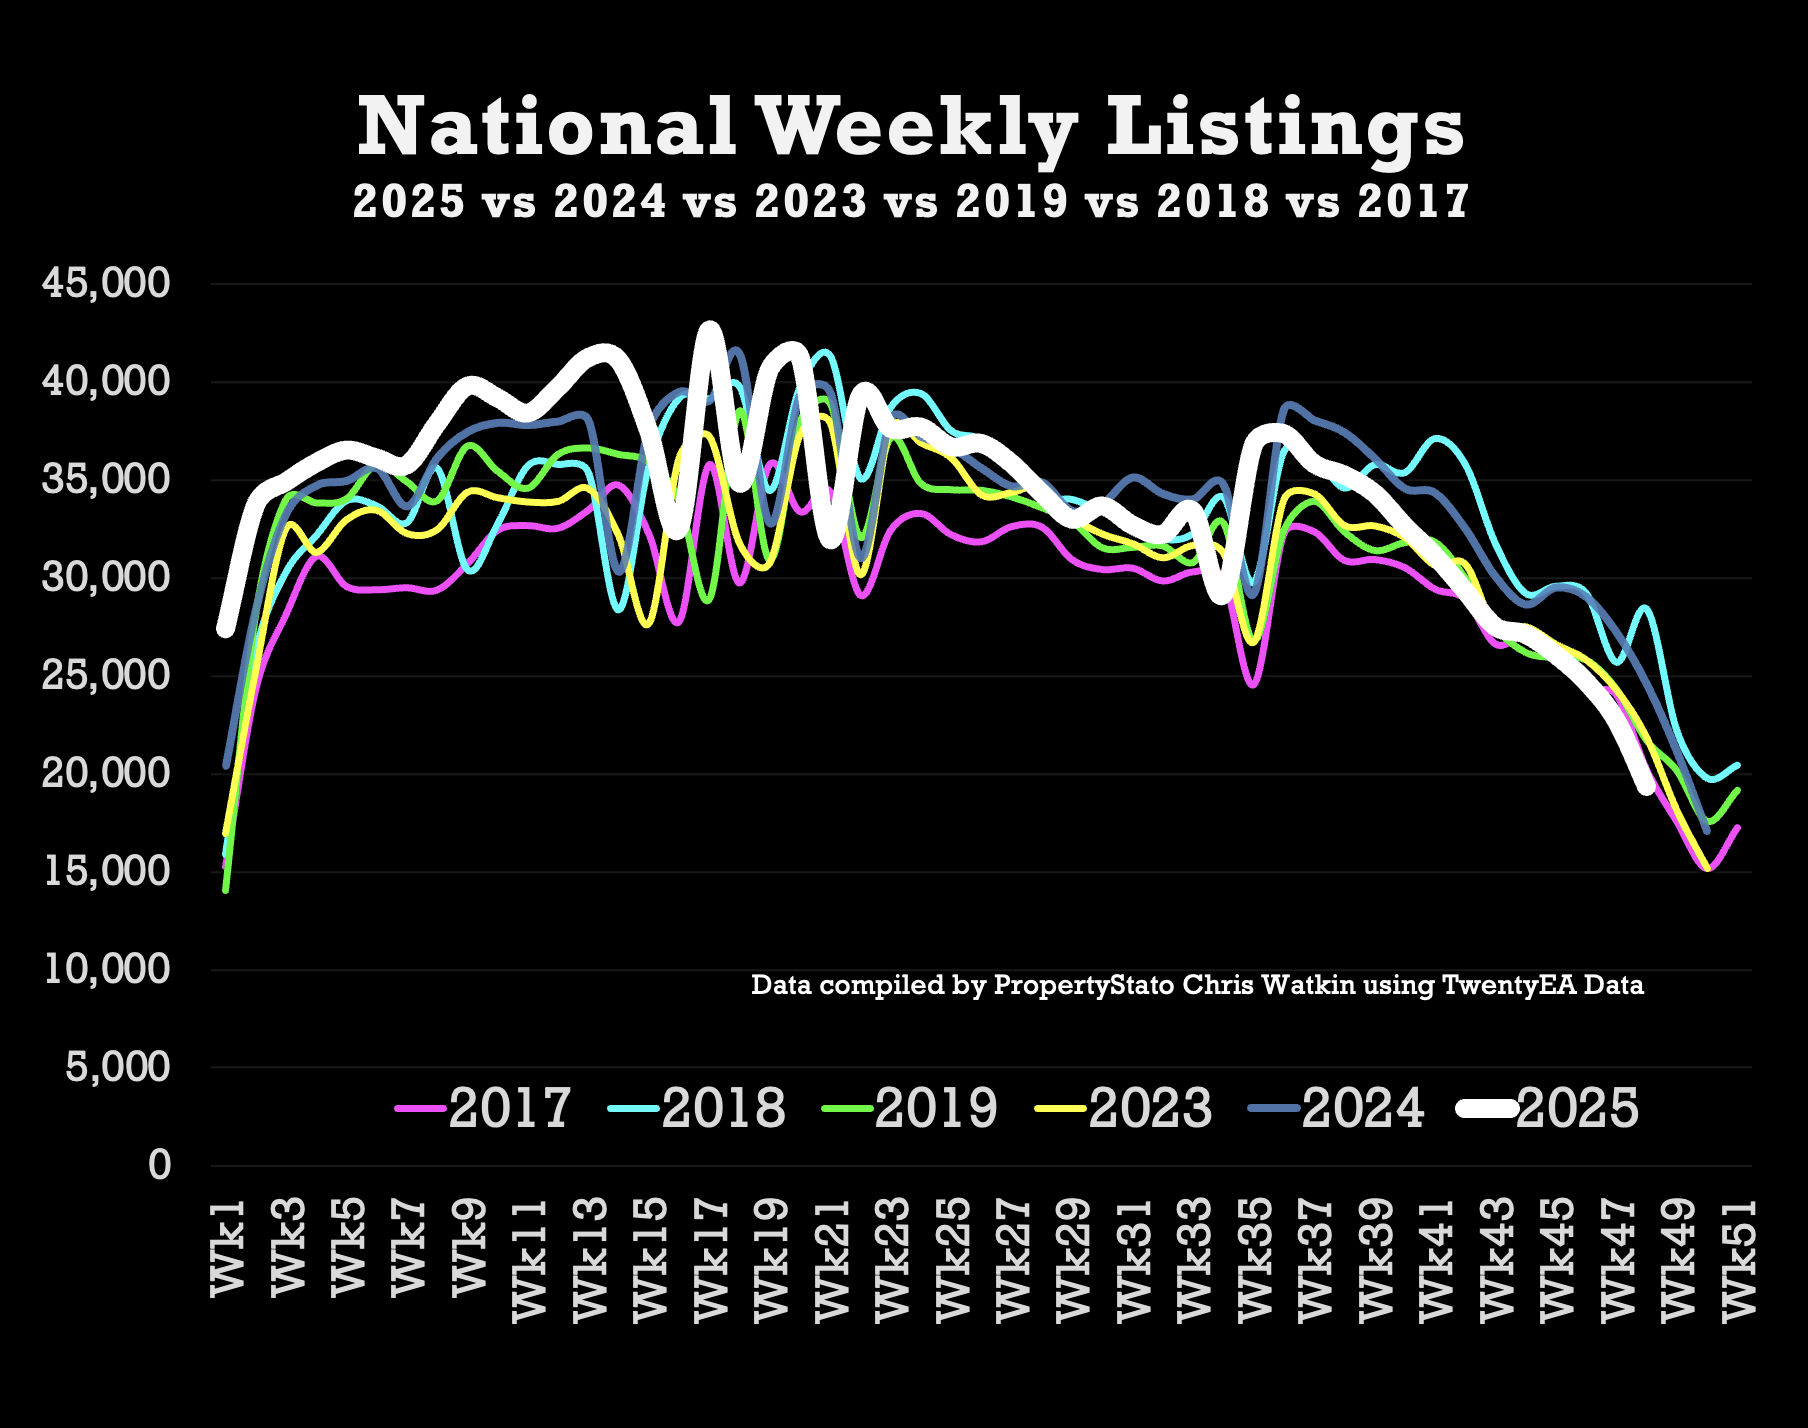
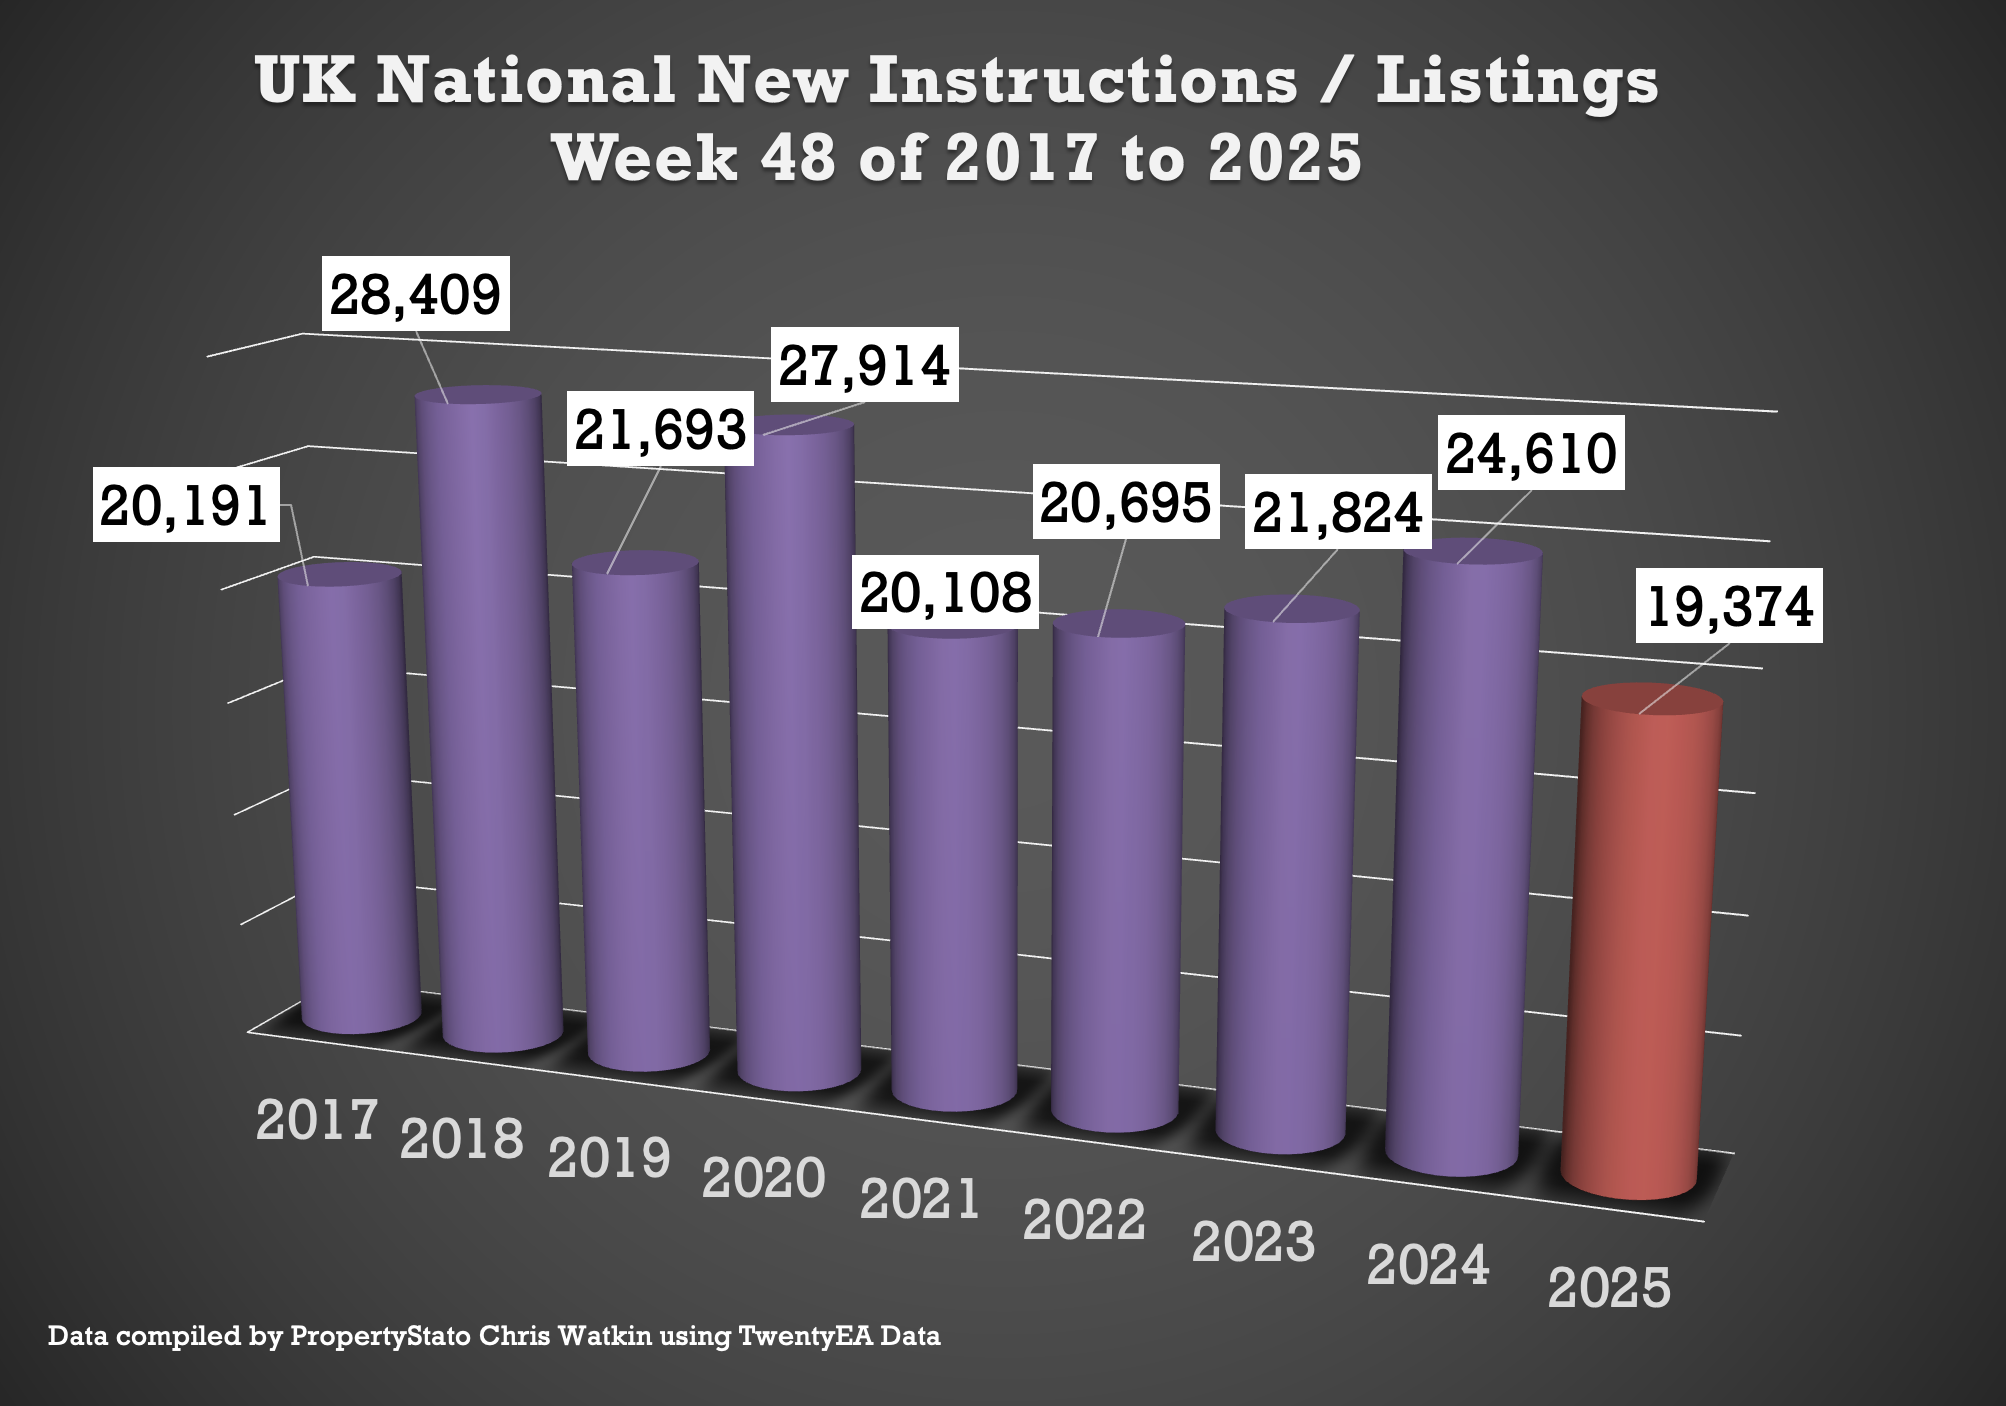
+ 19.4k new properties came to market this week, down as expected from 22.7k last week.
+ 2025 weekly average: 34.4k.
+ 9-year week 48 average : 22.8k
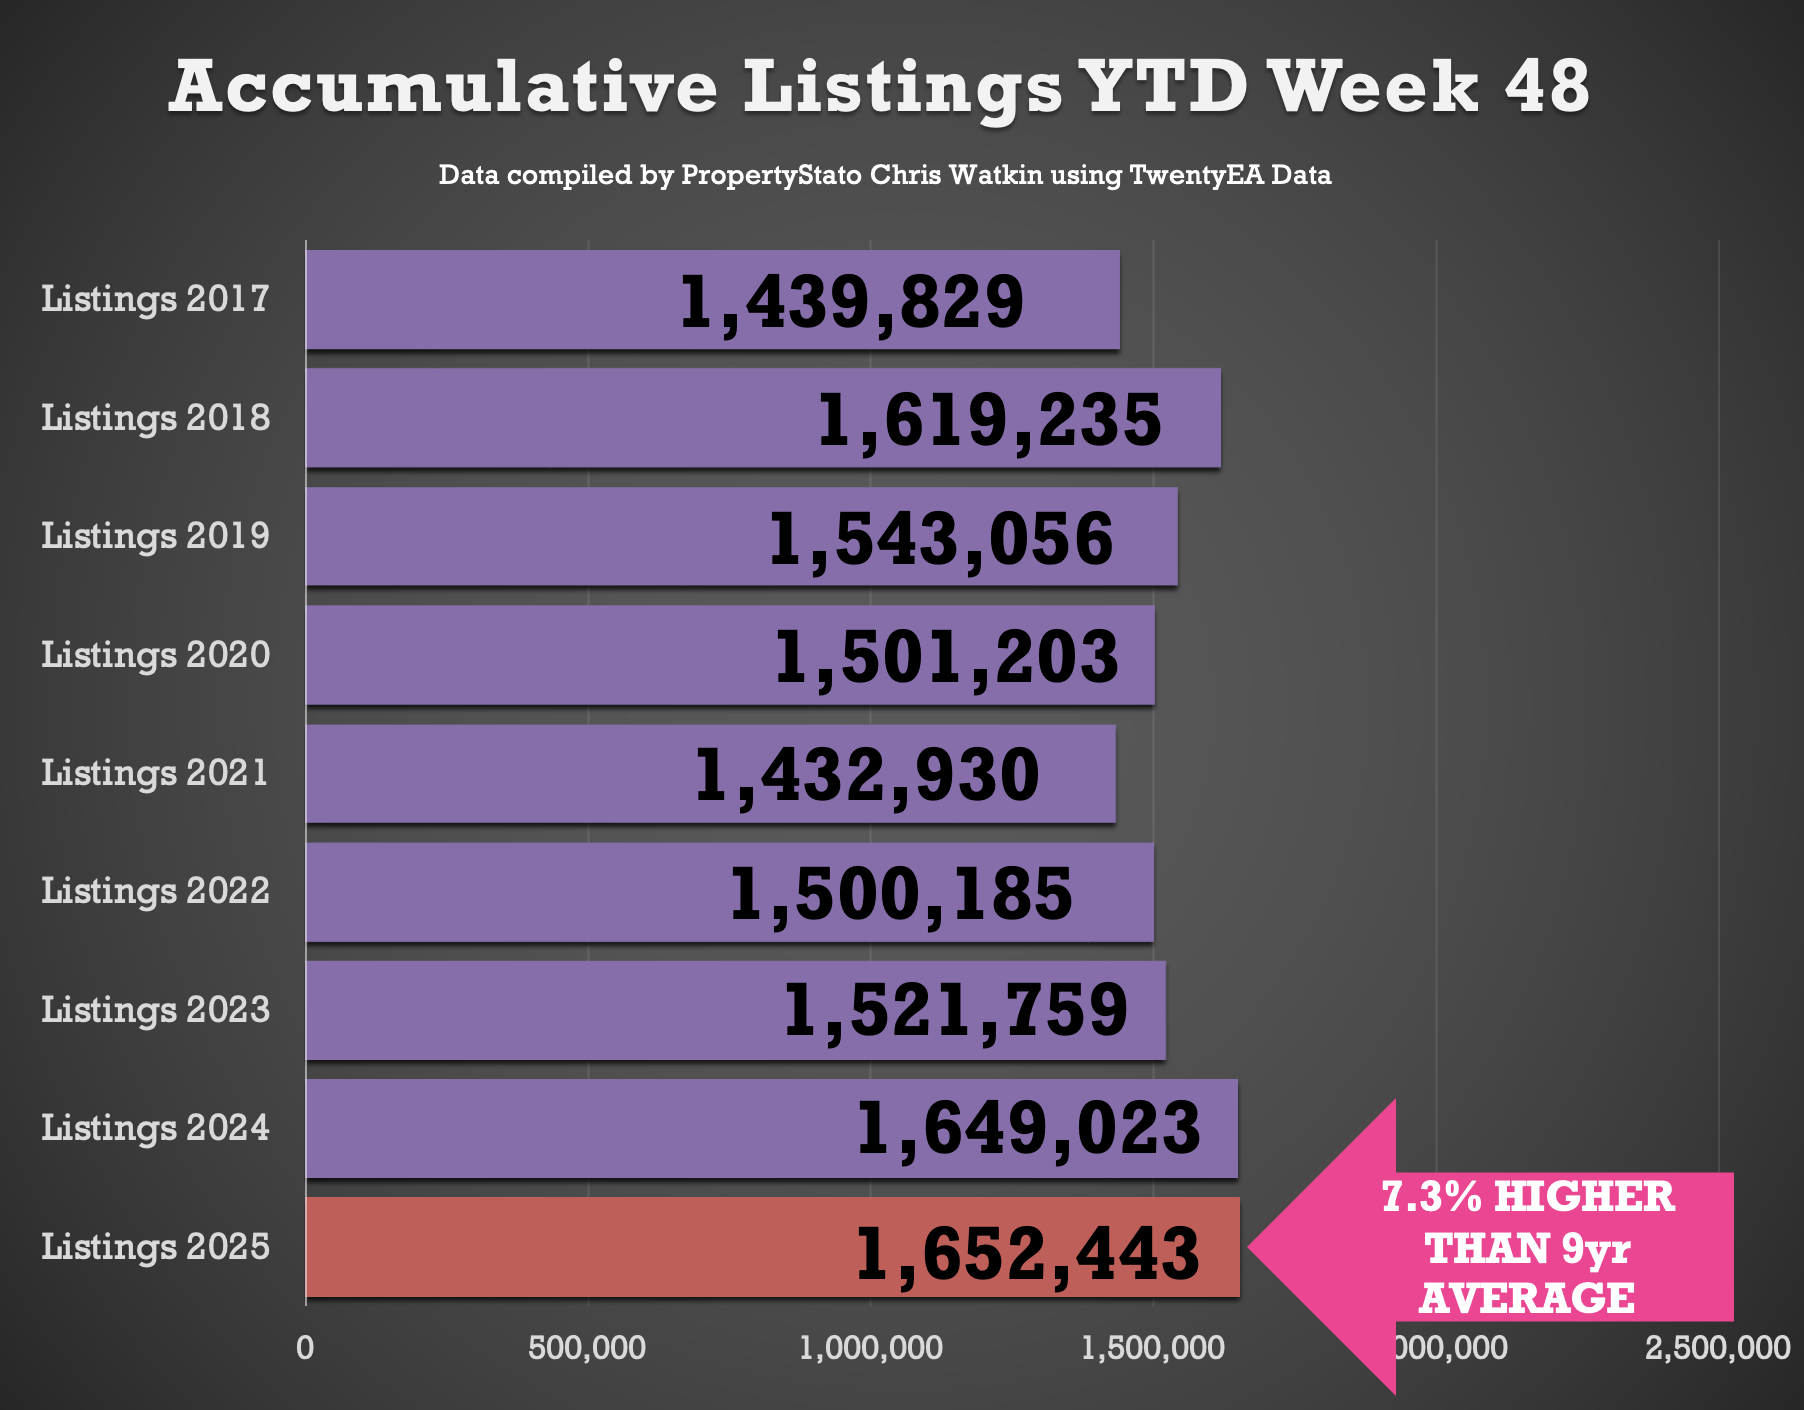
+ Year-to-date (YTD): 1.652m new listings, 0.2% higher than 2024 YTD (1.649m) and 7.7% above the 2017–19 average (1.534m).
✅ Price Reductions
+ 12.8k reductions this week, lower than last week’s at 13.2k (Estate Agents seem to forget they can reduce houses prices after the first week in November!). 23.2k is the average weekly number of reductions for 2025.
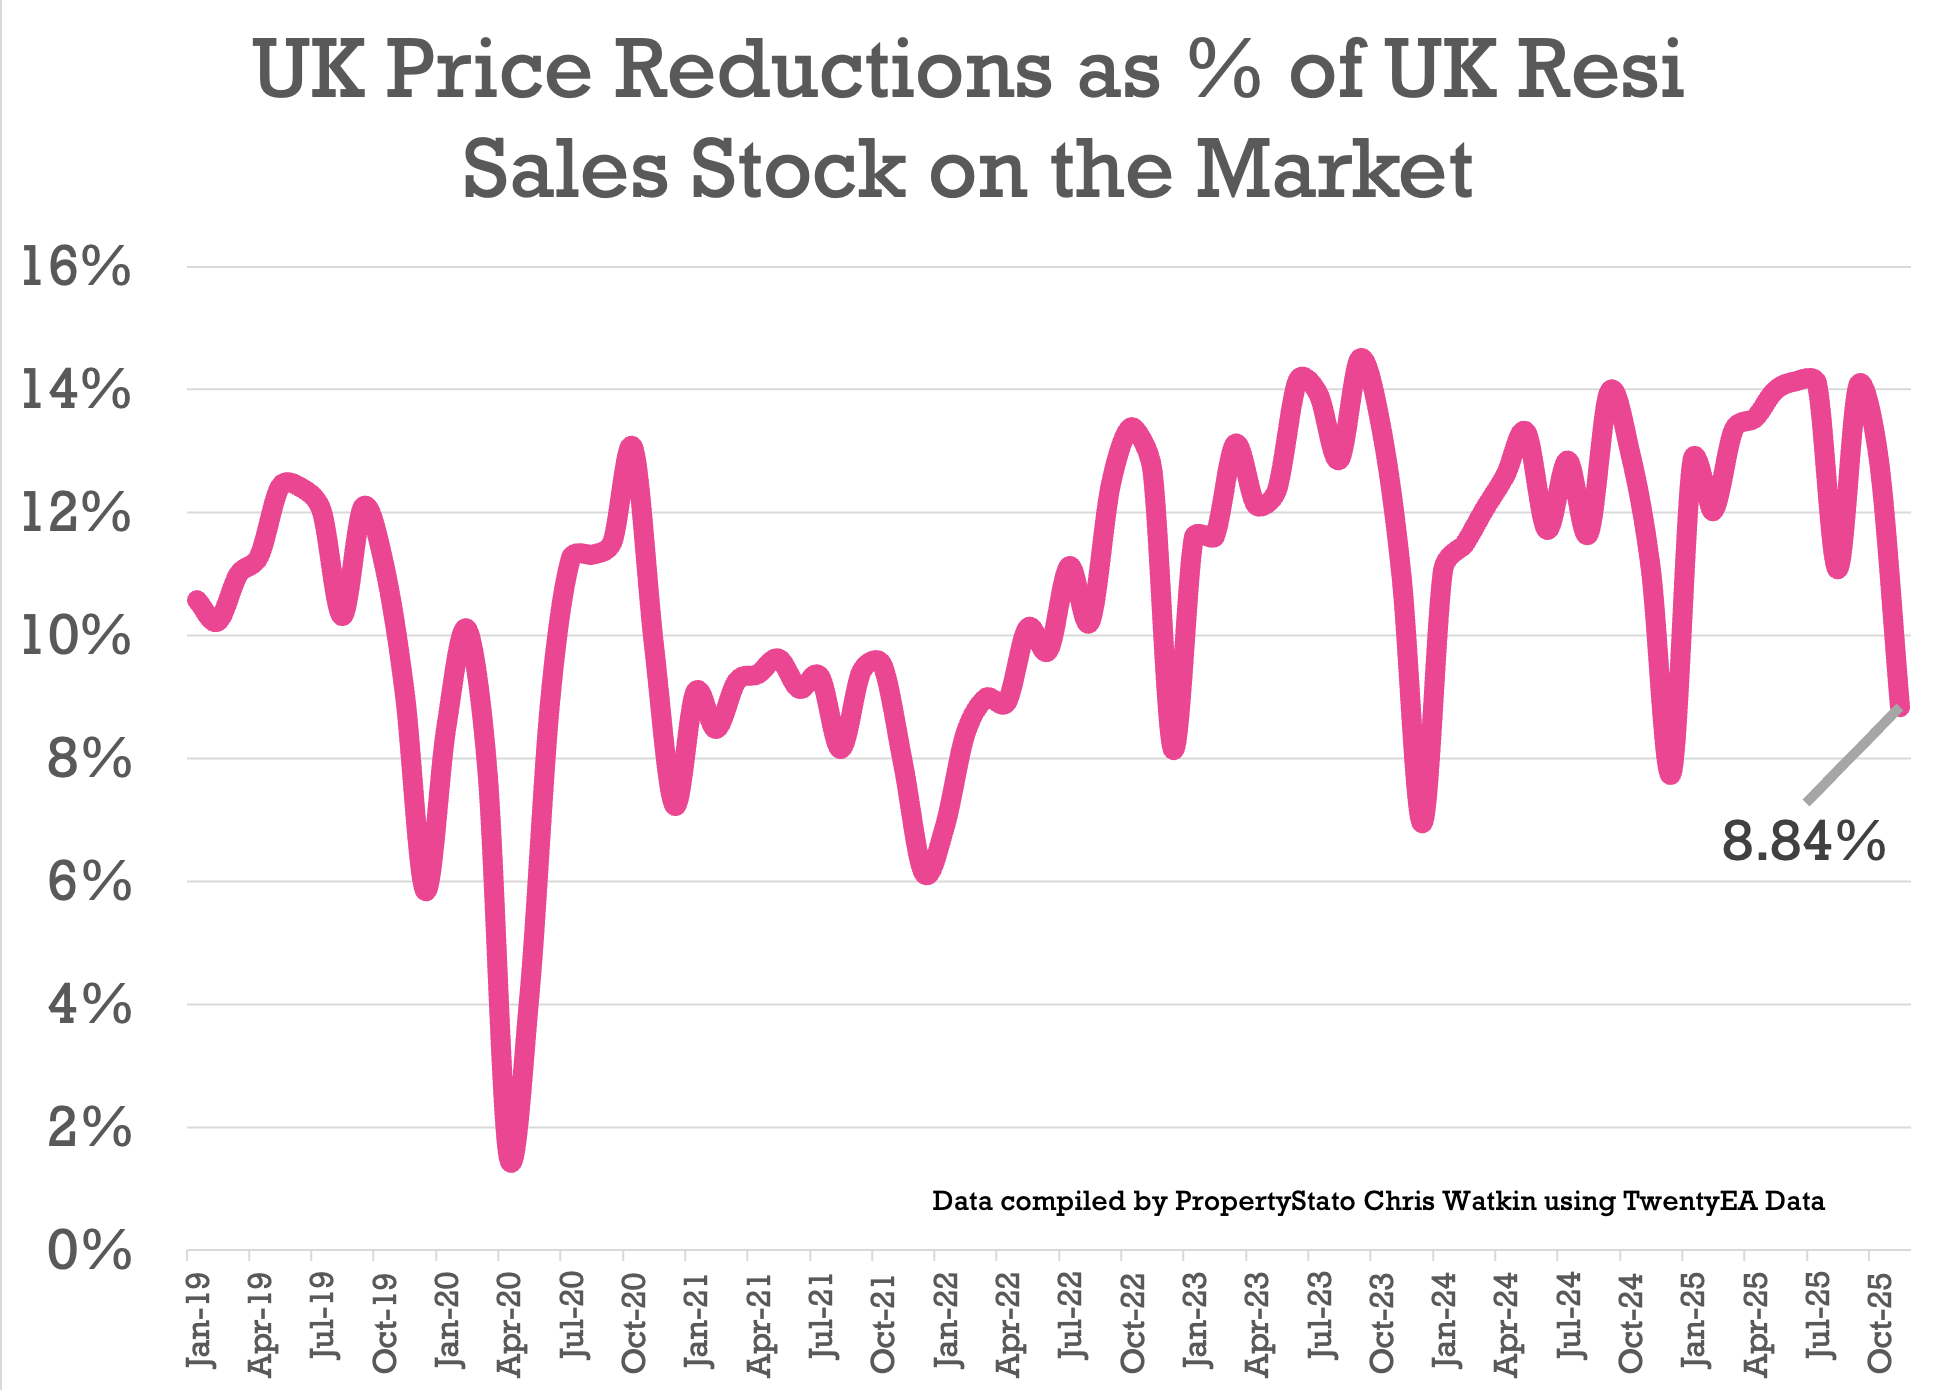
+ 8.8% of resi homes for sale were reduced in November. Compared to Oct 12.8%, Sept 14.1%, August 11.1%, July 14.1% in July and 14% in June.
+ 2025 average still remains at 12.8%, versus the five-year long-term average of 10.74%.
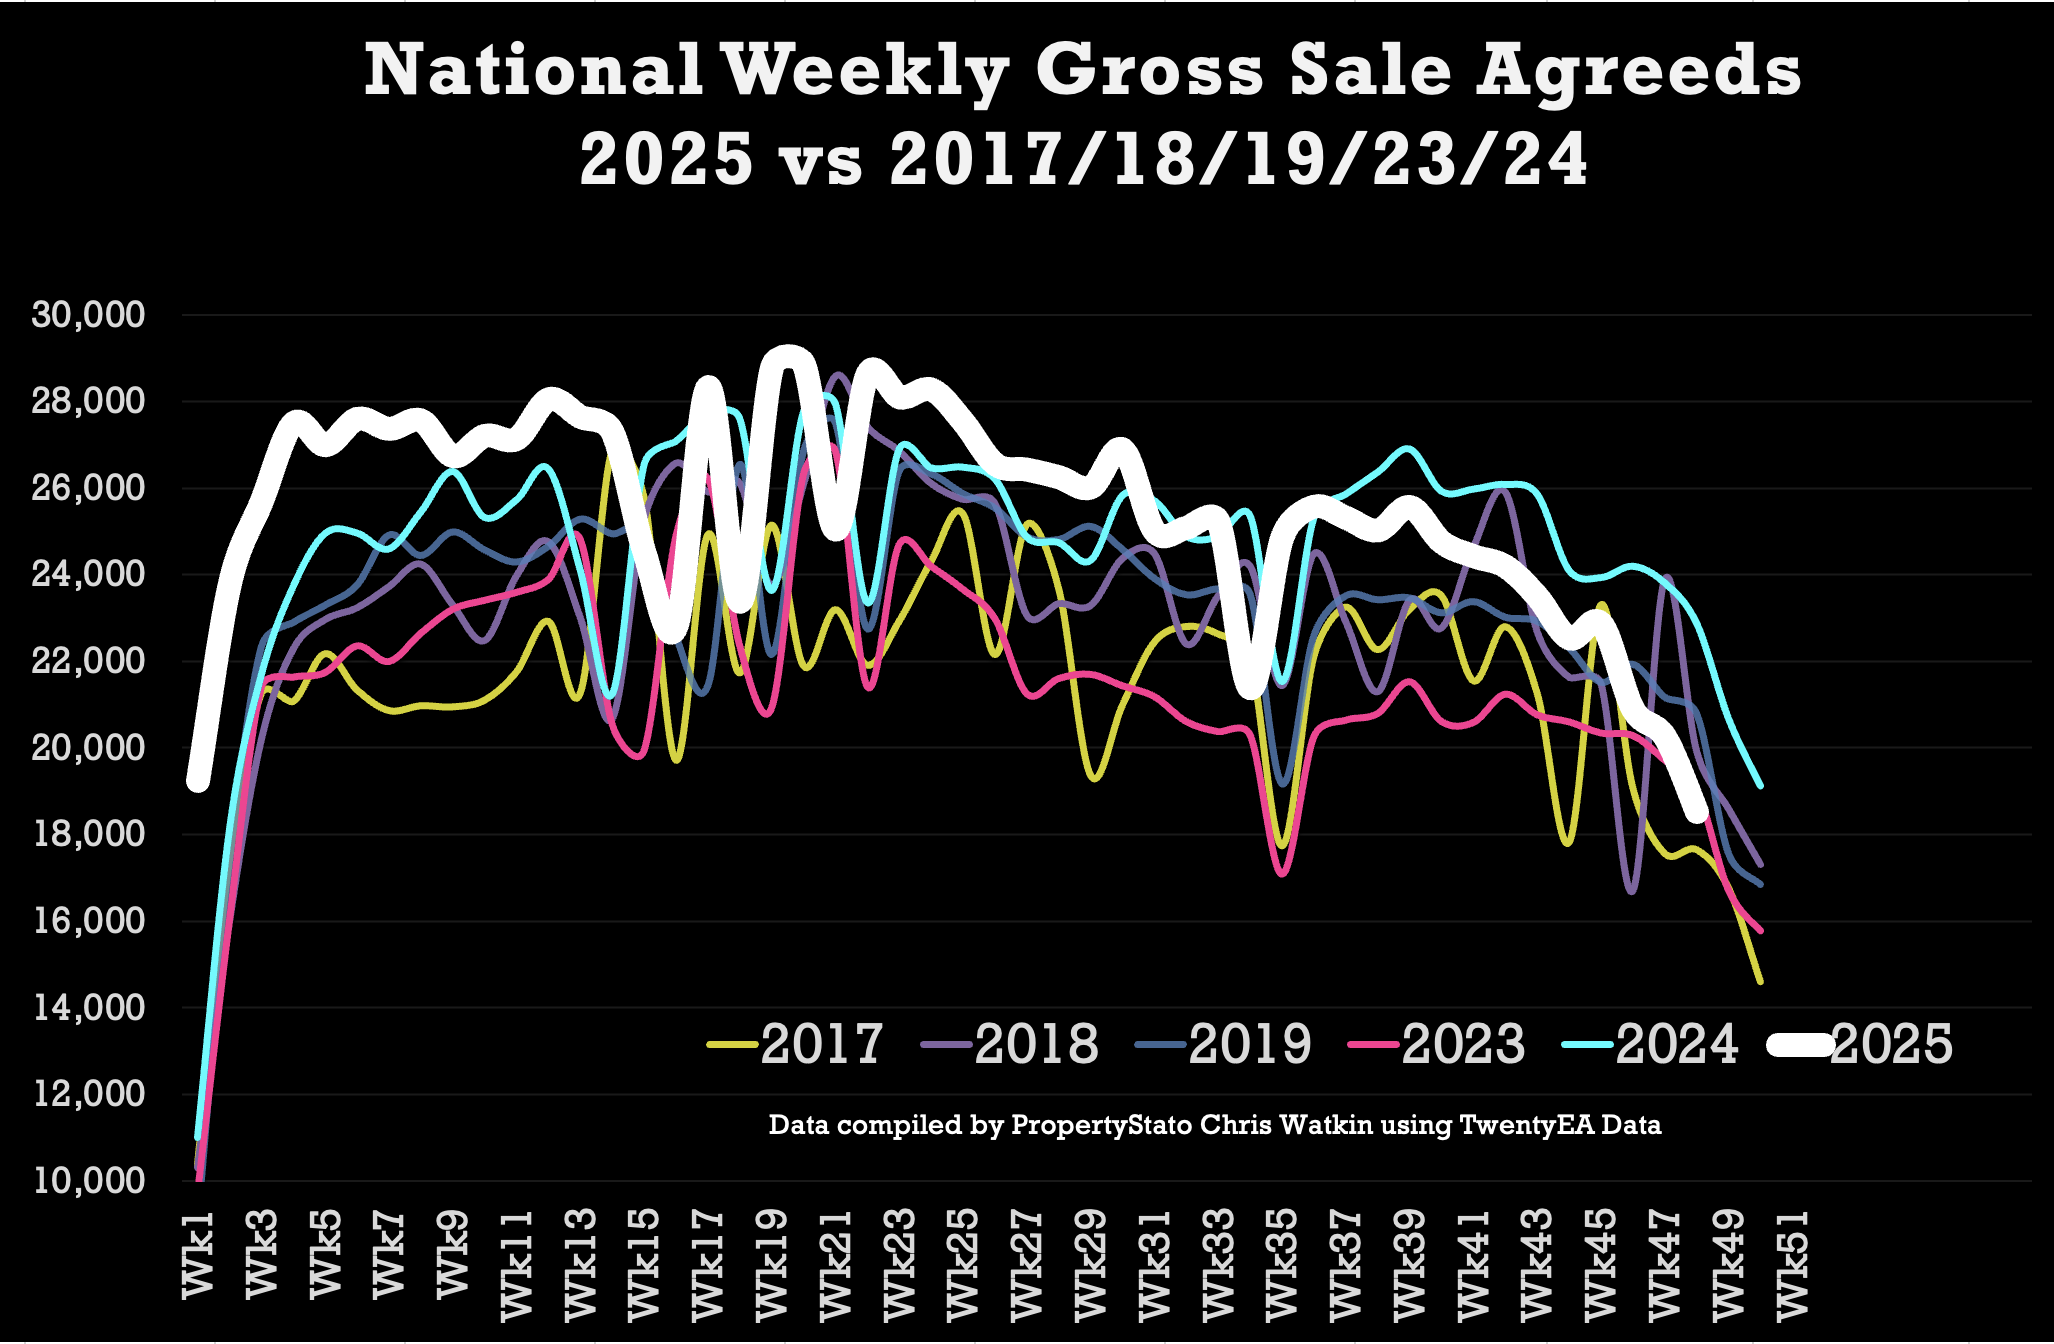
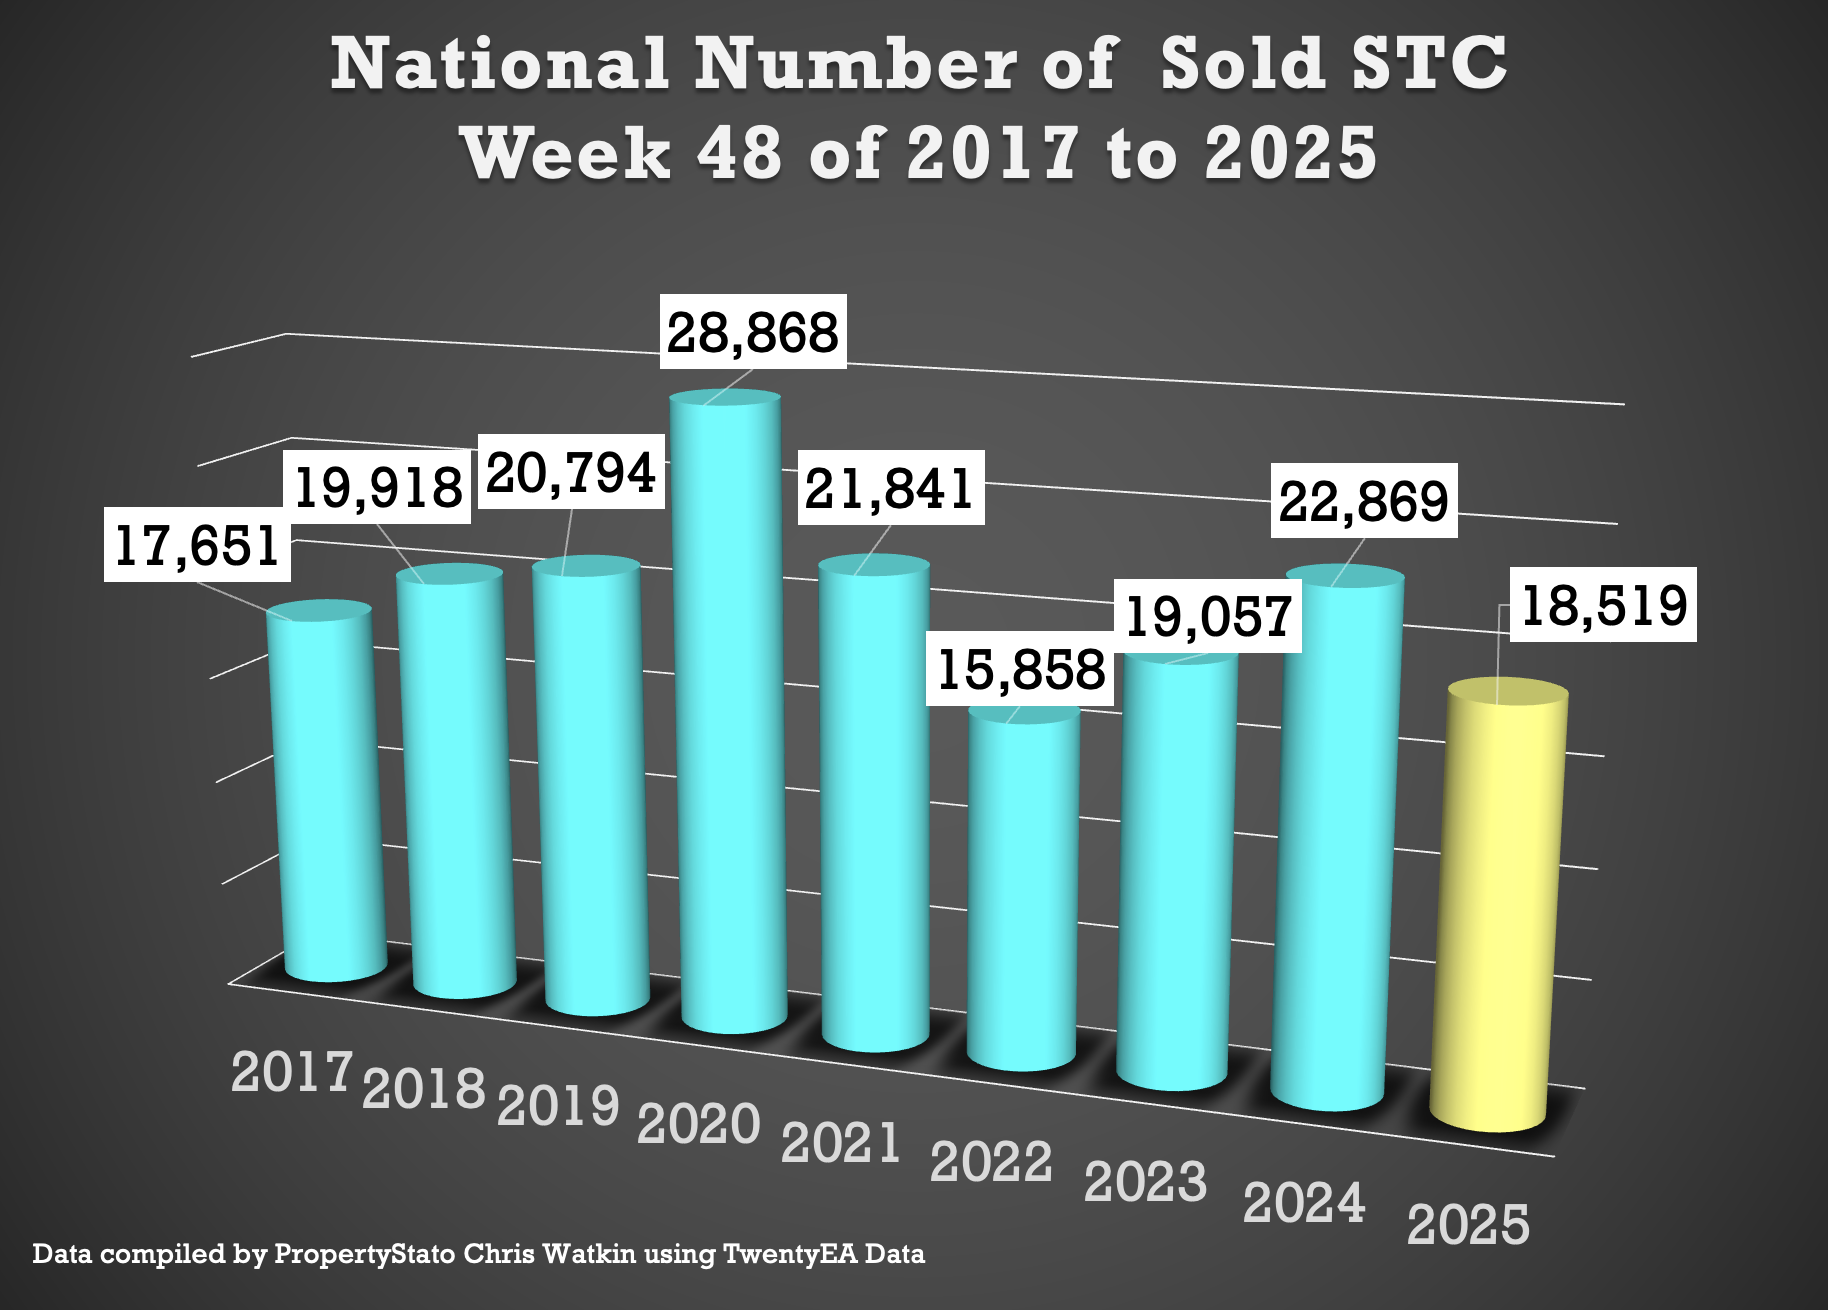
✅ Sales Agreed
+ 18.5k homes sold subject to contract this week, down expectedly from 20.3k last week.
+ Week 48 average (for last 9 years) : 20.6k
+ 2025 weekly average : 25.4k.
+ YTD: 1.221m gross sales, which is 2.6% ahead of 2024 (1.190m) and 11.6% above the 2017–19 average (1.094m).
+ Some will note Gross Sales in Q4 were higher – this was the first time buyers were buying homes to beat the March 2025 stamp duty deadline.
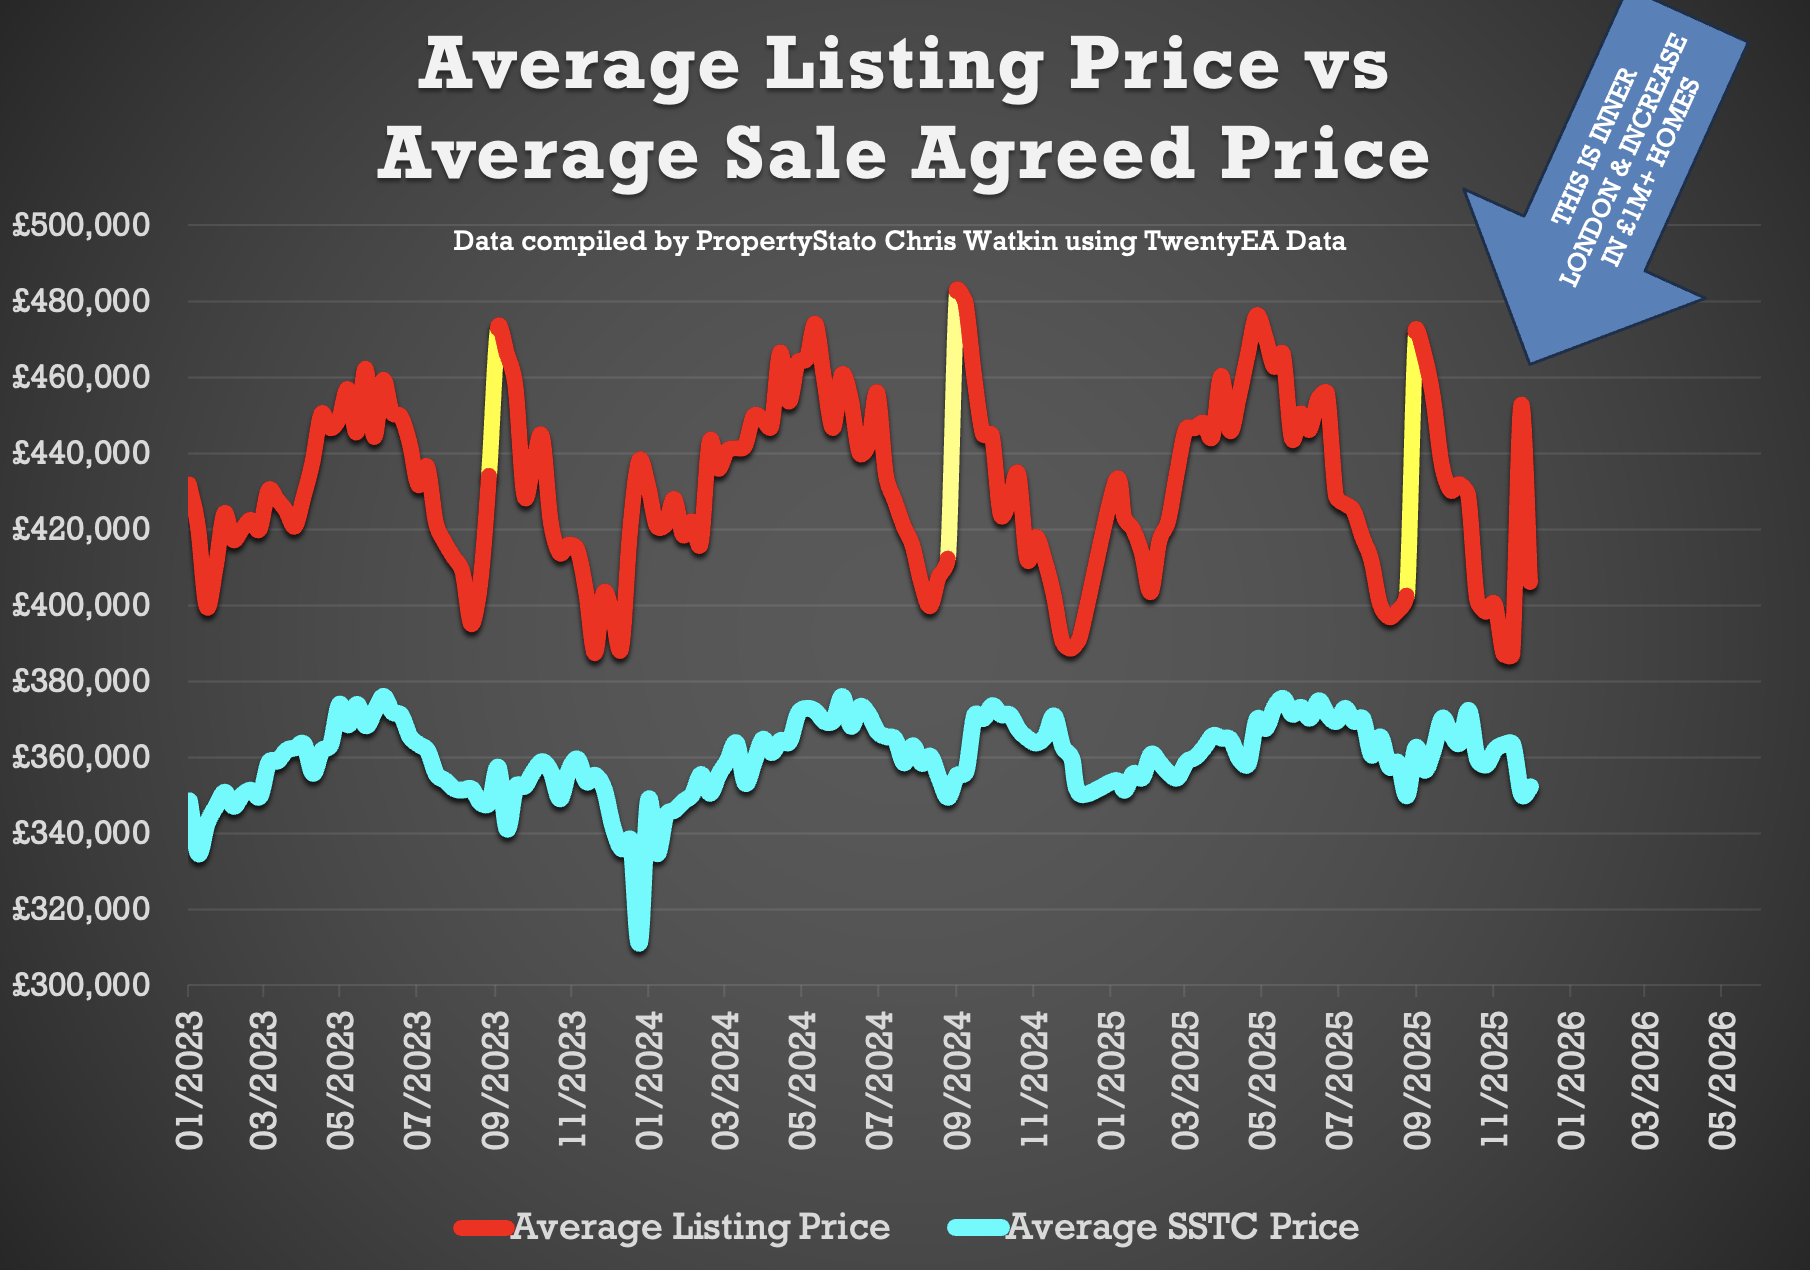
✅ Price Diff between Listings & Sales
+ Average Asking Price of listings last week £406k
+ Average asking price of Sales Agreed (SSTC) last week was £352k
+ A 15.3% difference (long term 9 year average is 16% to 17%).

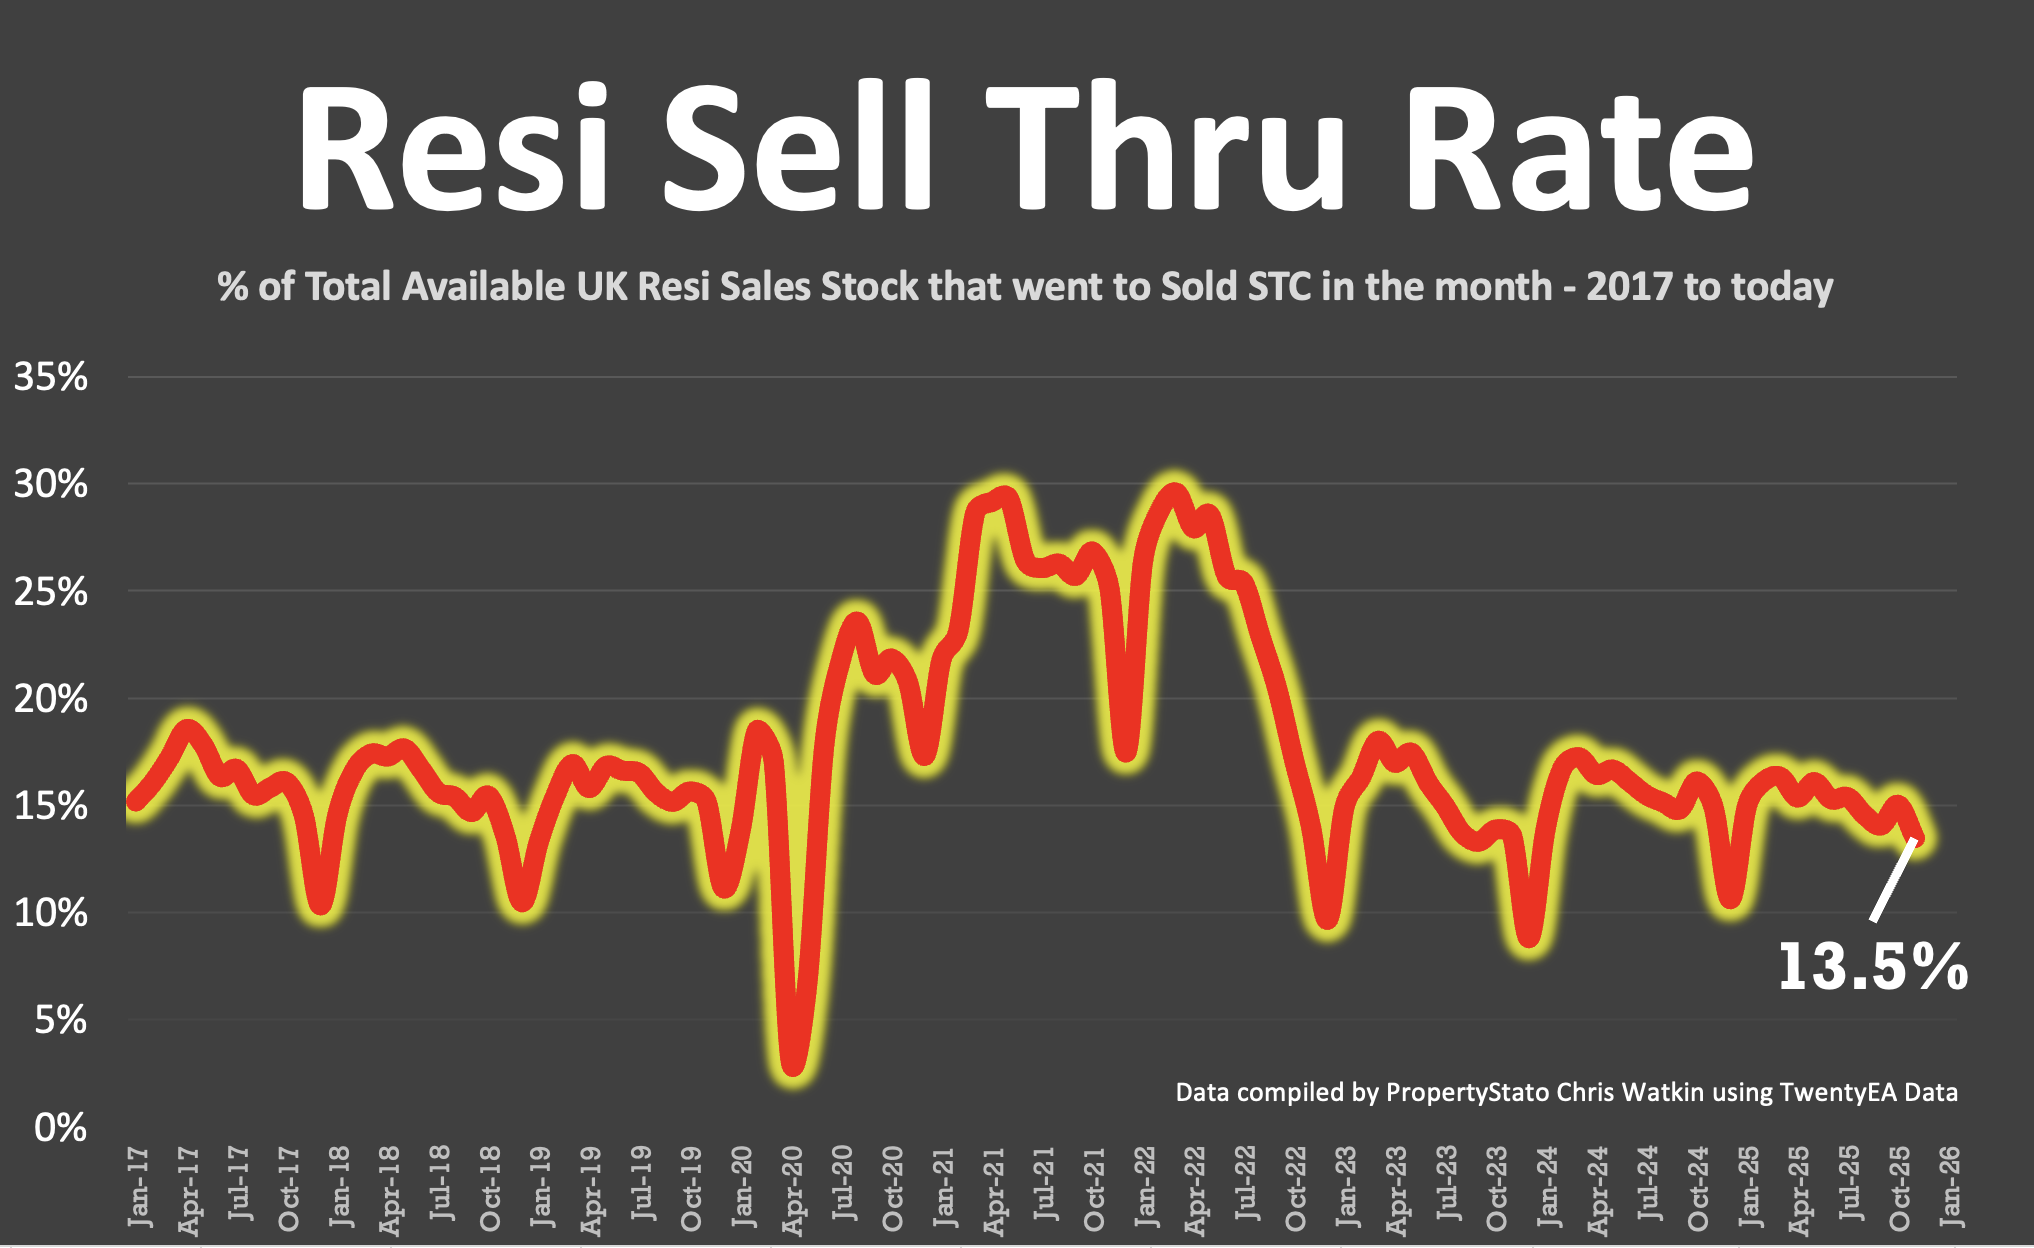
✅ Sell-Through Rate
+ 13.5% of homes on agents’ books went SSTC in November. Down from 15% in October, 14.1% in Sept, 14.5% in Aug, 15.4% in July, 15.3% in June, and 16.1% in May.
+ Pre-Covid average: 15.5%.
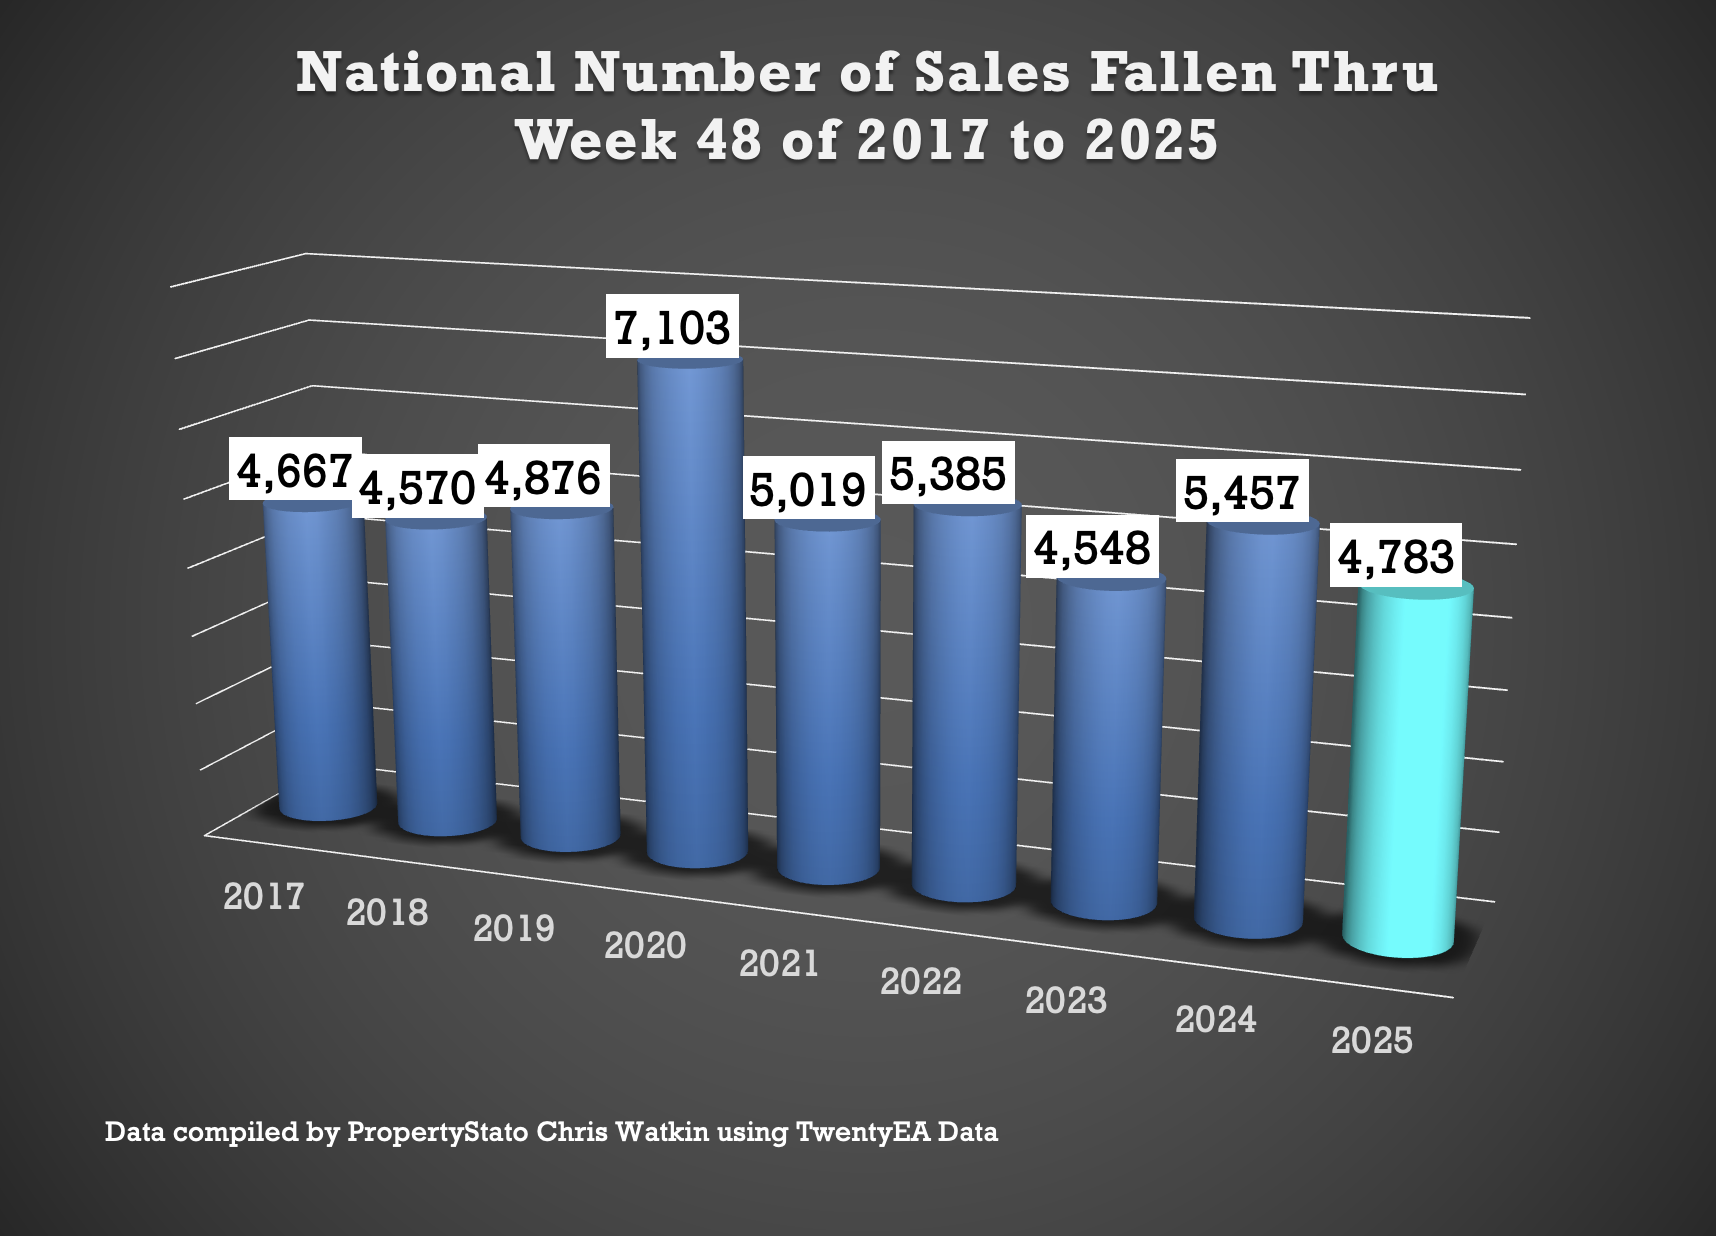
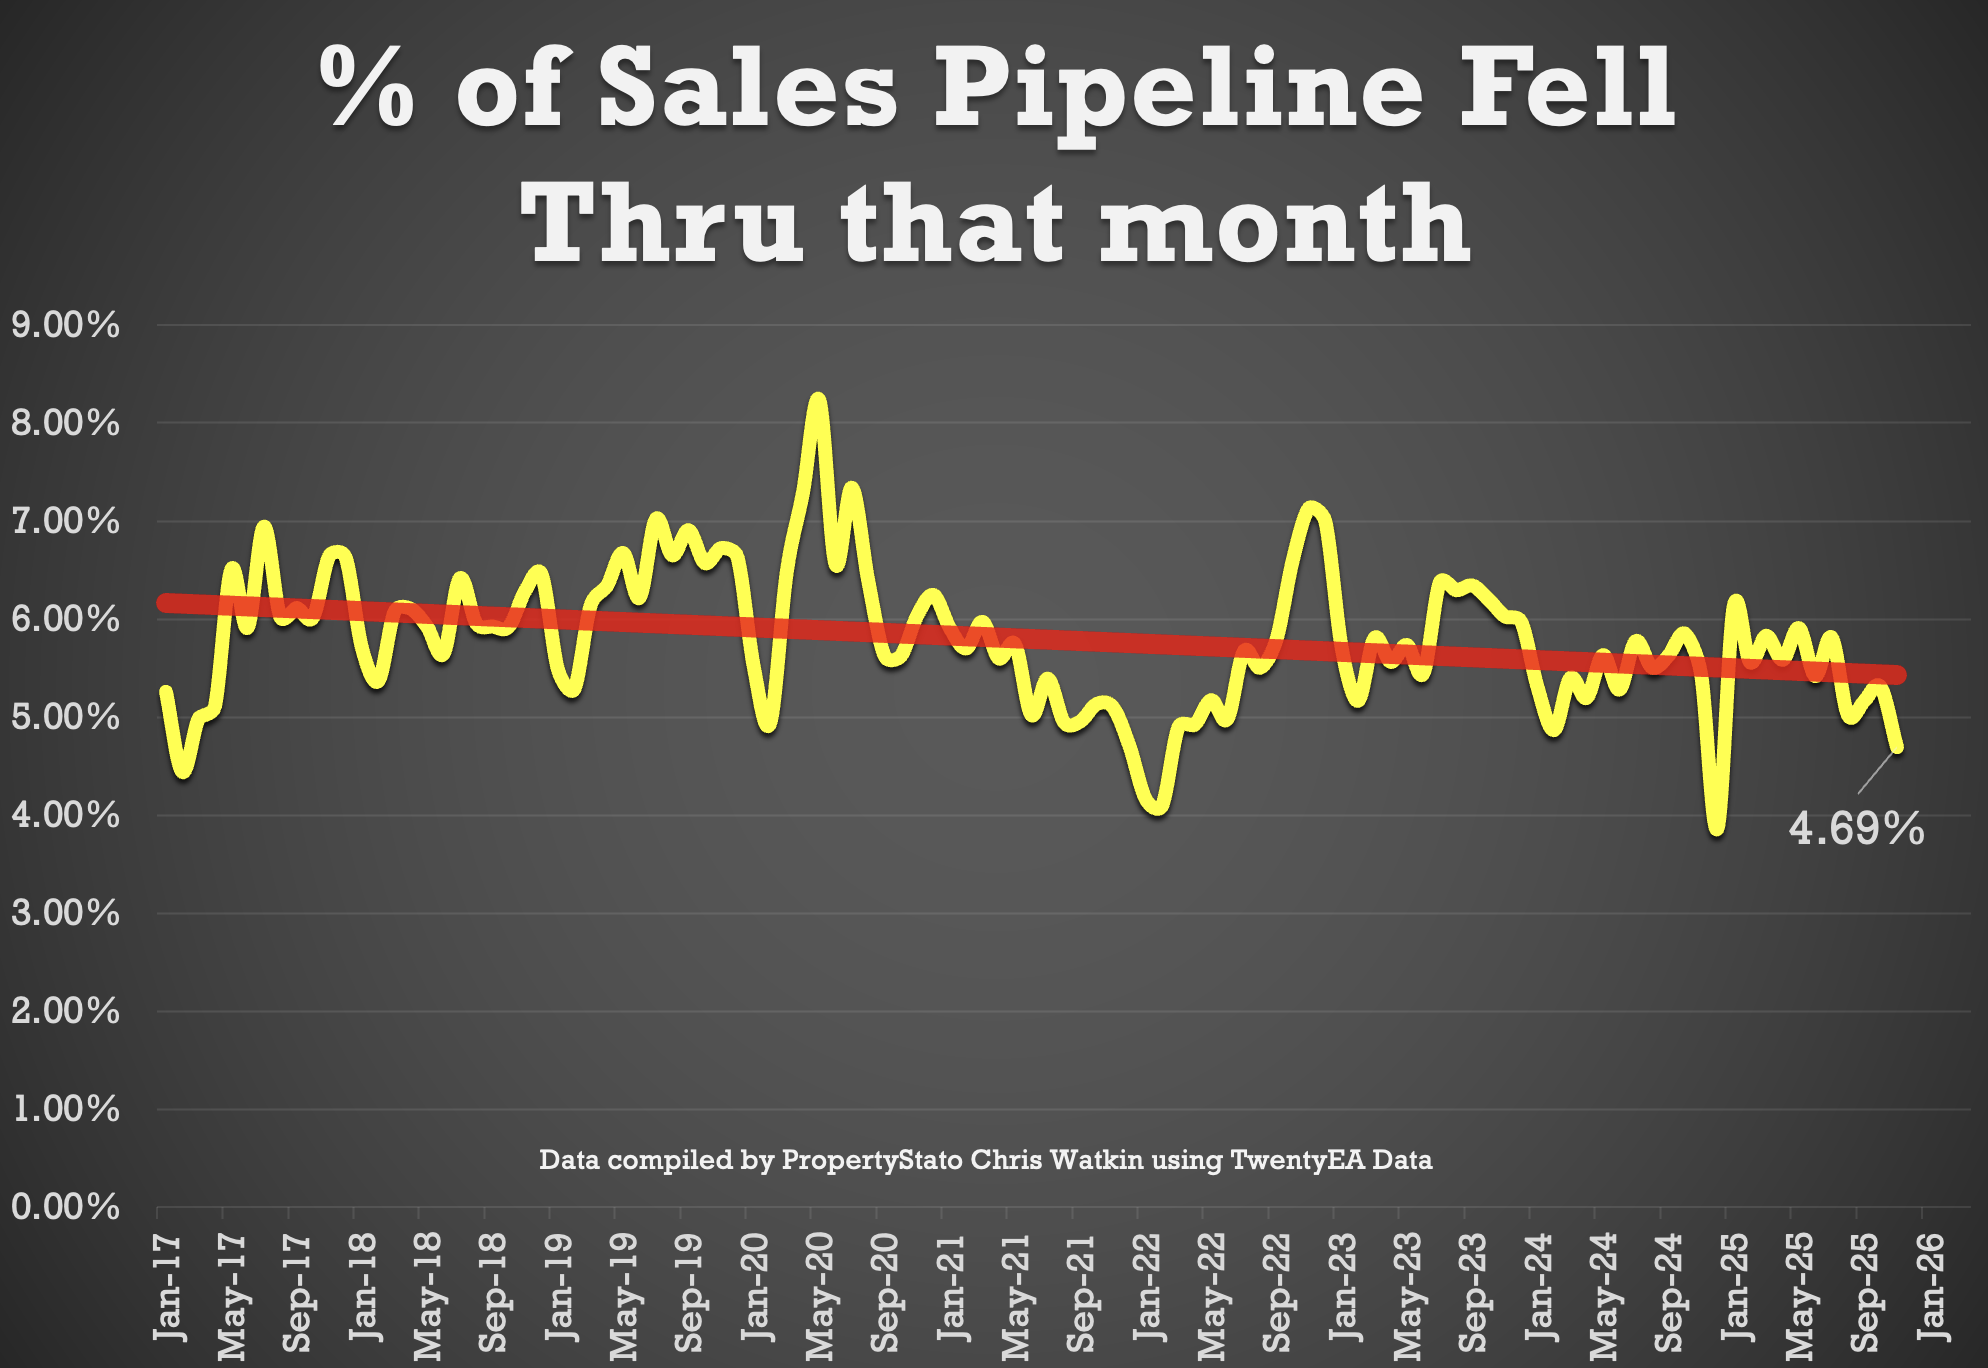
✅ Fall-Throughs
+ 4,783 fall-throughs last week (pipeline of 482k home Sold STC).
+ Weekly average for 2025: 6,100.
+ Fall-through rate: 25.8%, slightly up from 24.9% last week.
+ Long-term average: 24.2% (post-Truss chaos saw levels exceed 40%).
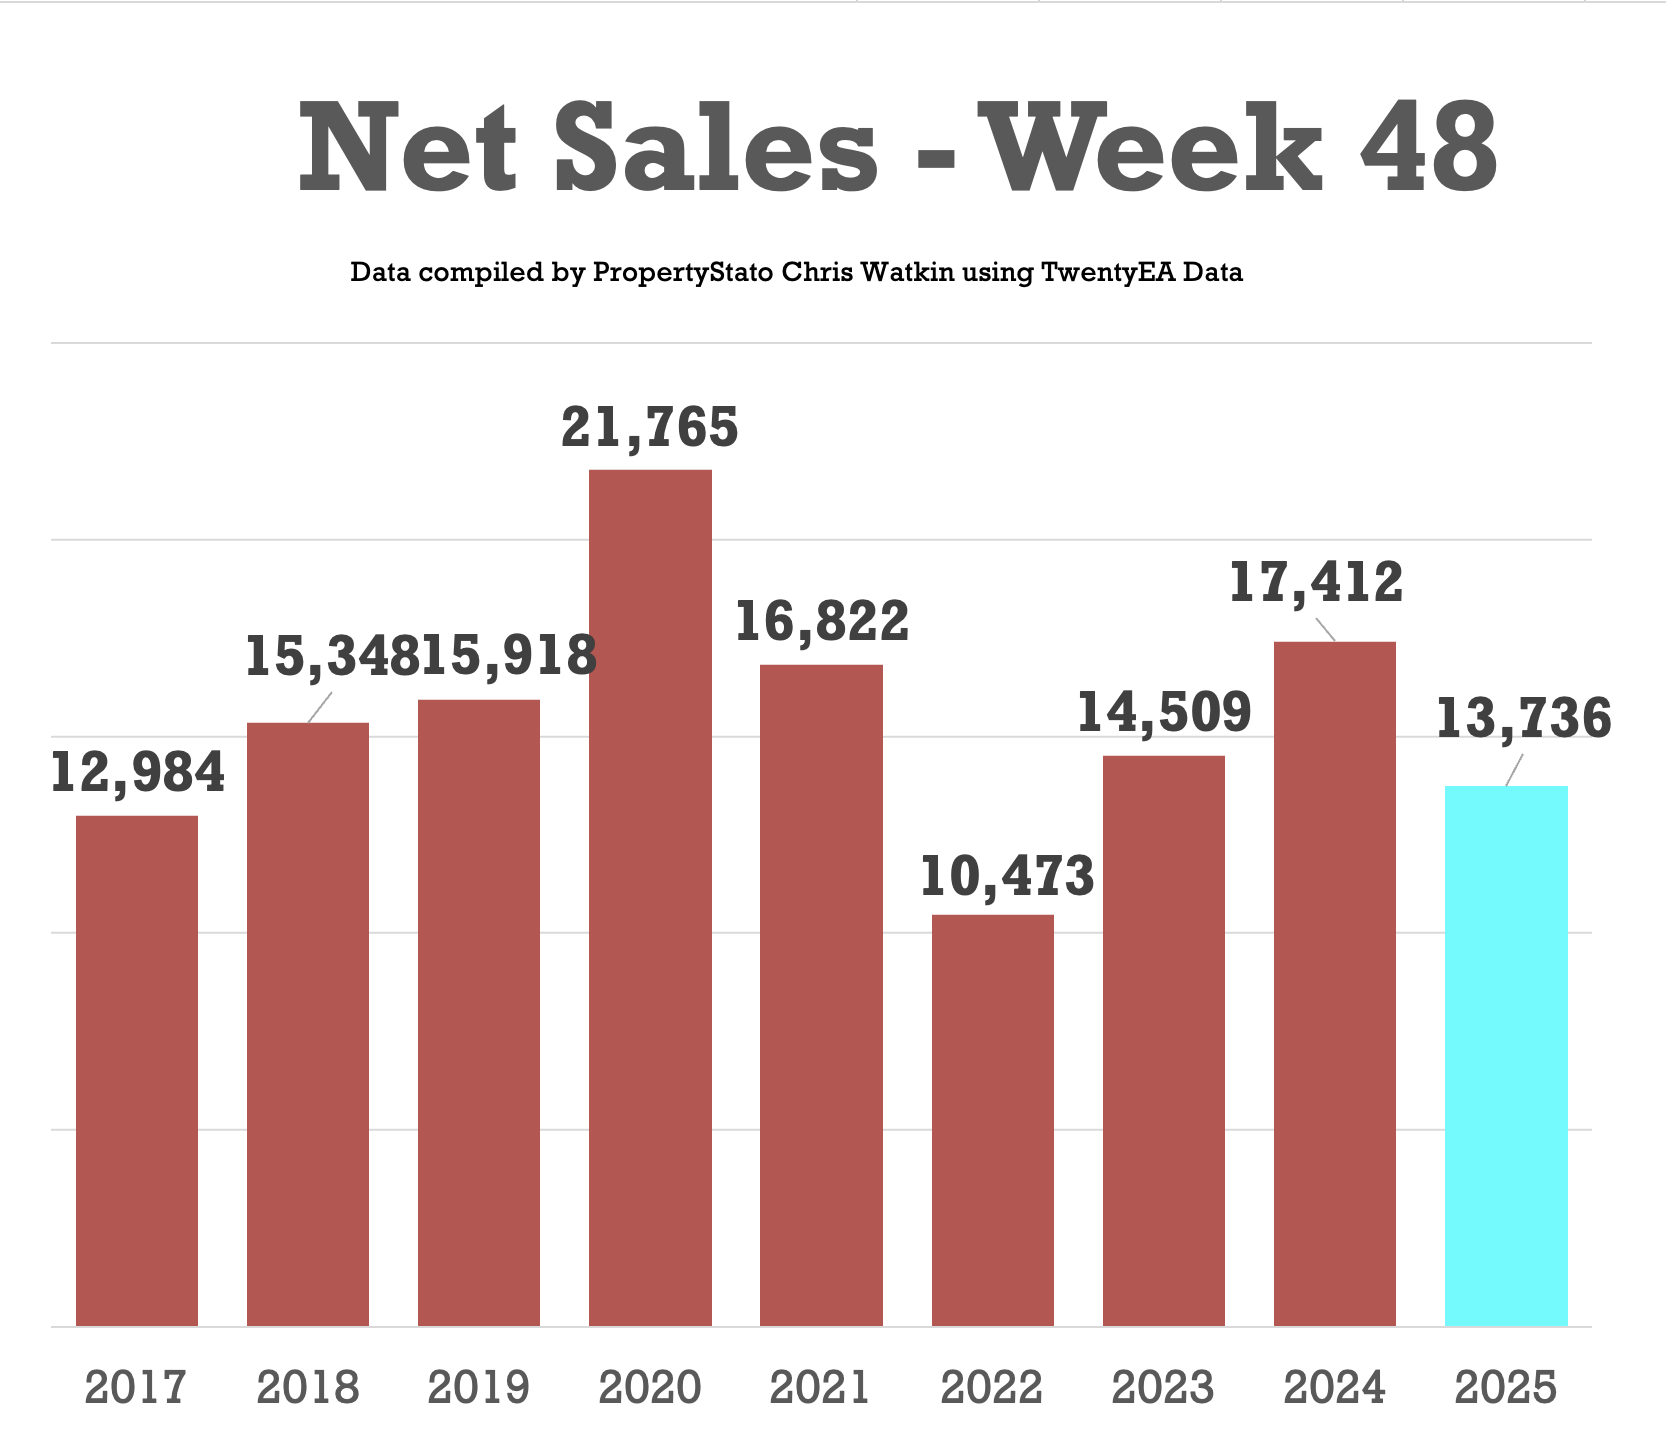
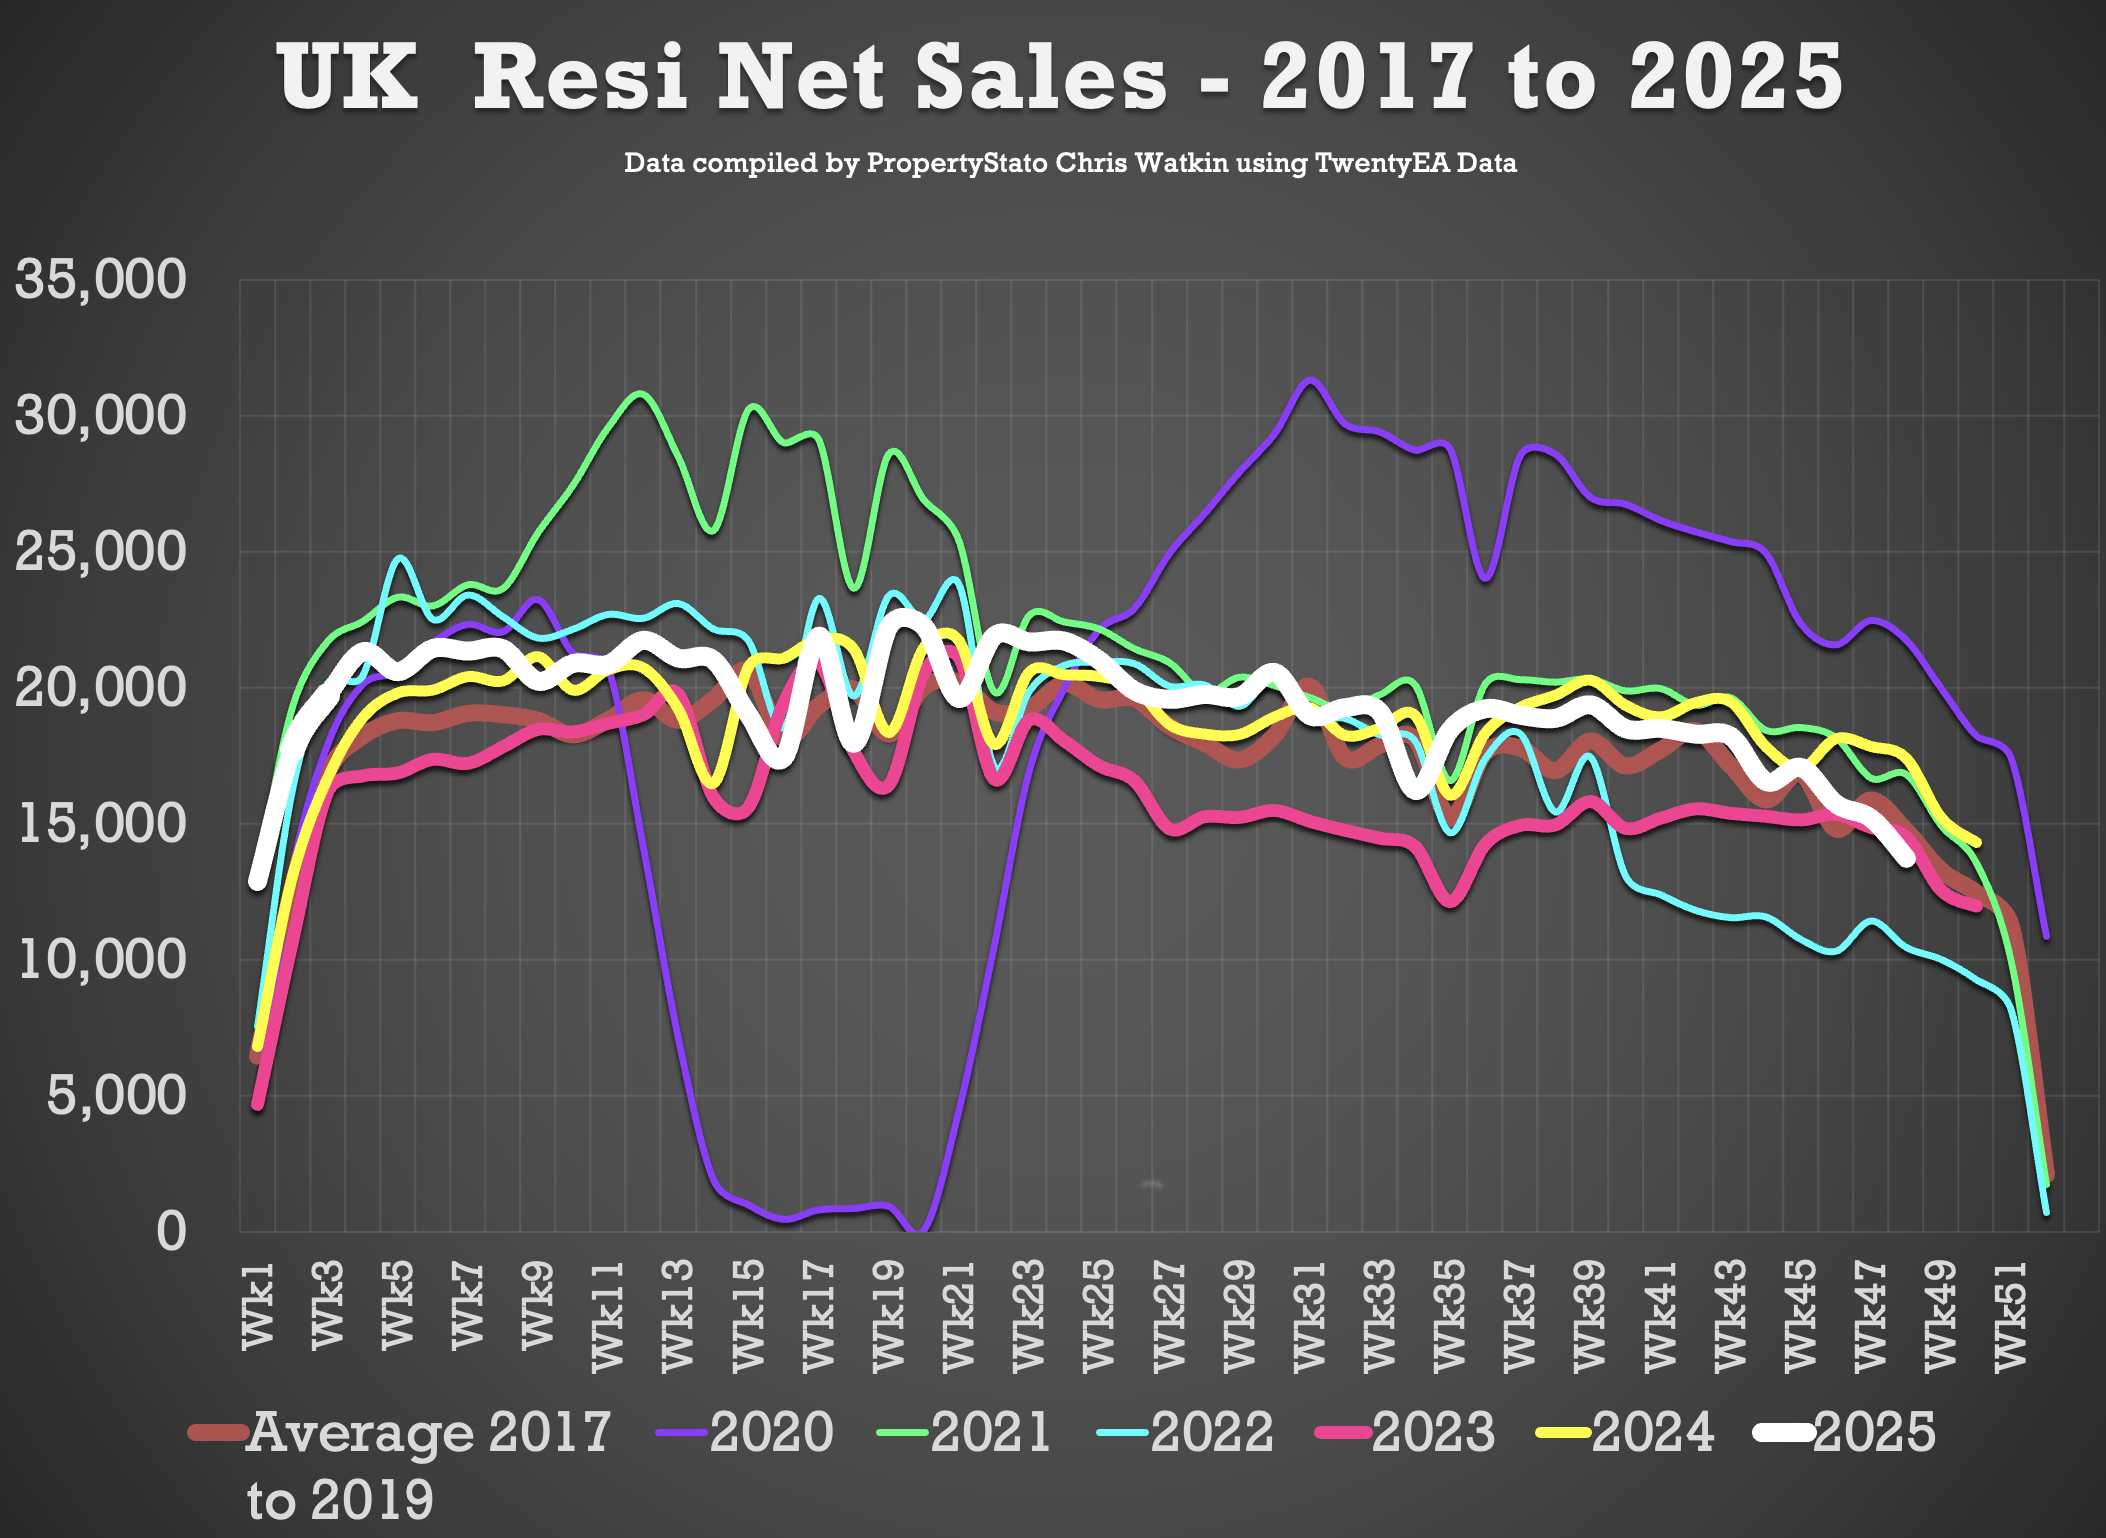
✅ Net Sales
+ 13.7k net sales this week, down expectedly from 15.2k last week.
+ Nine-year Week 48 average: 15.4k.
+ Weekly average for 2025: 19.3k.
+ YTD: 929k, which is 2.2% ahead of 2024 (909k) and 8.6% above 2017–19 (855k).
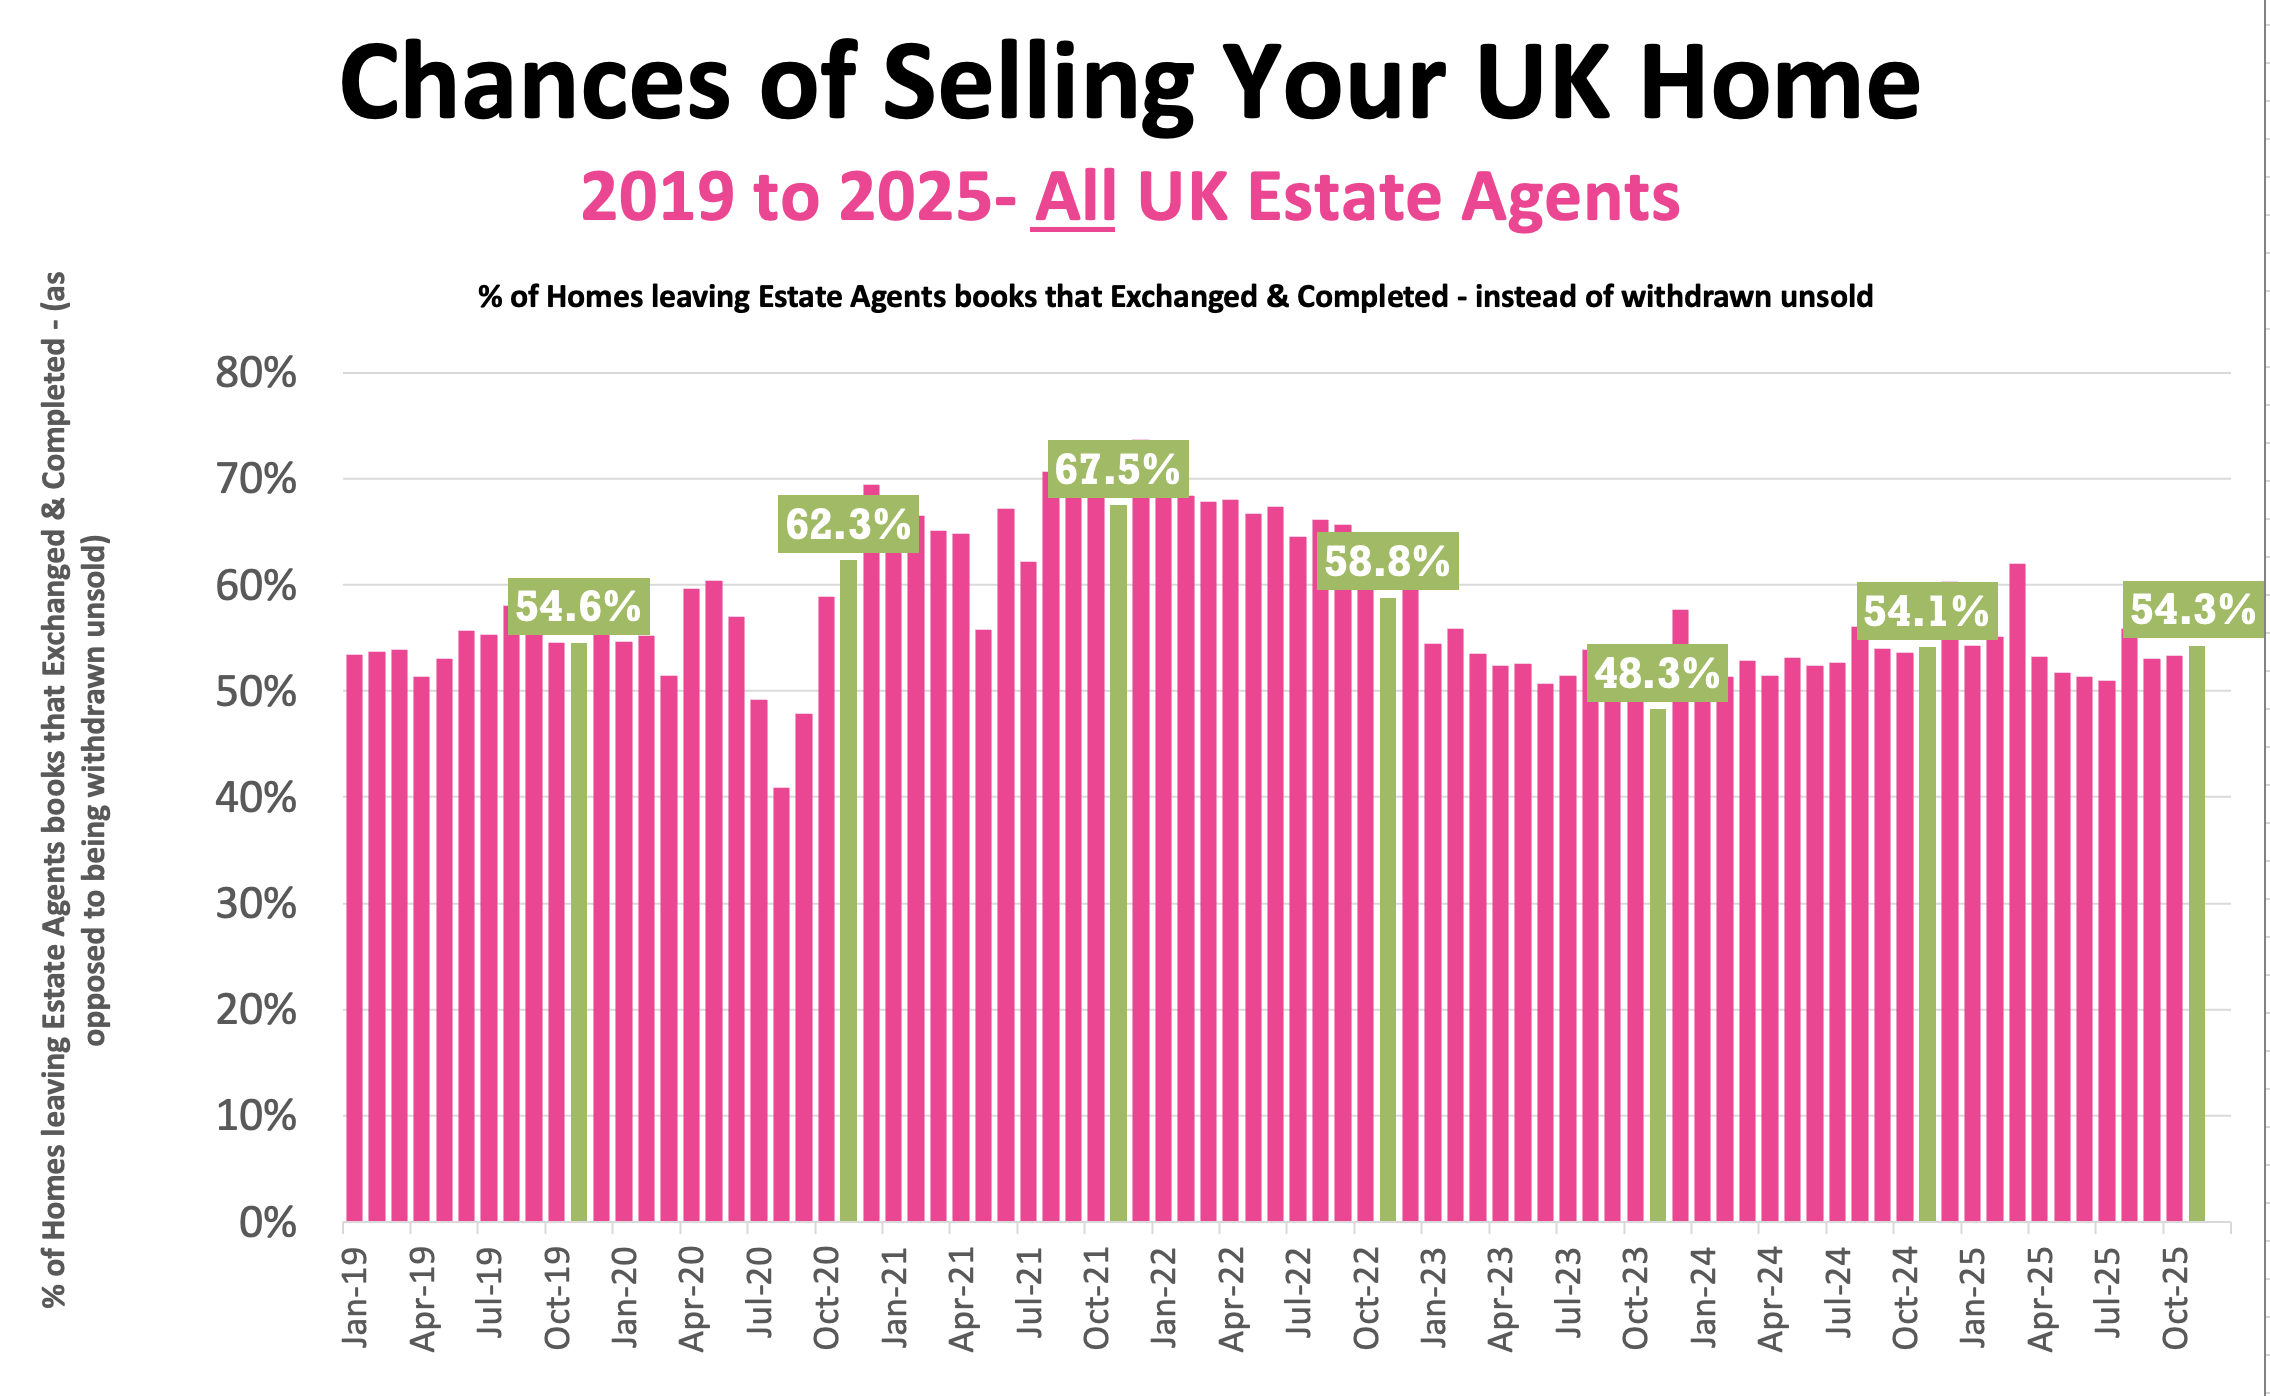
✅ Probability of Selling (% that Exchange vs withdrawal)
+ November Stats : 54.3% of homes that left agents’ books exchanged & completed in November. (Note this figure will change throughout the month as more November stats come in). (65.3k exchanges & 55k withdrawals as at 8th Dec 2025)
+ October 53.3% / September: 53.1% / August :55.8% / July: 50.9% / June: 51.3% / May: 51.7% / April: 53.2%.

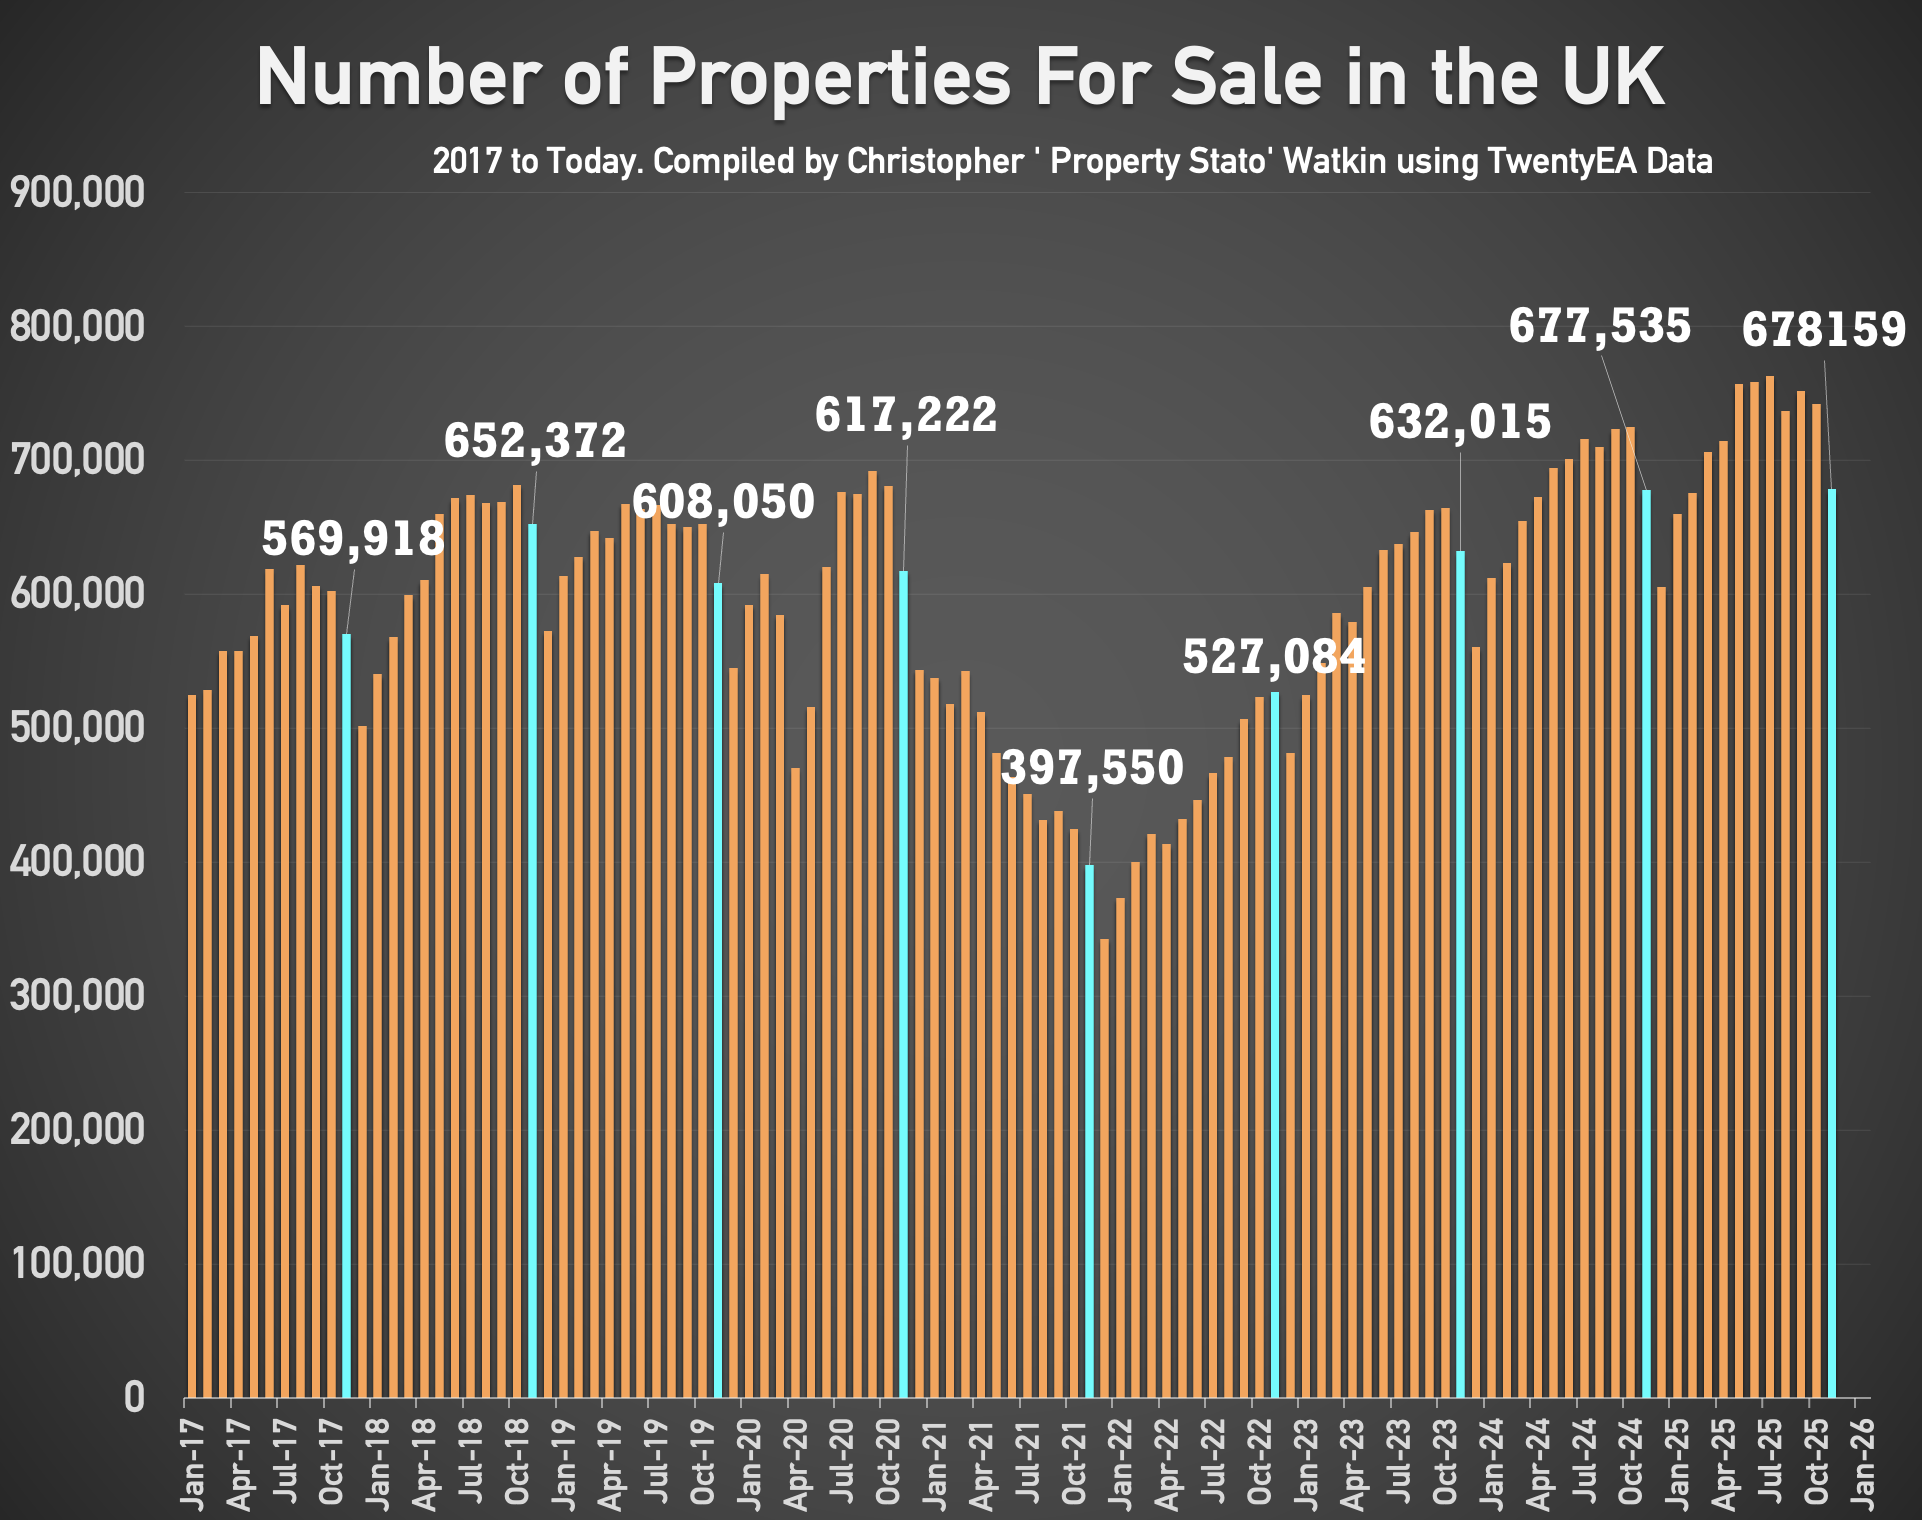
✅ Stock Levels
+ 678k homes on the market on the 1st of December, down from 742k on 1st of November. December ’25 is identical to December ’24.
+ 482k homes in sales pipeline on the 1st December, almost identical than 12 months ago.

✅ House Prices (£/sq.ft)
+ November 2025 agreed sales averaged £342.27 per sq.ft. 0.7% higher than 12 months ago and 12.6% than 5 years ago. The £/sqft at sale agreed matches the HM Land Registry Index with a 98% accuracy, five months in advance.
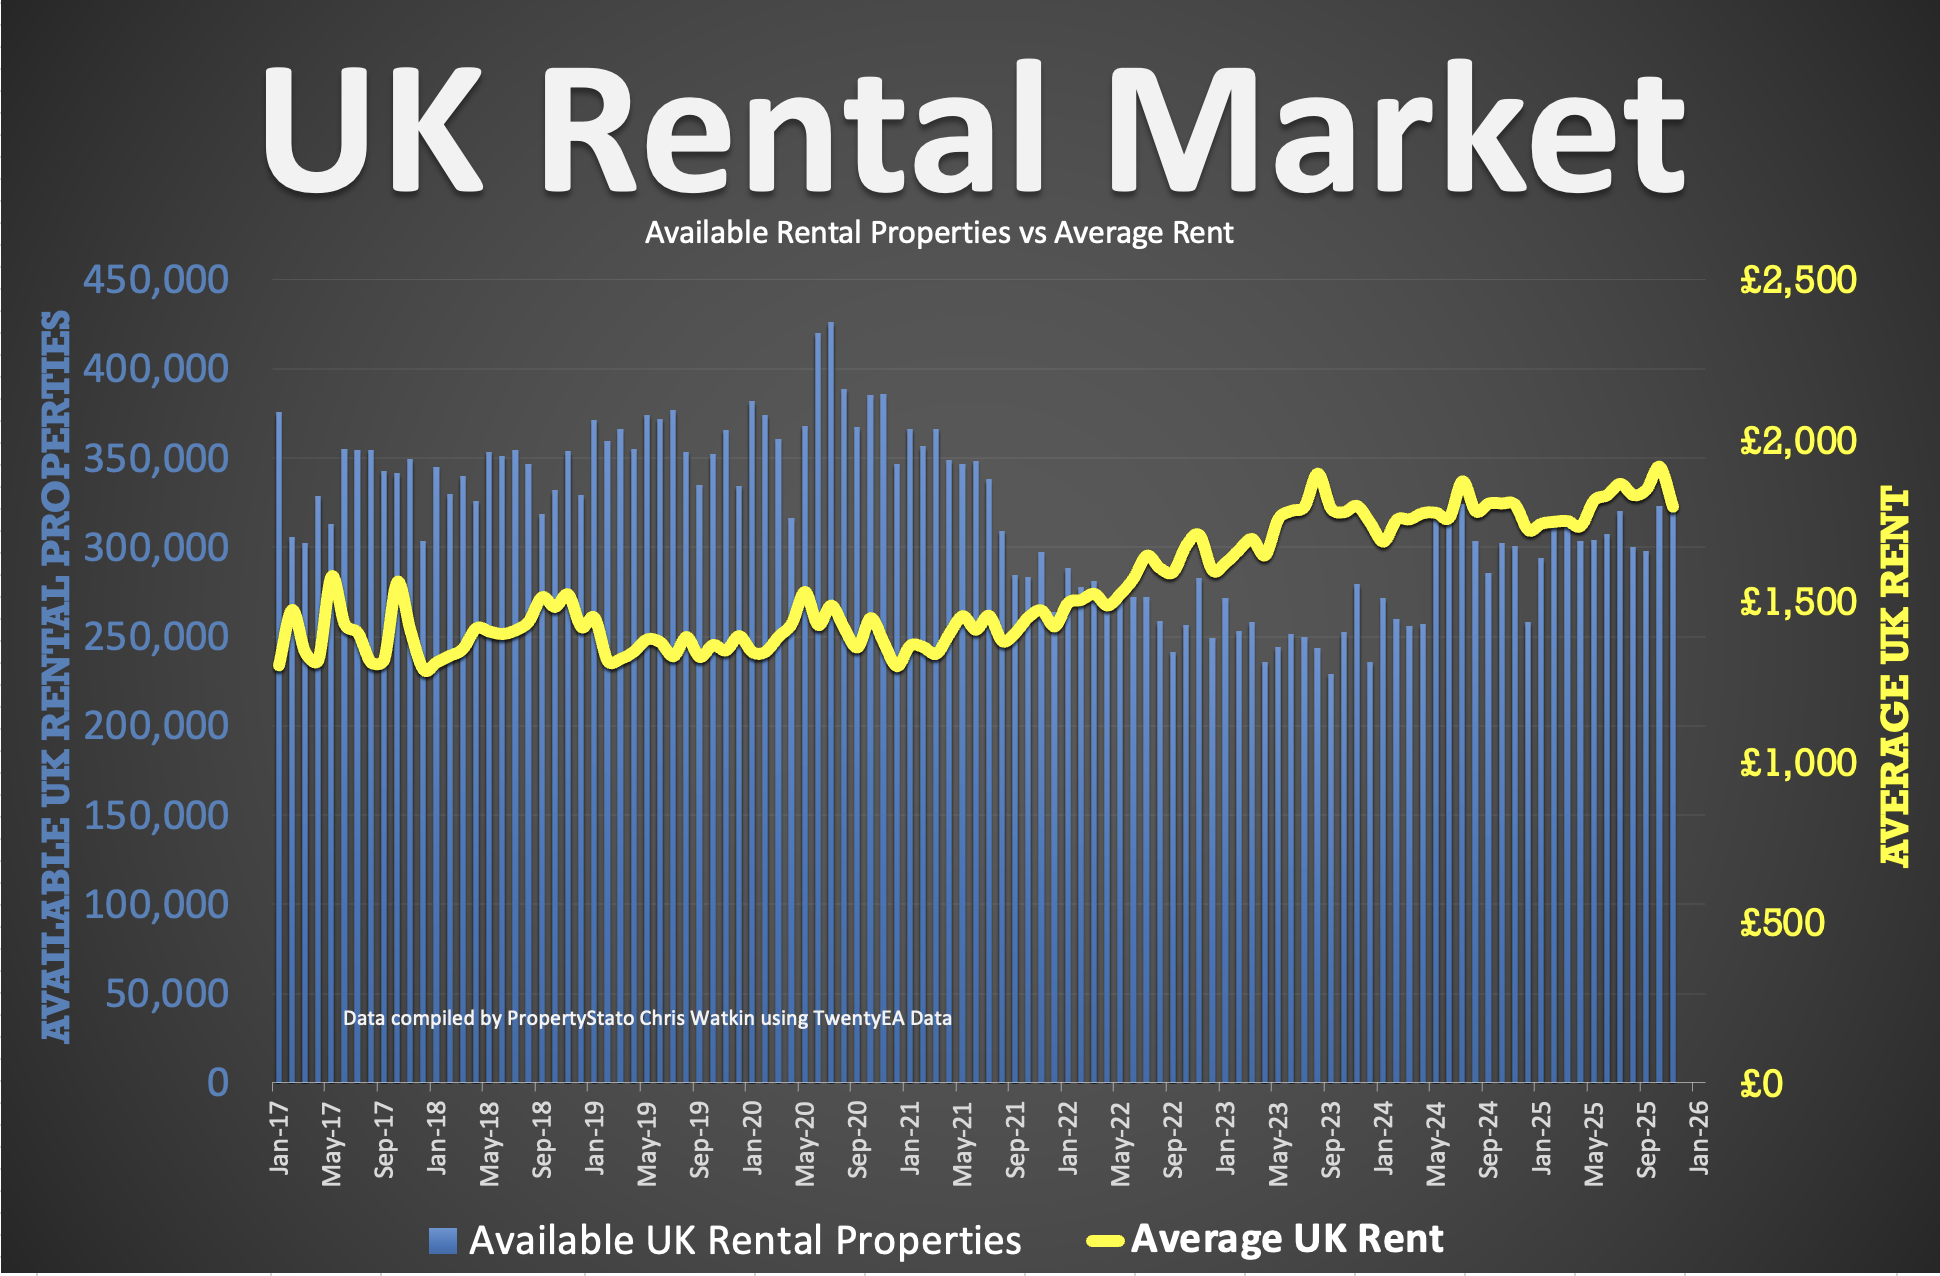
✅ UK Rental Market Overview
+ Average Rent in November – £1,791 pcm – a drop of 6.5% from October ’25 when it was £1,916 pcm. For additional comparison, Average rent was £1,785 in Nov 2024 and £1,557 in Oct 2017.
+ Available Rental Properties in November ’25 – 321k compared to 300k in November ’24.
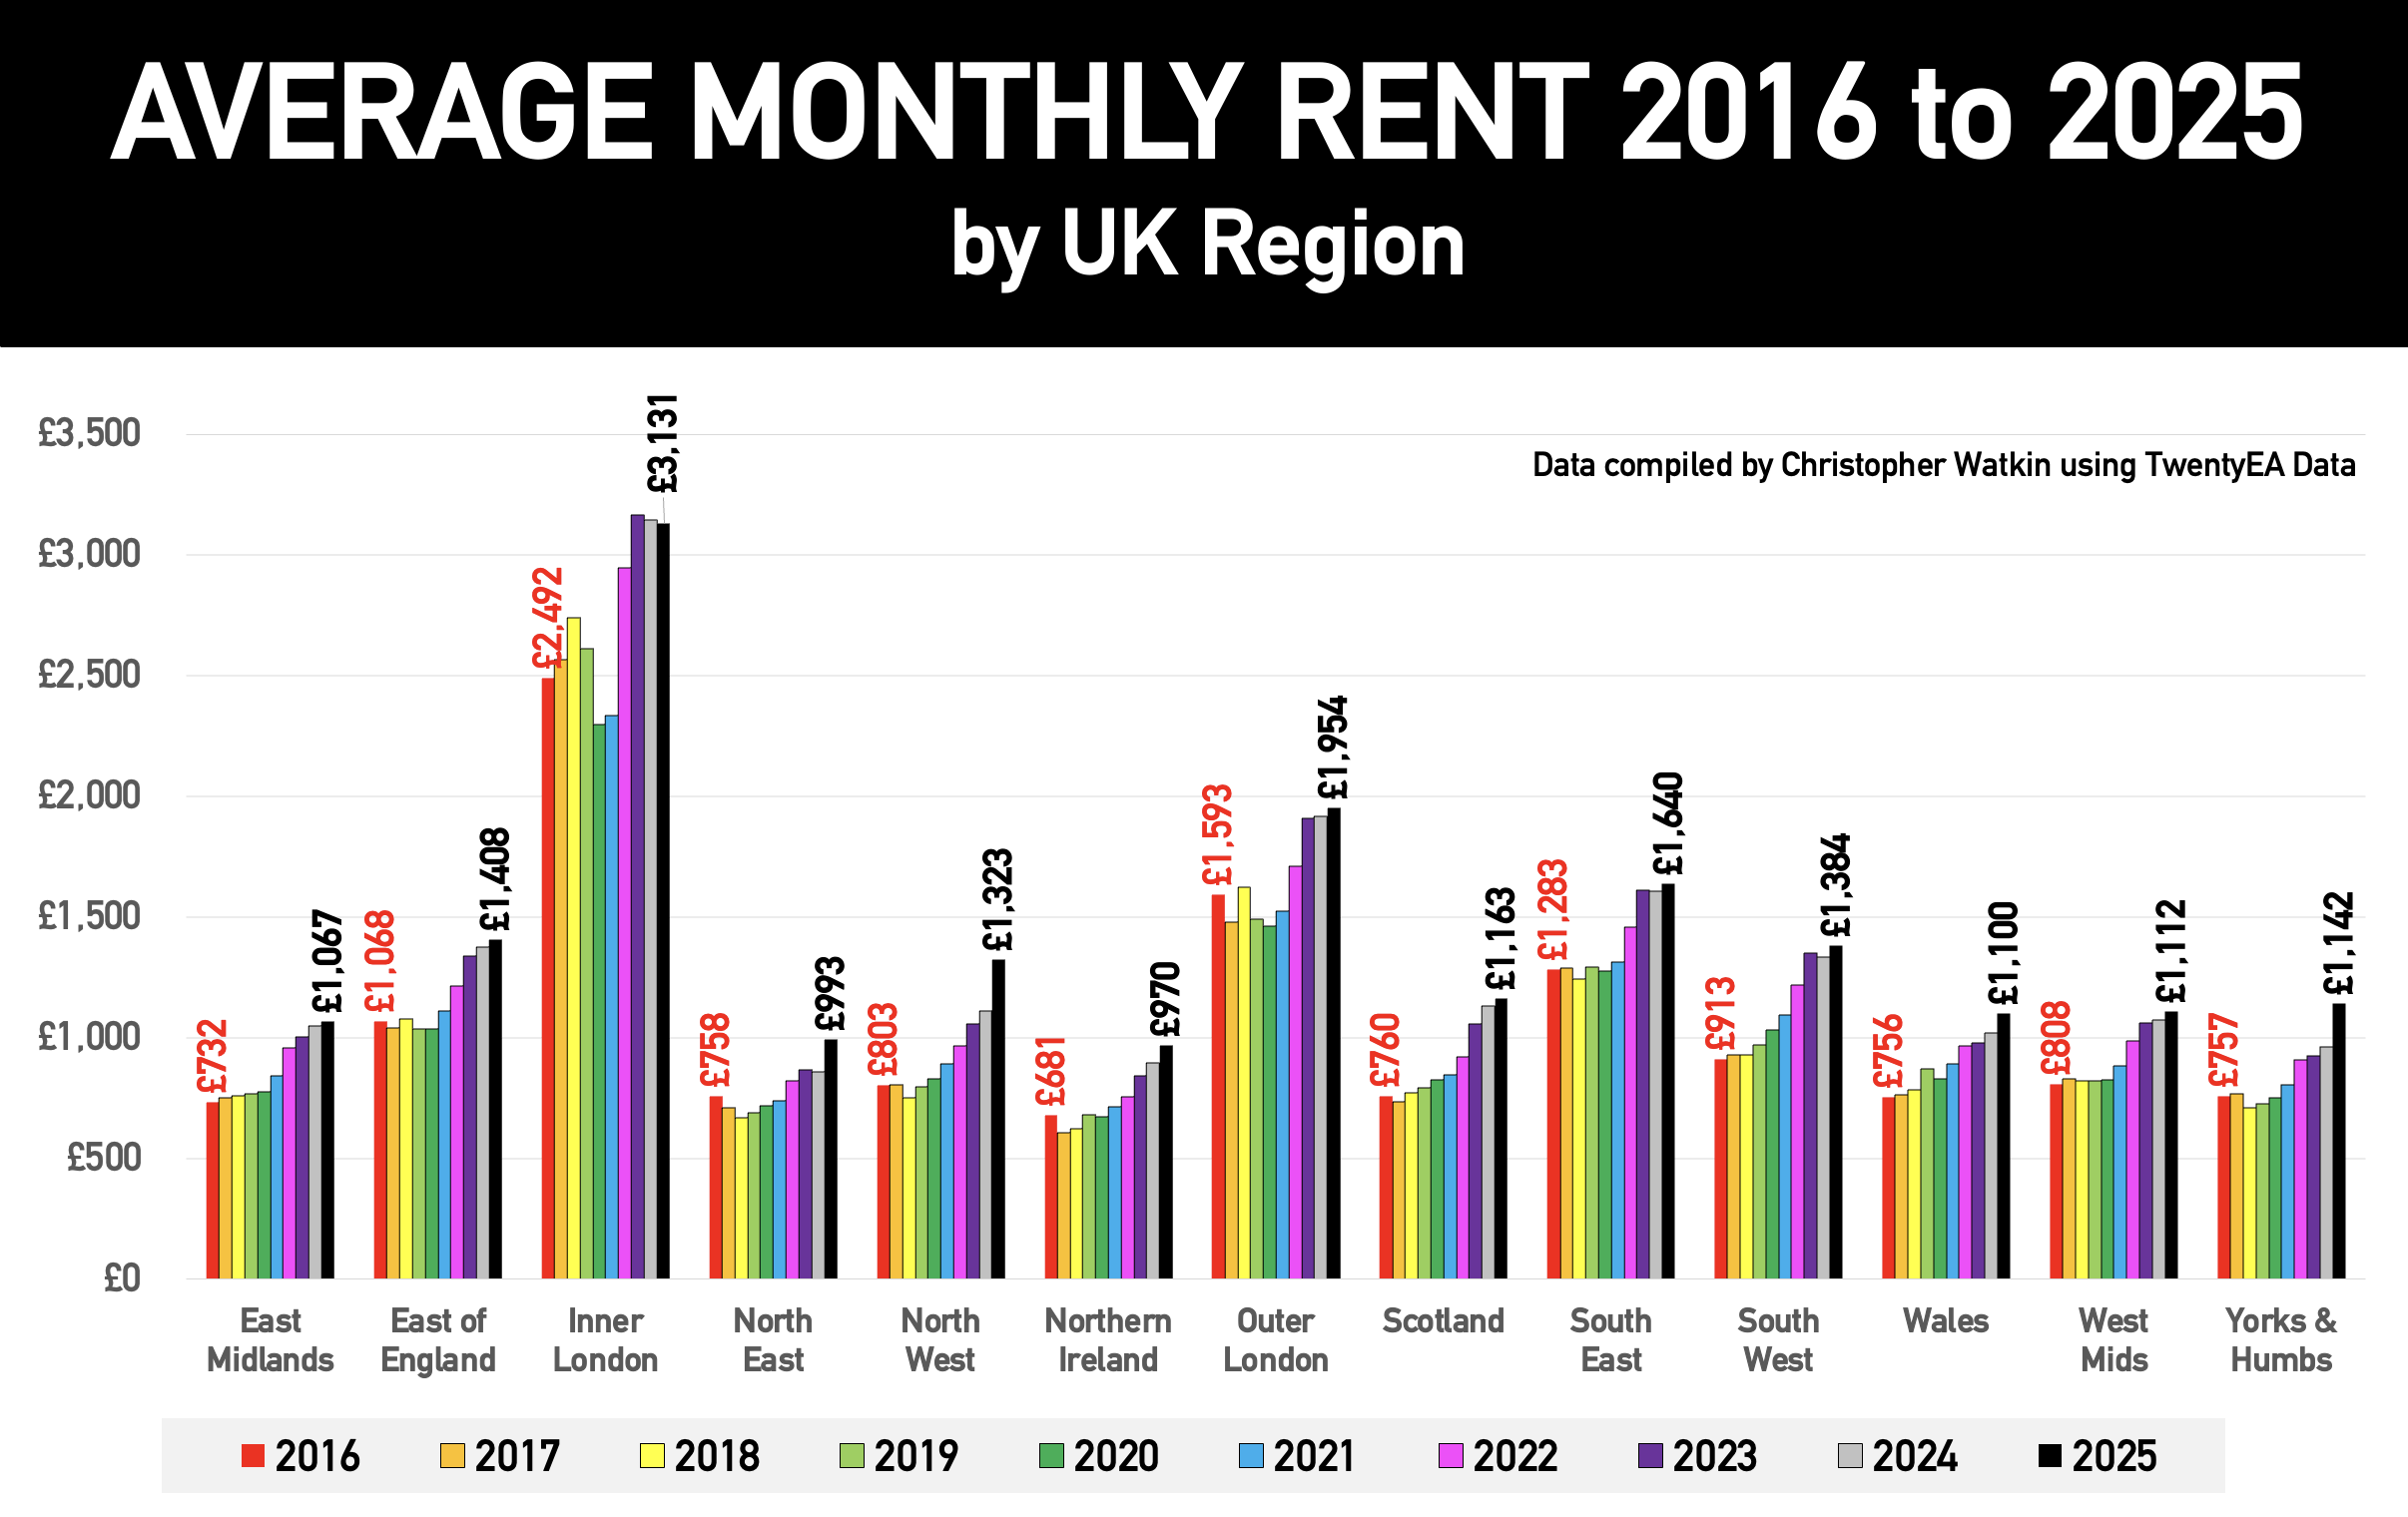
+ Notable increase of 22.8% more rental homes in Outer London than 12 months ago, yet a 3.7% decrease in Inner London – Not sure why.
you really need a hobby
You must be logged in to like or dislike this comments.
Click to login
Don't have an account? Click here to register
This is my hobby 😉
You must be logged in to like or dislike this comments.
Click to login
Don't have an account? Click here to register
You must get out more
Or get a hobby such as a sport – football – squash – tennis – cricket – bowls
Or reading – theatre #
None of this stiff matters in the real world
You must be logged in to like or dislike this comments.
Click to login
Don't have an account? Click here to register