

 Welcome to the 35th UK Property Market Stats Show of 2025 – your go-to weekly TV programme on the UK housing market.
This week, I am joined by Kristian Stott, as we unpack the key headlines from the 35th week of 2025, ending Sunday, 7th September 2025.
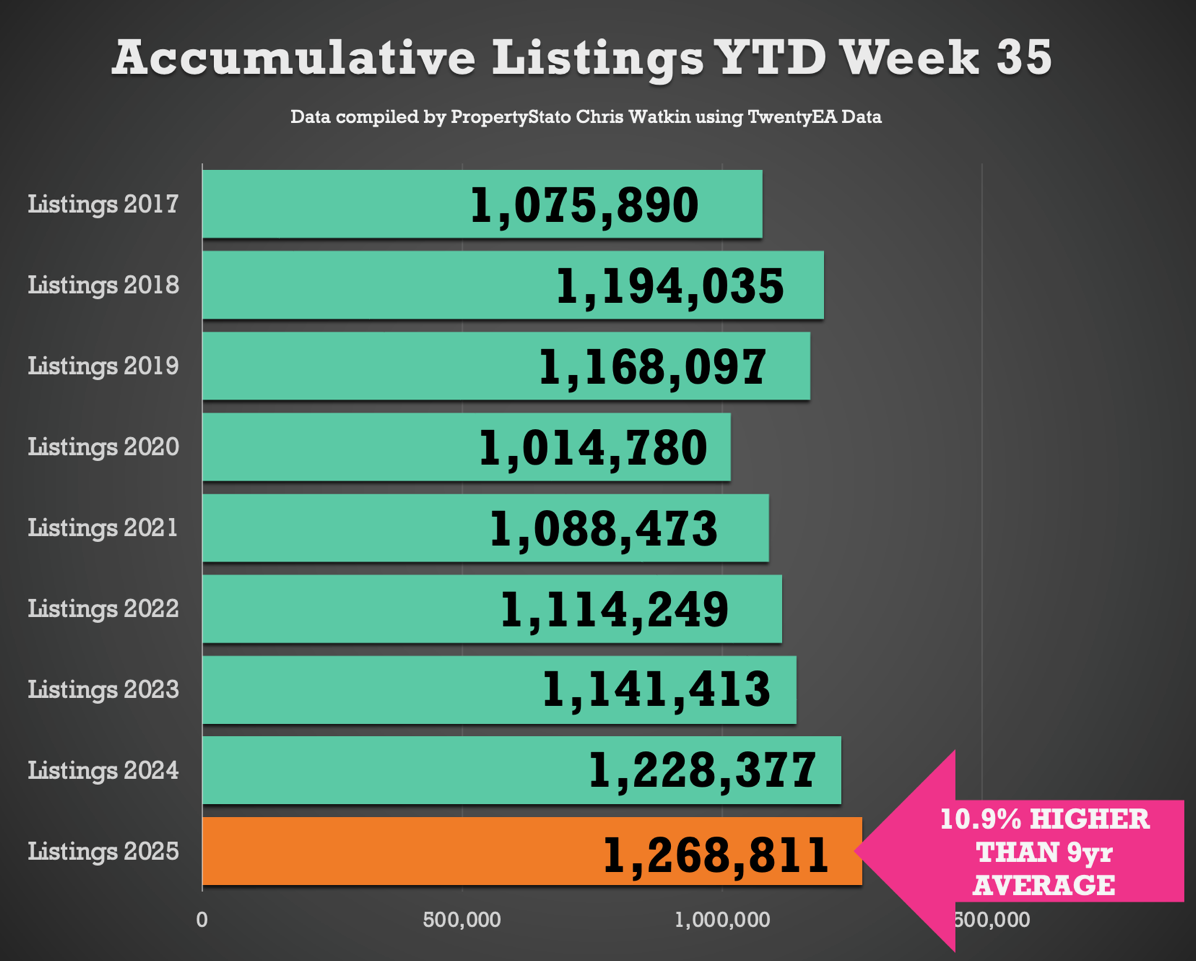
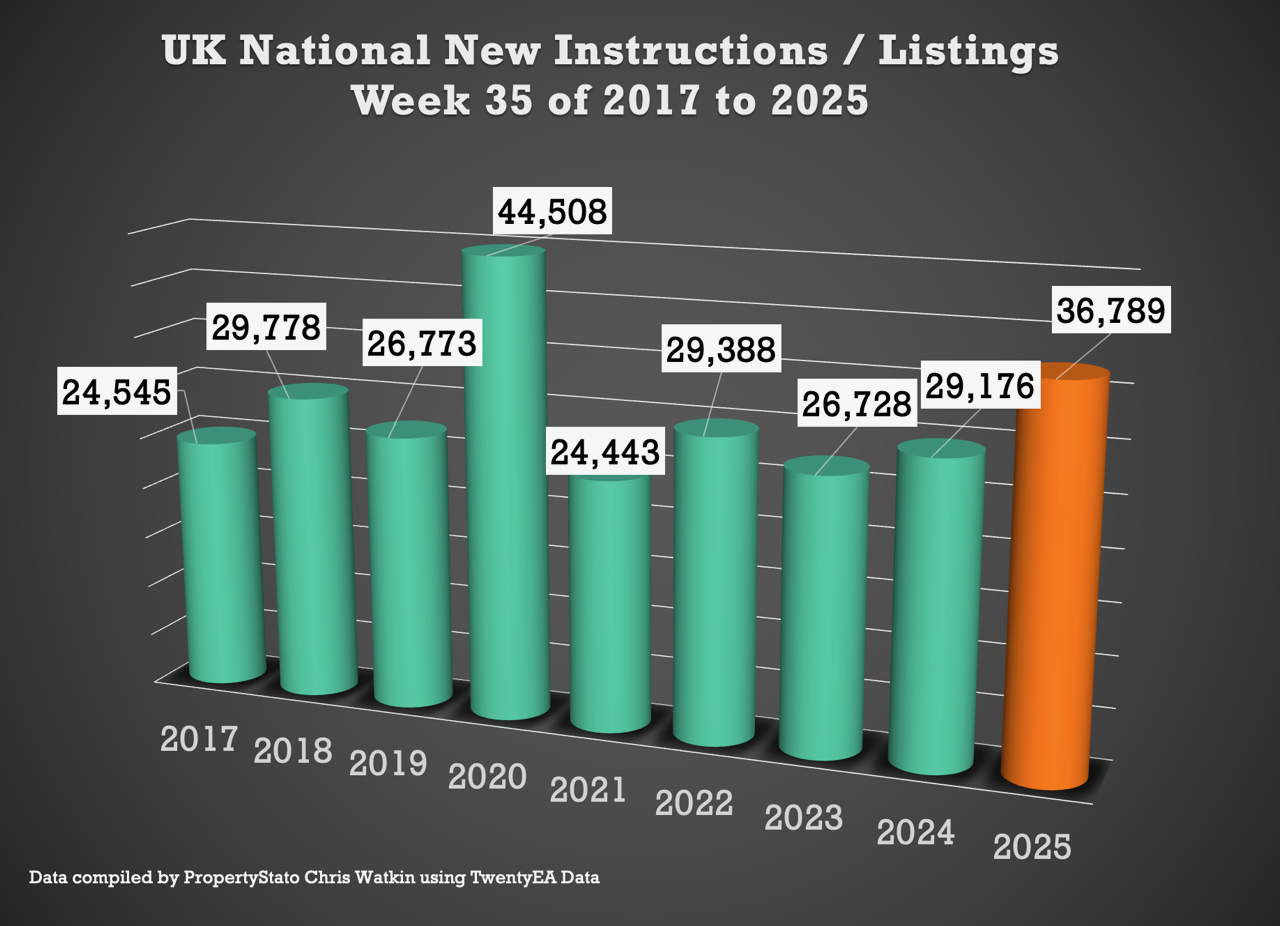
✅ Listings (New to Market)
36.8k new listings this week (Up as expected from 29.1k last week as it was week after August Bank Holiday).
2025 weekly average : 36.2k
YTD listings are 3.3% higher than 2024 YTD (1.27m YTD vs 1.23m in 2024 YTD) and 10.7% above the 2017–19 YTD average (1.15m).

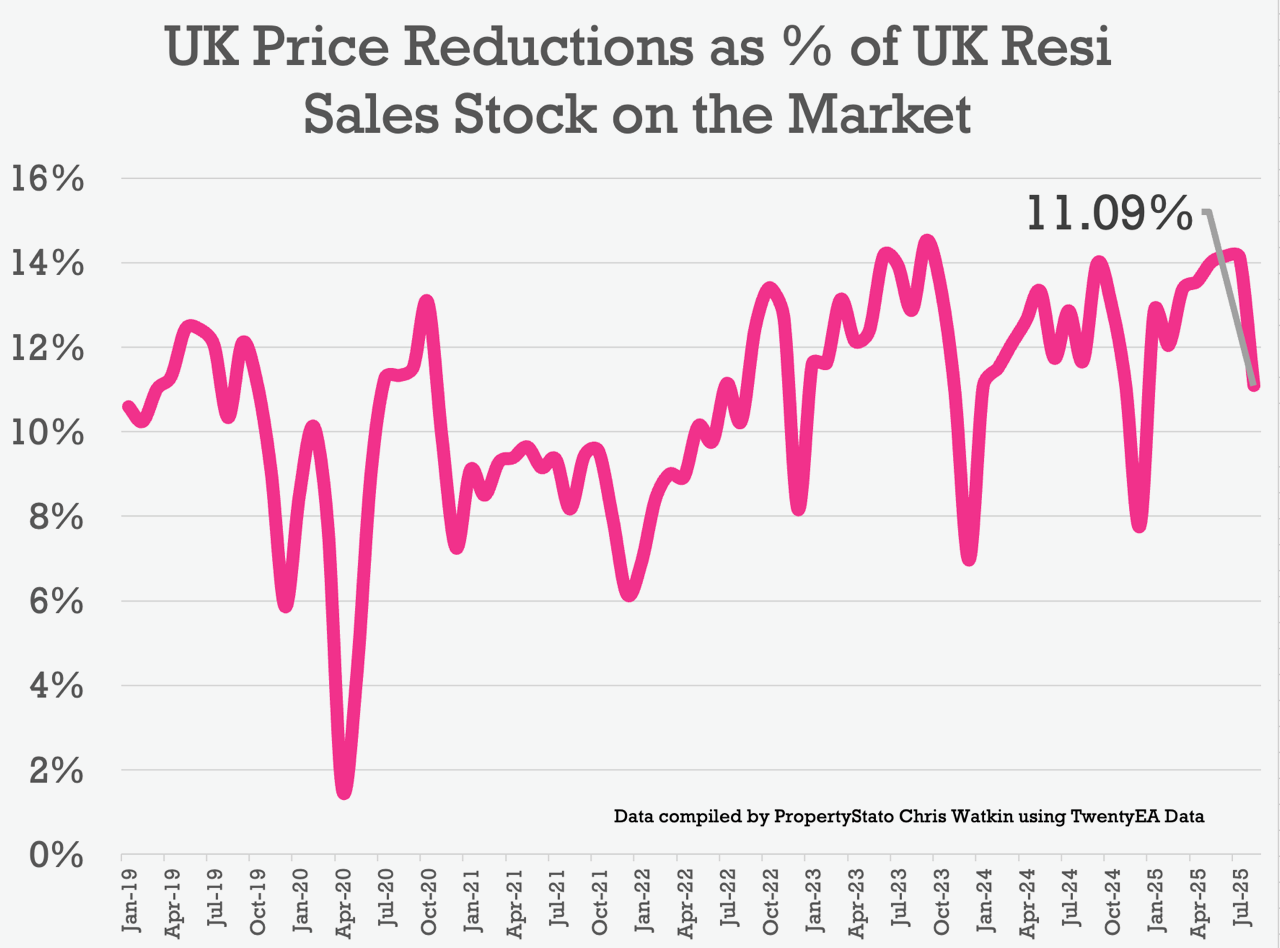
✅ Price Reductions
25.7k reductions this week (up from 17.5k last week – again post Bank Holiday).
Only 1 in 9 homes for the month of August on the market being reduced monthly (11.1%)
For context:
• 14.1% in July, 14% in June
• 13.1% average in 2025
• Long-term 5-year average: 10.7%.
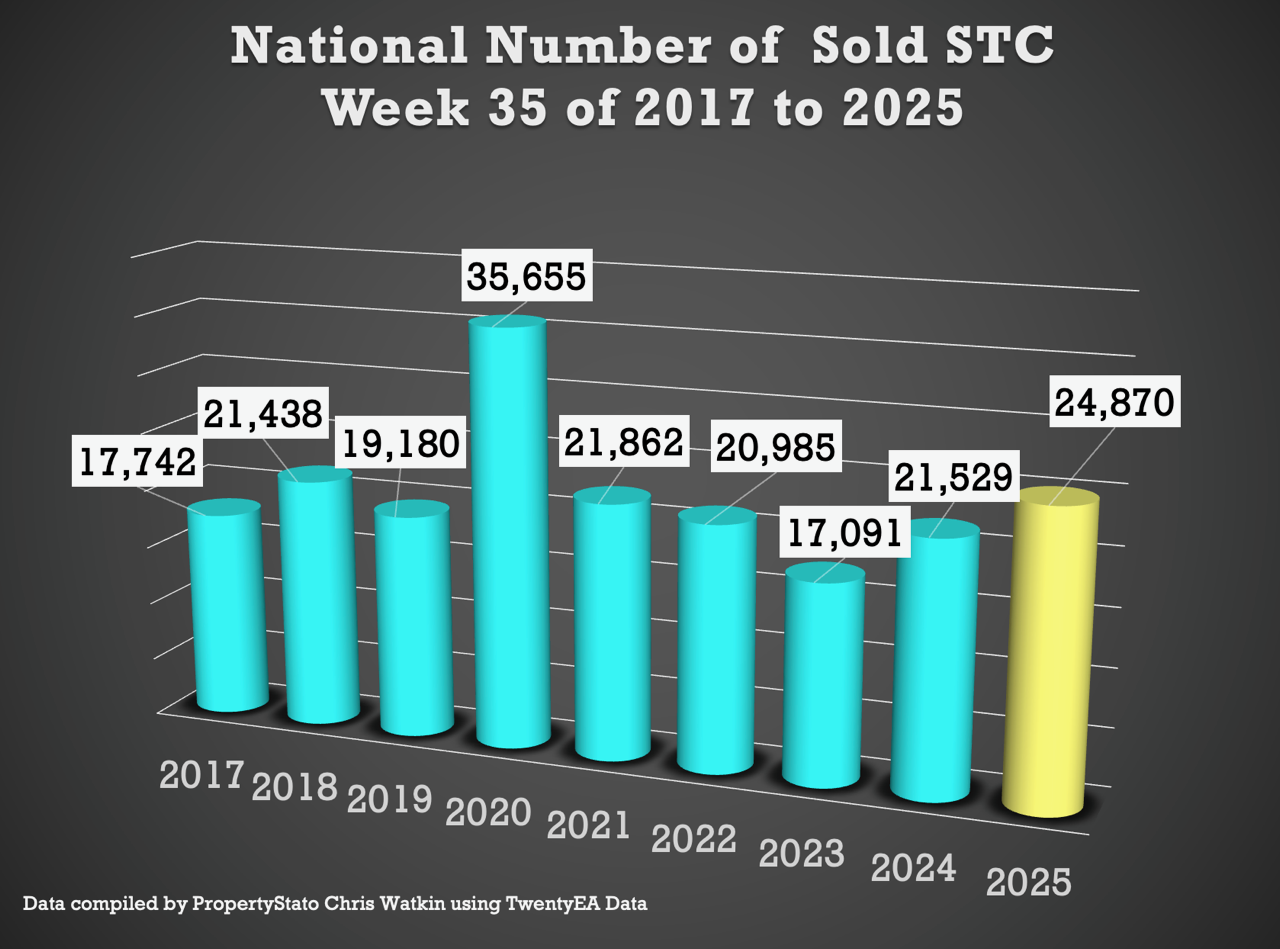
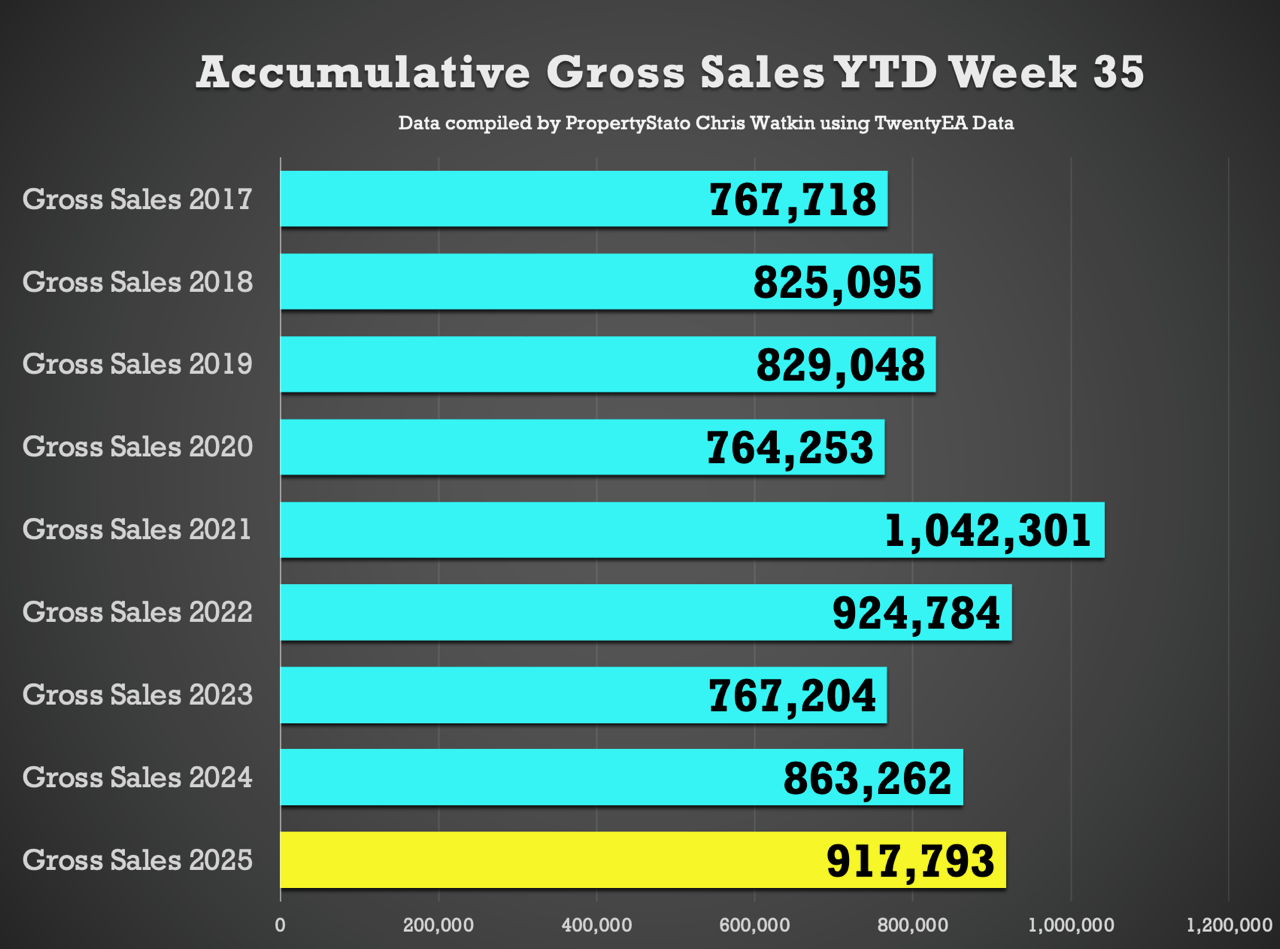
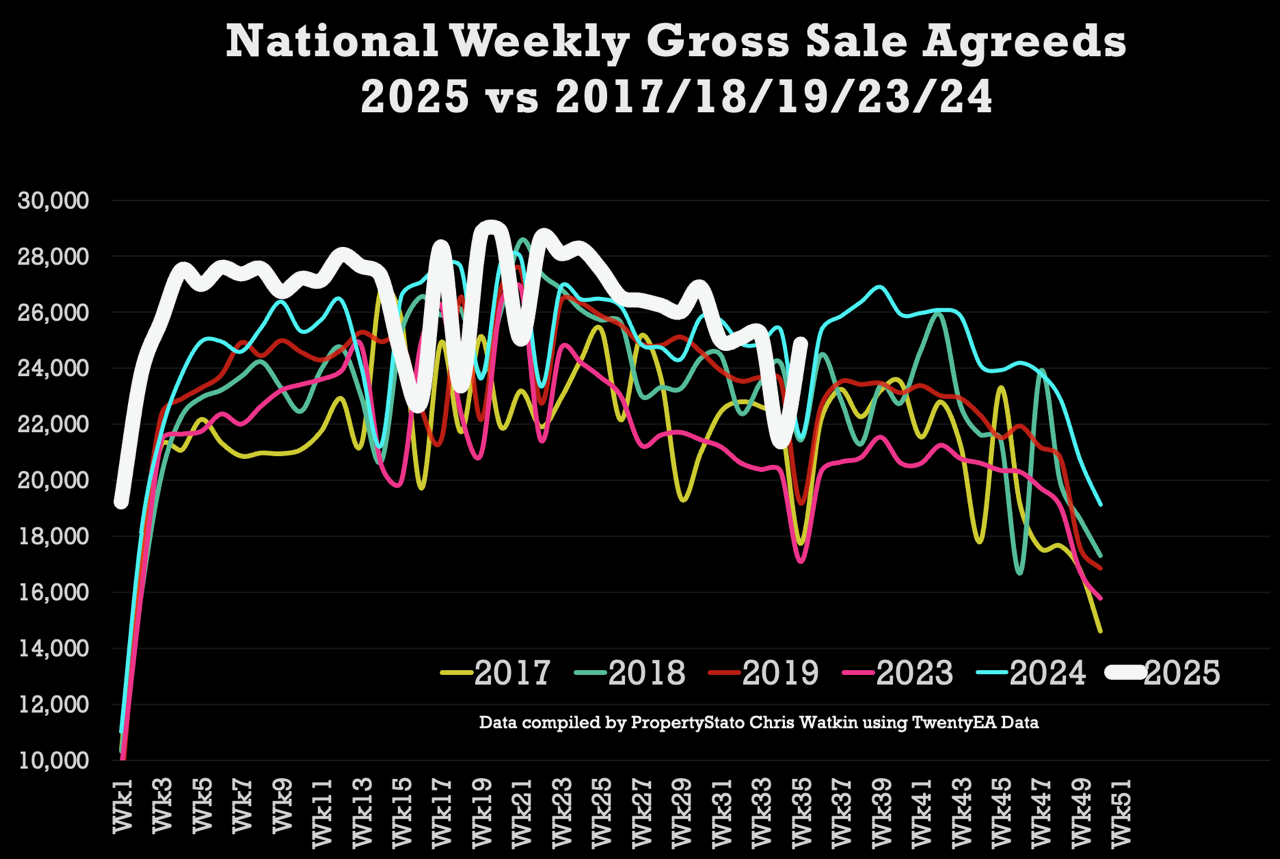
✅ Sales Agreed
24.9k homes sold STC this week (up from last week at 21.3k – again Bank Holiday)
2025 weekly average : 26.2k
YTD agreed sales:
• 6.3% up on 2024 (918k vs 863k)
• 13.7% up on pre-Covid average of 807k (2017–19).
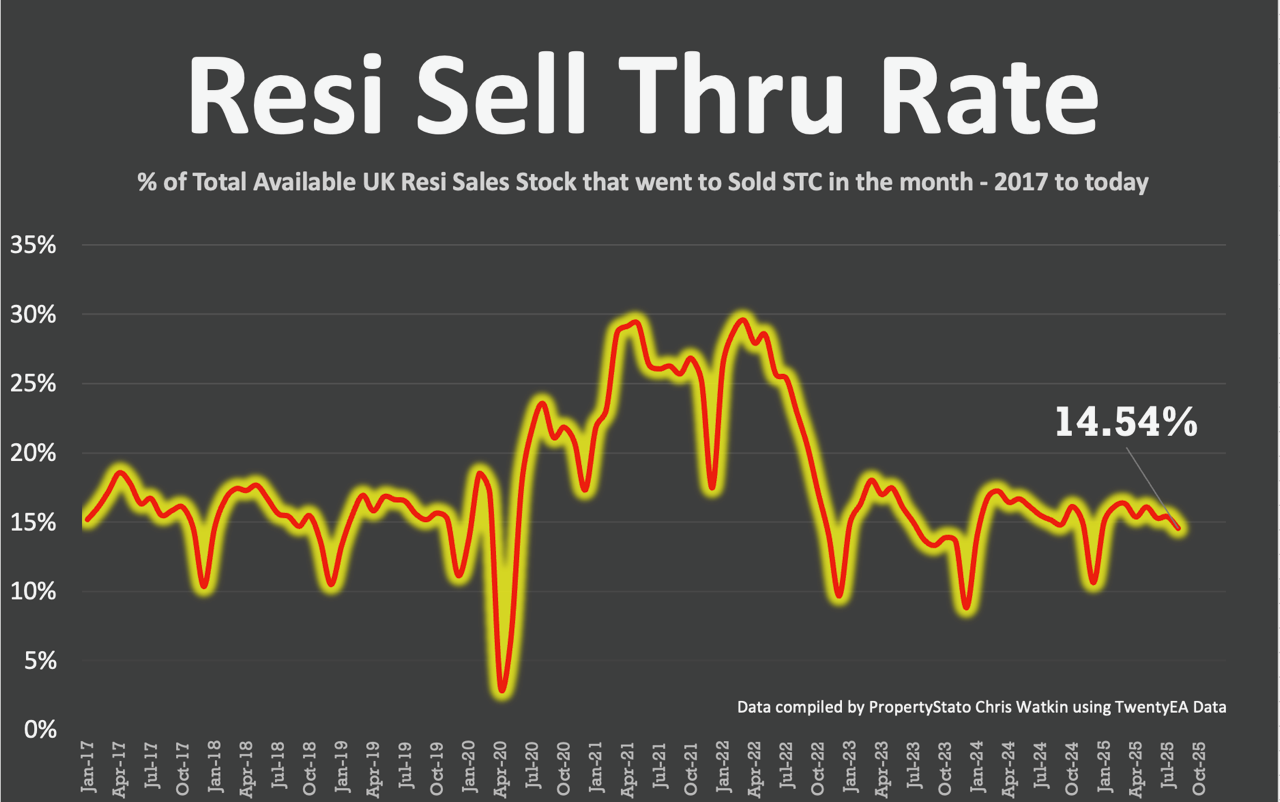
✅ Sell-Through Rate (July, in arrears)
14.5% of properties on agent’s books went SSTC in August.
Down from 15.4% in July Up, 15.3% in June & 16.1% in May
Pre Covid average: 15.5%.
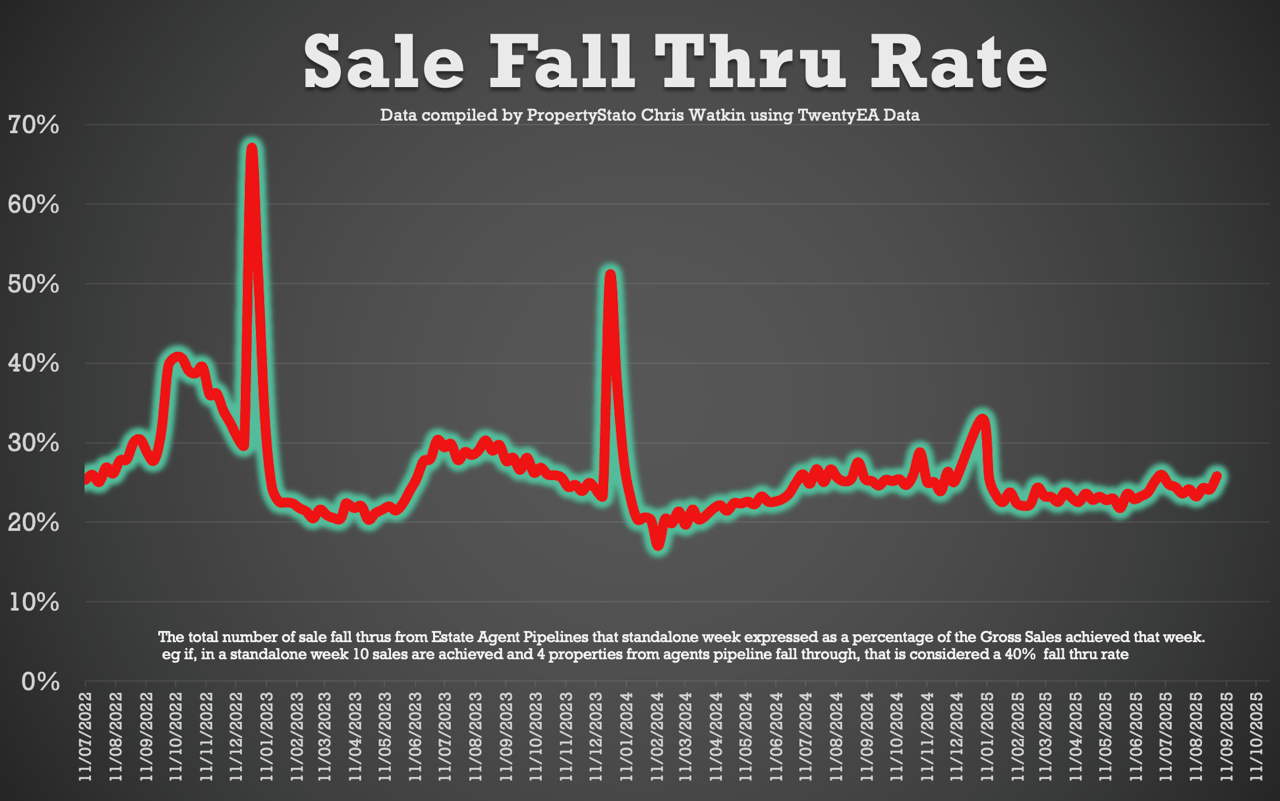
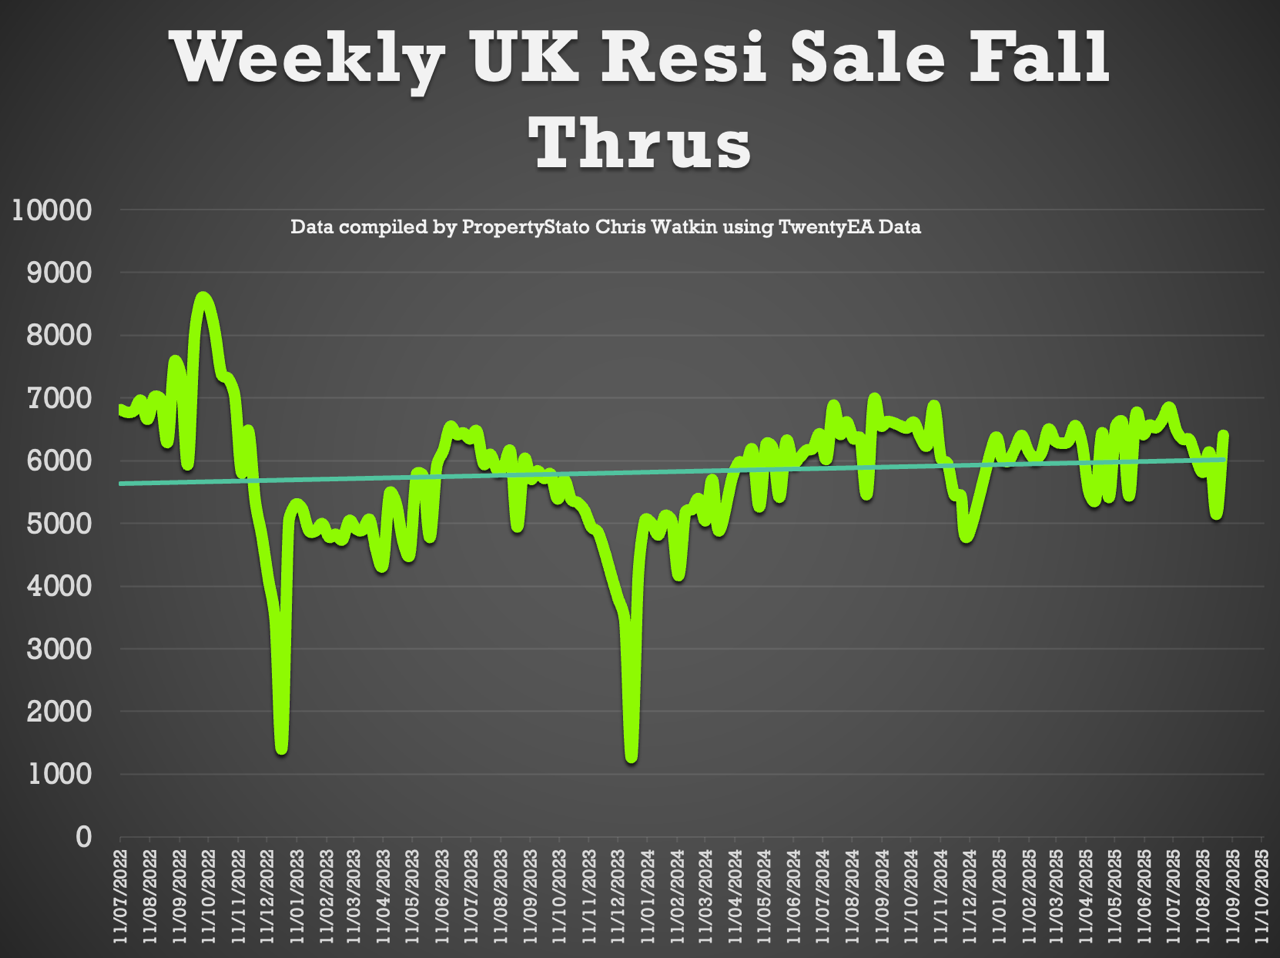
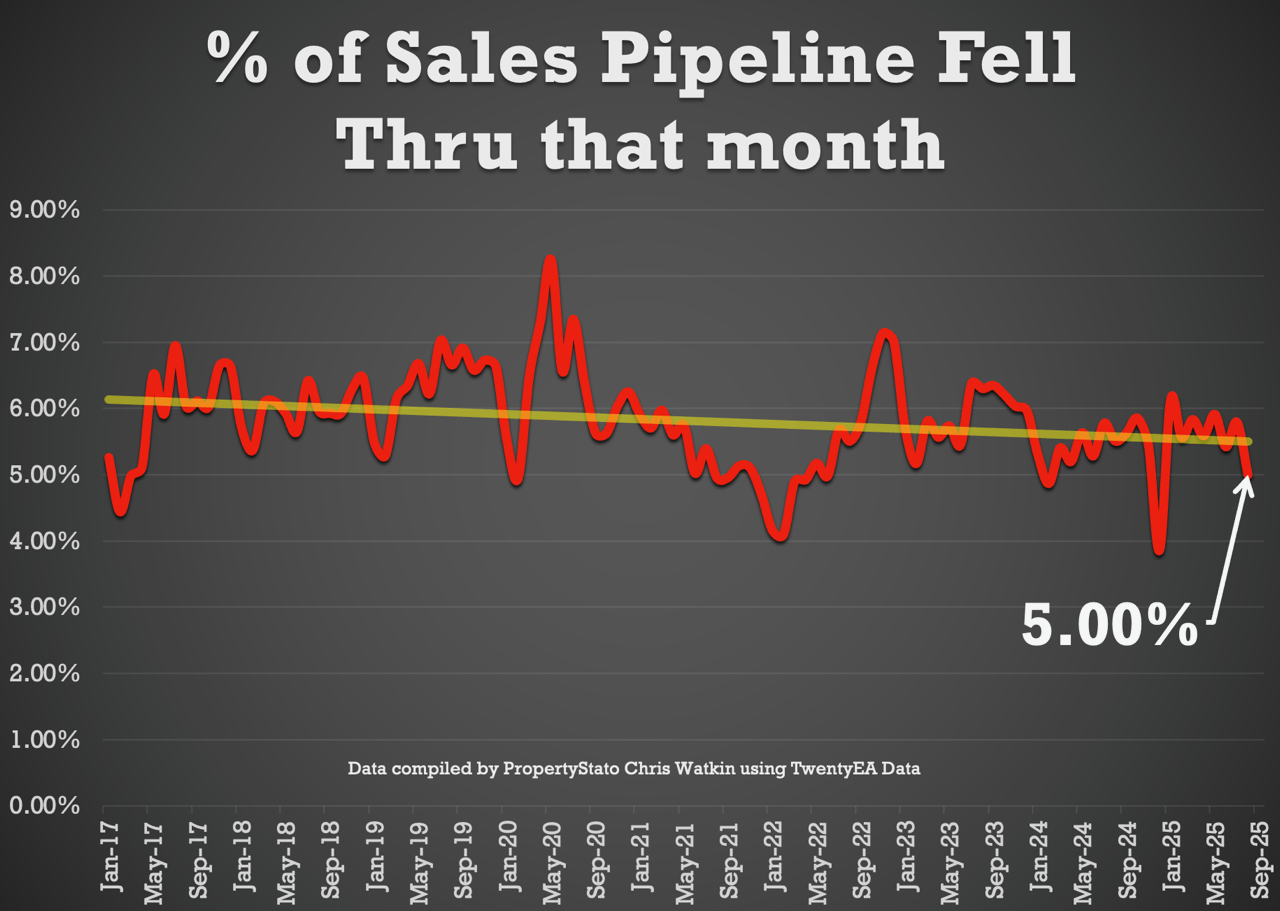
✅ Sale Fall-Throughs
6,408 fall-throughs last week (from a 510k SSTC pipeline (units)).
Weekly average for 2025: 6,212
Fall-thru rate as percentage of gross sales: 25.8% (up from 24.1% last week).
The 9 year long-term average of 24.2% (post-Truss chaos saw that at levels of 40%+).
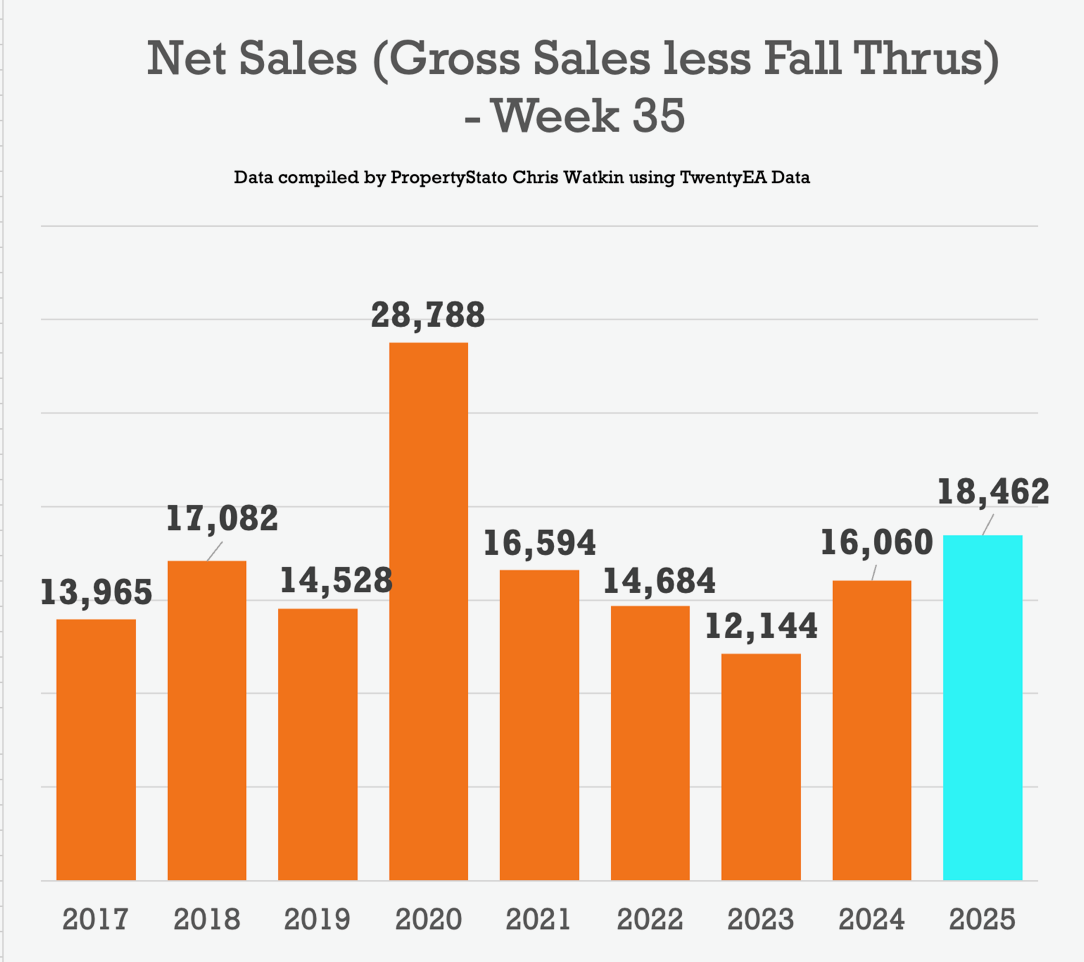
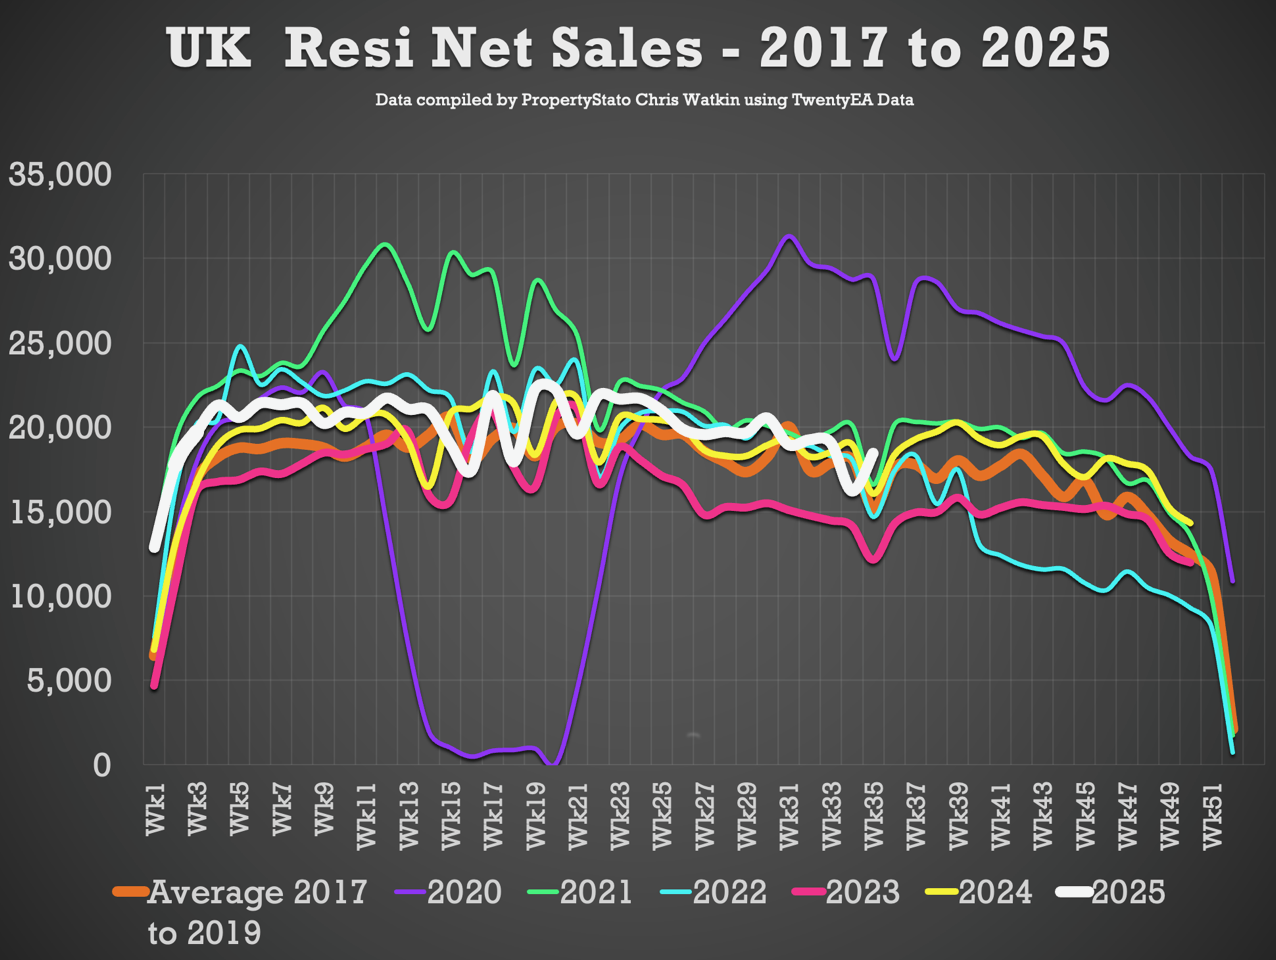
✅ Net Sales
18.5k net sales this week (Up from 16.2k last week – again Bank Holiday)
Week 35 average (last 9 years) 16.9k
Weekly average for 2025: 20k
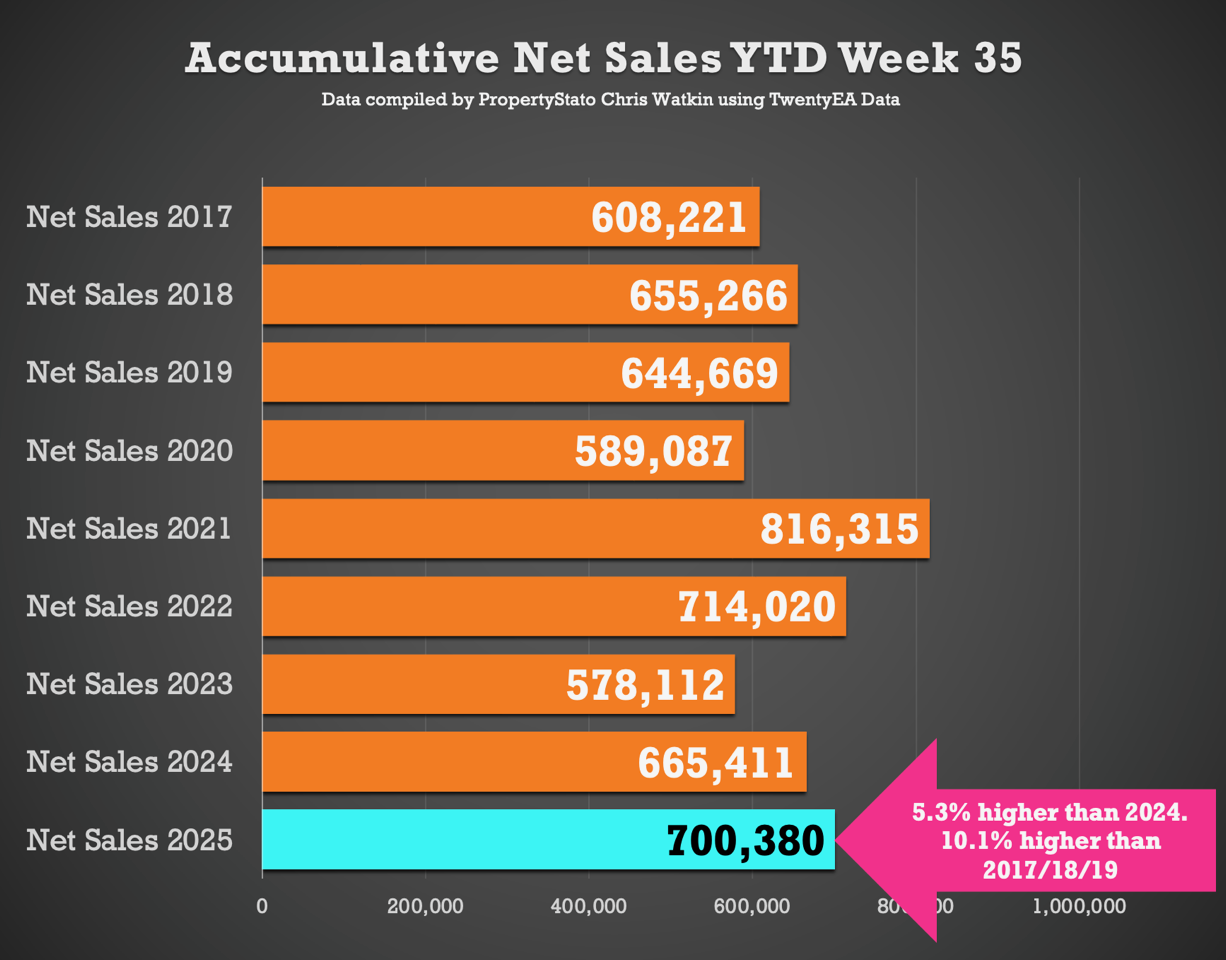
YTD Net Sales: 700k in 2025 which is 5.3% ahead of 2024 YTD figure of 665k and 10.1% up on 2017–19 YTD (636k).
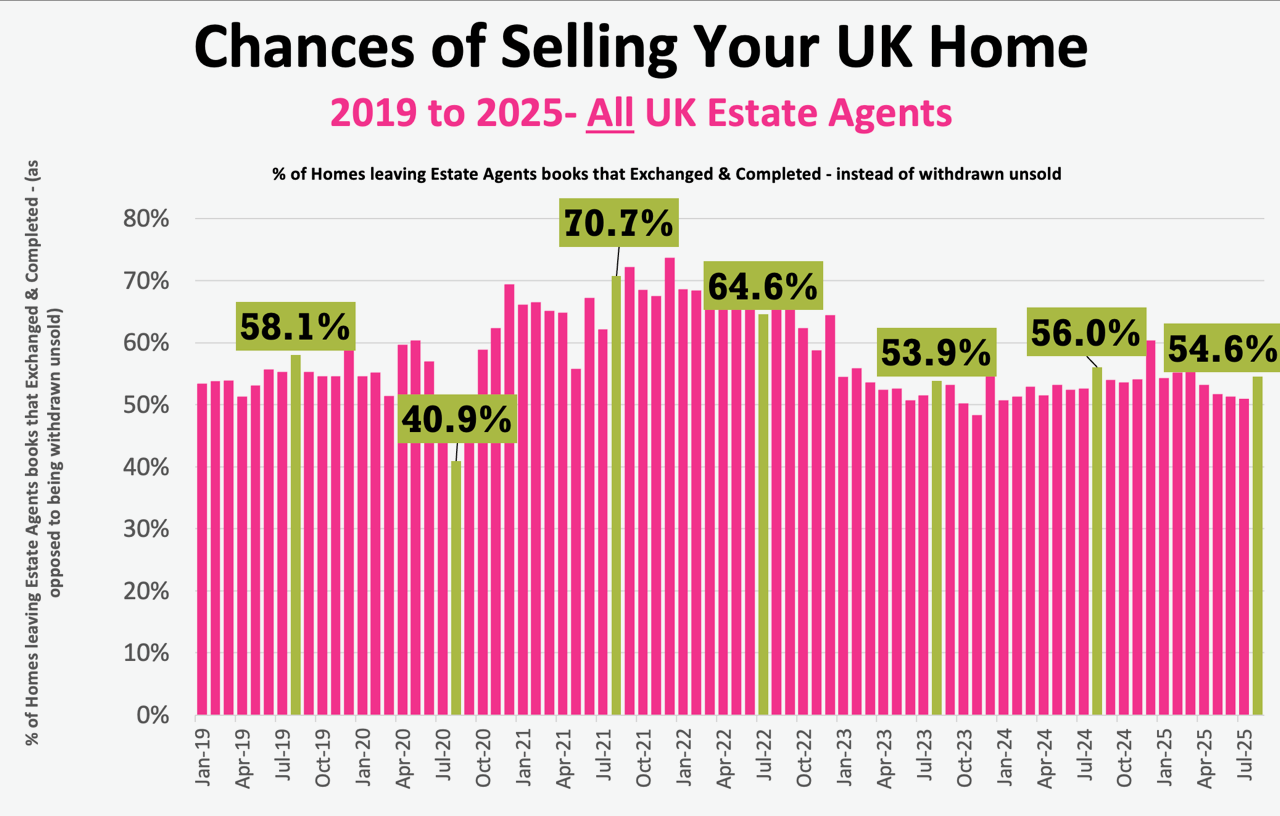
✅ % Chance the Home will Sell (month in arrears)
Preliminary August stats showed 54.9% of UK Homes that left the estate agents books in exchanged & completed contracts (ie the agent got paid and the home moved on completion), the remaining 45.1% left Estate Agent books, unsold and homeowner staying in their home. (Note this number will change throughout the month as more stats come in for August)
Comparison
July – 50.9%
Jun – 51.3%
May – 51.7%
April – 53.2%.
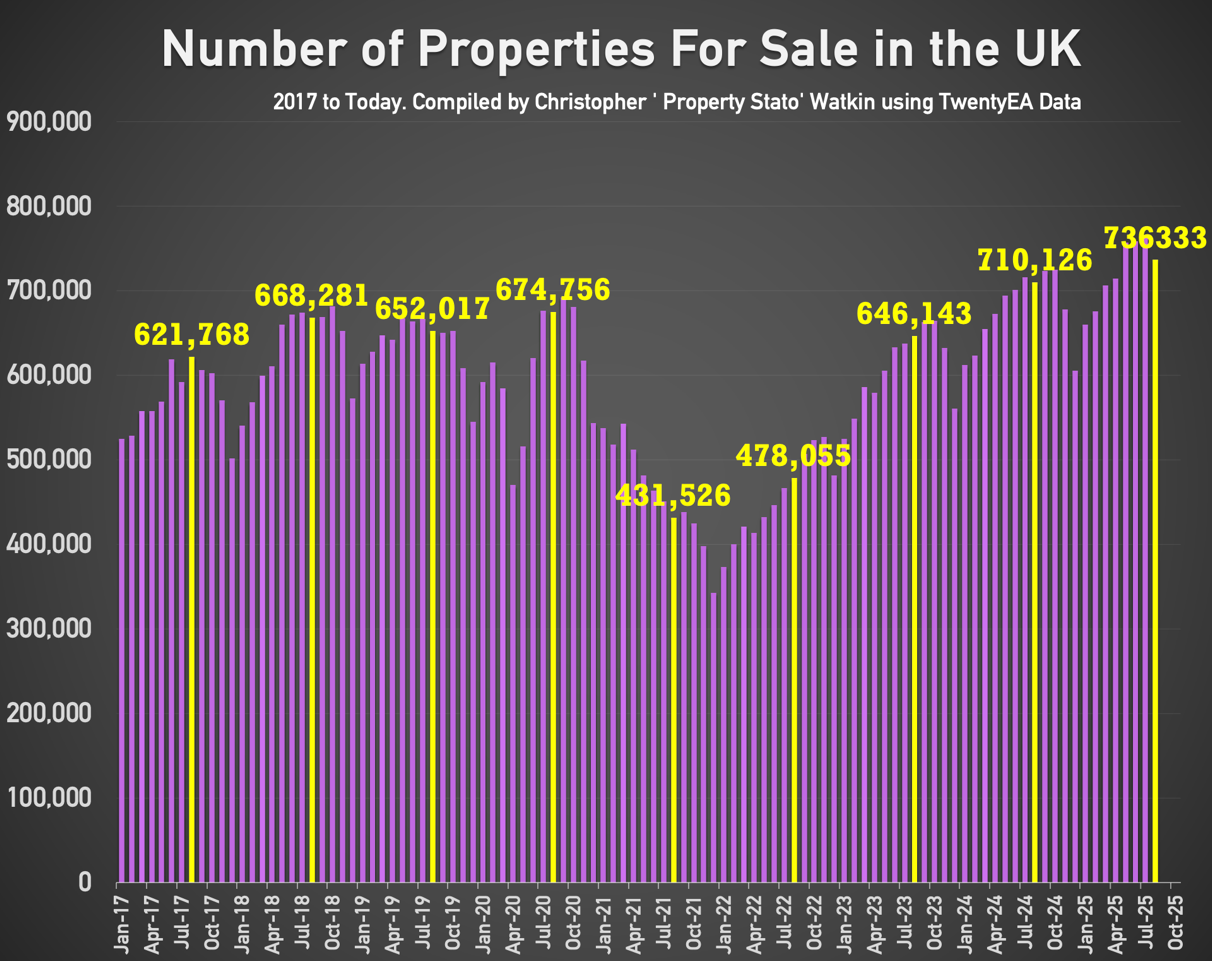
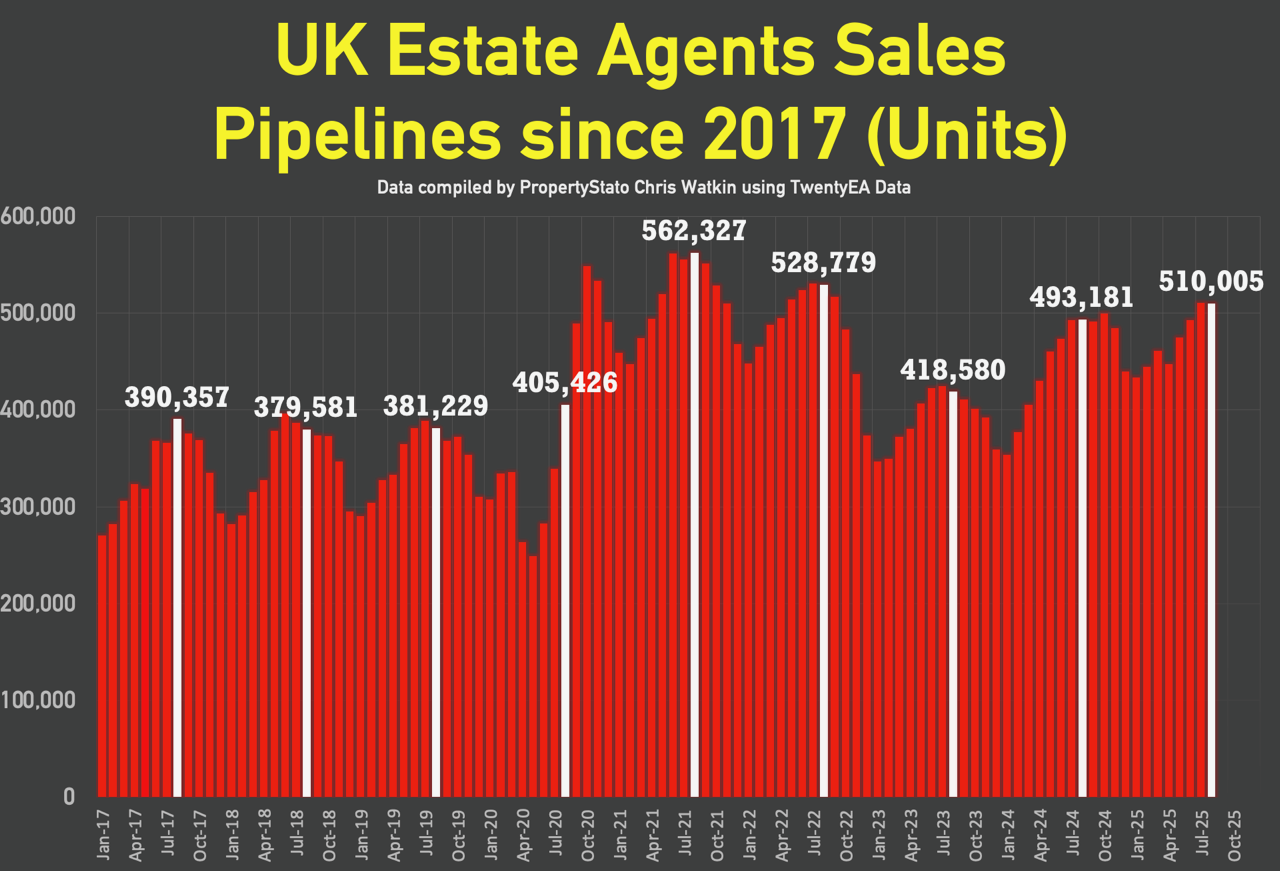
✅ Stock Levels (For Sale and Sales Pipeline) – 1st of the Month
763k homes on the market at the start of 1st Sept – 6.7% higher than 1st Sept 2024 (710k).
510k homes in Estate Agents sales pipelines on 1st Sept – 3.4% higher than than 1st August 2024.
✅ House Prices (measured by £/sq.ft)
£338.78/sqft on Sales Agreed in August 2025 – 1.41% higher than August 2024 and 14.25% higher than August 2020.
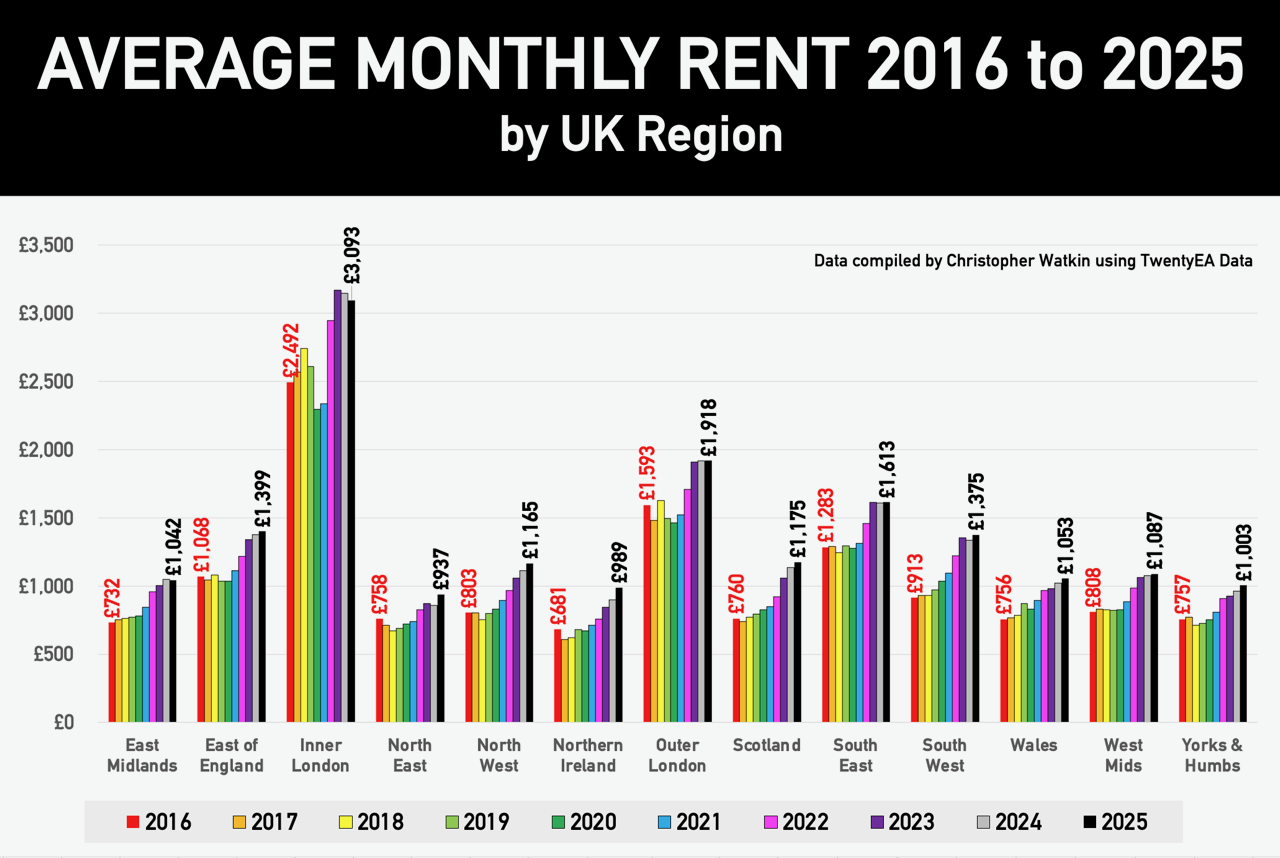
✅ Rental Stats (in arrears)
August 2025 with an average rent of £1,828 pcm (August ’24 – £1,779 pcm)
(YTD 2025 average is £1,774 pcm).
✅ Local Focus:
Bedford

Landlords running for the hills especially after this weeks RRB rubber stamping which sadly will crash the market.
You must be logged in to like or dislike this comments.
Click to login
Don't have an account? Click here to register
Private landlords and those that got in late and now have to finance their leverage at higher rates will soon depart the scene if not already. Banks and hedge funds and the likes of AirBnb will then clean up and become UK’s biggest landlords up and down the country.
You must be logged in to like or dislike this comments.
Click to login
Don't have an account? Click here to register