

This week, I’m joined by Steph Walker as we delve into the key property market headlines for the 13th week of 2025 ending on 6th April 2025.
✅ Listings (New Properties on the Market)
41.3k new listings this week (last week 39.7k)
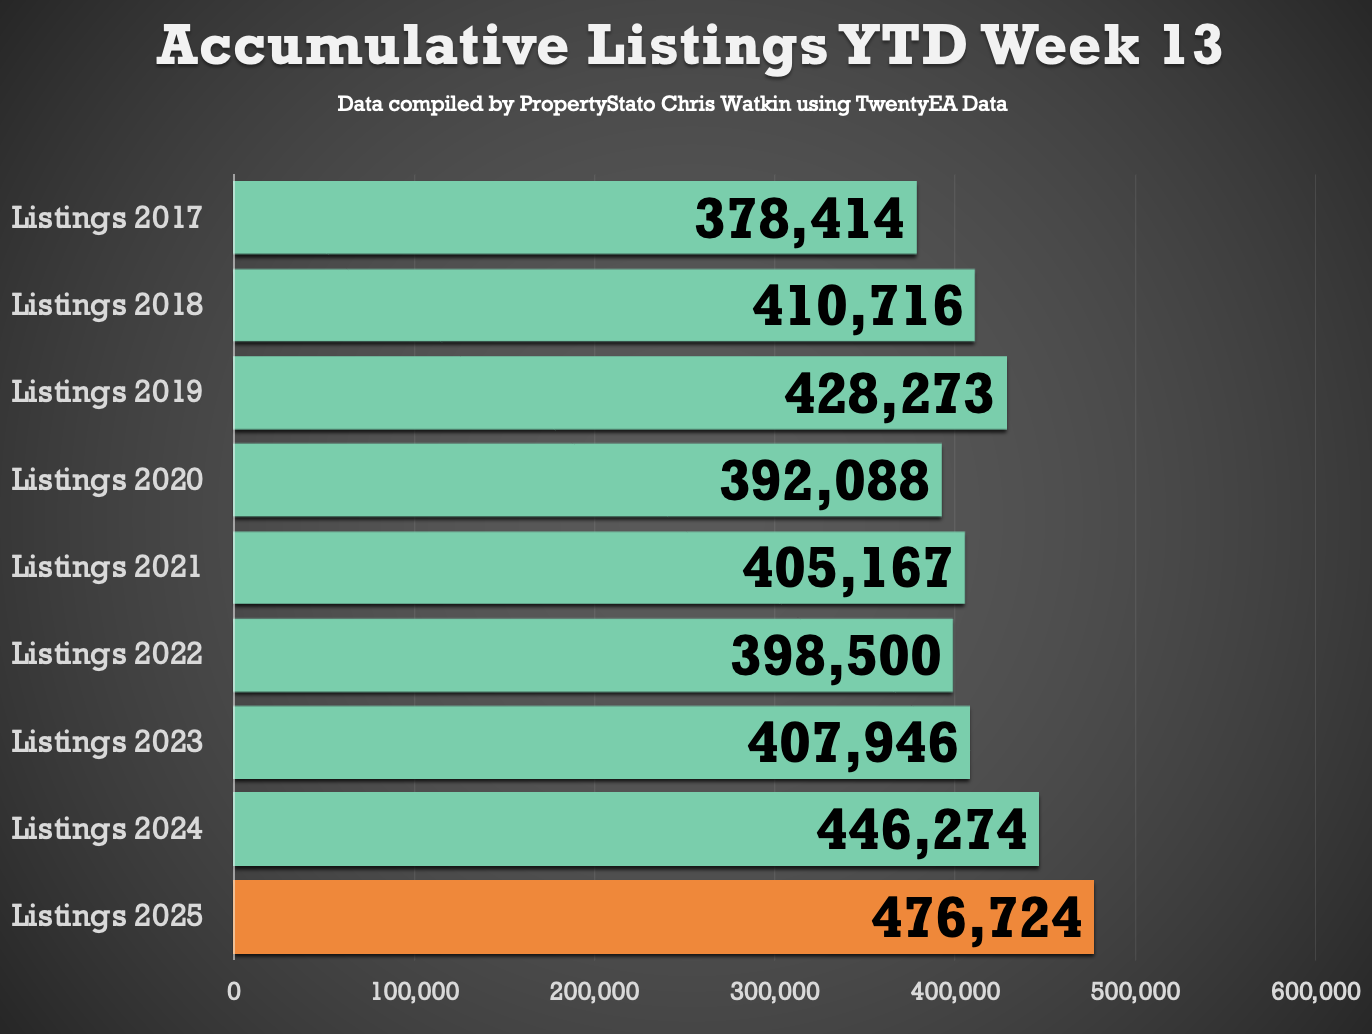
That’s 7% higher than Week 13 of 2024 YTD and 10% higher YTD compared to 2017/18/19. 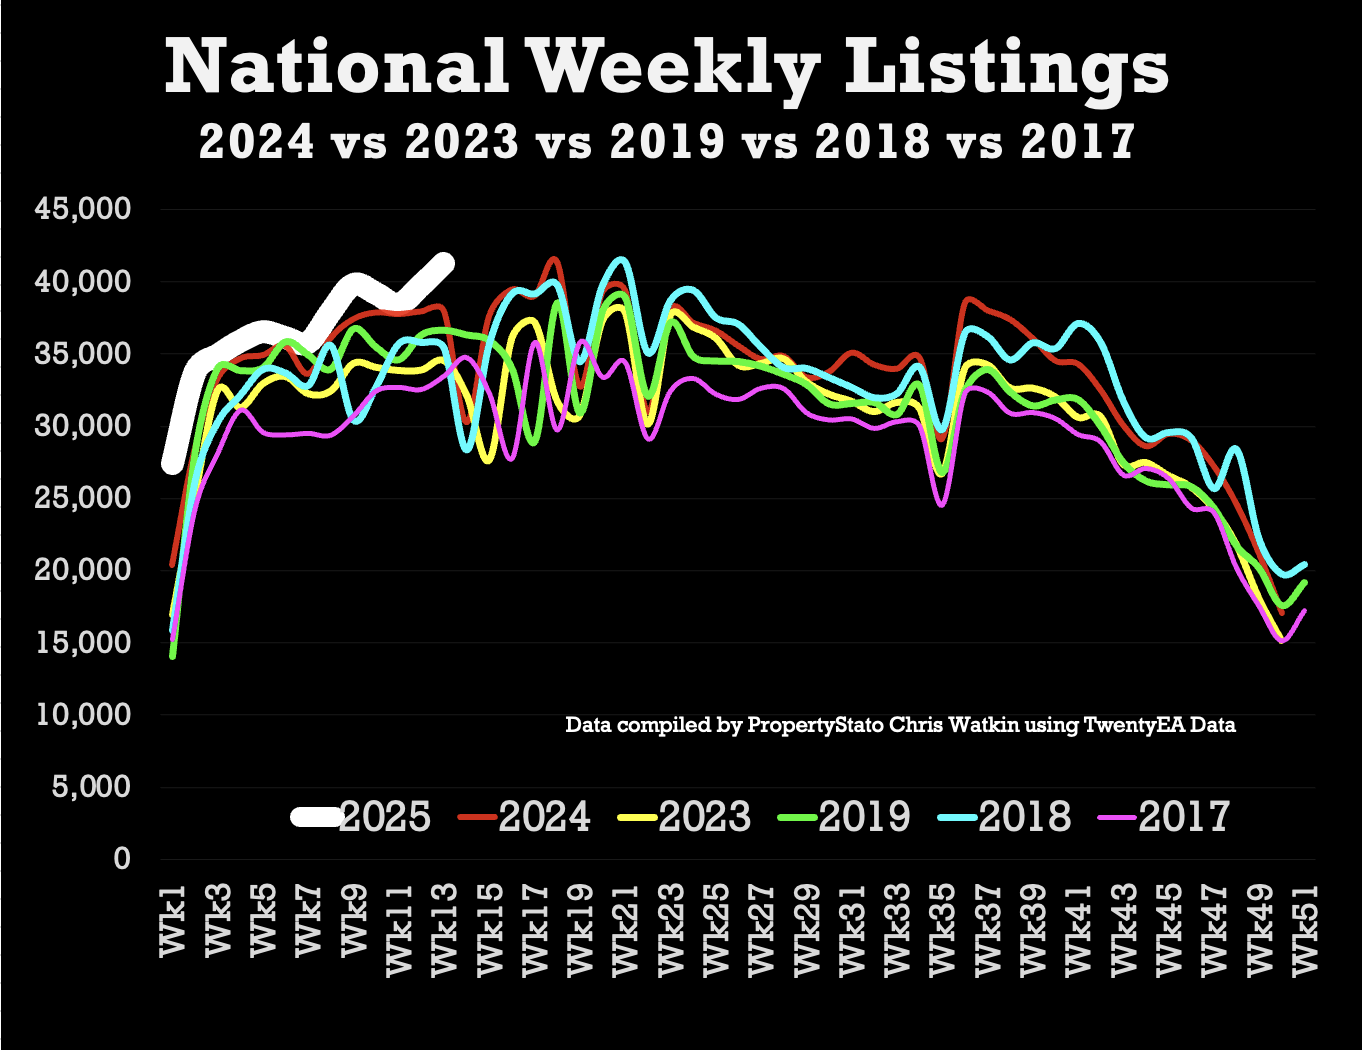
✅ Price Reductions (% of Resi Stock)
26.6k Price Reductions this week – meaning an approx run rate of 1 in 7.46 of Resi Sales stock per month is being reduced (which represents 13.4%).
For comparison, 12.1% average in 2024, though the long-term 5-year average is 10.6%. 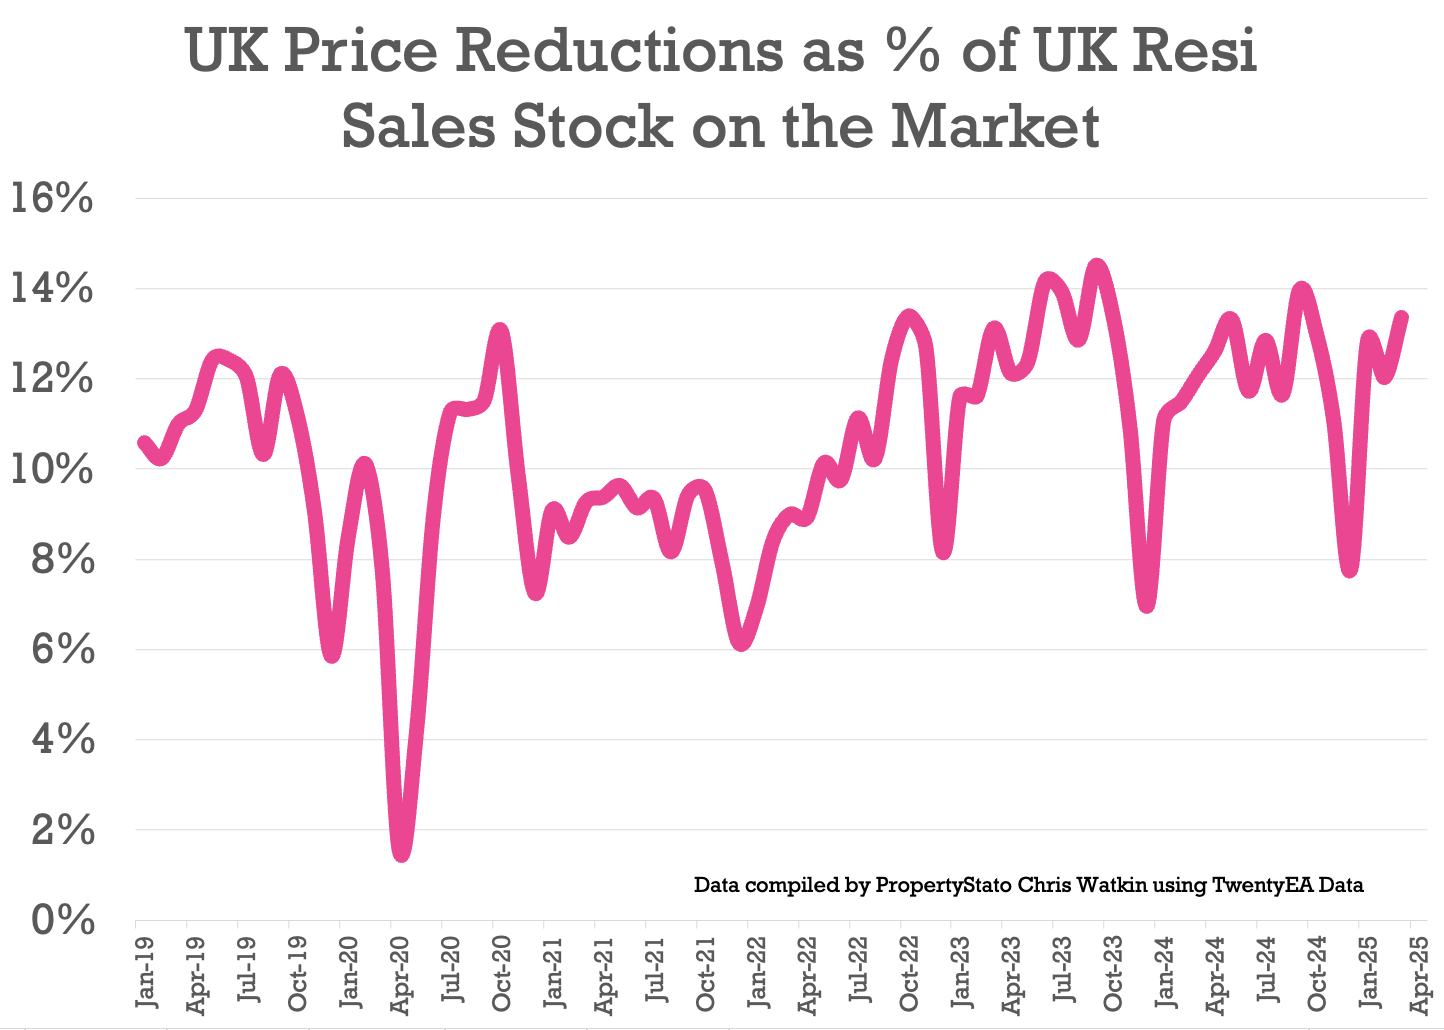
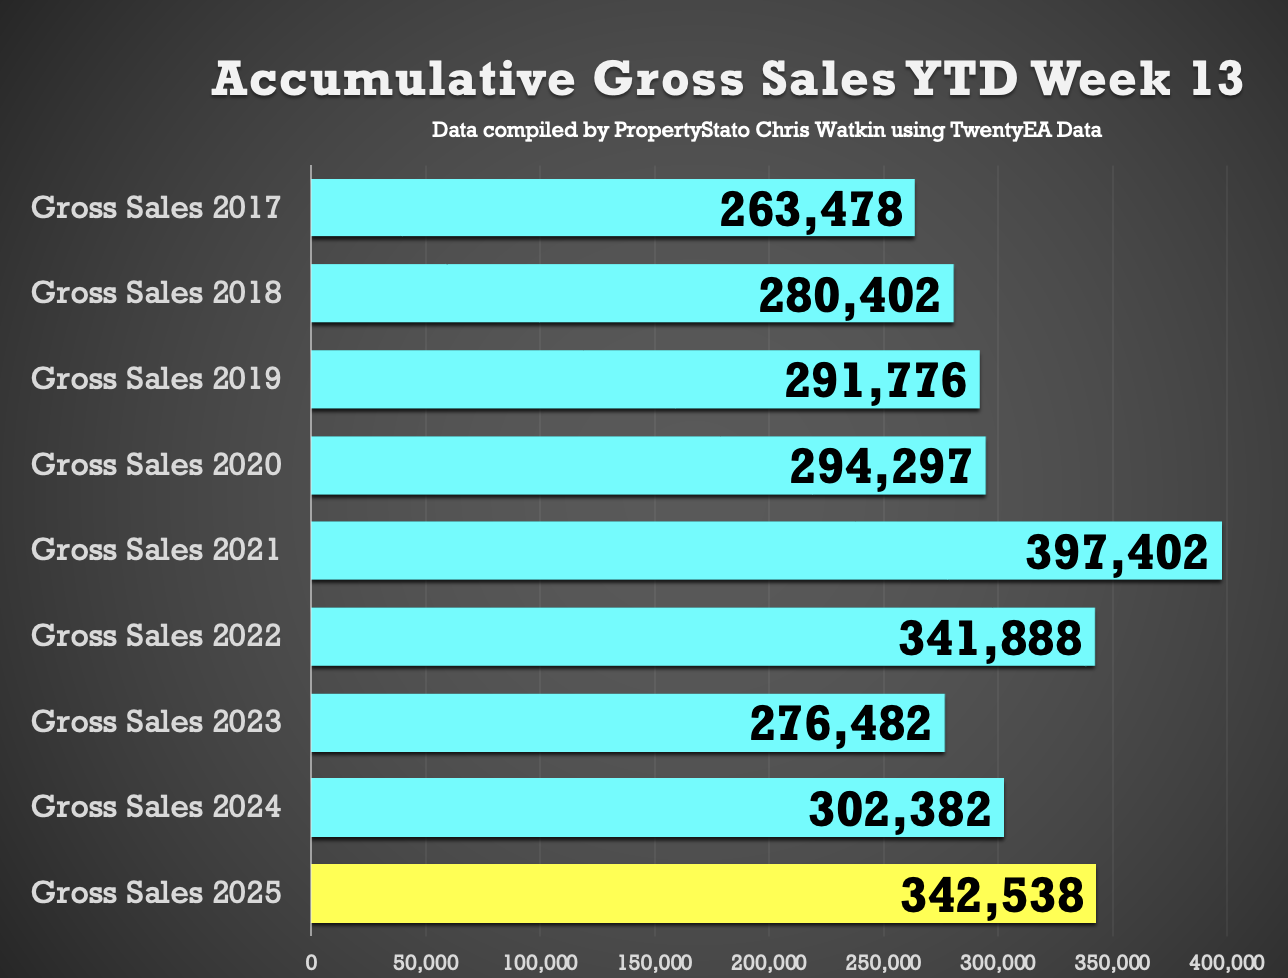
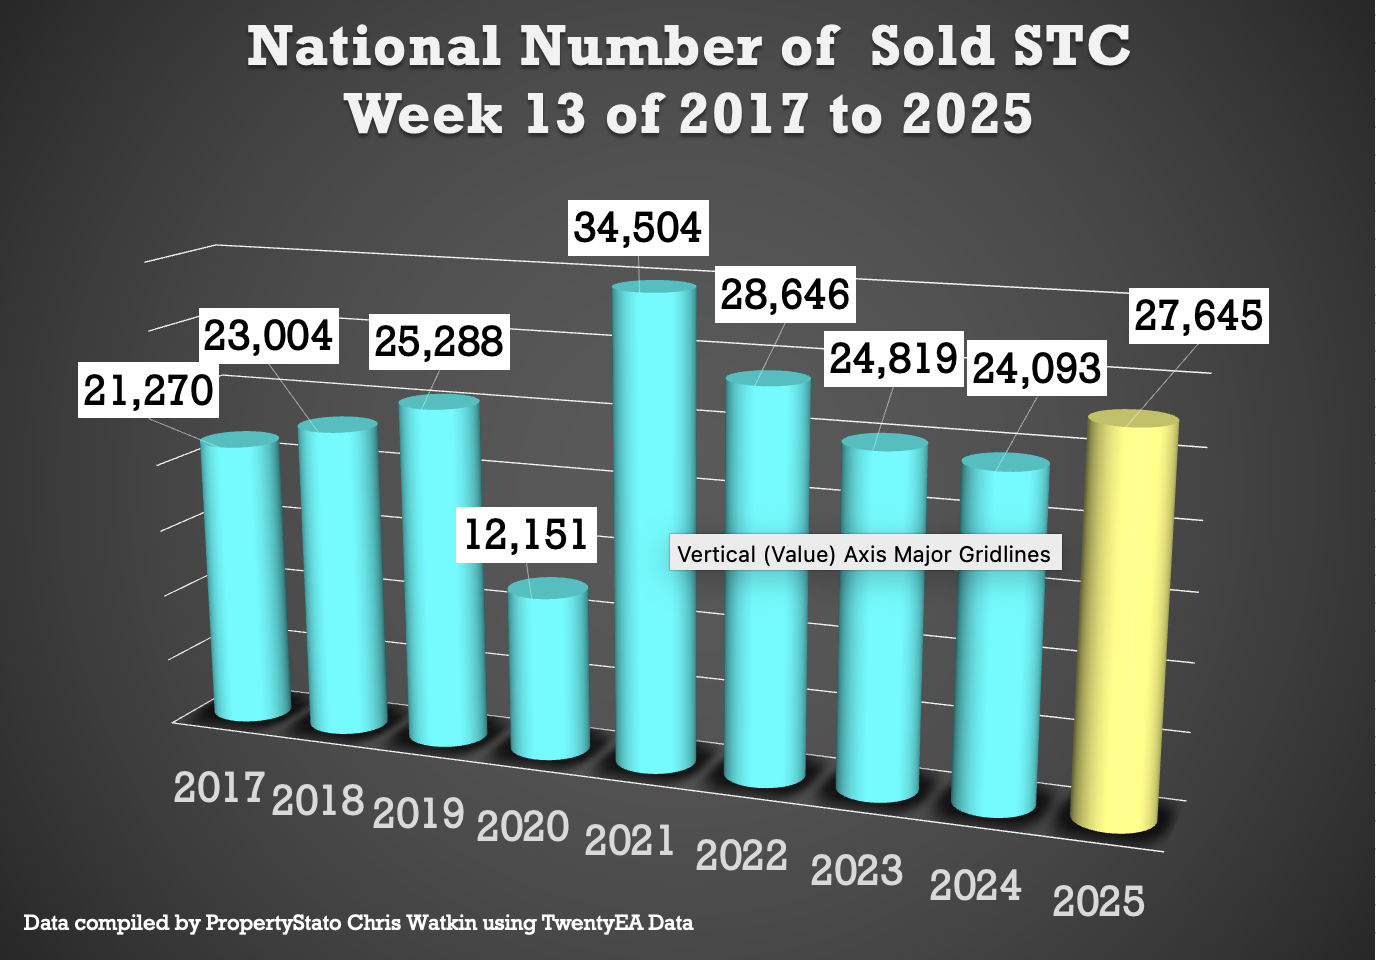
✅ Total Gross Sales (Agreed Sales)
27.6k UK homes sold STC this week, down slightly from last week’s near three-year record breaking week of 28k.
That’s 13% higher YTD compared to 2024 and 23% higher than 2017/18/19 YTD levels. 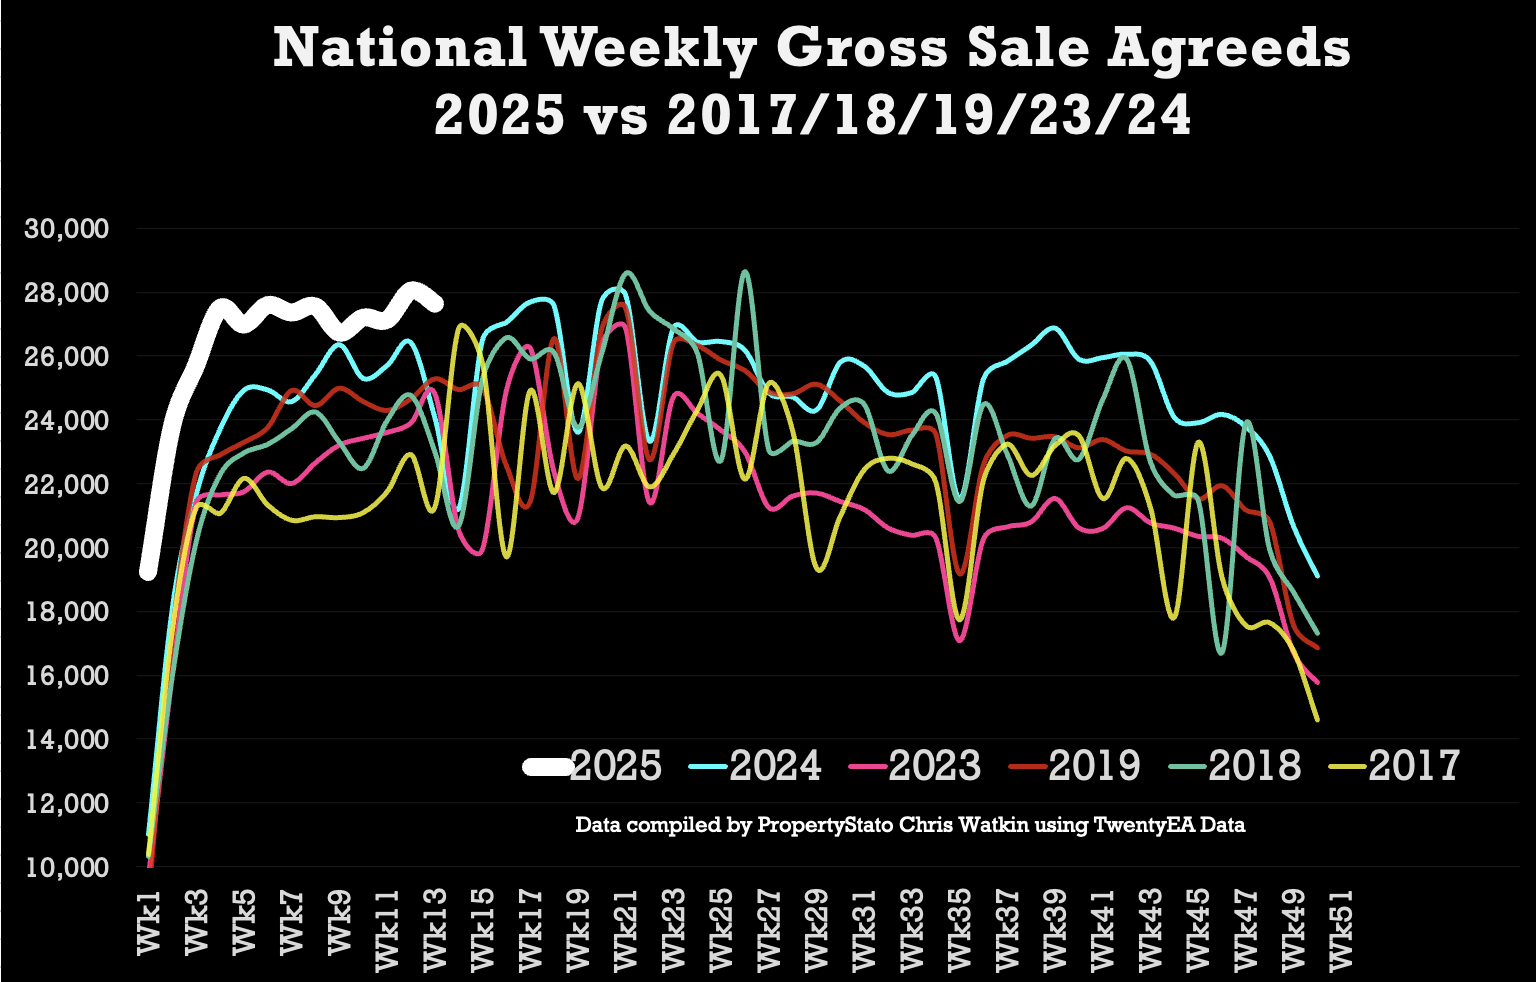
✅ Sell-Through Rate (Monthly in Arrears)
March’s sale run rate of 16.3% of Resi stock sold STC (ie 16.3% of estate agents’ properties on the market went sale agreed). 2024 monthly average: 15.3%. Long-term eight-year average: 17.9%. 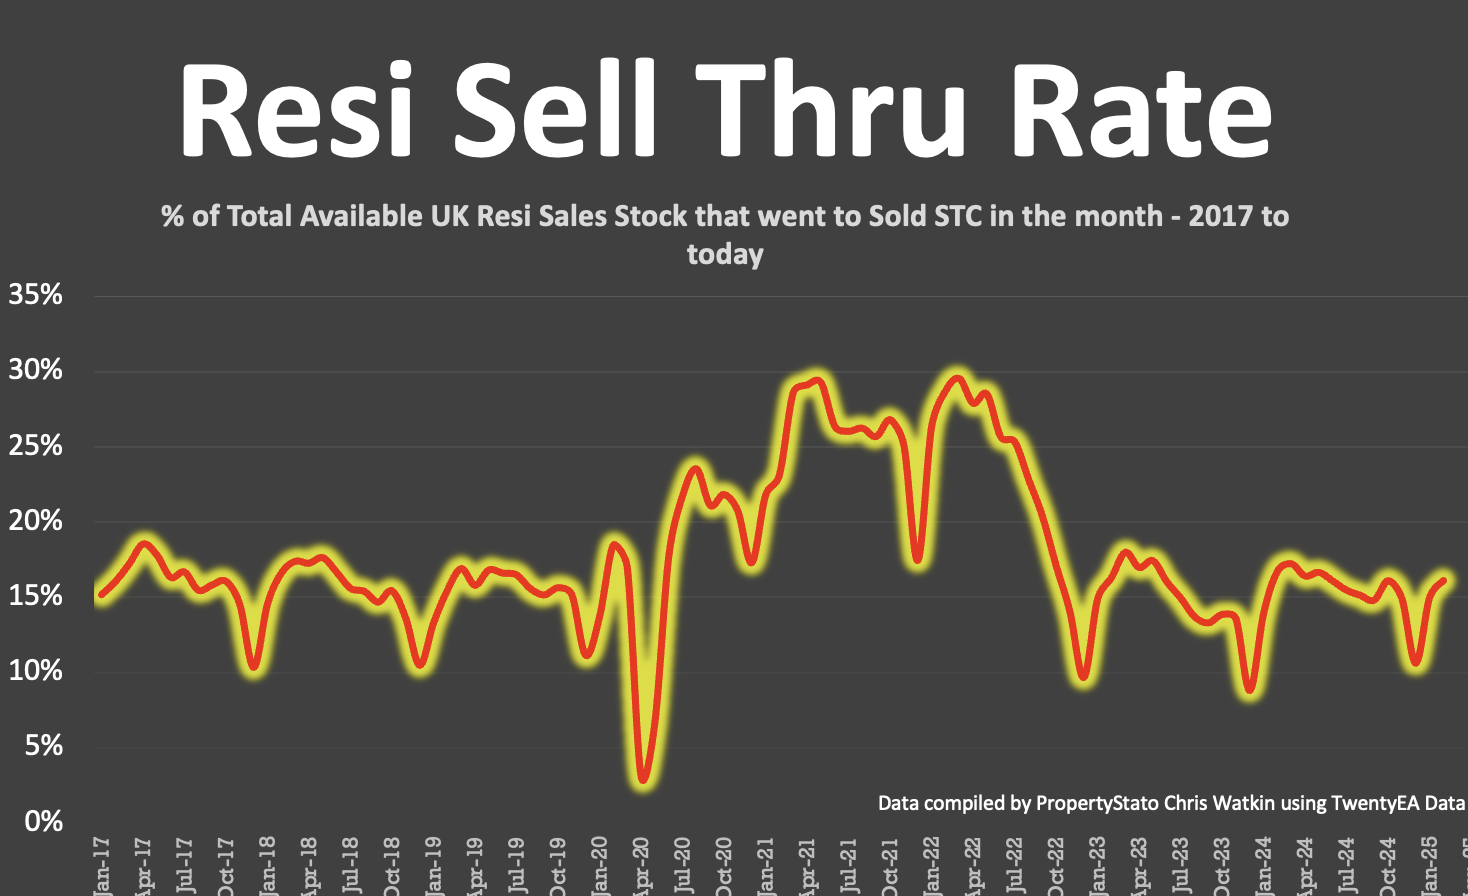
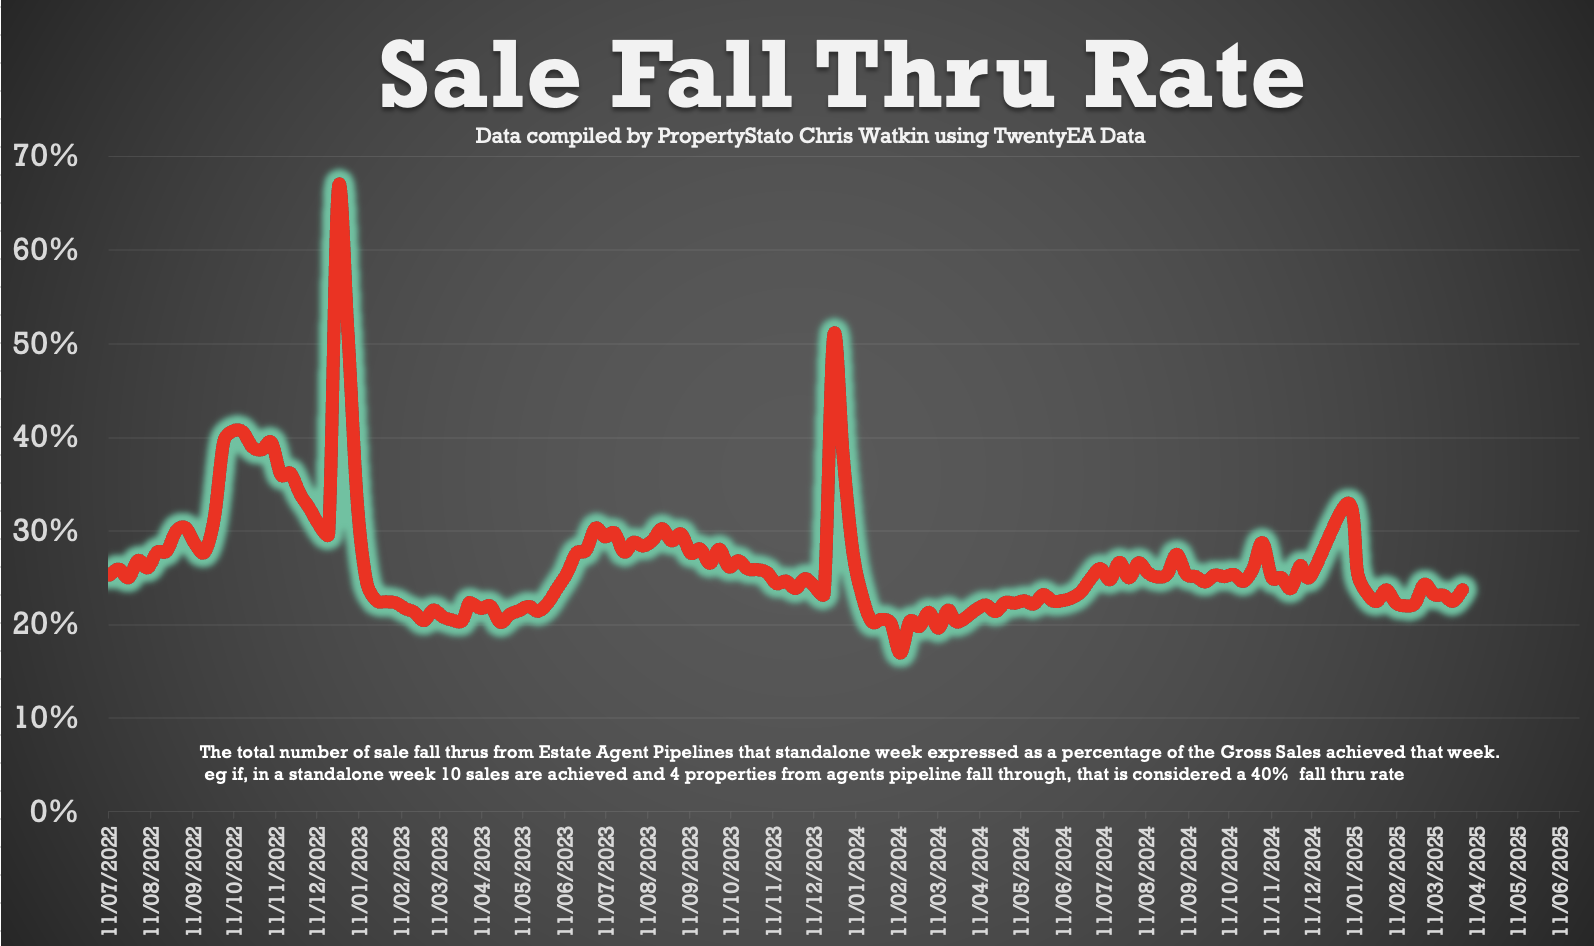
✅ Sale Fall-Throughs
6,563 Sale fall-throughs last week from Resi Sale Sales Pipeline of 467,414 homes sale agreed (sold STC).
Another method is that week’s sale fall-throughs as a % of gross sales that week. This week, that is 23.7% (last week 22.5%). Just above the seven-year average of 24.2%, yet well below the 40%+ levels post-Truss Budget (Autumn 2022).
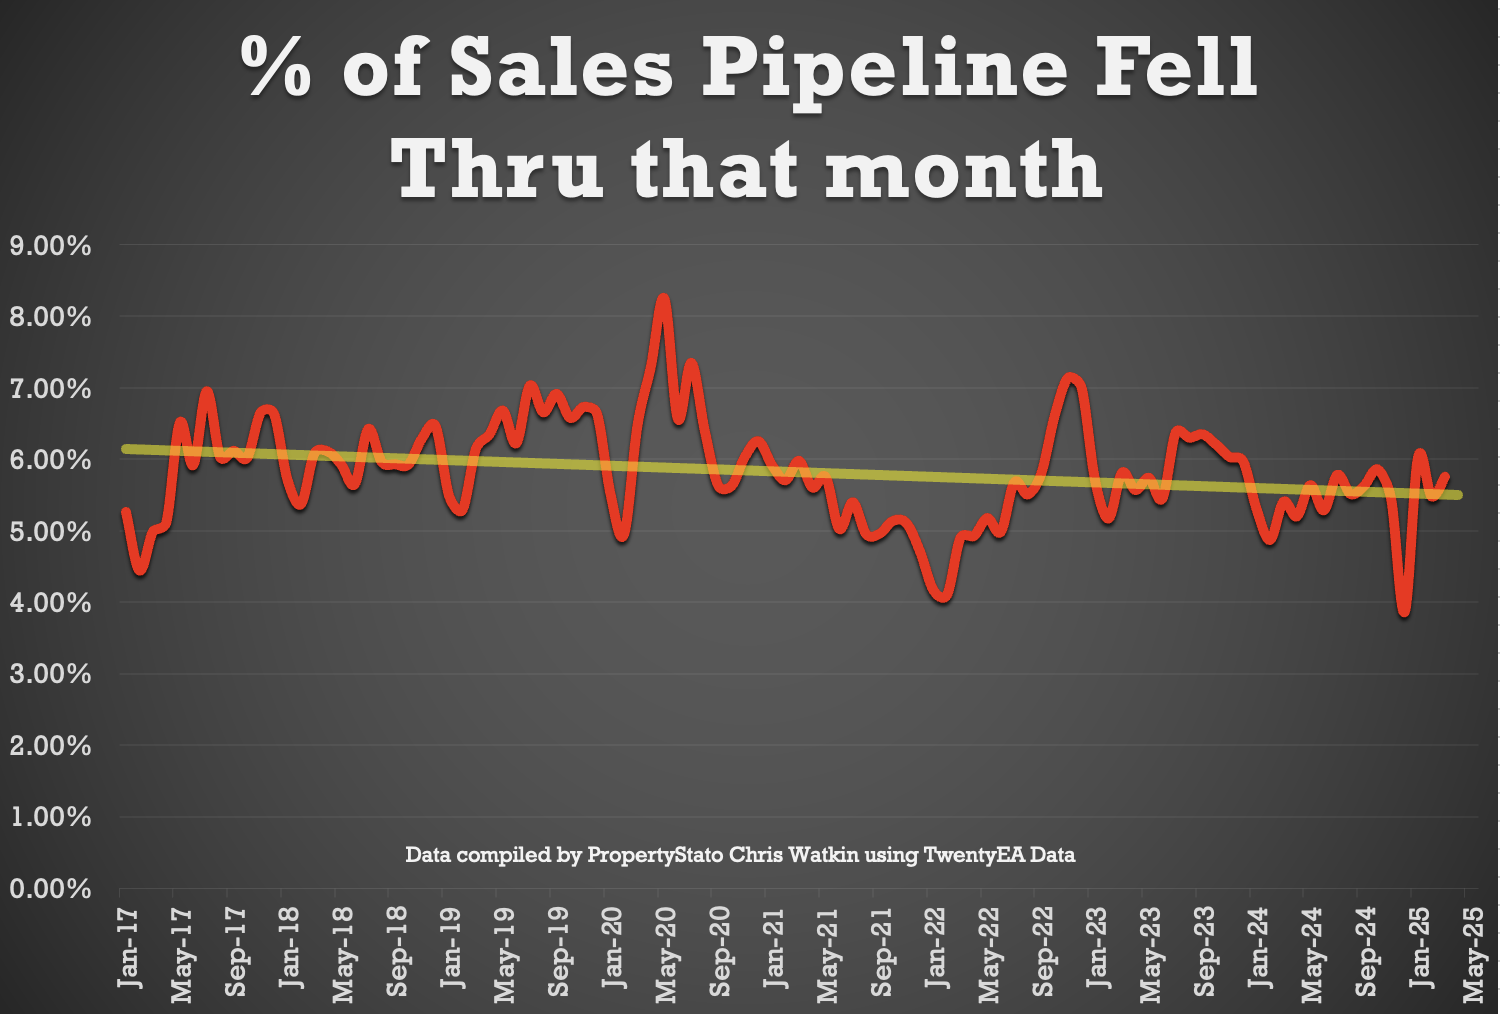
Last month, as a whole, 5.75% of sales in the UK agents’ pipelines fell through. For comparison, 2024 average: 5.36%. 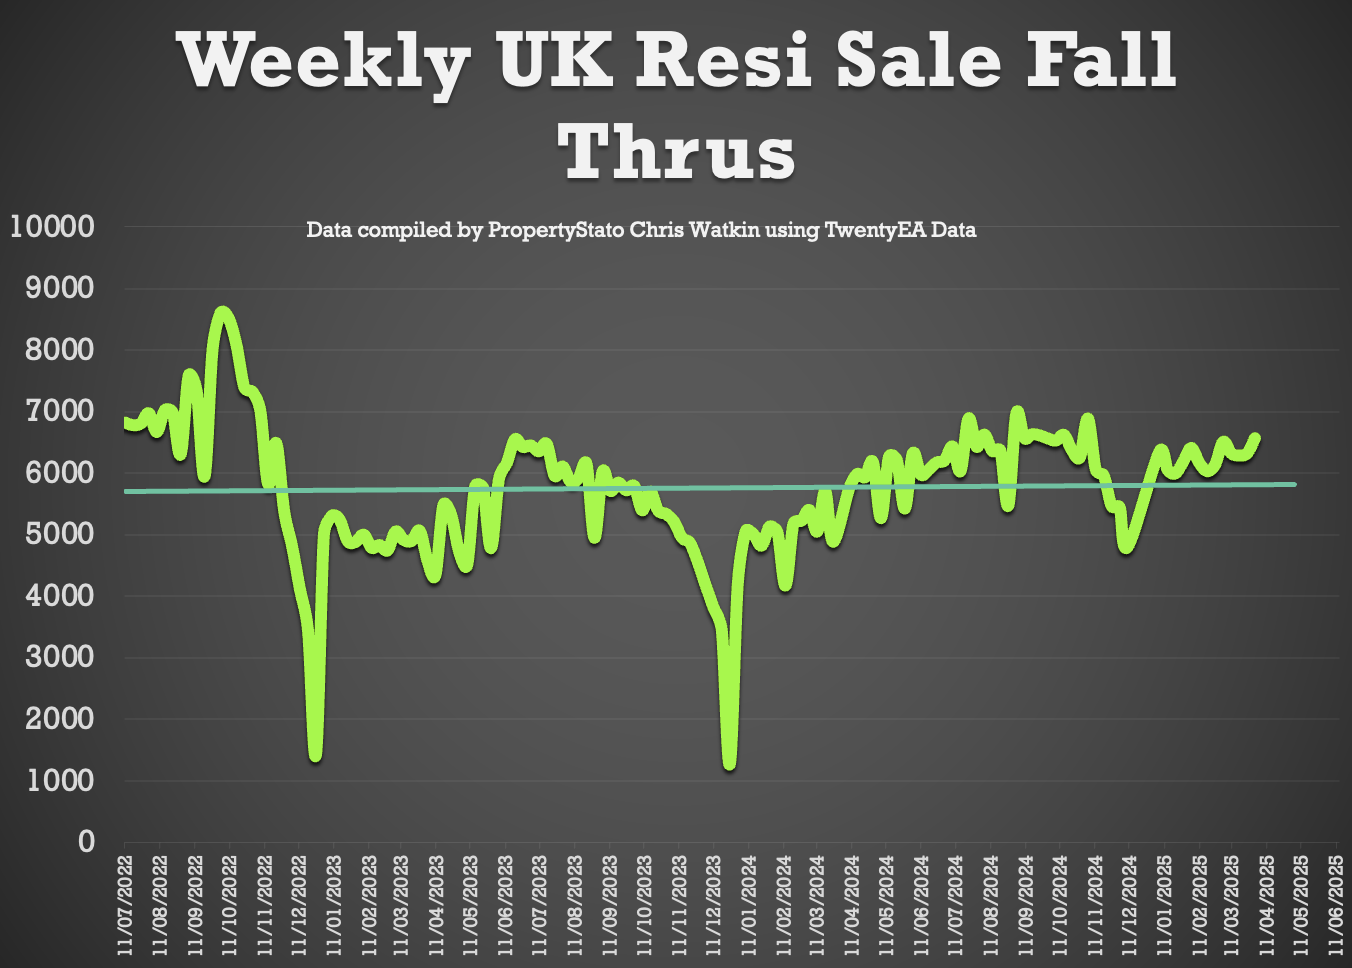
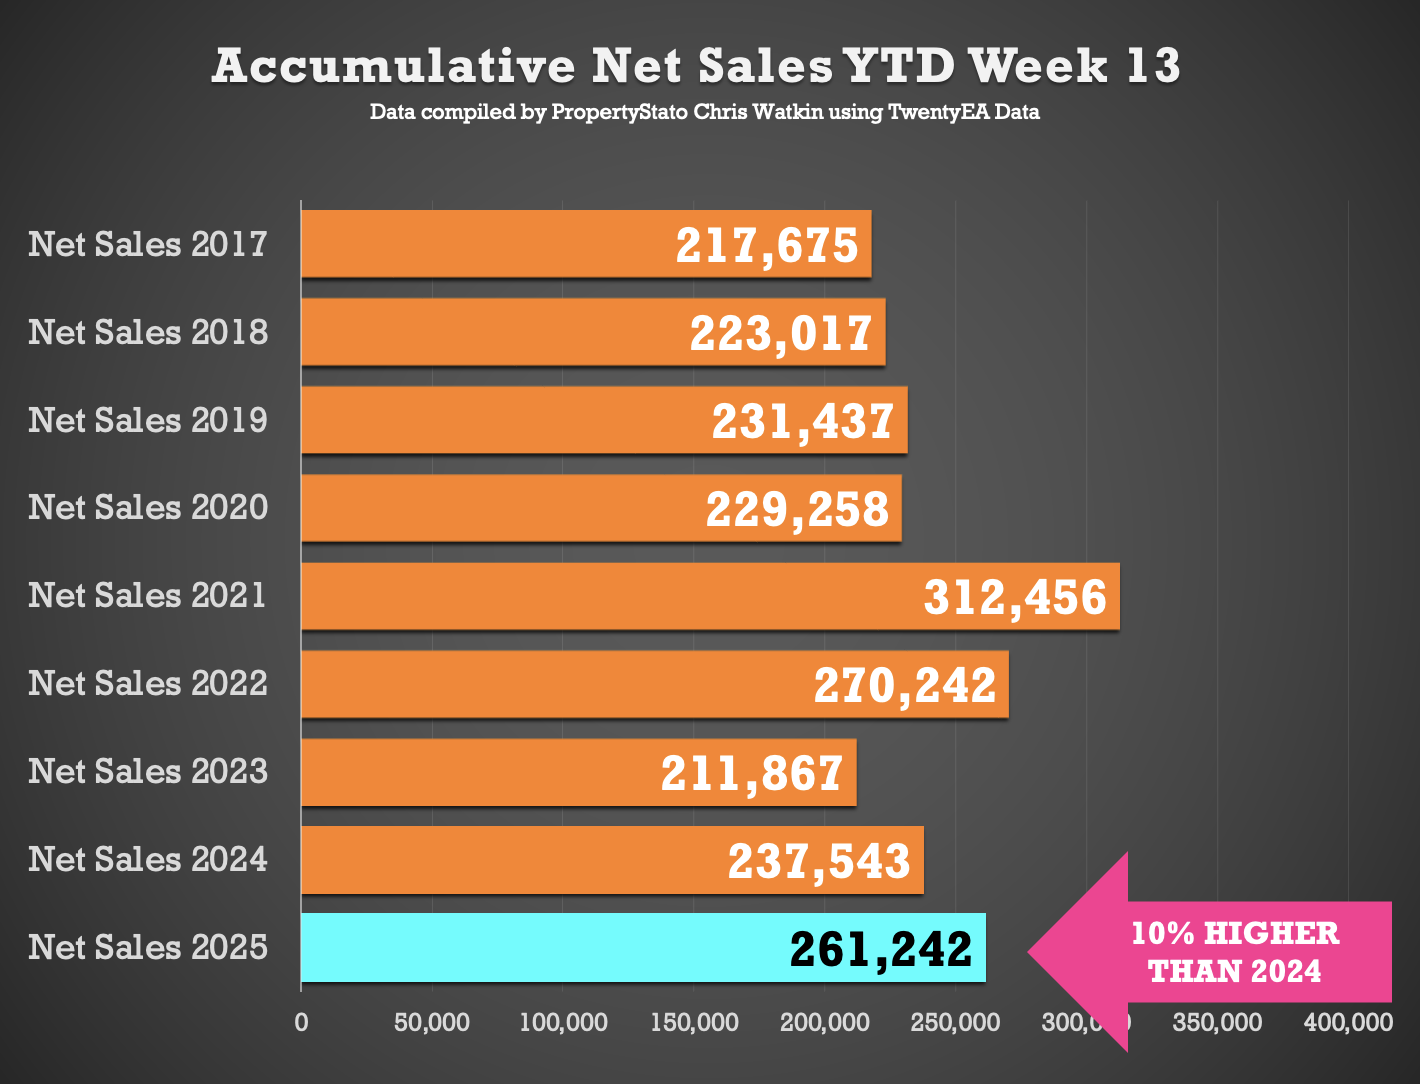
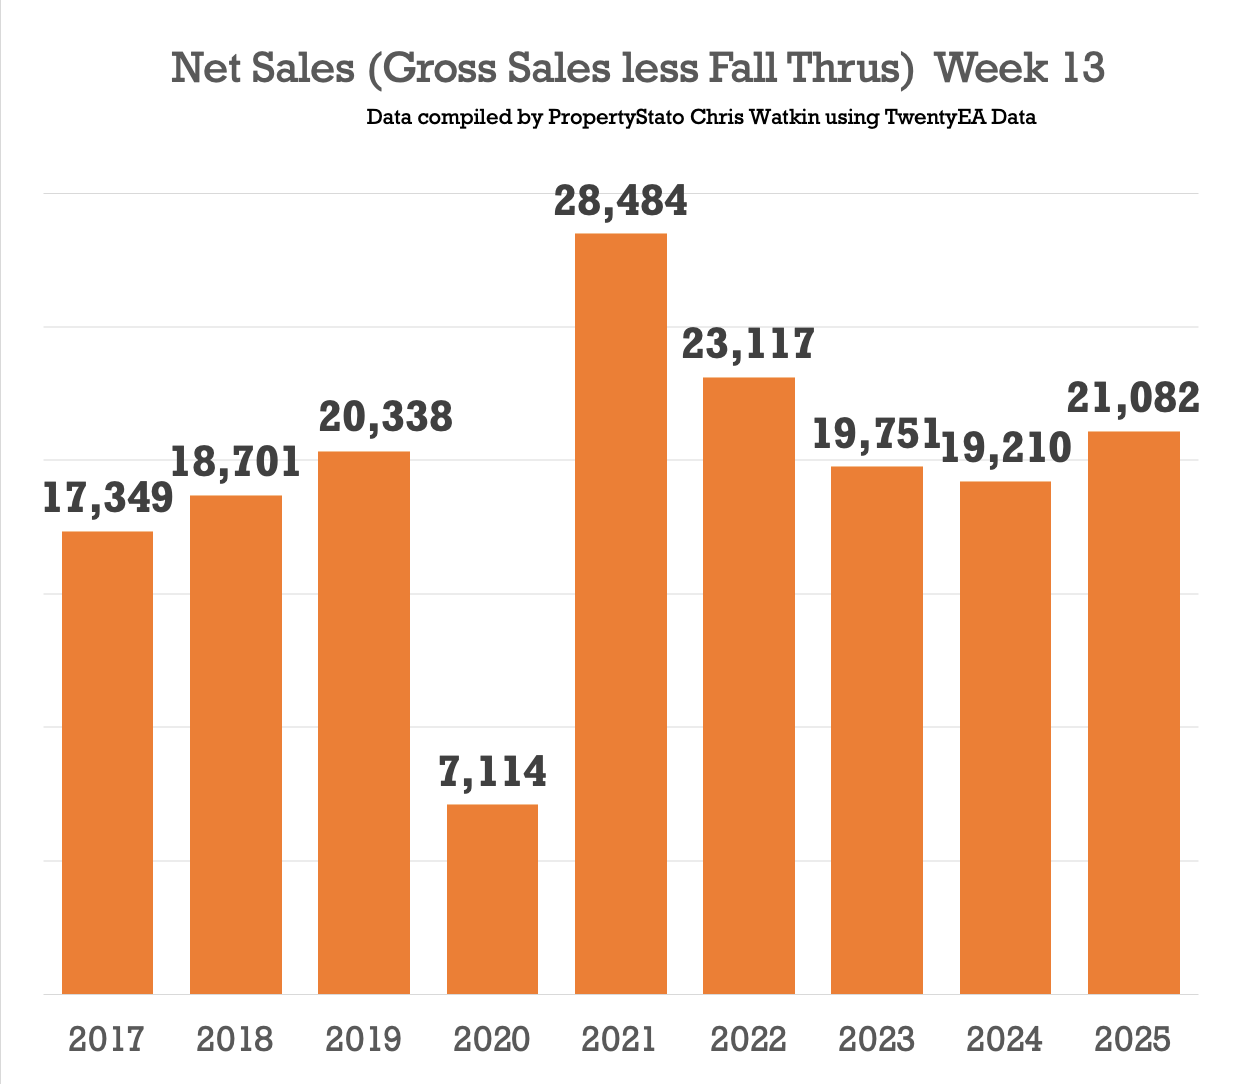
✅ Net Sales (Gross sales for the week less Sale Fall Thrus for the week)
21k net sales this week (21.7k last week), compared 2025 weekly average of 20.1k.
2025 YTD is 10% higher than compared to 2024 YTD and 16.6% higher than YTD 2017/18/19. 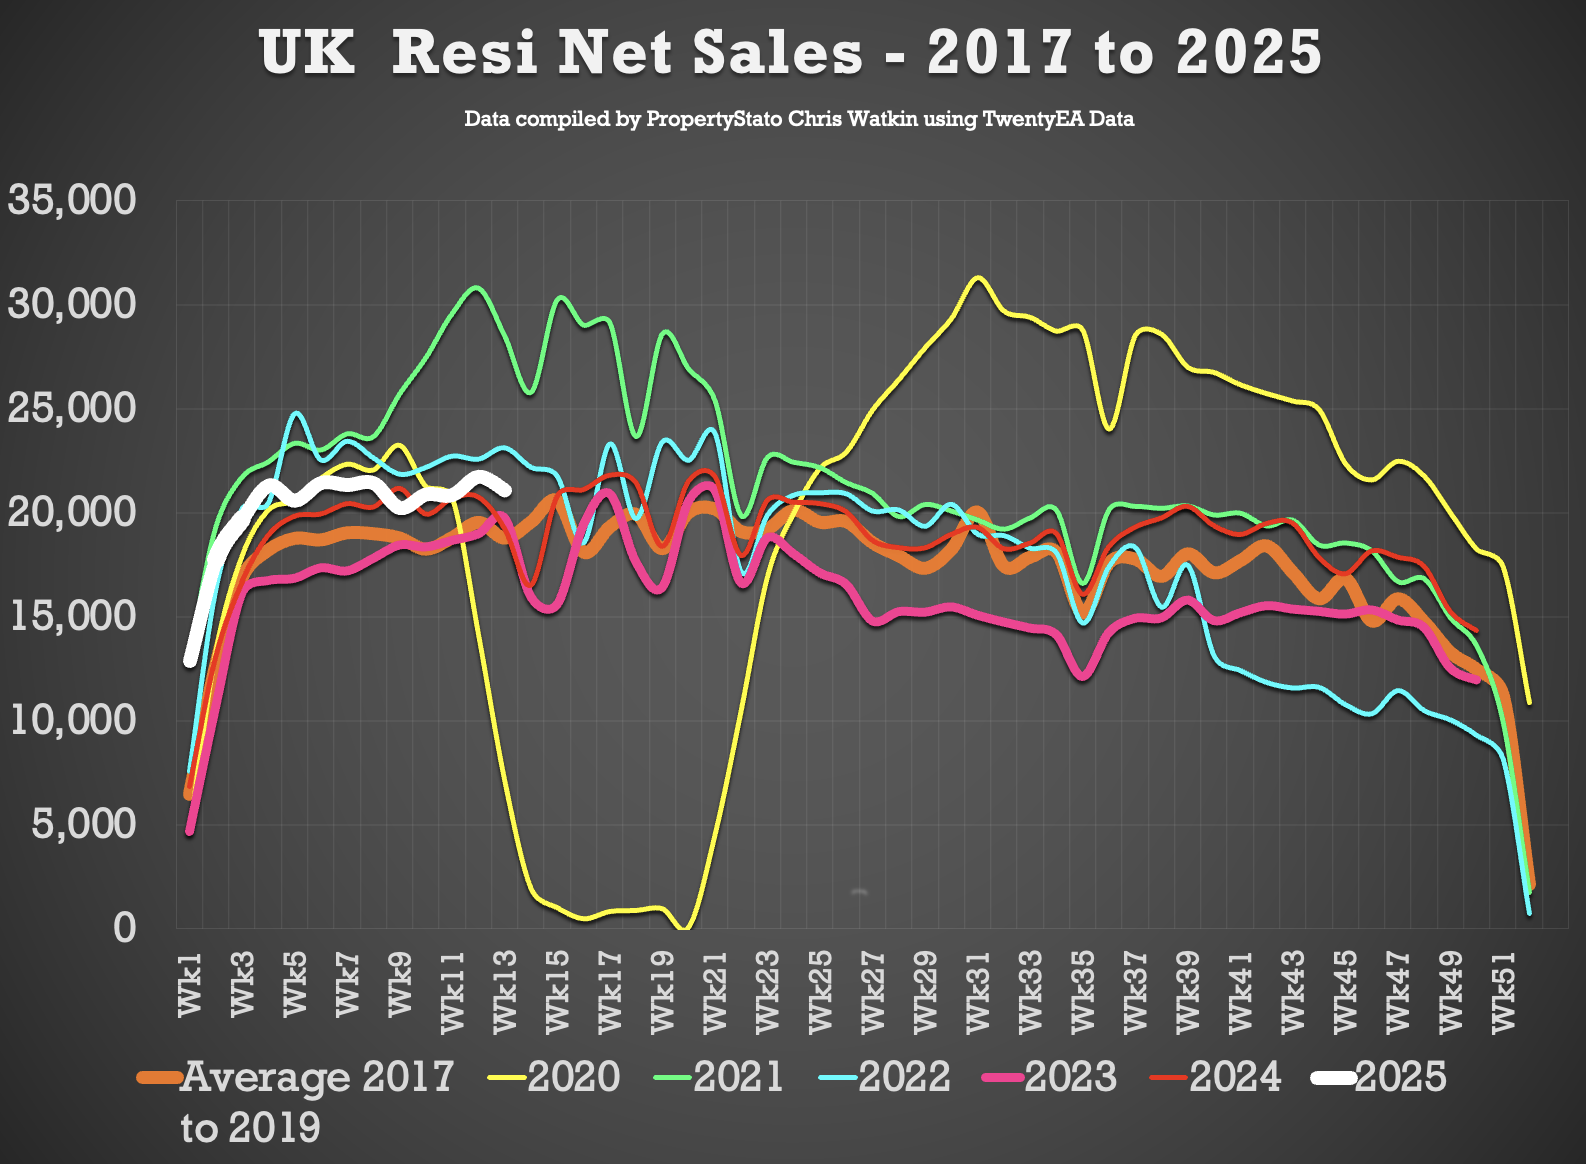
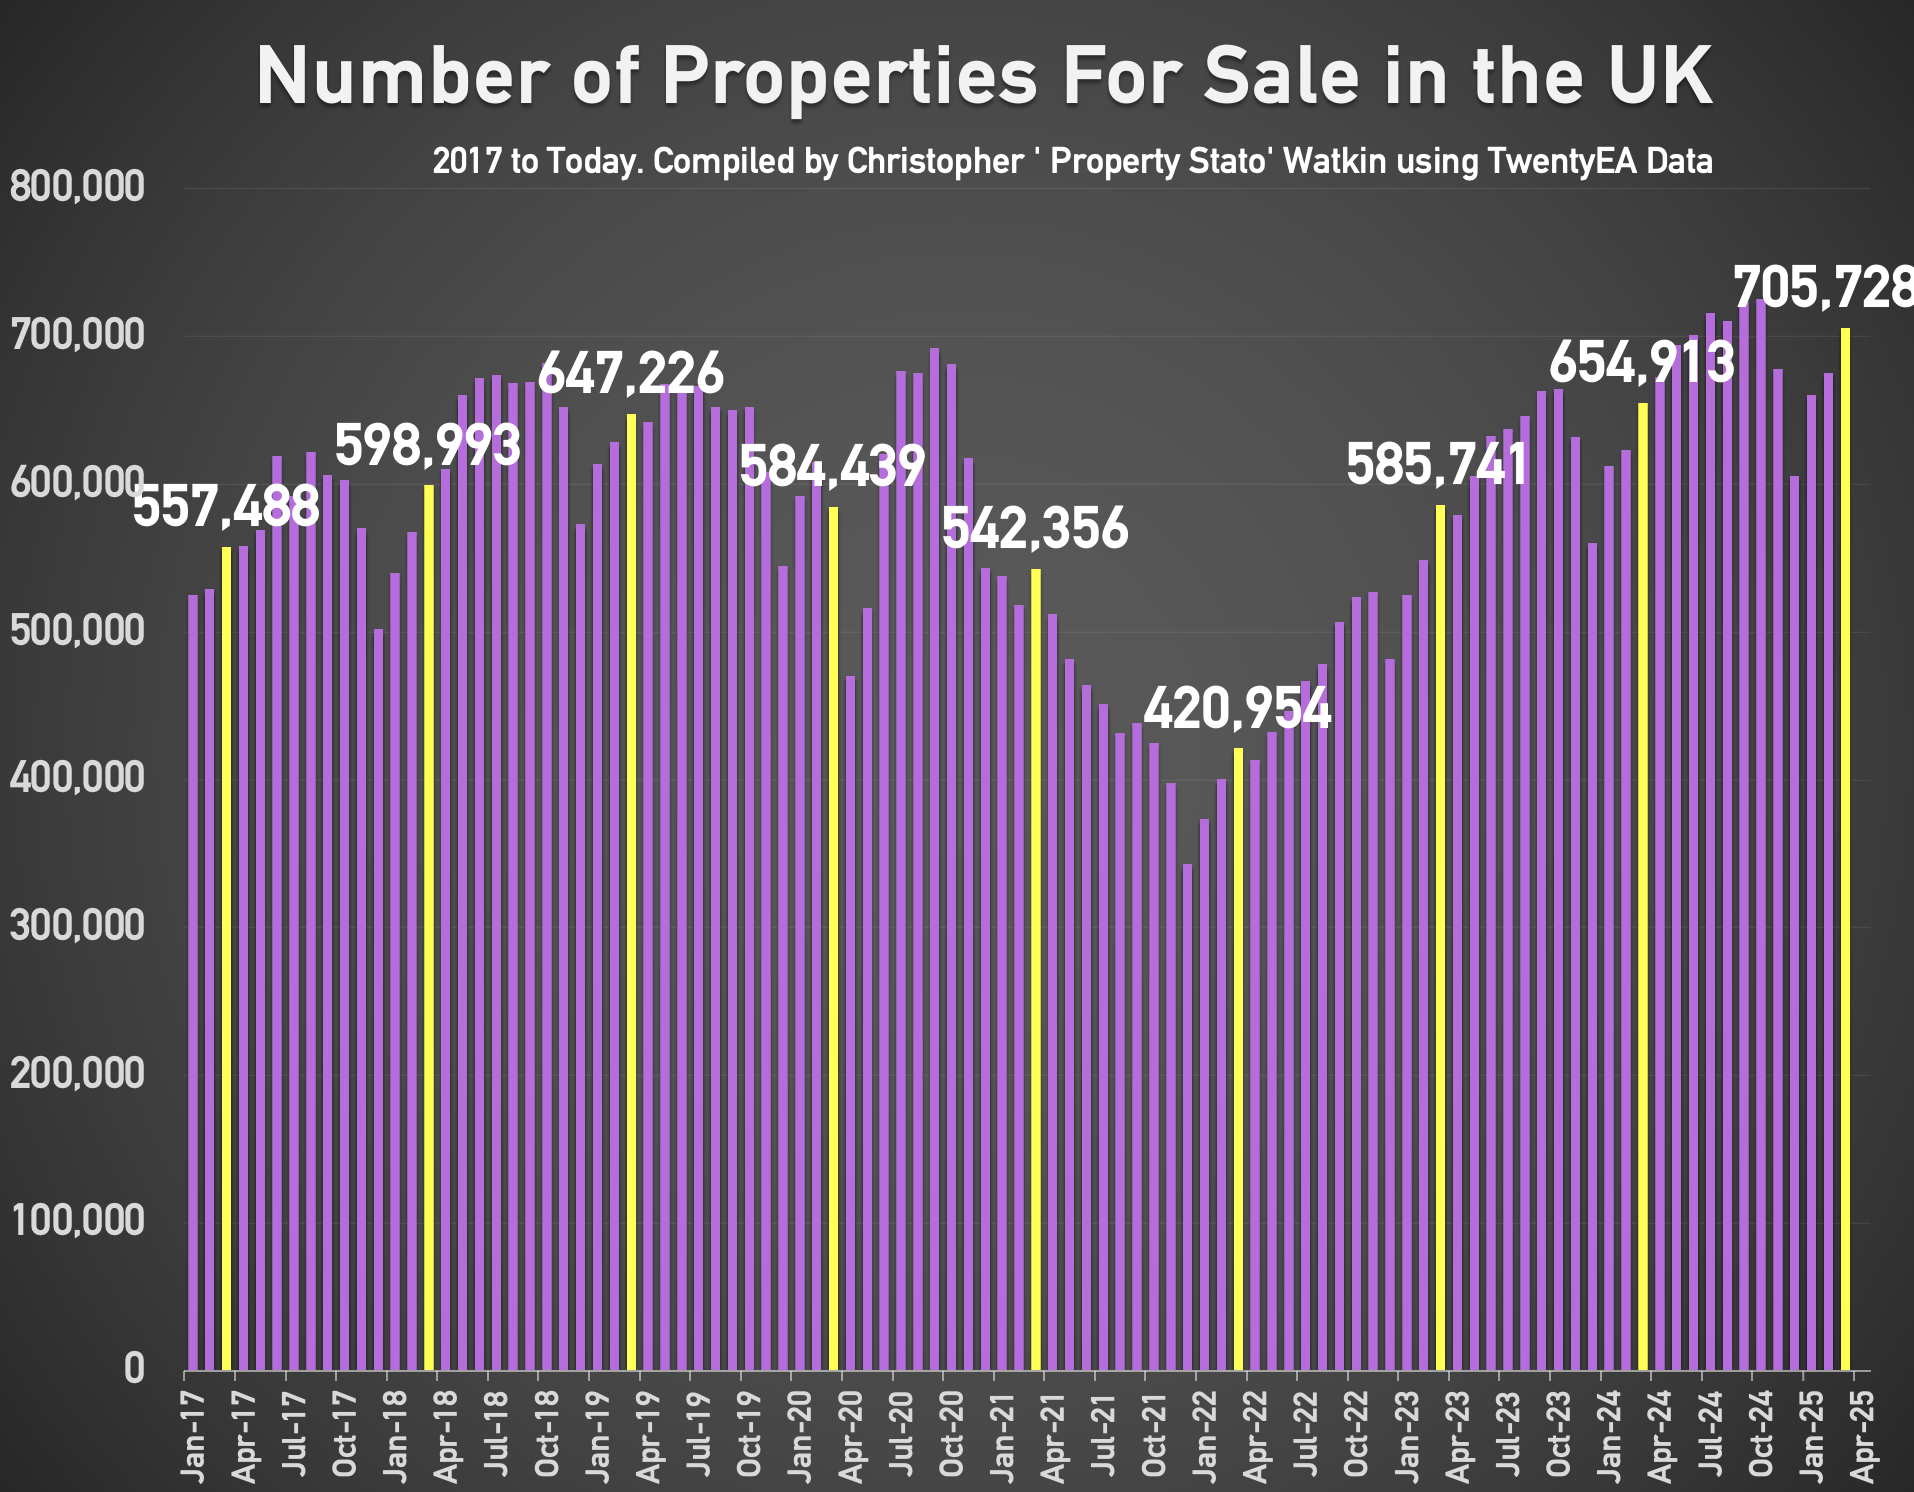
✅ Resi Sales – Stock Levels and Sales Pipeline

Local Estate Agency Focus this week
Macclesfield
how do these figures compare with March 1953?
You must be logged in to like or dislike this comments.
Click to login
Don't have an account? Click here to register
I have no idea as I dont (nor does anyone else) have the data for 1953, unless you have Gangsta Agent????
You must be logged in to like or dislike this comments.
Click to login
Don't have an account? Click here to register