


Verona Frankish (boss lady of Yopa) is the special guest on this week’s The UK Property Market Stats Show (Week 37 of 2024).
The main headlines:
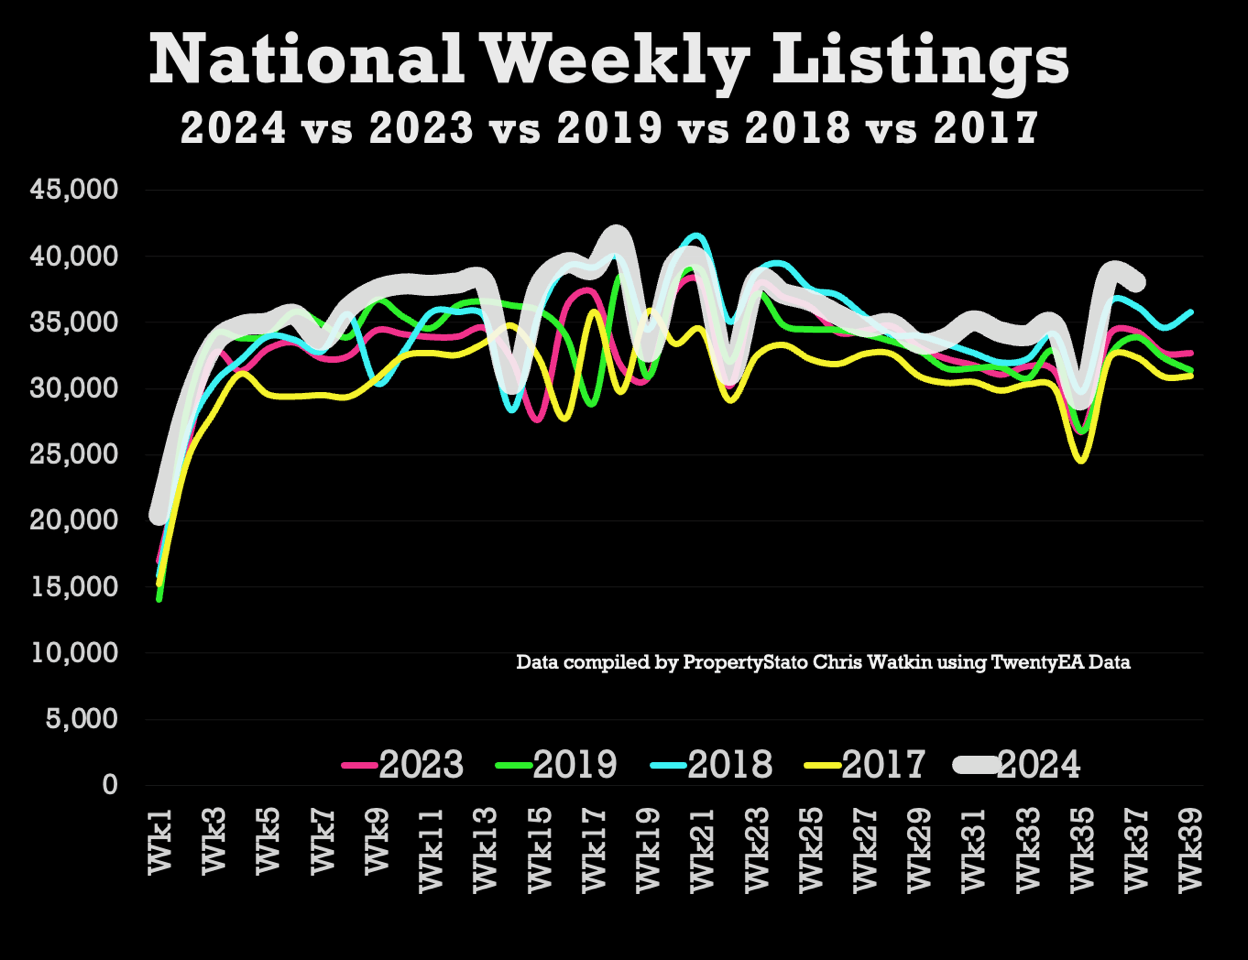
· Listings (New properties coming on to the market) – 38k UK listings this week (week 37), 38.9k the week before. 7.9% higher 2024 YTD than 2017/18/19 YTD average. 11% higher than Week 37 of 2023.
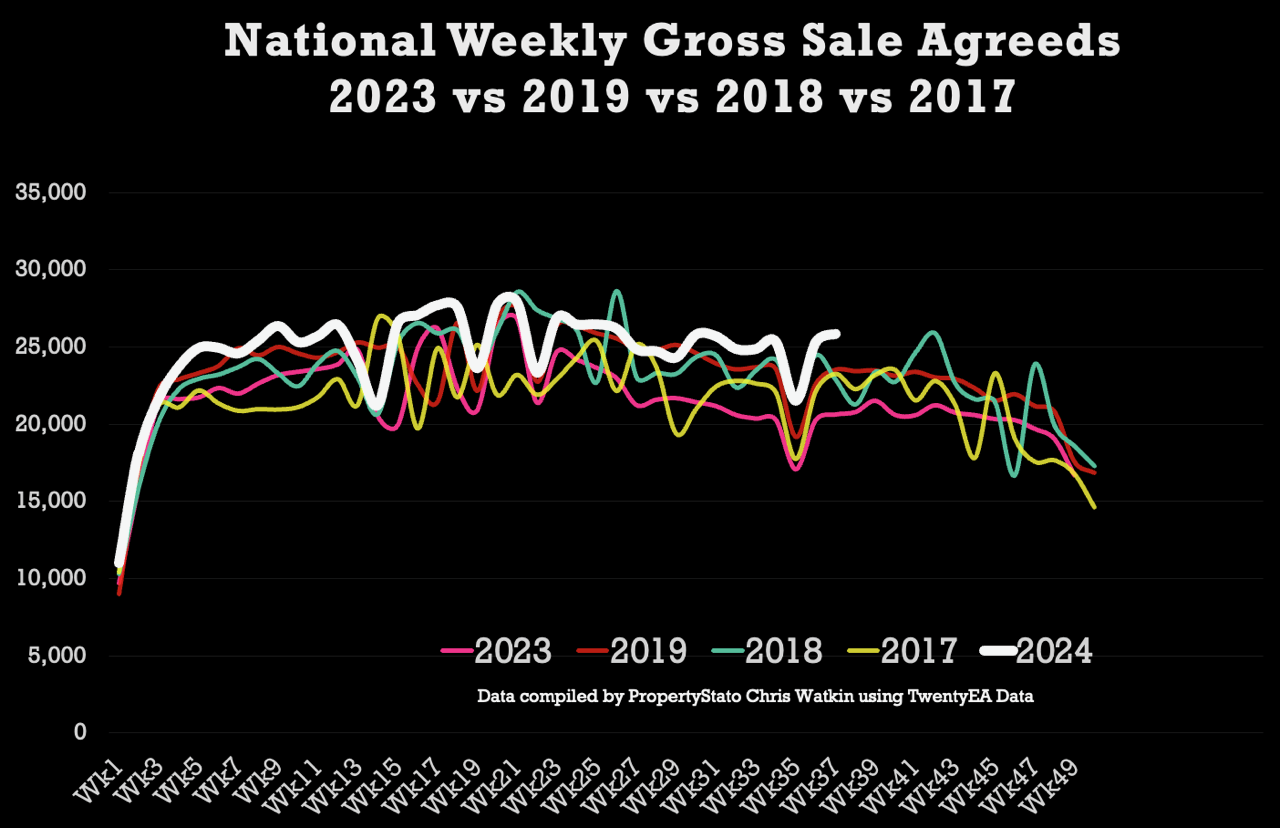
· Total Gross Sales – 25.9k UK homes sold stc this week (Week 37), which 25.2% higher than the same week (week 37) in 2023. Also, 7.1% higher than 2017/18/19 YTD levels & 13.2% higher than 2023 YTD levels.
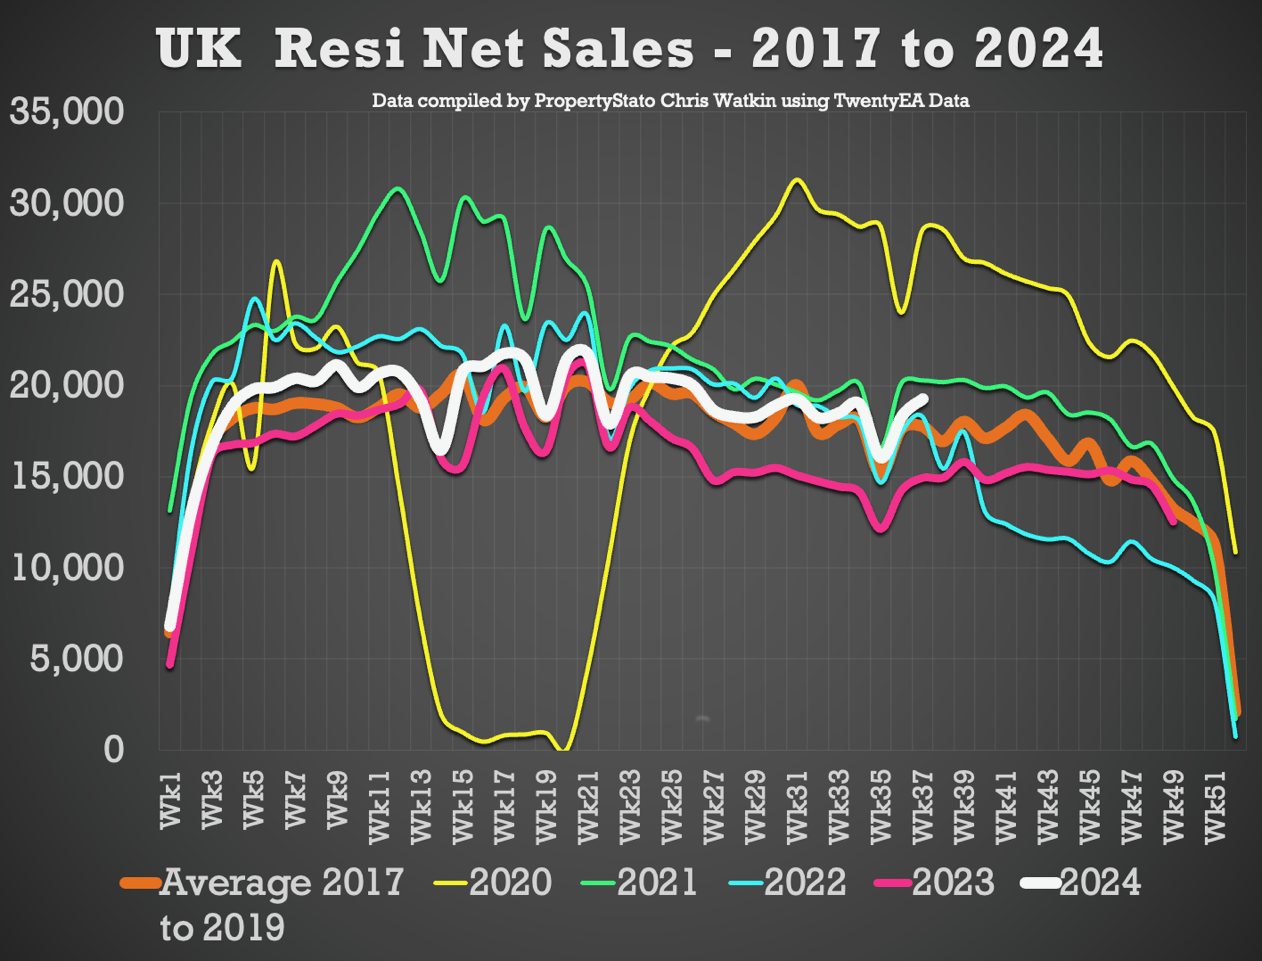
· Net Sales – 19.3k this week (18.3k last week). 29.1% higher than the same week in 2023 & still 15.8% higher YTD in 2024 compared to YTD 2023.
· Percentage of Homes exchanging vs homes unsold – Of the 1,053,914 UK homes that left UK Estate Agents books since the 1st Jan 2024, 560,583 of them (53.19%) exchanged & completed contracts (meaning the homeowner moved and the estate agent got paid). The remaining 493,331 (46.81%) were withdrawn off the market, unsold. In essence you a flip of the coin chance of actually selling, homeowners moving and the estate agent getting paid.
· UK House Prices – Mid September figures suggest a slight jump in this vital important metric to £342/£343/sq.ft. FYI – August’s Figures, the Sale Agreed £/sq.ft was at £338/sq.ft, a slight drop from July at £341/sq.ft.
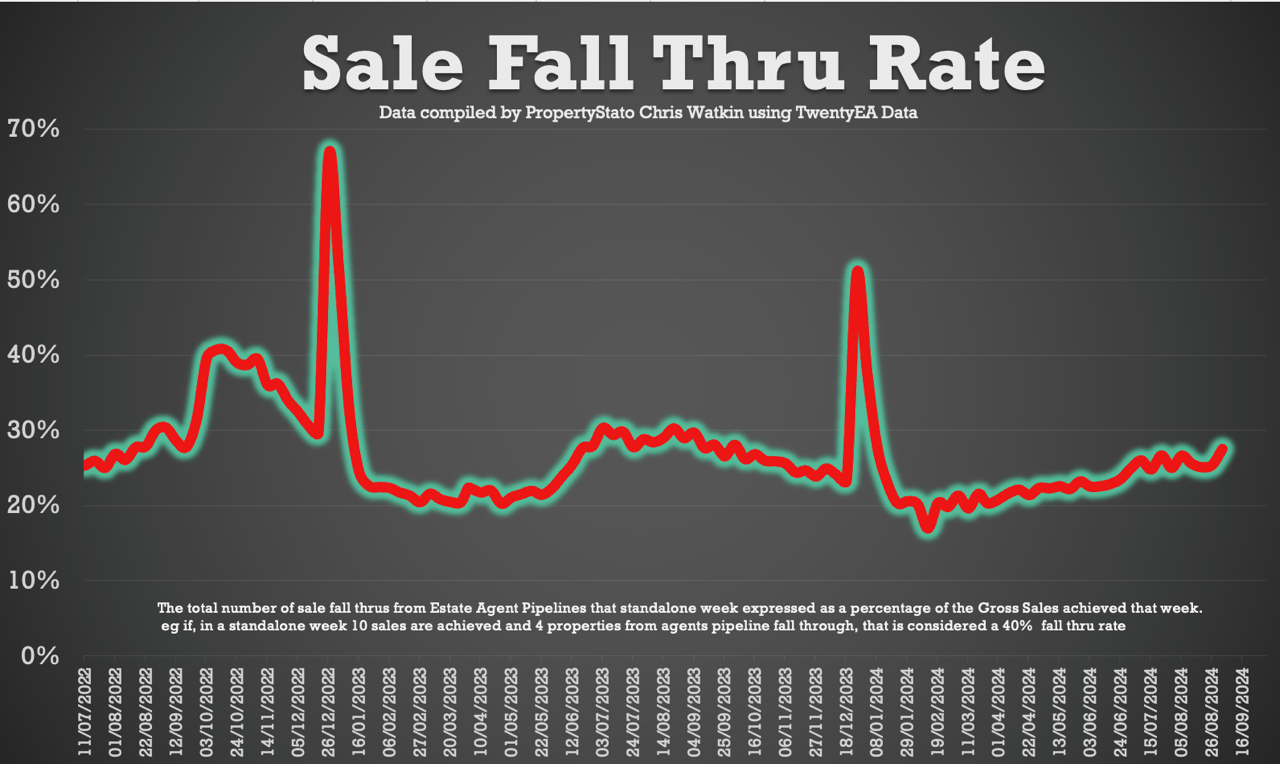
· Sale fall-throughs – Sale Fall Thrus (as a % of Gross sales Agreed) dropped to 25.4% this week. The 7 year Long Term Average is 24.2% and it was 40%+ in the two months following the Truss Budget in the Autumn of 2022.
Chris’s In-Depth Analysis (Week 37) :
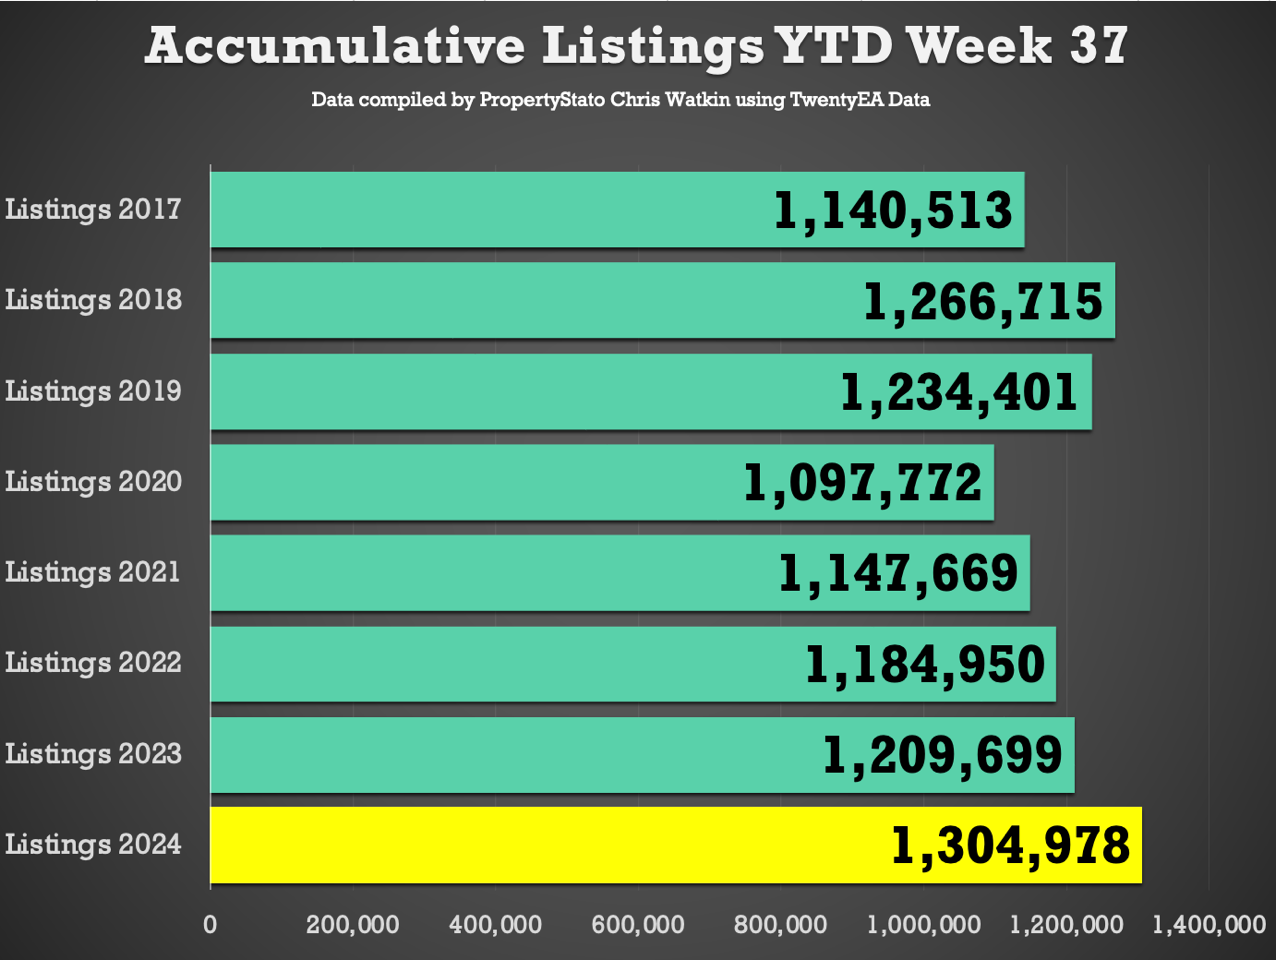
New Properties to Market: The UK saw 38,039 new listings. This year’s YTD listings stand at 1,304,978; 8.9% higher than the historical 8 year YTD average of 1,213,876, 7.5% higher than YTD 2017/18/19 and 7.9% higher YTD 2023. Just FYI – Weekly 2024 average : 35,270.
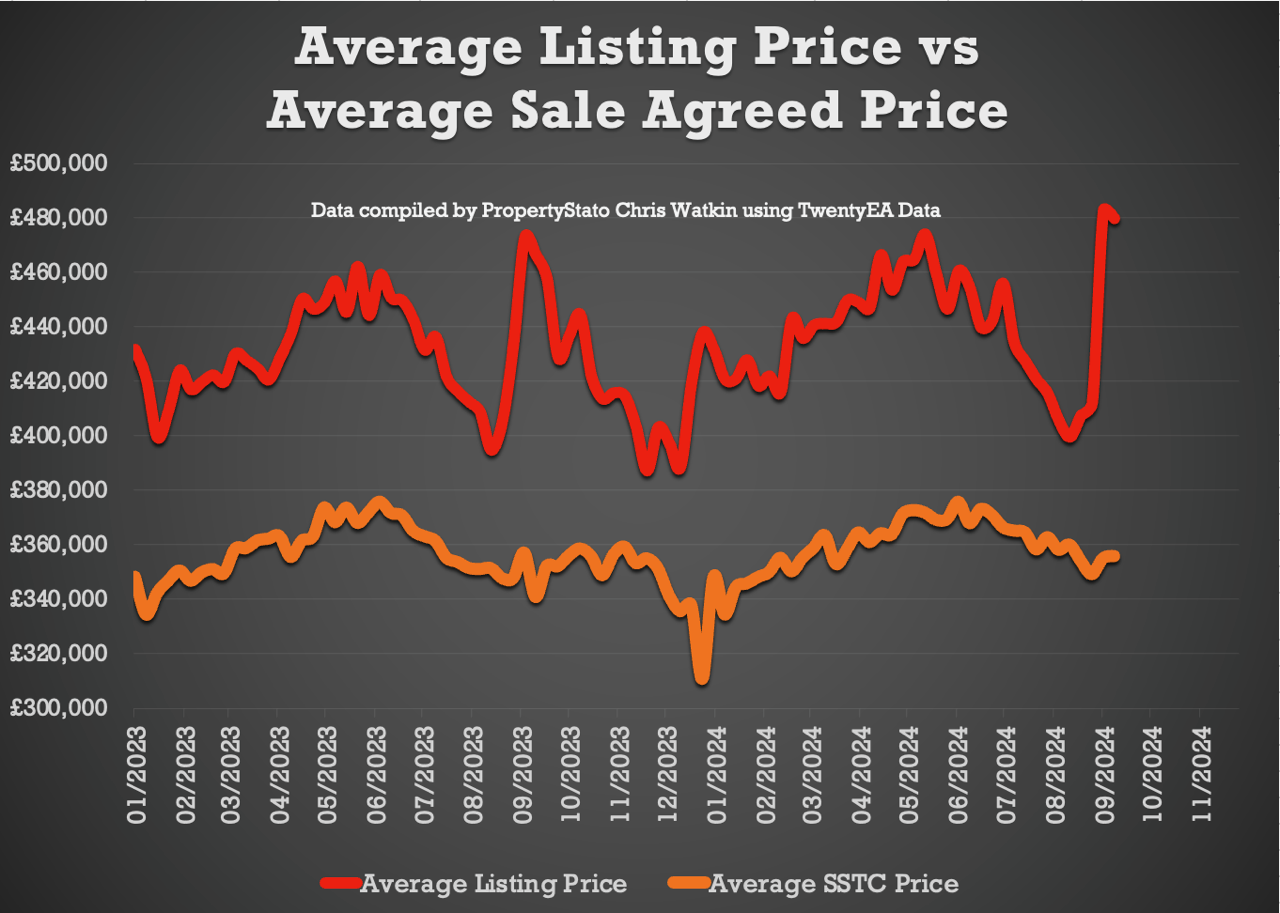
Average Listing Price: £479,807 (2024 weekly average – £439,271)
Average Asking Price of this week’s Listings vs Average Asking Price of the Properties that Sale Agreed this week: 34.8%. As predicted for many week’s, this is the central London market putting their homes on the market in the first few weeks of September (it happens every year). The long-term 8 year average is between 16% and 17%. (Weekly 2024 average 22.2%).
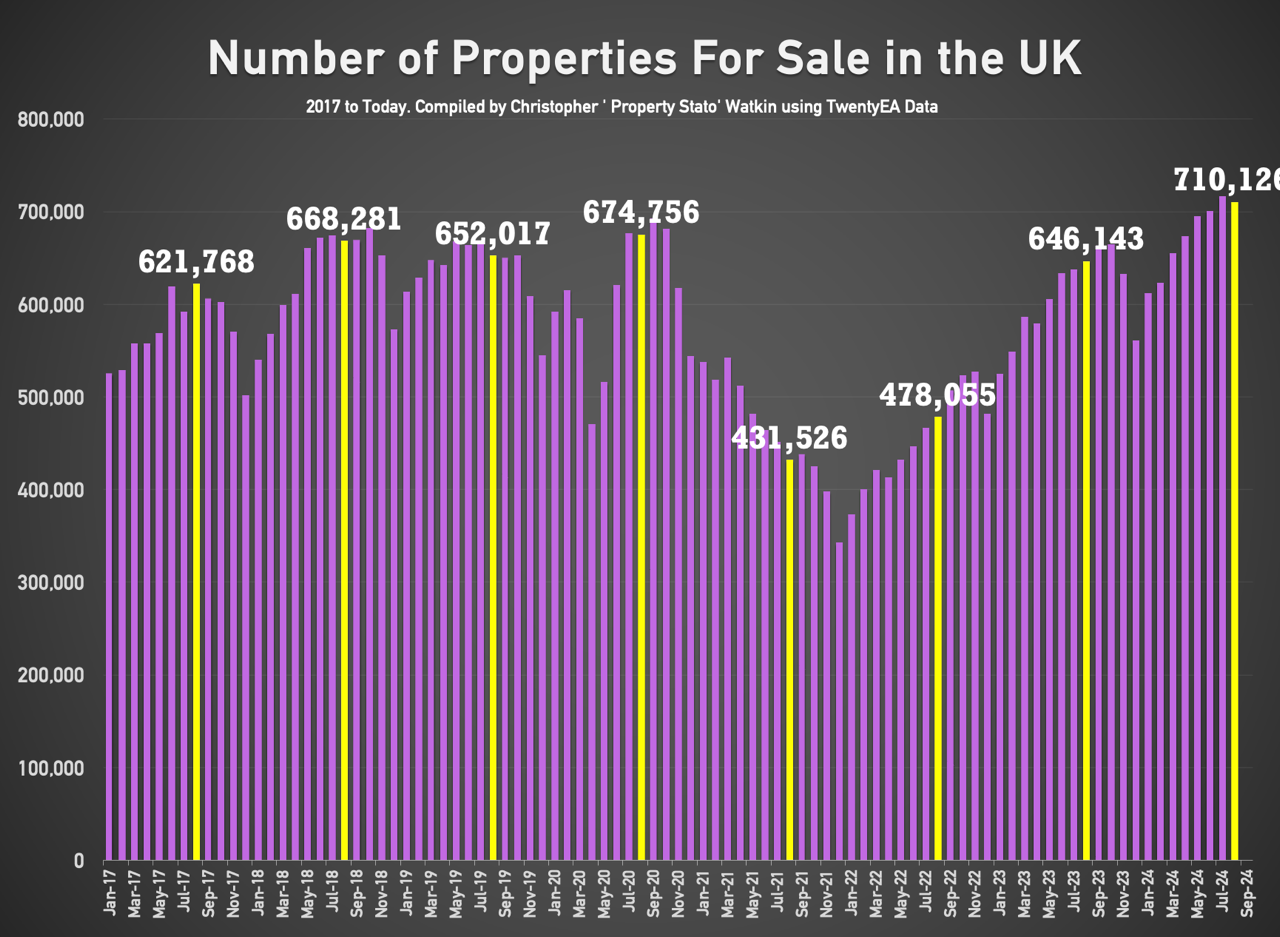
Price Reductions: This week, 26,057 properties saw price reductions. Yet there are higher stock levels. Stock end of month August 2024 (latest data) levels are at 710k . This means that ONLY 1 in 6.5 properties each month are being reduced. Is that enough? I don’t think so!
Average Asking Price for Reduced Properties this week: £431,081. (2024 weekly average – £399,566)
Gross Sales: 25,850 properties were sold stc last week. 2024 weekly average : 24,714 Gross Sales).
Accumulative Gross Sales YTD: The total YTD stands at 914,415, exceeding the average YTD Gross sales figure of 853,578 from 2017/18/19 and 808,122 in the same week 37 in 2023. Graph 8
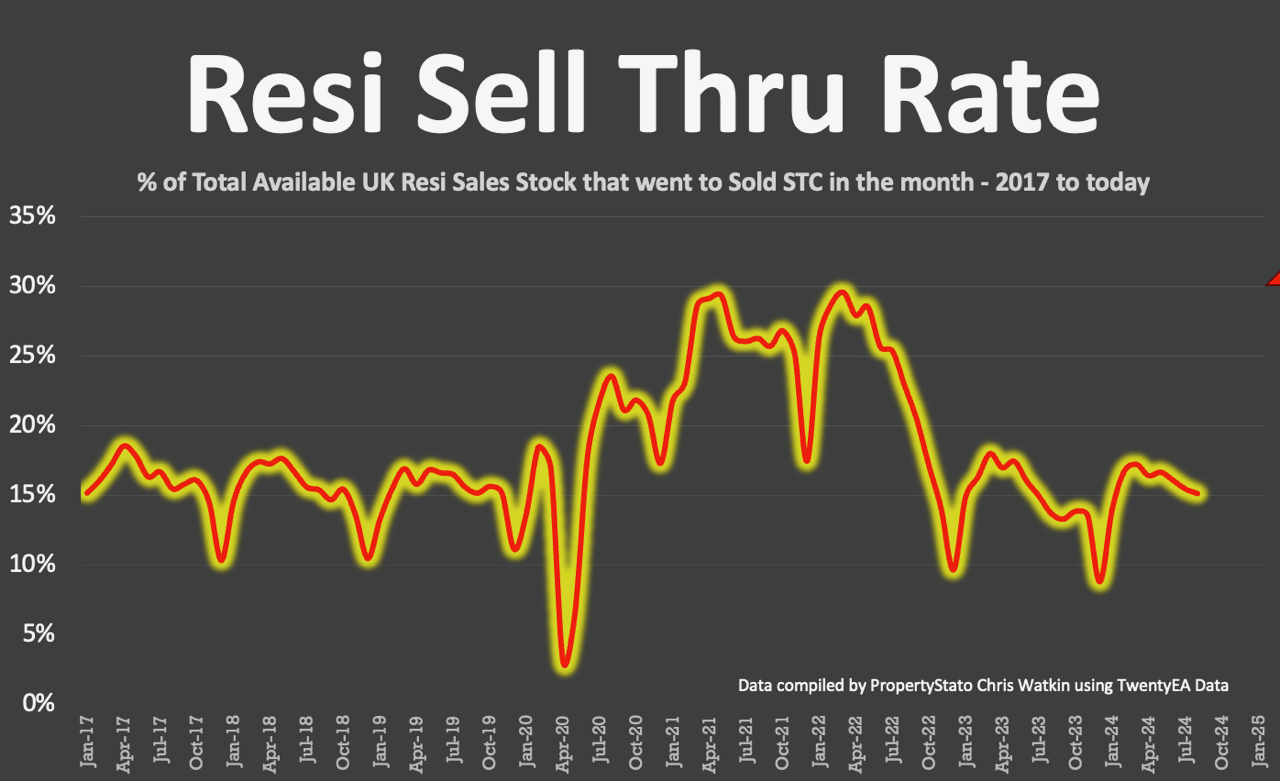
Resi Sale Through rate: (NEW MONTHLY STAT) : UK Estate Agents sold 15.13% of their Resi sales stock in August ’24 (next update in early Oct for September. The 7 year long term average is 17.9% per month – yet don’t forget that was only in mid/late 20%’s in the crazy years of 20/21/22). A decent bellwether and good comparison is the 2017/18/19 average at 15.57% per month.
Average Asking Price of Sold STC Properties: Still staying in the £350/370k’s range (like has been for 2 years) at £356,059.
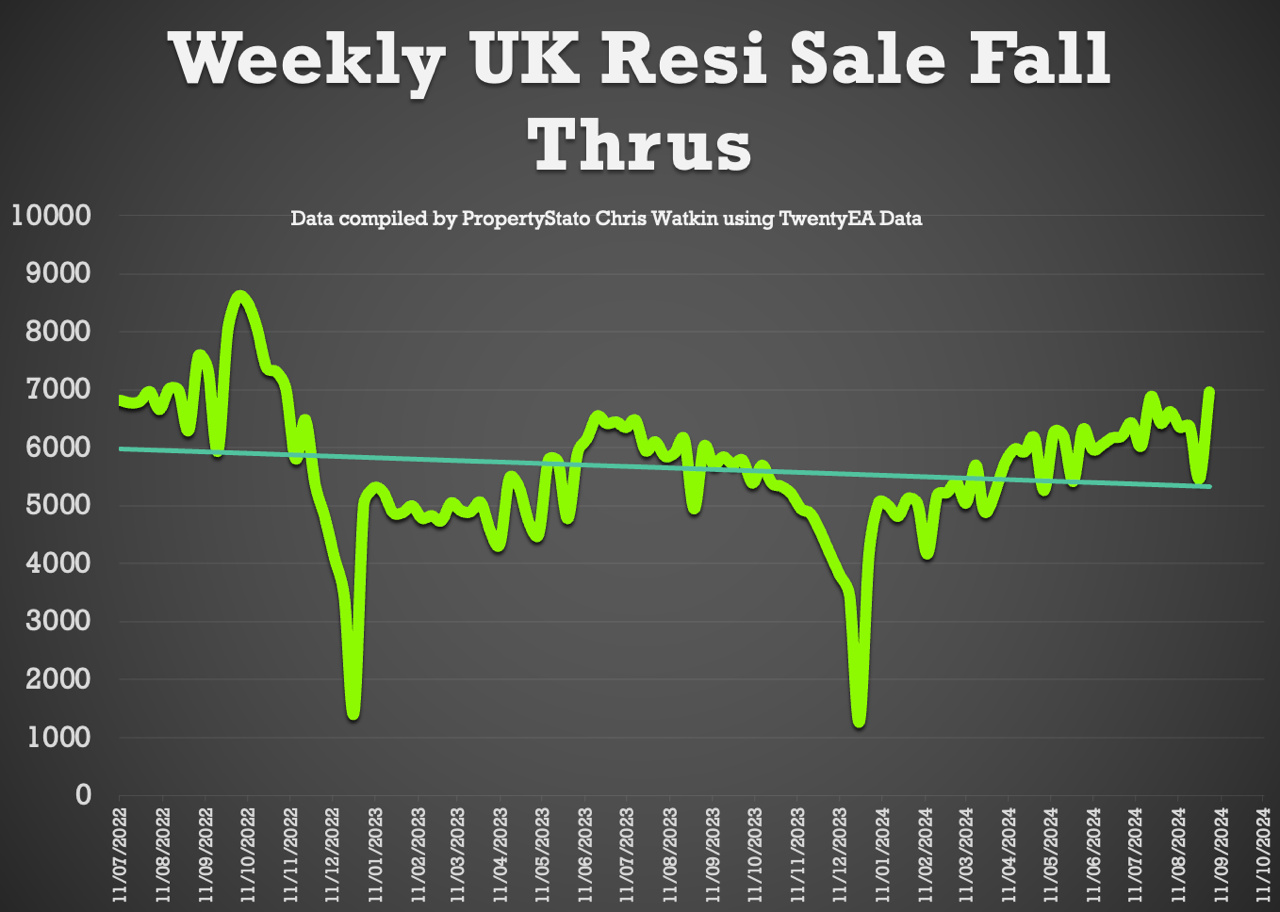
Sale Fall Throughs: Fall throughs this week jumped to 6,963 (as normally the case with post Bank Holiday week). YTD weekly average is 5,689.
Sale Fall Through % Rate: 25.4% for week 37. (Comparison – 25.3% for the last 3 months, whilst the long term 8 years average is 24.2% & it was 40%+ in Q4 2022 in the Truss budget!).
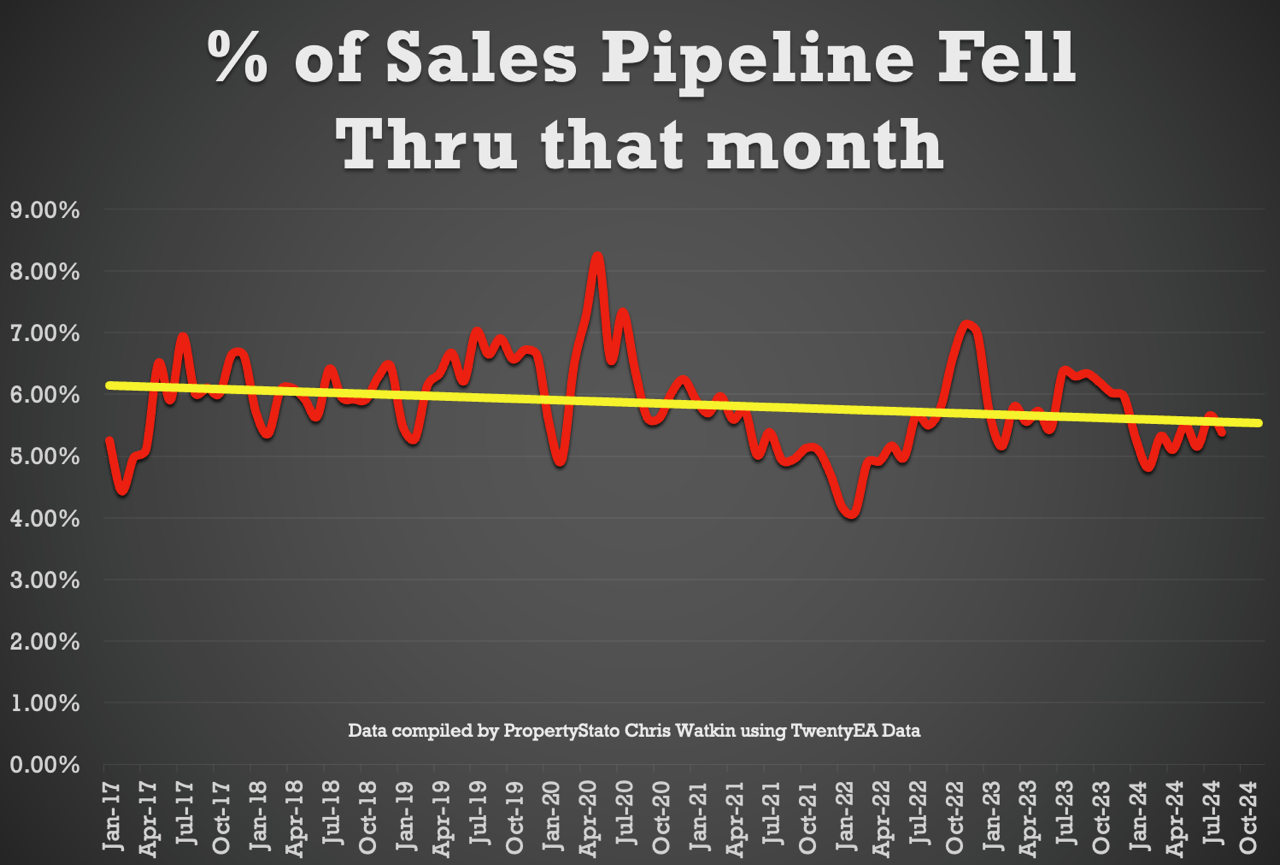
Sale Fall Throughs in the Month as a % of the total Sales Pipeline (NEW STAT) – Good news – this dropped from 5.66% in July to 5.39% in August. (8 year average 5.32%). Conclusion – even though we are getting higher fall through rates (units wise)because the sales pipeline is higher, it just shows looking at the graph, that everything is okay (look at the yellow long-term trend line).
Net Sales (Gross sales this week less fall throughs this week) – 19,284, up from 18,340 last week.
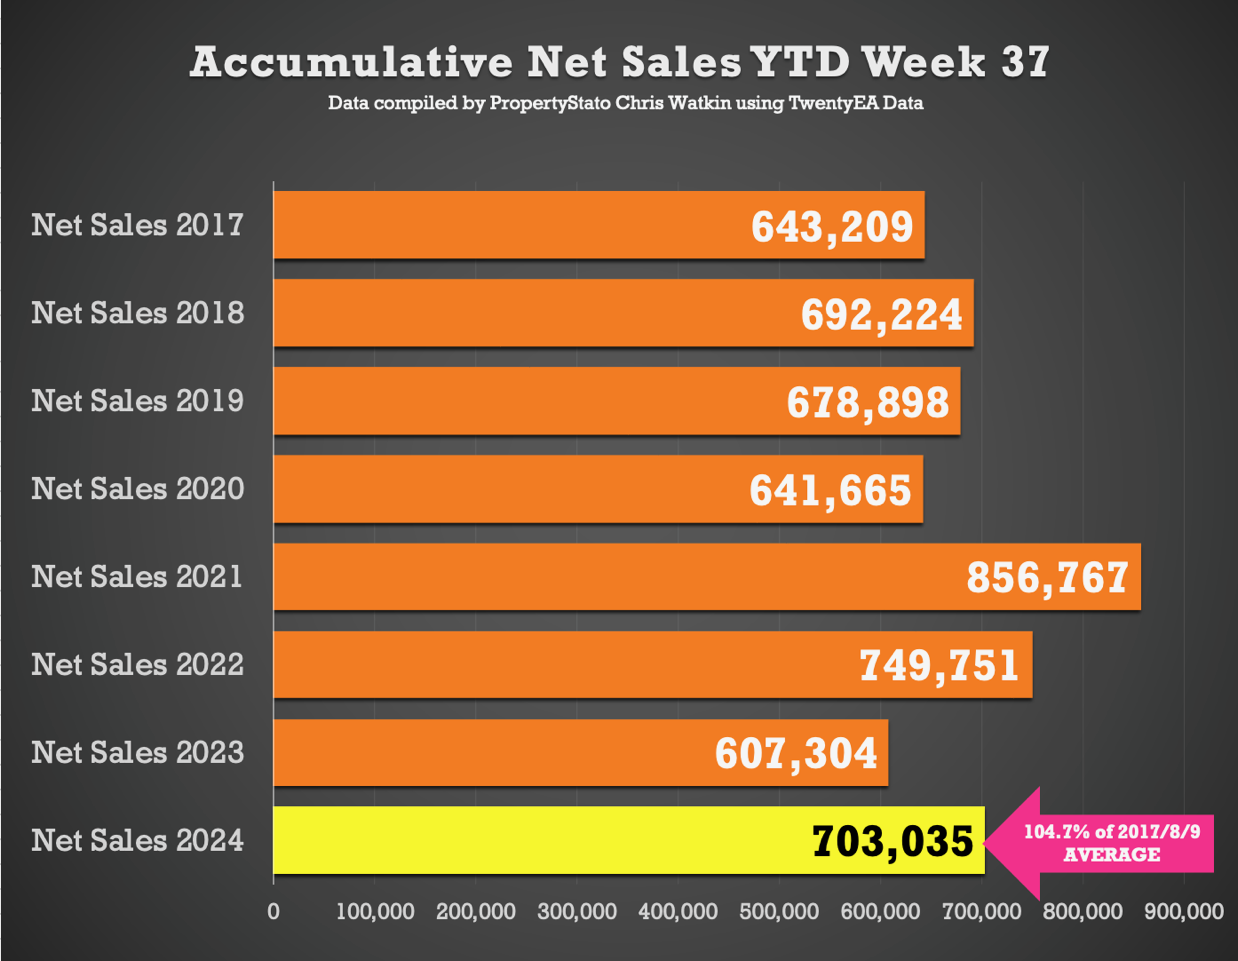
Accumulative Net Sales YTD: The total stands at 703,035, still 4.7% higher than the 17/18/19 YTD Net sales average (671,444) and 15.8% higher than the YTD figure for 2023 for Net Sales (607,304).
UK Resi monthly Sales Agreed as a % of monthly listings (NEW MONTHLY STAT) : 72.5% for August. For comparison – 2024 YTD 70.6% and 2023 was 69.1% whilst the 5 year average 79.2%.
Resi Sales Stock on the Market : 710k at end of August (down from 715k at end of July). For comparison, Aug ’23 – 646k, Aug ’22 – 478k, Aug ’21 – 421k, Aug ’20 – 674k, Aug ’19 – 652k.
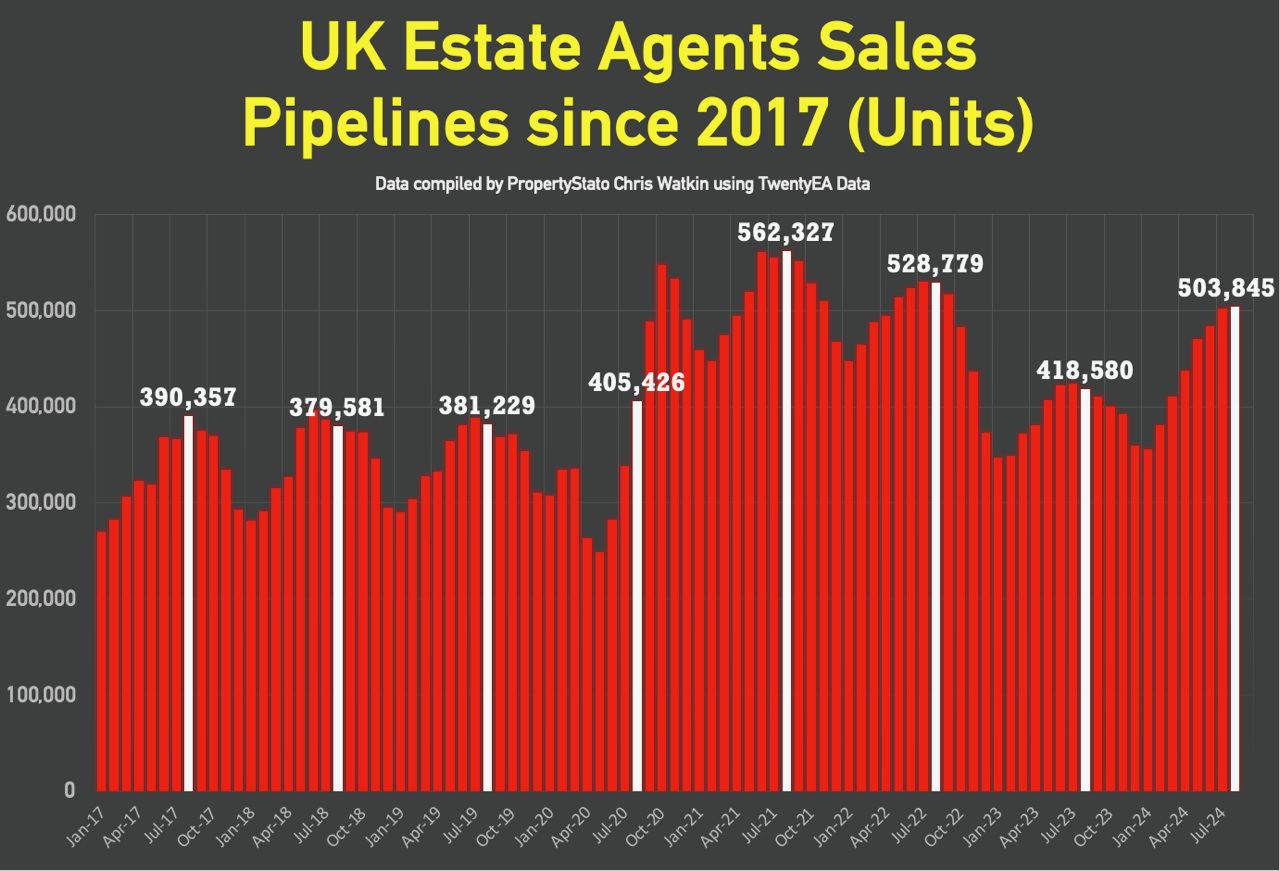
Resi Sales Sold STC Pipeline (Units) : 504k at end of August. For comparison, Aug ’23 – 416k, Aug ’22 – 529k, Aug ’21 – 562k, Aug ’20 – 405k, Aug ’19 – 381k.
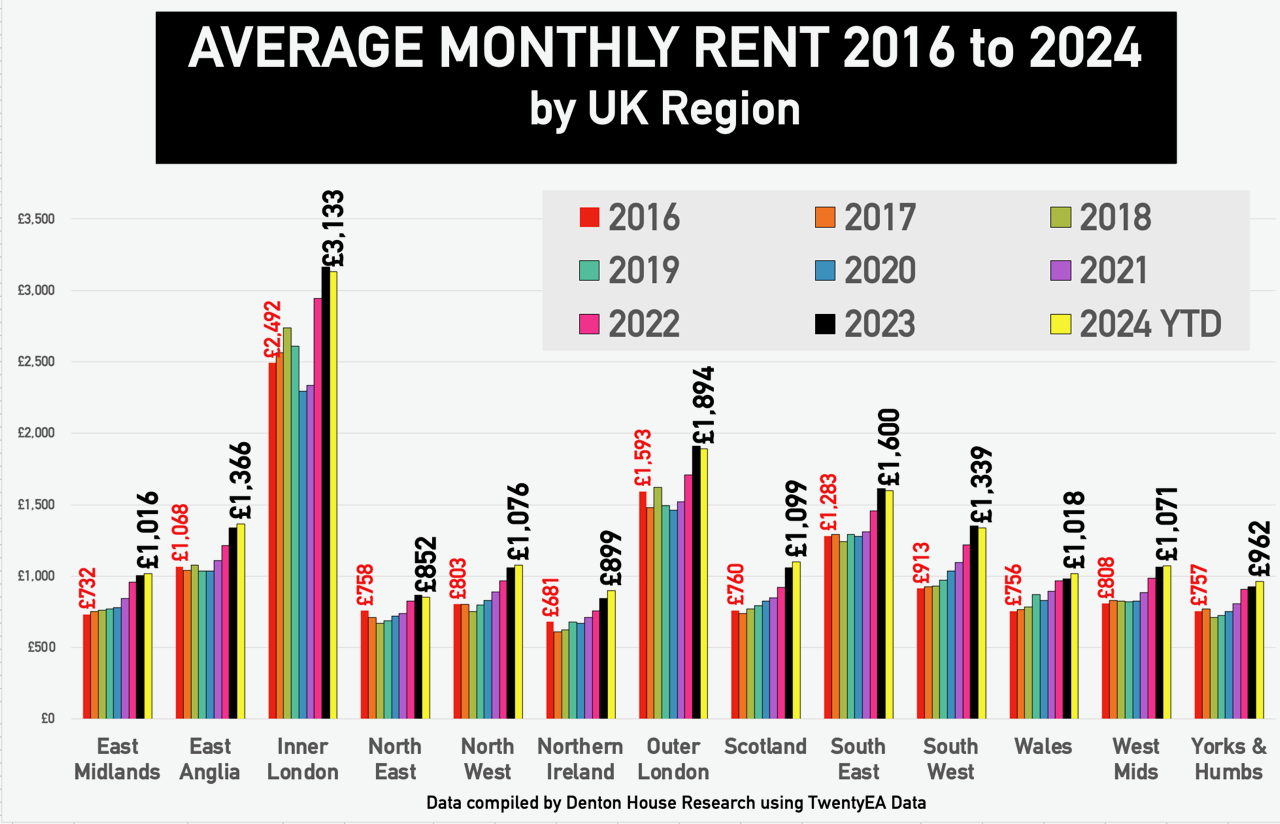
Average Rents by UK regions since 2016

It would be interesting to see the split of sales in price brackets, split of new homes to the market in price brackets and an ongoing analysis . A lot of the higher priced homes for sale, do not appear to be moving very fast and have been on the market for a long time, does this buck the trend?
You must be logged in to like or dislike this comments.
Click to login
Don't have an account? Click here to register
I will look into this scsturges23
You must be logged in to like or dislike this comments.
Click to login
Don't have an account? Click here to register