

 This week’s show features special guest, Toby Phillips (boss man of Martin & Co, Whitegates and the experience franchised estate & letting agency brands), to discuss the property market headlines.
The main headlines:
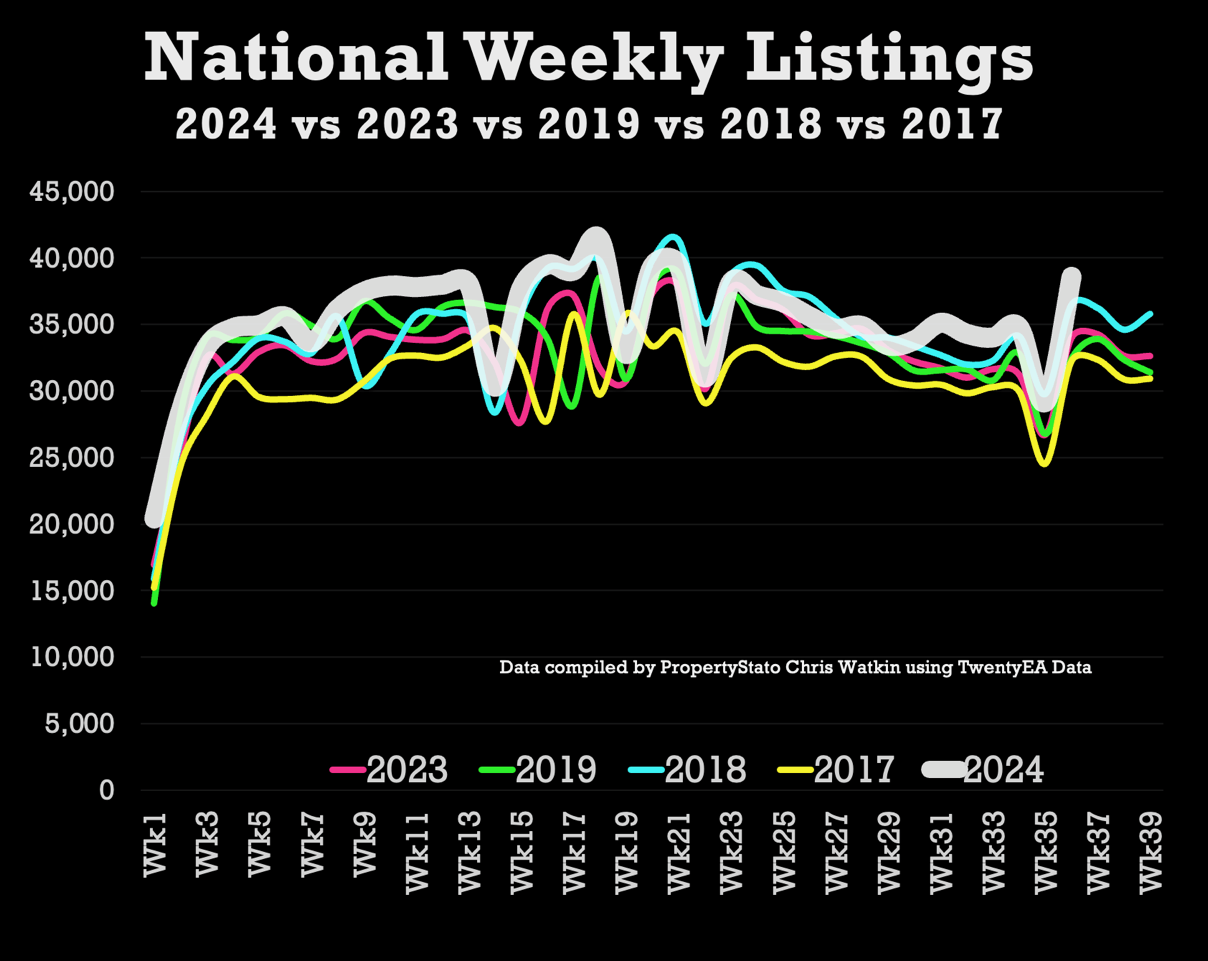
· Listings (New properties coming on to the market) – 38.6k UK listings this week (week 36), 29.2k the week before (although that was a bank Holiday week). Yet, 7.4% higher 2024 YTD than 2017/18/19 YTD average & 13.4% higher than Week 36 of 2023.
· Total Gross Sales – 25.9k UK homes sold stc this week (Week 36), which 24.8% higher than the same week (week 36) in 2023. Also, 7% higher than 2017/18/19 YTD levels & 12.8% higher than 2023 YTD levels.
· Net Sales – 18.3k this week, 29% higher than the same week in 2023 & still 15.4% higher YTD in 2024 compared to YTD 2023.
· % of Homes exchanging vs homes unsold – Of the 1,019,576 UK homes that left UK Estate Agents books since the 1st Jan 2024, 541,540 of them (53.11%) exchanged & completed contracts (meaning the homeowner moved and the estate agent got paid). The remaining 478,036 (46.89%) were withdrawn off the market, unsold. In essence you a flip of the coin chance of actually selling, homeowners moving and the estate agent getting paid. Over valuing is casing a lot of this.
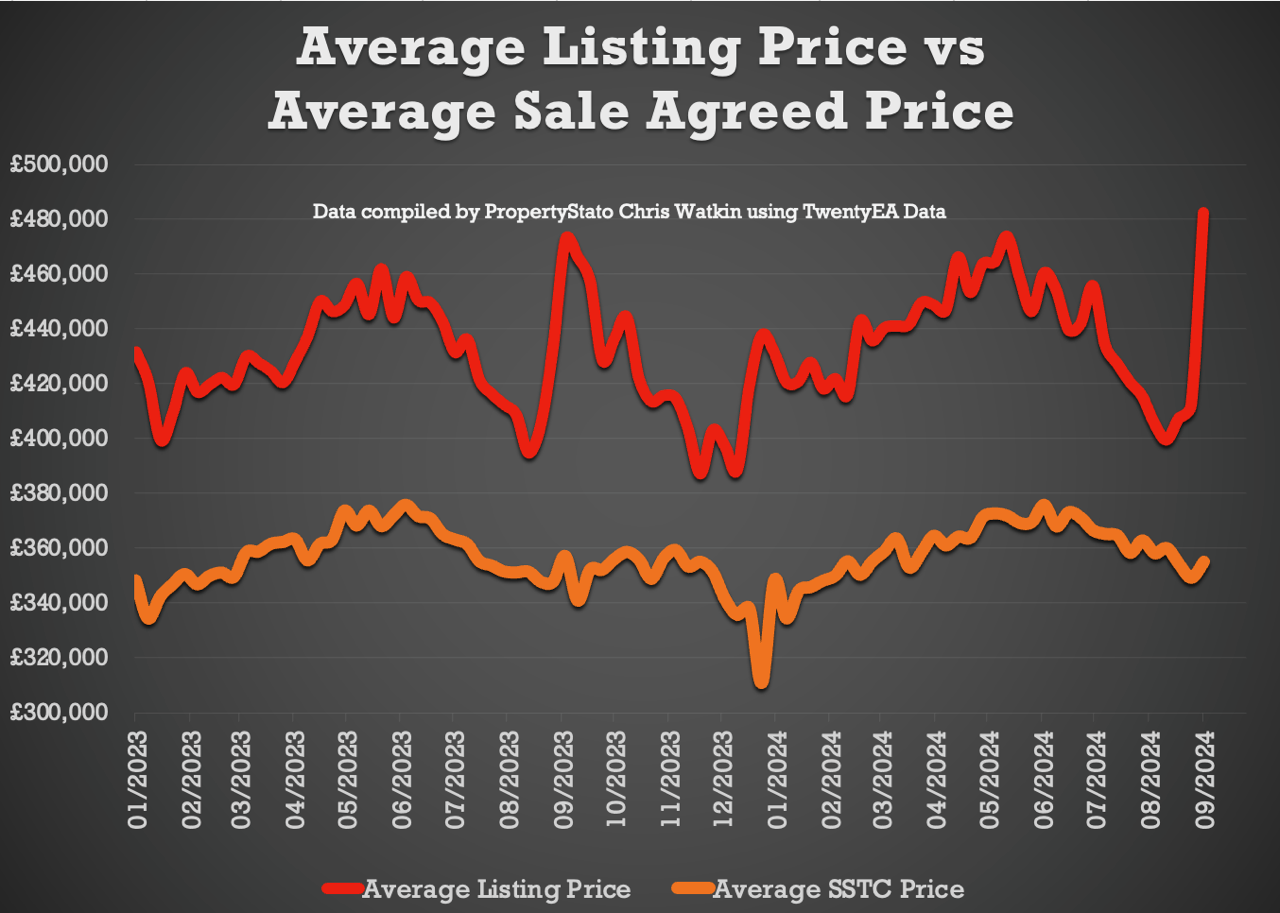
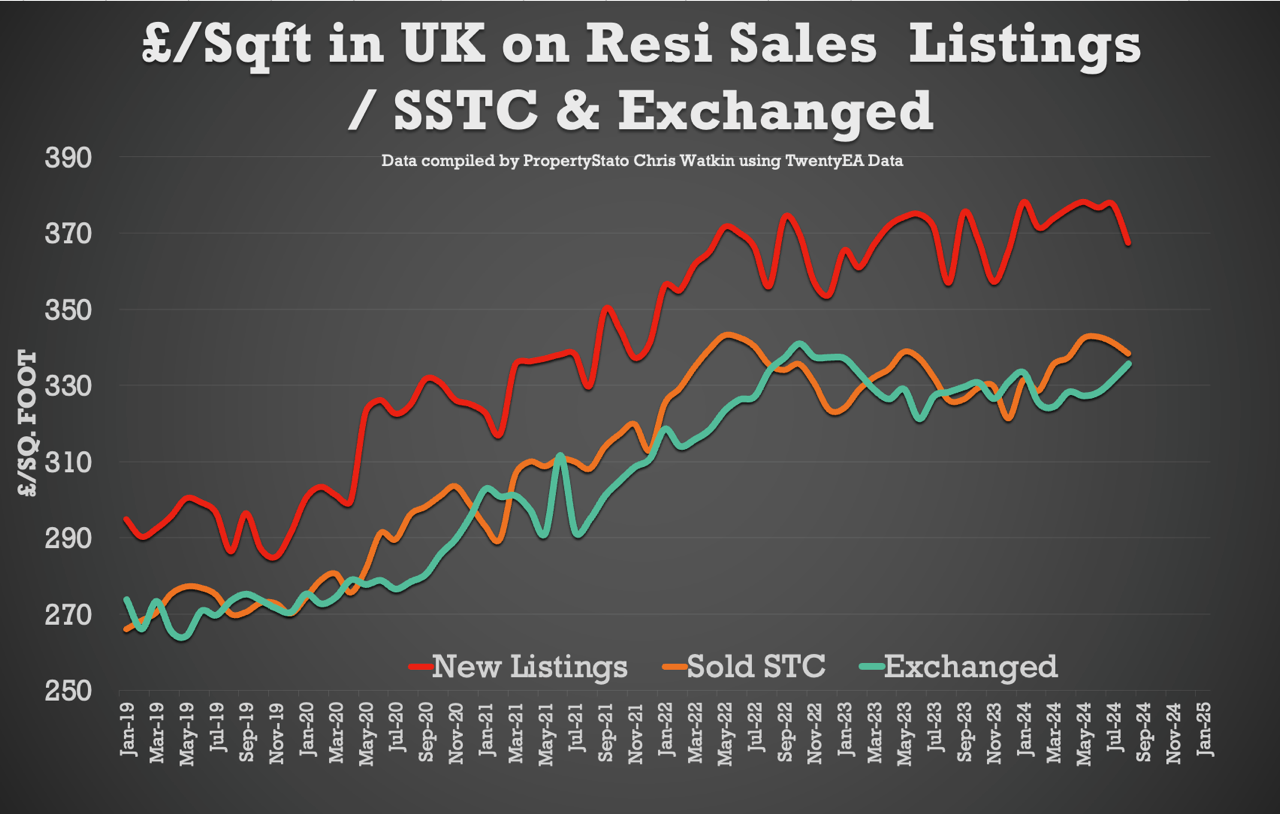
· UK House Prices – Figures for the whole of August, the Sale Agreed £/sq.ft remained at £338/sq.ft, a slight drop from July at £341/sq.ft. House Prices are 1.22% lower than 4 months ago.
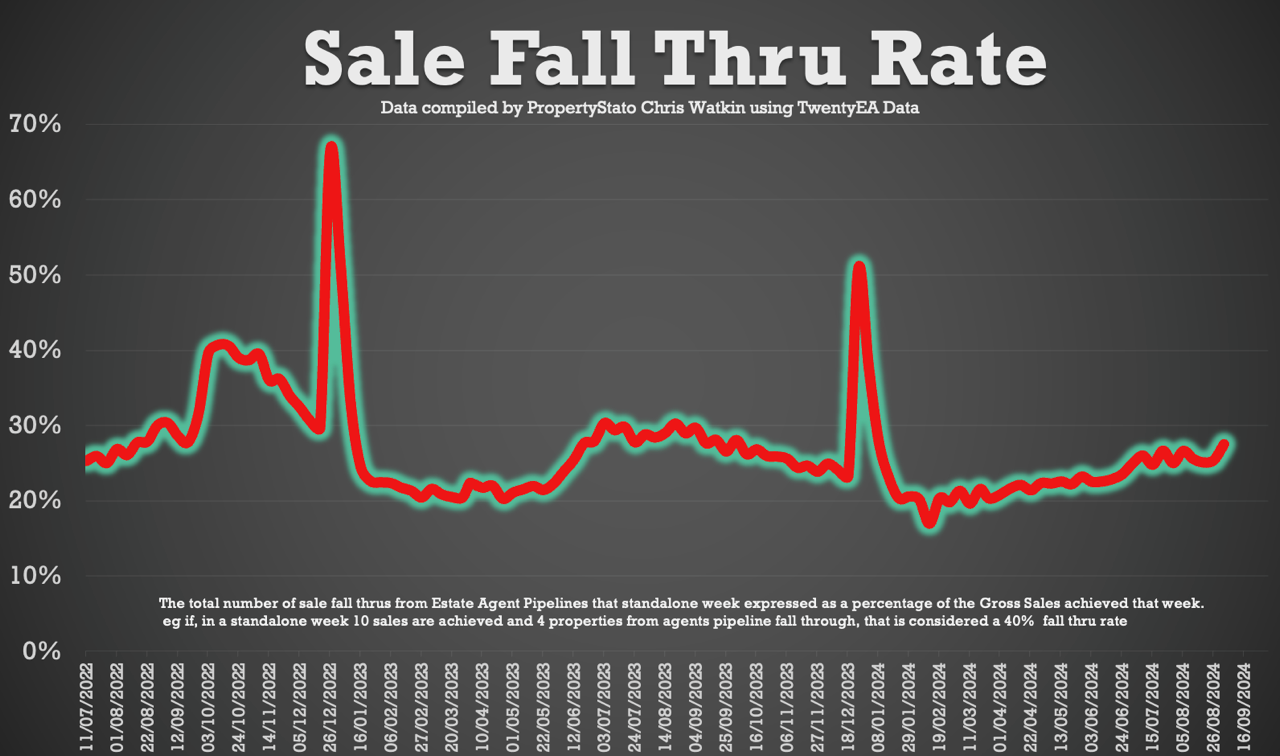
· Sale fall-throughs – Sale Fall Thrus (as a % of Gross sales Agreed) increased to 27.5% this week (they always do the week after the Bank Holiday). The 7 year Long Term Average is 24.2% and it was 40%+ in the two months following the Truss Budget in the Autumn of 2022.
Chris’s In-Depth Analysis (Week 36) :
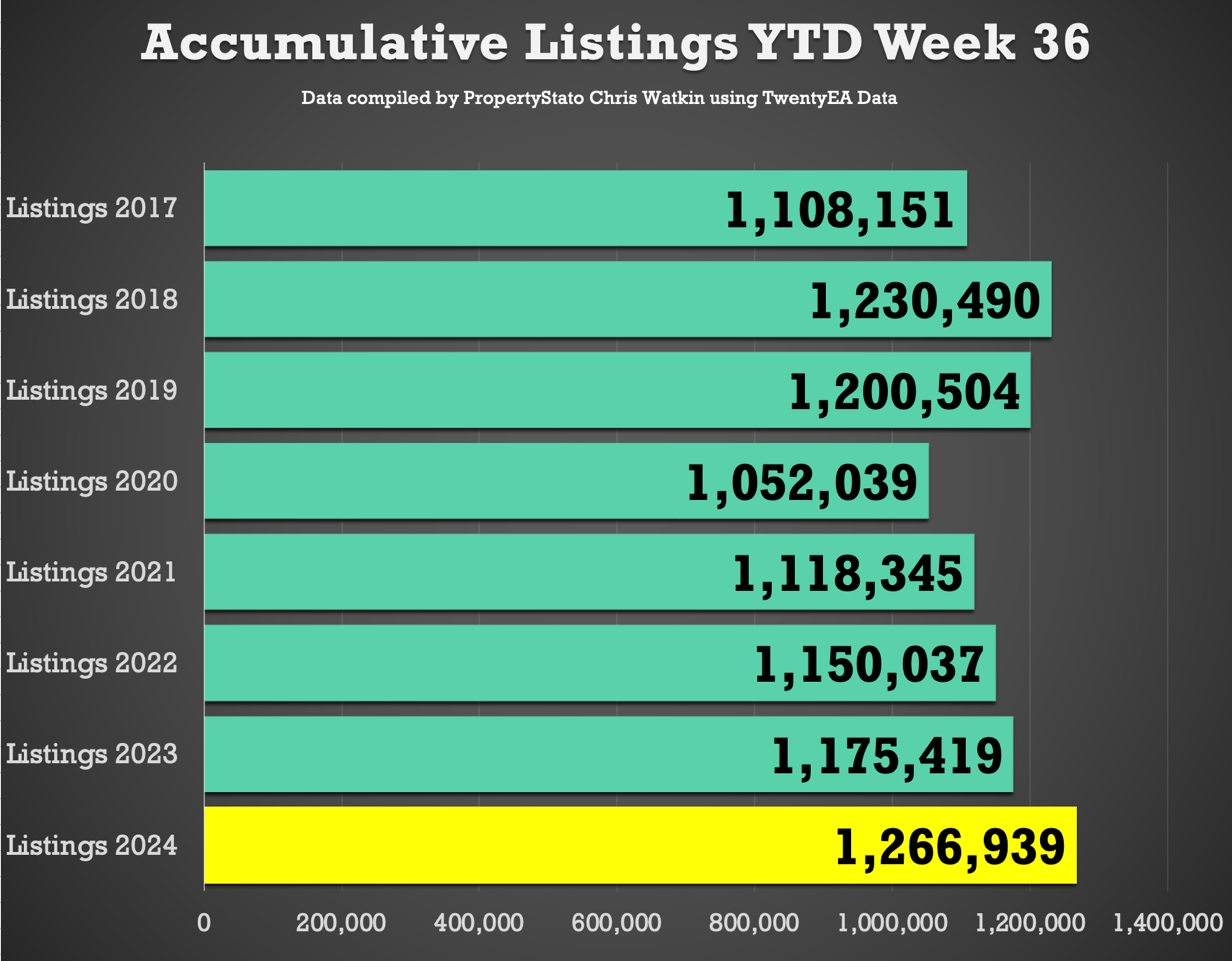
New Properties to Market: The UK saw 38,562 new listings. This year’s YTD listings stand at 1,266,939; 9.3% higher than the historical 8 year YTD average of 1,179,715, 7.4% higher than YTD 2017/18/19 and 7.8% higher YTD 2023. Just FYI – Weekly 2024 average : 35,193.
Average Listing Price: £482,692 (2024 weekly average – £438,607)
Average Asking Price of this week’s Listings vs Average Asking Price of the Properties that Sale Agreed this week: 35.9%. As predicted for many week’s, this is the central London market putting their home son the market in the forst week of September (it happened every year). The long-term 8 year average is between 16% and 17%. (Weekly 2024 average 21.9%).
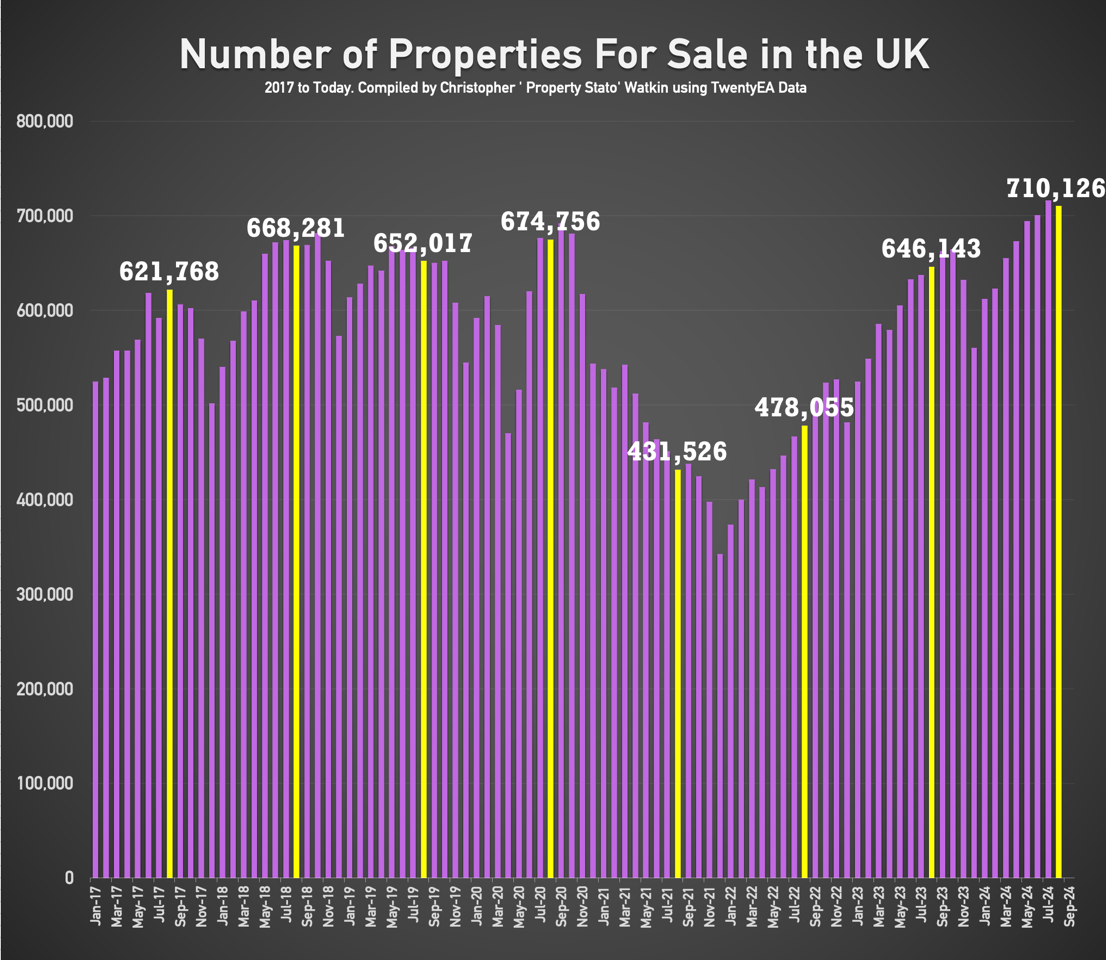
Price Reductions: This week, 25,878 properties saw price reductions. Yet there are higher stock levels. Stock end of month August 2024 (latest data) levels are at 710k . This means that ONLY 1 in 6.6 properties each month are being reduced. Is that enough? I don’t think so!
Average Asking Price for Reduced Properties this week: £430,869. (2024 weekly average – £398,665)
Gross Sales: 25,303 properties were sold stc last week. 2024 weekly average : 24,682 Gross Sales).
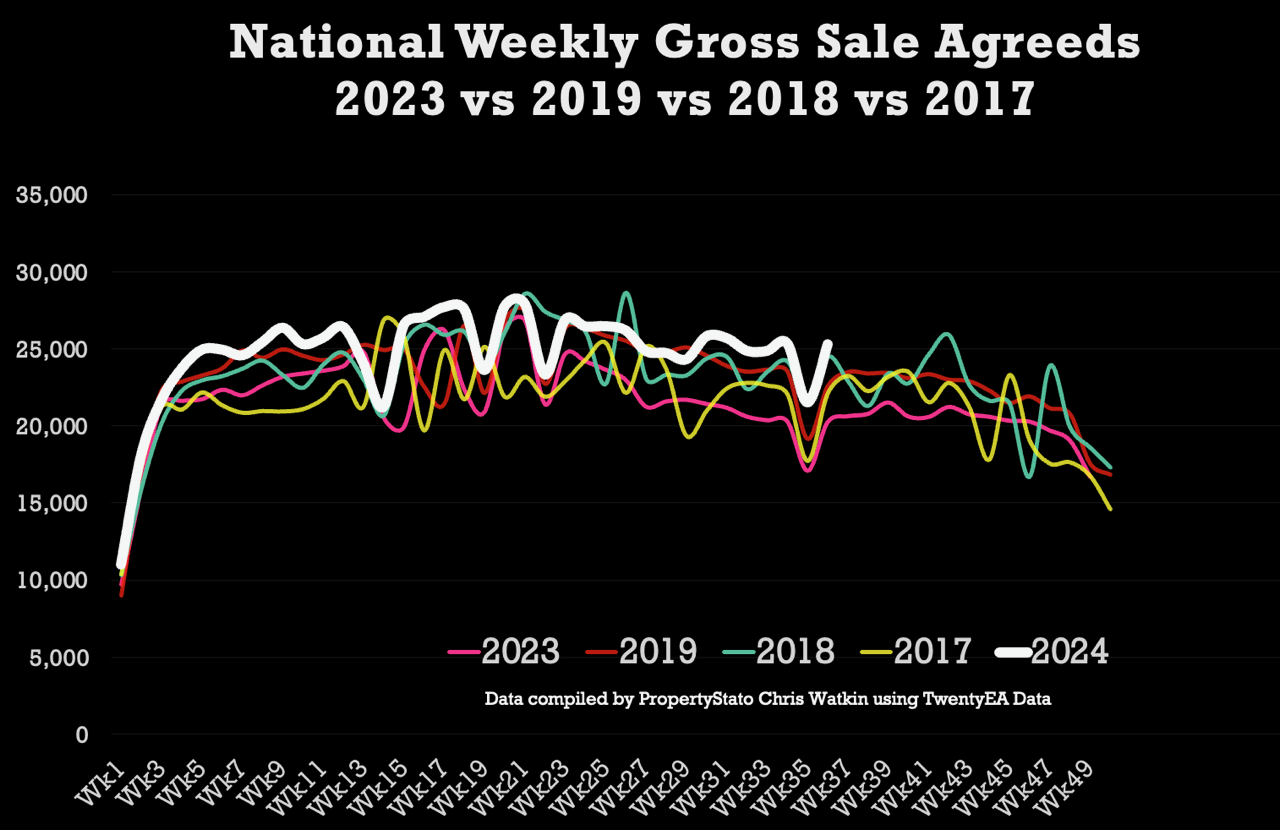
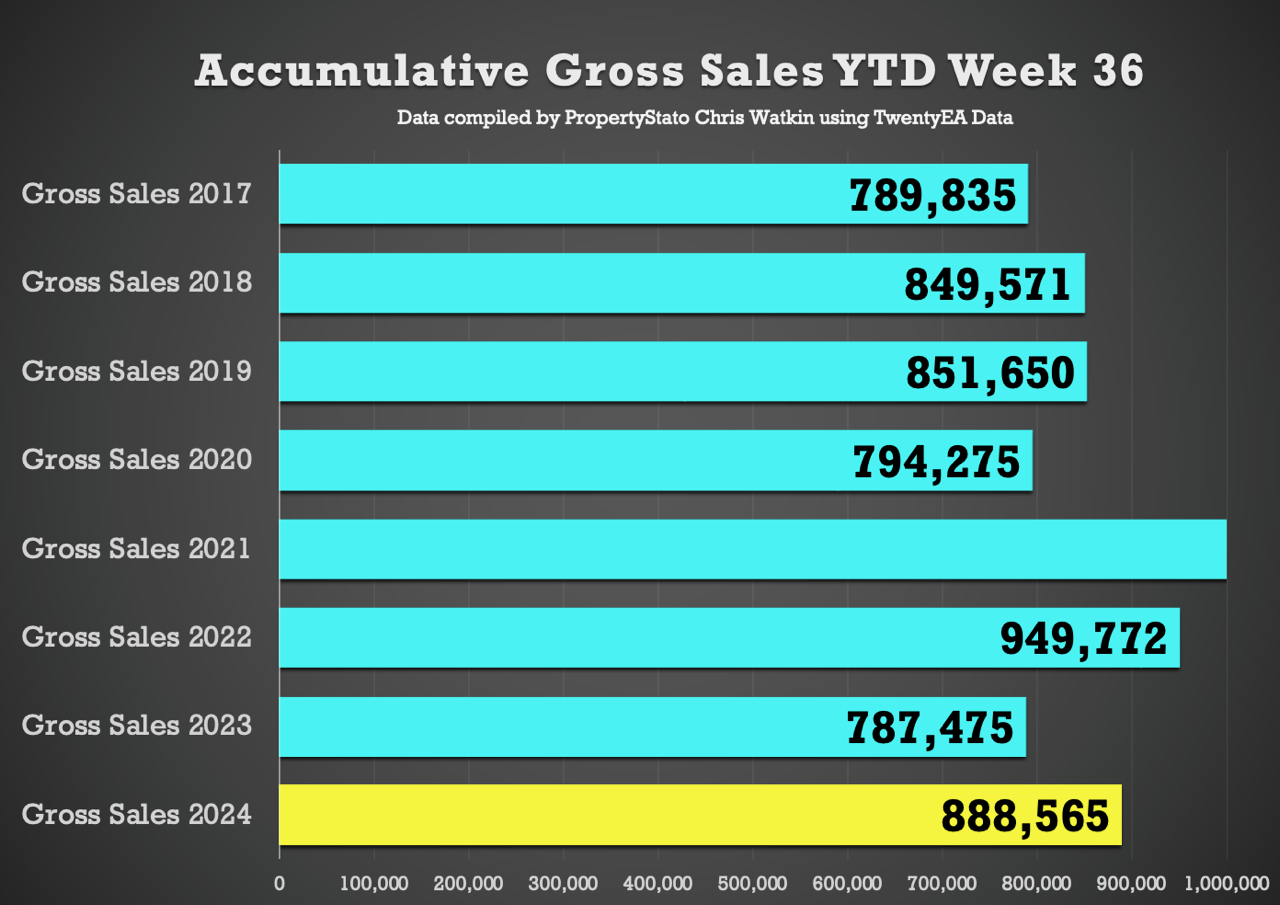
Accumulative Gross Sales YTD: The total YTD stands at 888,565, exceeding the average YTD Gross sales figure of 830,352 from 2017/18/19 and 787,475 in the same week 36 in 2023.
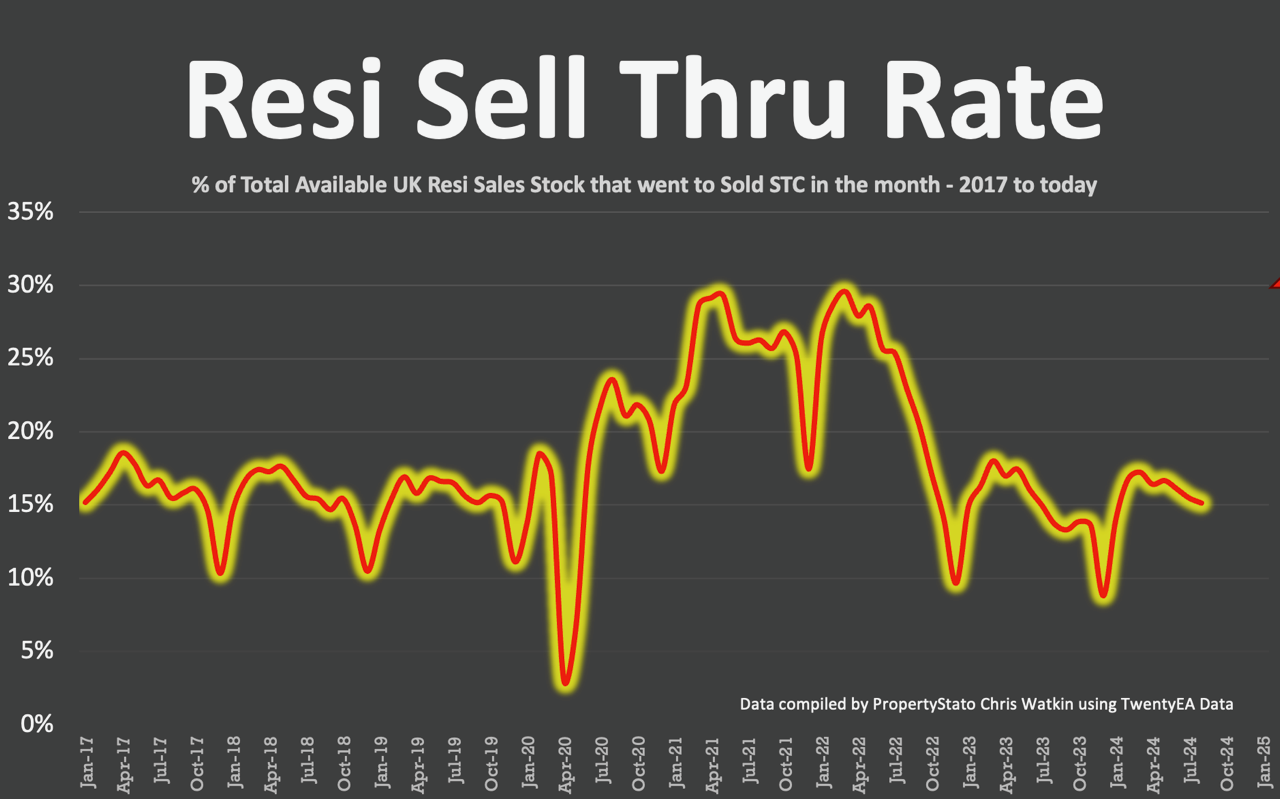
Sale Thru rate: (NEW MONTHLY STAT) : UK Estate Agents sold 15.13% of their Resi sales stock in August ’24. The 7 year long term average is 17.9% per month – yet dont forget that was only in mid/late 20%’s in the crazy years of 20/21/22). A decent bellwether and good comparison is the 2017/18/19 average at 15.57% per month.
Average Asking Price of Sold STC Properties: Still staying in the £350/370k’s range (like has been for 2 years) at £355,244.
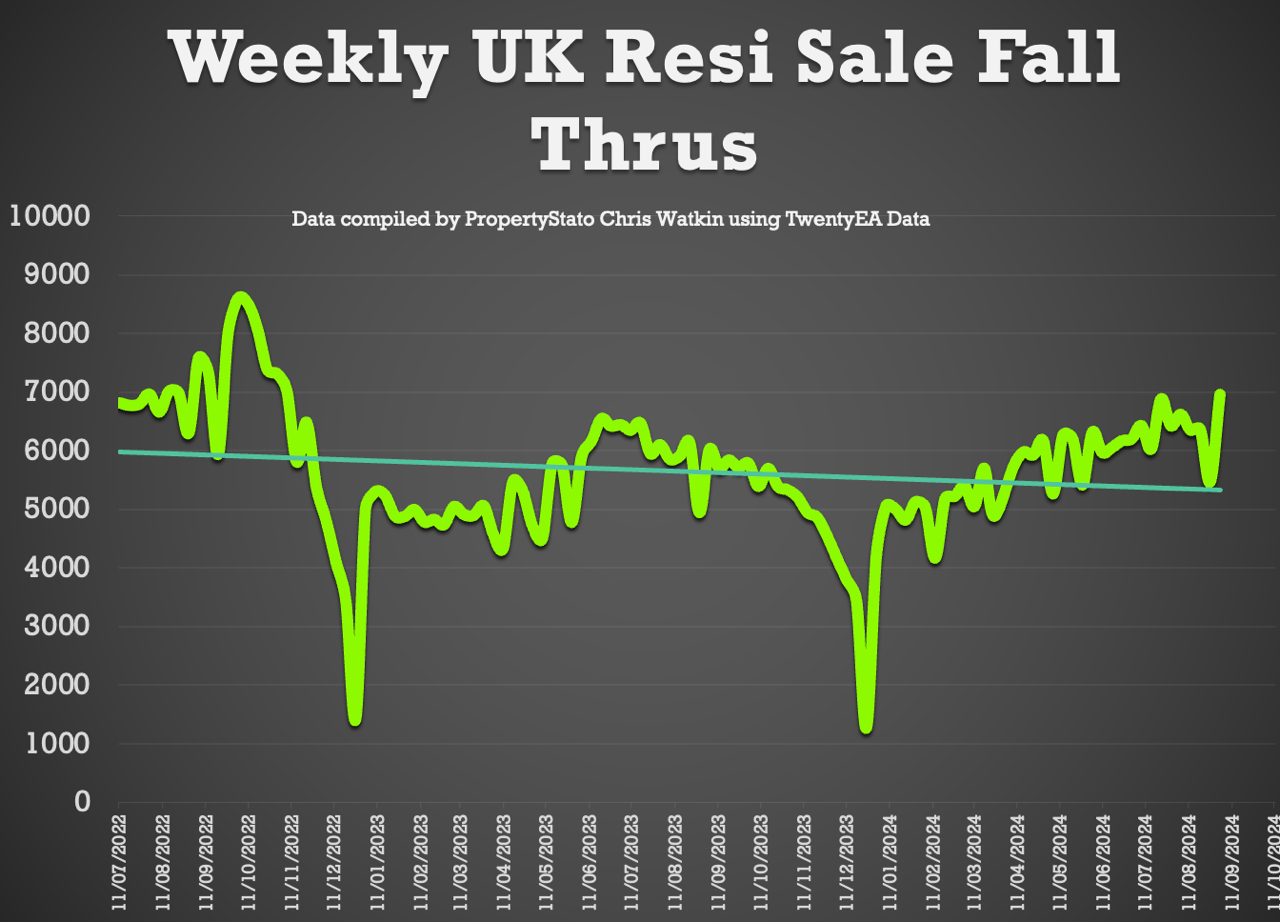
Sale Fall Throughs: Fall thrus this week jumped to 6,963 (as normally the case with post Bank Holiday week). YTD weekly average is 5,689.
Sale Fall Through % Rate: 27.5% for week 35. (Comparison – 25.2% for the last 3 months, whilst the long term 8 years average is 24.2% & it was 40%+ in Q4 2022 in the Truss budget!). Graph 18
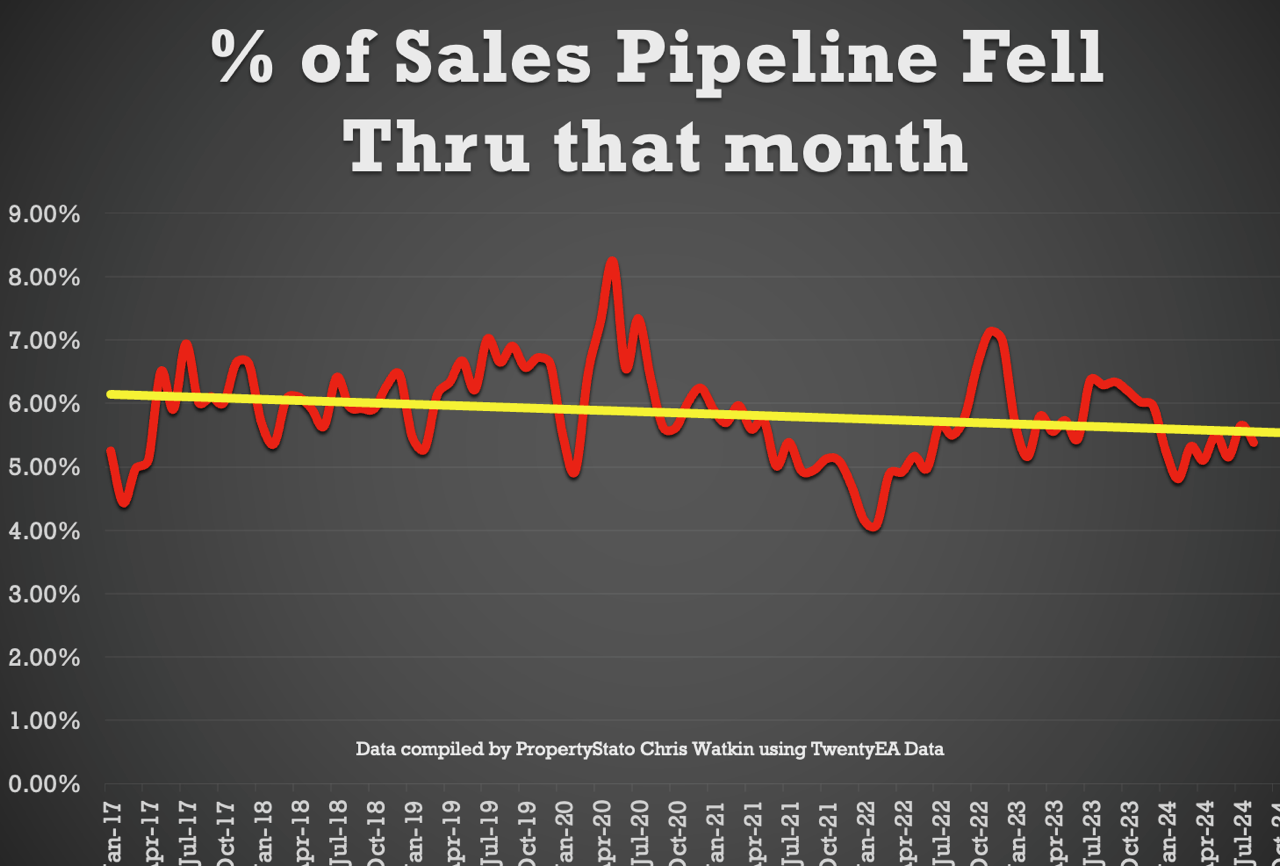
Sale Fall Throughs in the Month as a % of the total Sales Pipeline (NEW STAT) – Good news – this dropped from 5.66% in July to 5.39% in August. (8 year average 5.32%) – Conclusion – even though we are getting higher fall through rates (units wise)because the sales pipeline is higher, it just shows looking at the graph, that everything is okay (look at the yellow long-term trend line).
Net Sales (Gross sales this week less fall thrus this week) – 18,340, up from 16,060 last week.
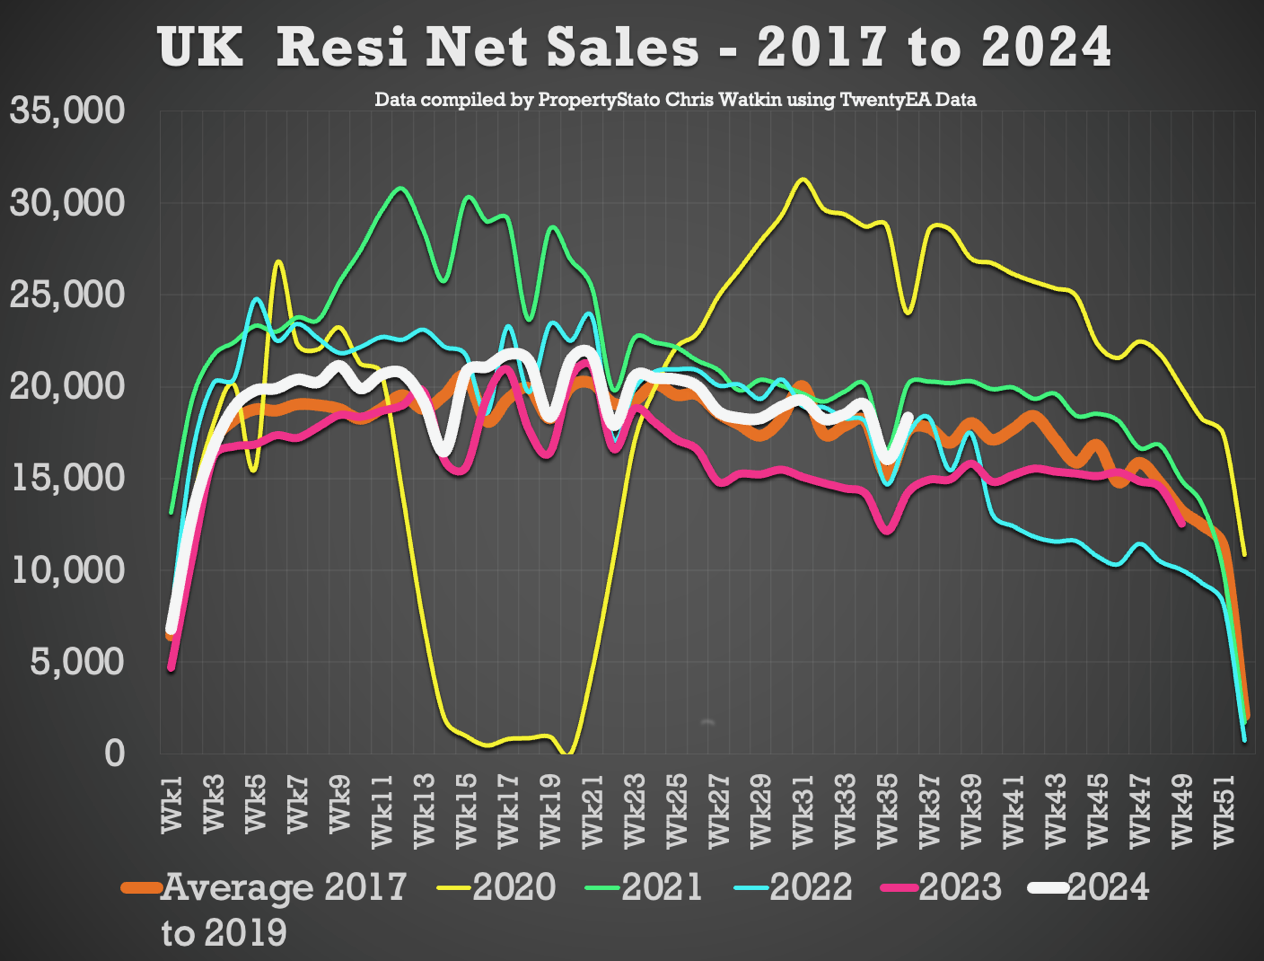
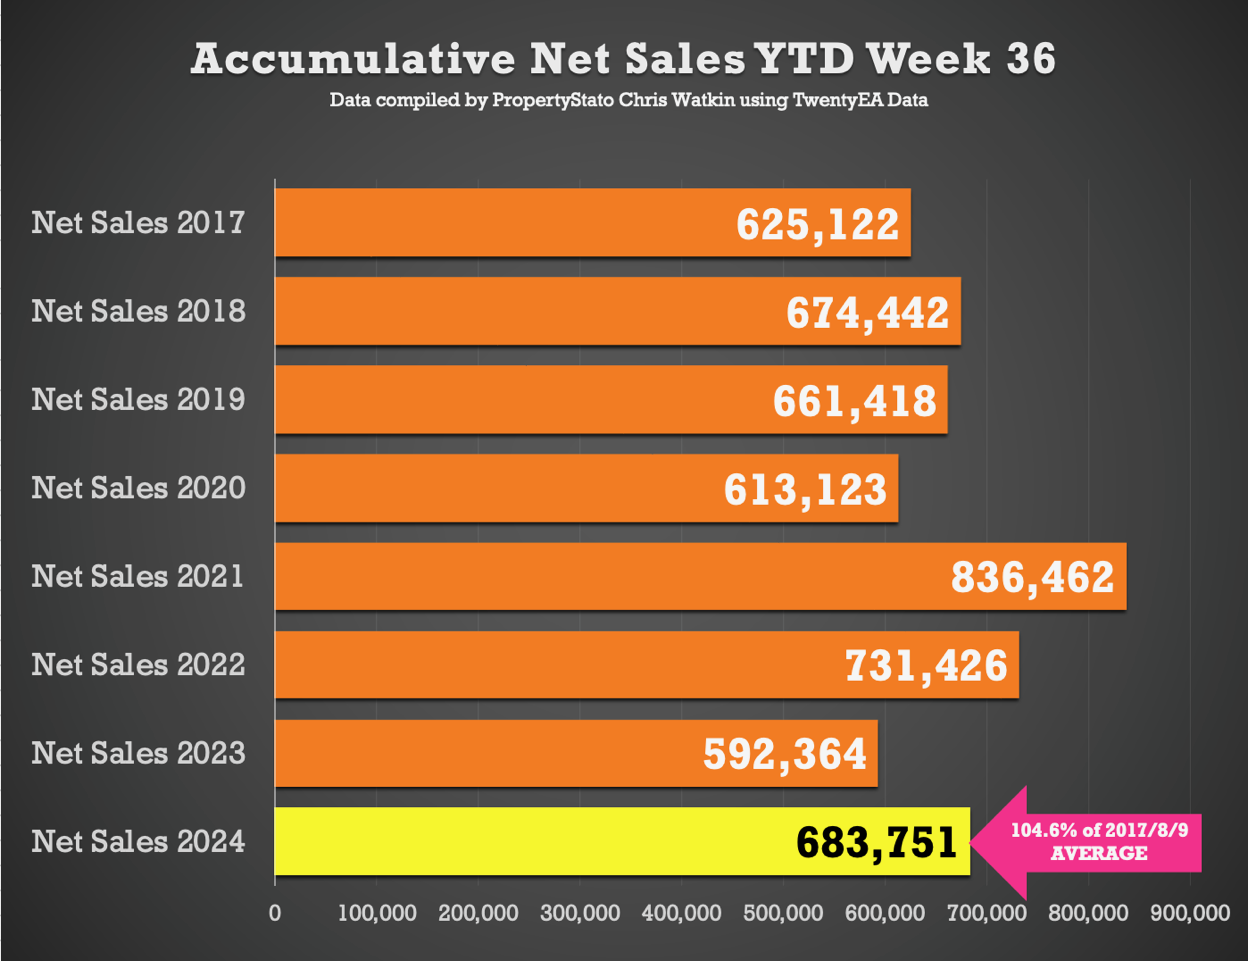
Accumulative Net Sales YTD: The total stands at 683,751, still 4.6% higher than the 17/18/19 YTD Net sales average (653,661) and 15.4% higher than the YTD figure for 2023 for Net Sales (592,364).
Resi Sales Stock on the Market : 710k at end of August (down from 715k at end of July). For comparison, Aug ’23 – 646k, Aug ’22 – 478k, Aug ’21 – 421k, Aug ’20 – 674k, Aug ’19 – 652k.
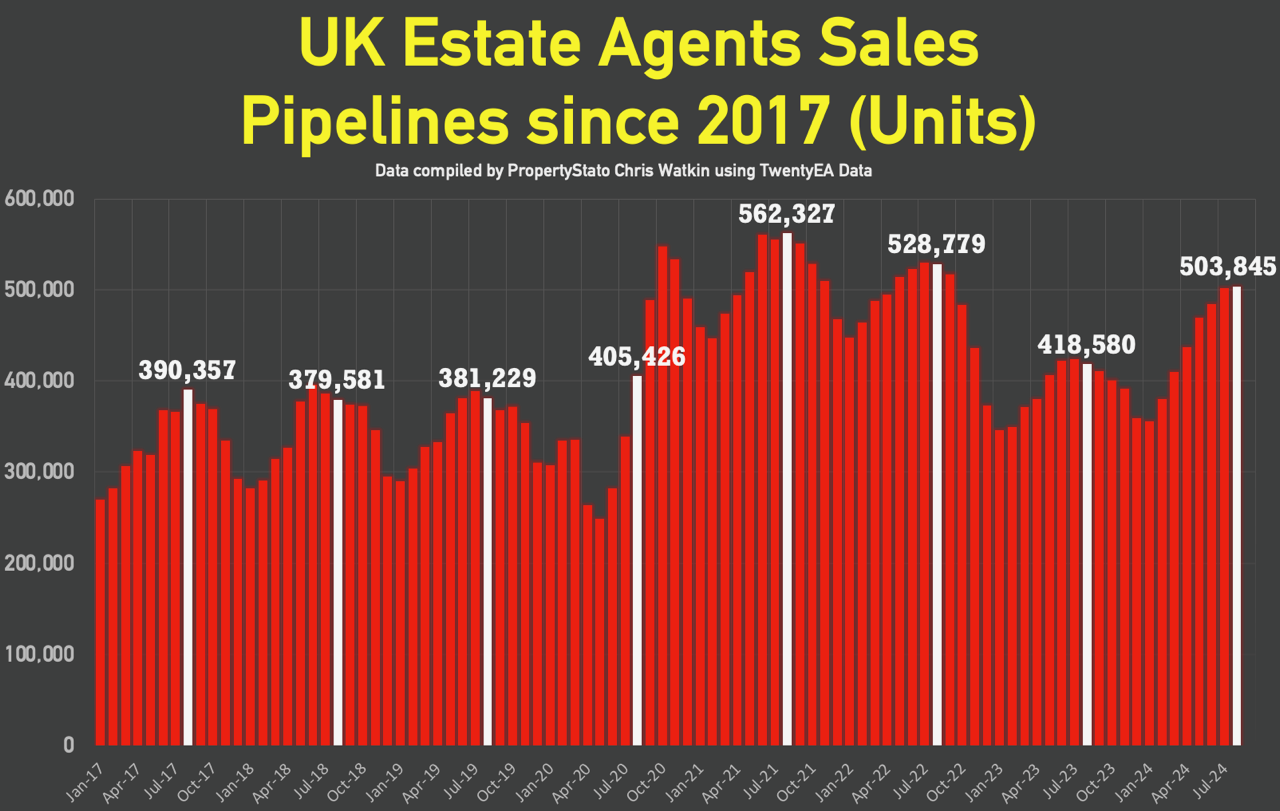
Resi Sales Sold STC Pipeline (Units) : 504k at end of August. For comparison, Aug ’23 – 416k, Aug ’22 – 529k, Aug ’21 – 562k, Aug ’20 – 405k, Aug ’19 – 381k.
Graph 27
UK House Prices – Noticing UK House Prices being achieved in the last few months have started to drift down slightly. Very minimal – this will be reflected in the Land Registry in Jan & Feb 25 figures
Local Focus this week was Ipswich
Comments are closed.