

In this week’s ‘UK Property Market Stats Show’ on YouTube for week ending Sunday, 11th August 2024, Christopher Watkin talks with this week’s special guest, James Forrester, about what is happening in the UK property market this week.
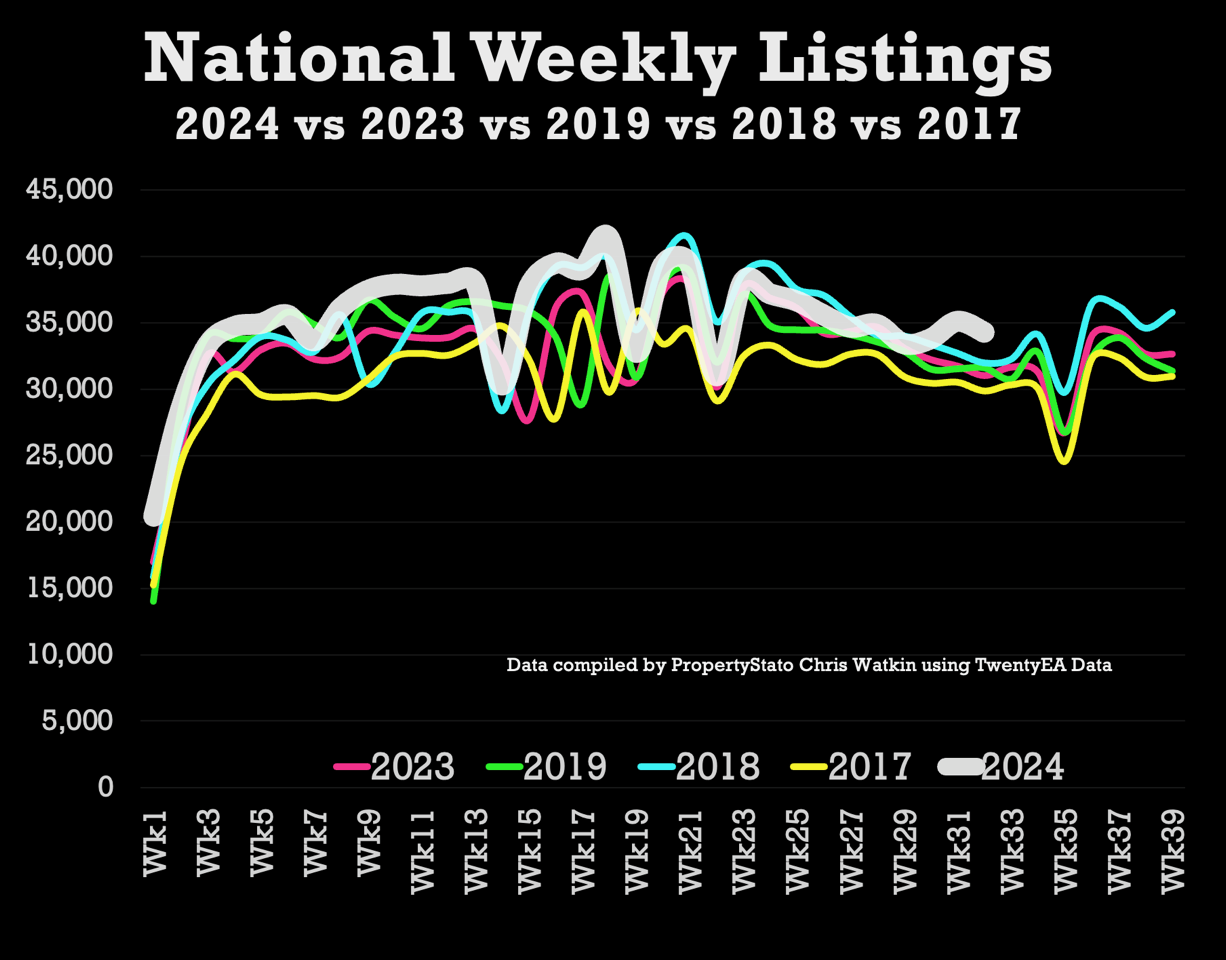
+ Listings – 34.3k UK listings this week. 7.1% higher YTD than 2017/18/19 YTD average & 7.1% higher than 2023 YTD.
+ Total gross sales – 24.9k – 20.7% higher than the same week in 2023. Also, 6.8% higher than 2017/18/19 YTD levels & 11.6% higher than 2023 YTD levels.
+ Net sales – 18.3k this week, 23.7% higher than the same week in 2023 & 11.6% higher YTD in 2024 compared to YTD 2023.
+ % of homes exchanging vs homes unsold – In July 2024, 52.47% of homes that left UK estate agents books exchanged contracts; the remaining 47.53% were withdrawn off the market, unsold. In essence, you have a flip of the coin chance of actually selling, homeowners moving and the estate agent getting paid.
+ UK house prices – Sale Agreed £/sq.ft in July 2024 are 2.6% higher than those achieved in January 2024.
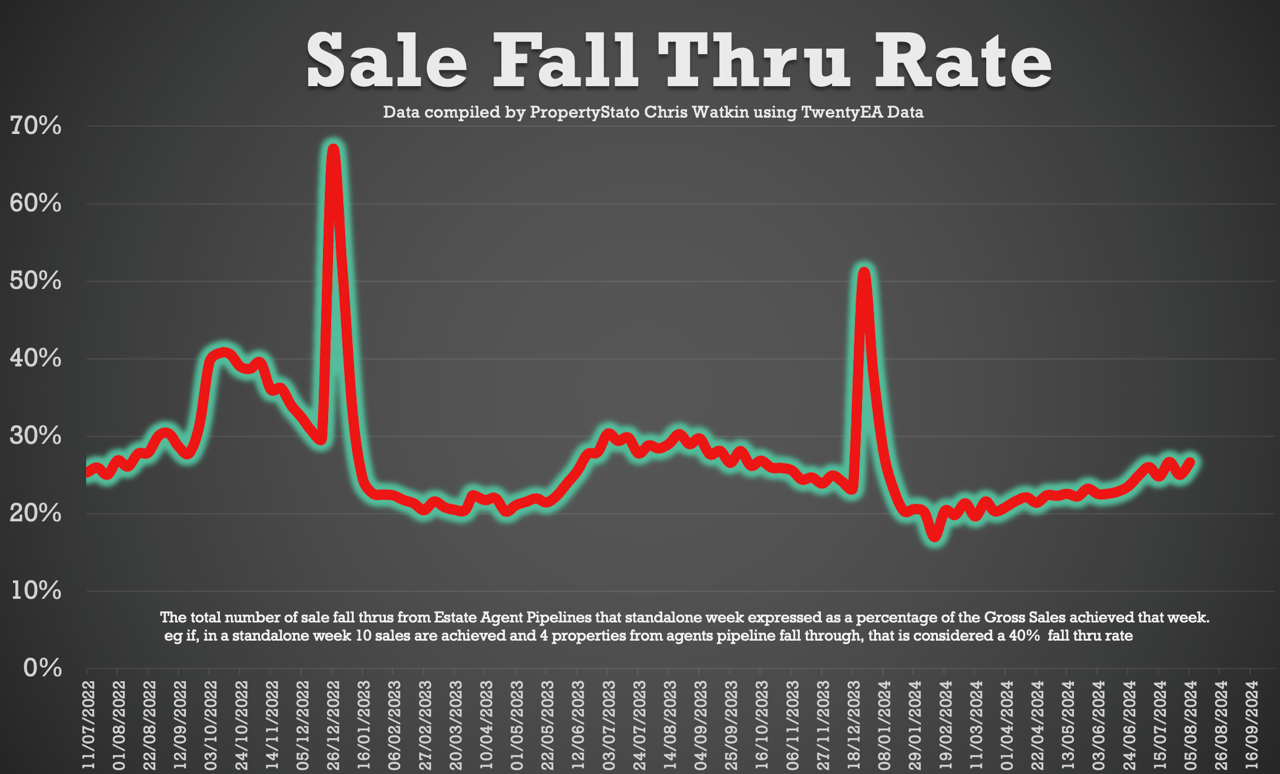
+ Sale fall-throughs – As a % of gross sales agreed, these rose to 26.6% this week (from 25% last week). Discussed at length in the video if this is an issue or not. For context, the seven-year long-term average is 24.2% and it was 40%+ in the two months following the Truss Budget in the Autumn of 2022.
+ Overvaluing affects fall through rates – For a UK home that takes over 100 days to sell (i.e., more than 100 days between coming on the market and agreeing on a sale), that home has only just over a one in two chance of then subsequently exchanging and completing (56%, to be precise) with the remaining 44% of sales falling through. Yet if the property’s sale is agreed upon in under 25 days, the chance of exchanging and completing rises to nearly 19 out of 20 times (94%, to be precise), with the remaining 6% of sales falling through.
Chris’s in-depth analysis (Week 32):
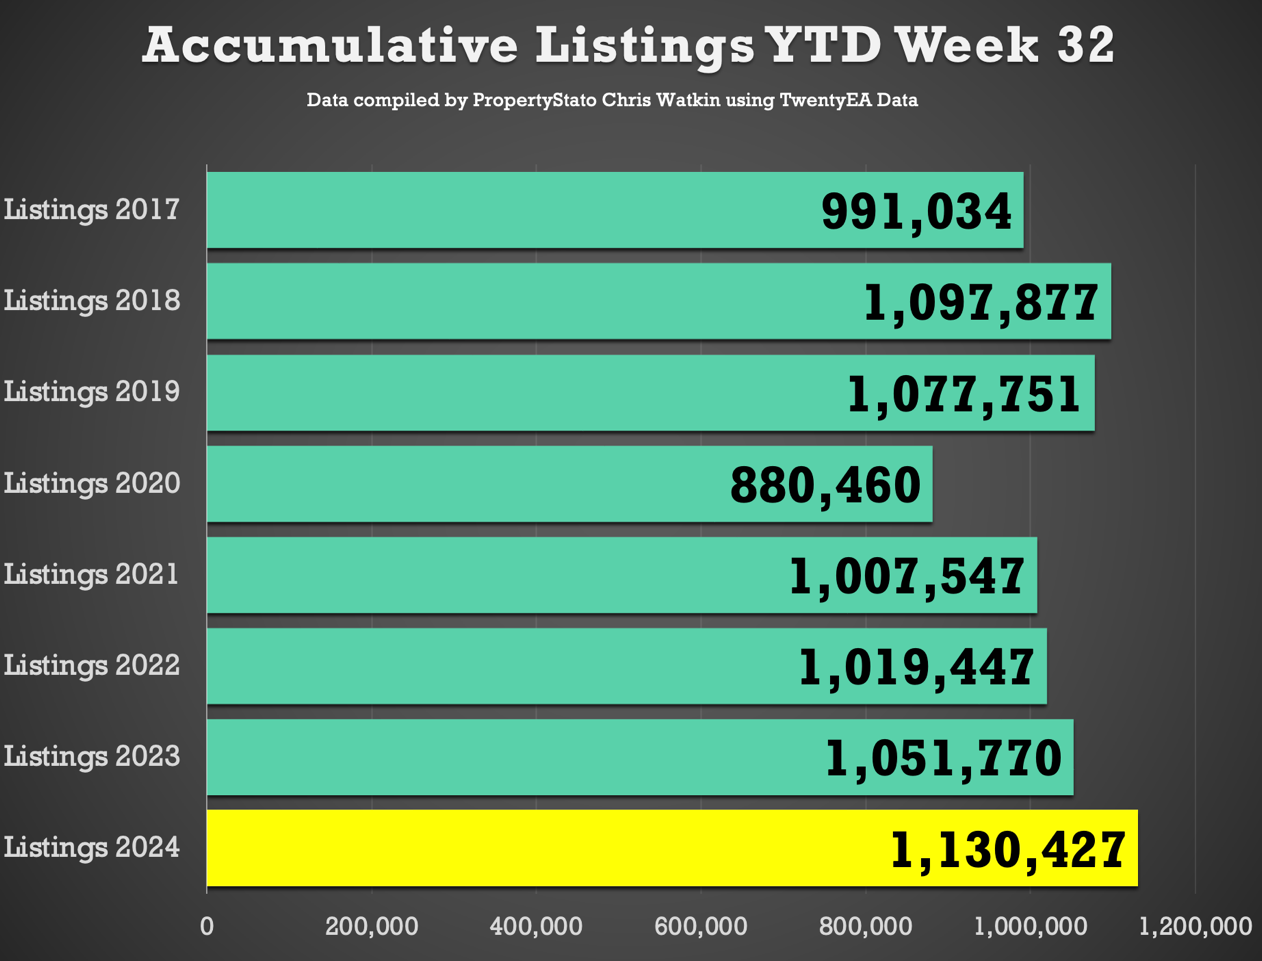
+ New properties to market: The UK saw 34,285 new listings, which is around 10% higher than expected (see the listing graphs). This year’s YTD listings stand at 1,130,427, 9.5% higher than the historical eight-year YTD average of 1,032,039, 7.1% higher than YTD 2017/18/19 and 7.5% higher YTD 2023. Just FYI – weekly 2024 average: 35,326.
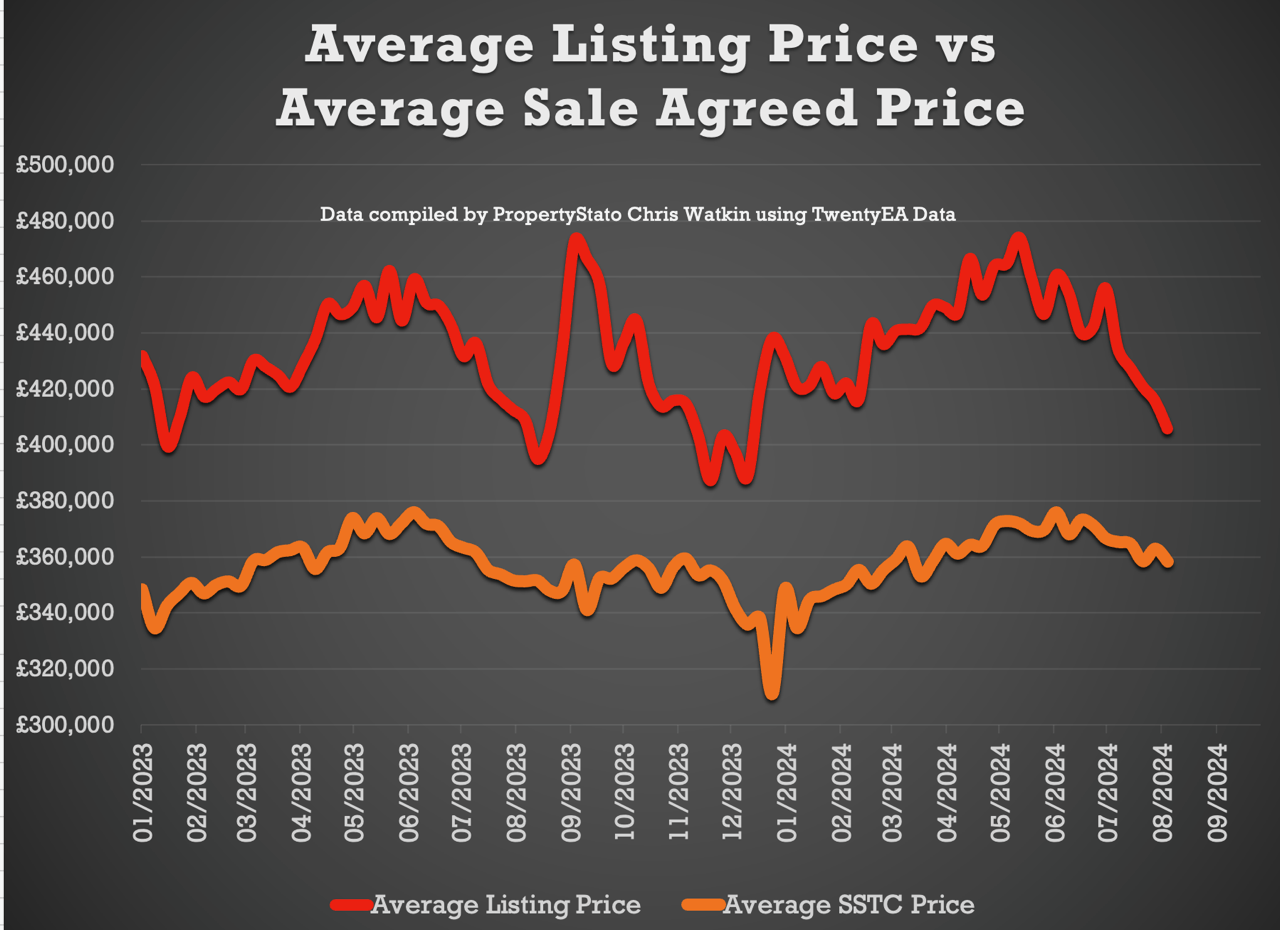
+ Average listing price: £405,827 (2024 weekly average – £440,038).
+ Average asking price of this week’s listings vs average asking price of the properties that sale agreed this week: 13.2%. This is great to see it’s not been the 20%’s for a few weeks. The long-term eight-year average is between 16% and 17%. (Weekly 2024 average 22.1%.)
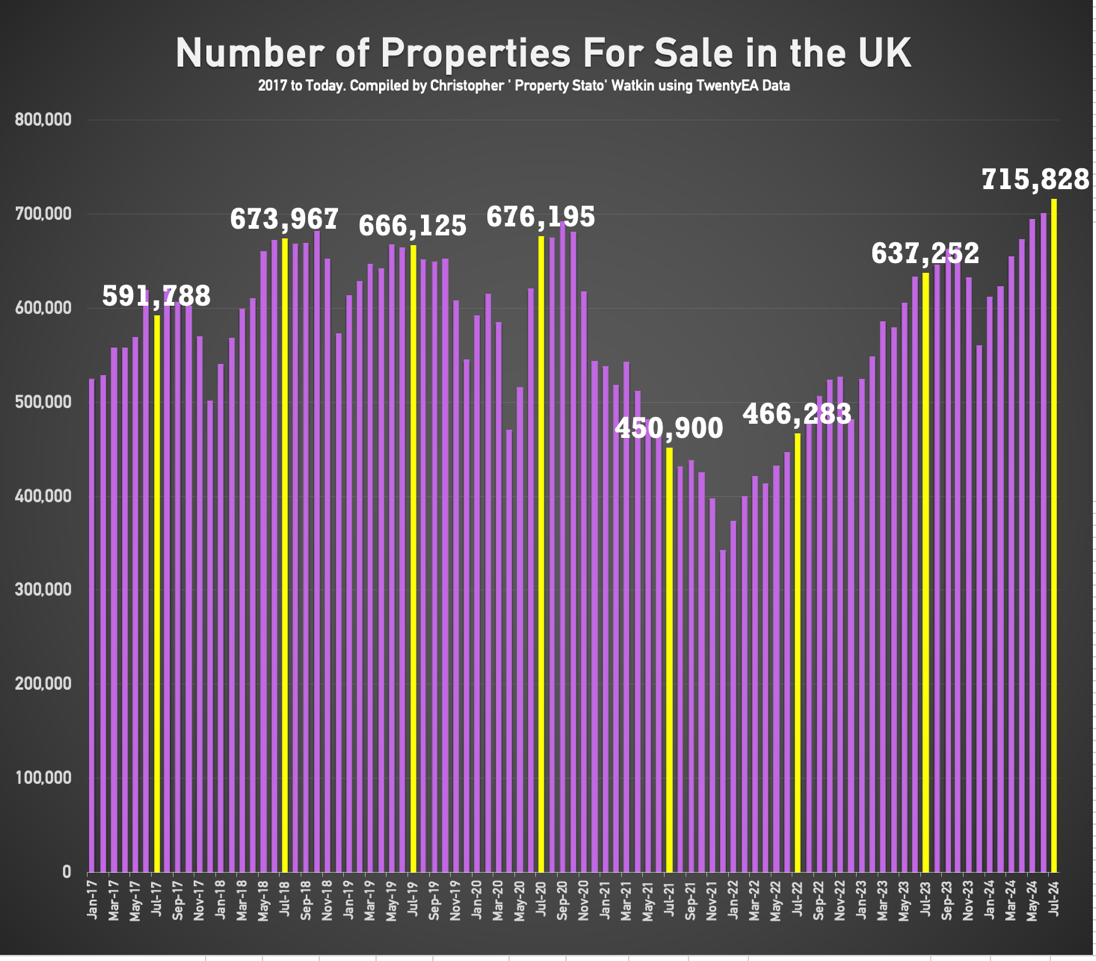
+ Price reductions: This week, 22,017 properties saw price reductions, higher compared to the eight-year week 32 average of 16,920. Yet there are higher stock levels. Stock end of month July 2024 (latest data) levels are at 715,828. This means that ONLY 1 in 7.73 properties each month are being reduced. Is that enough?
+ Average asking price for reduced properties this week: £387,392. (2024 weekly average – £398,857.)
+ Gross sales: 24,876 properties were sold STC last week (slightly lower than week – see the graph). 2024 weekly average: 24,735 gross sales.
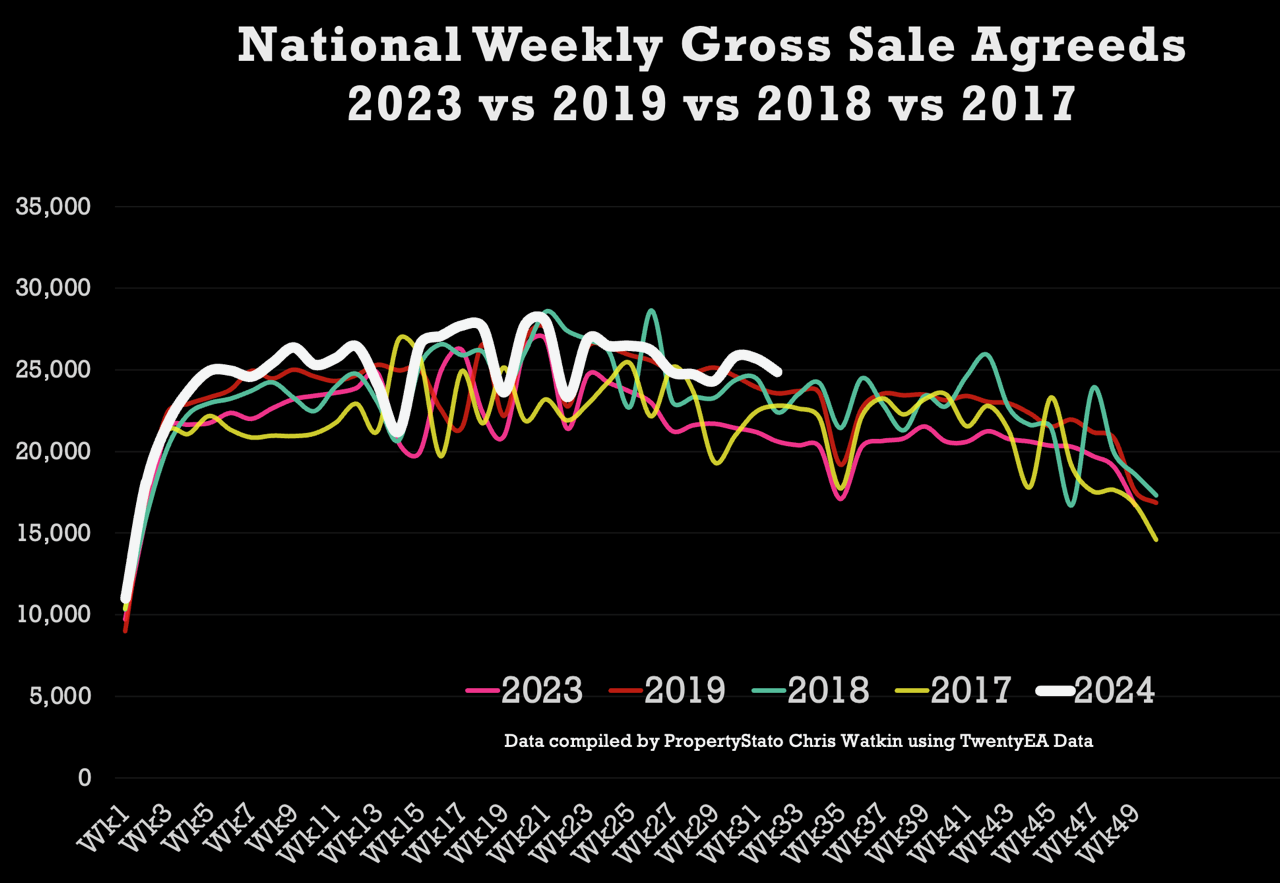
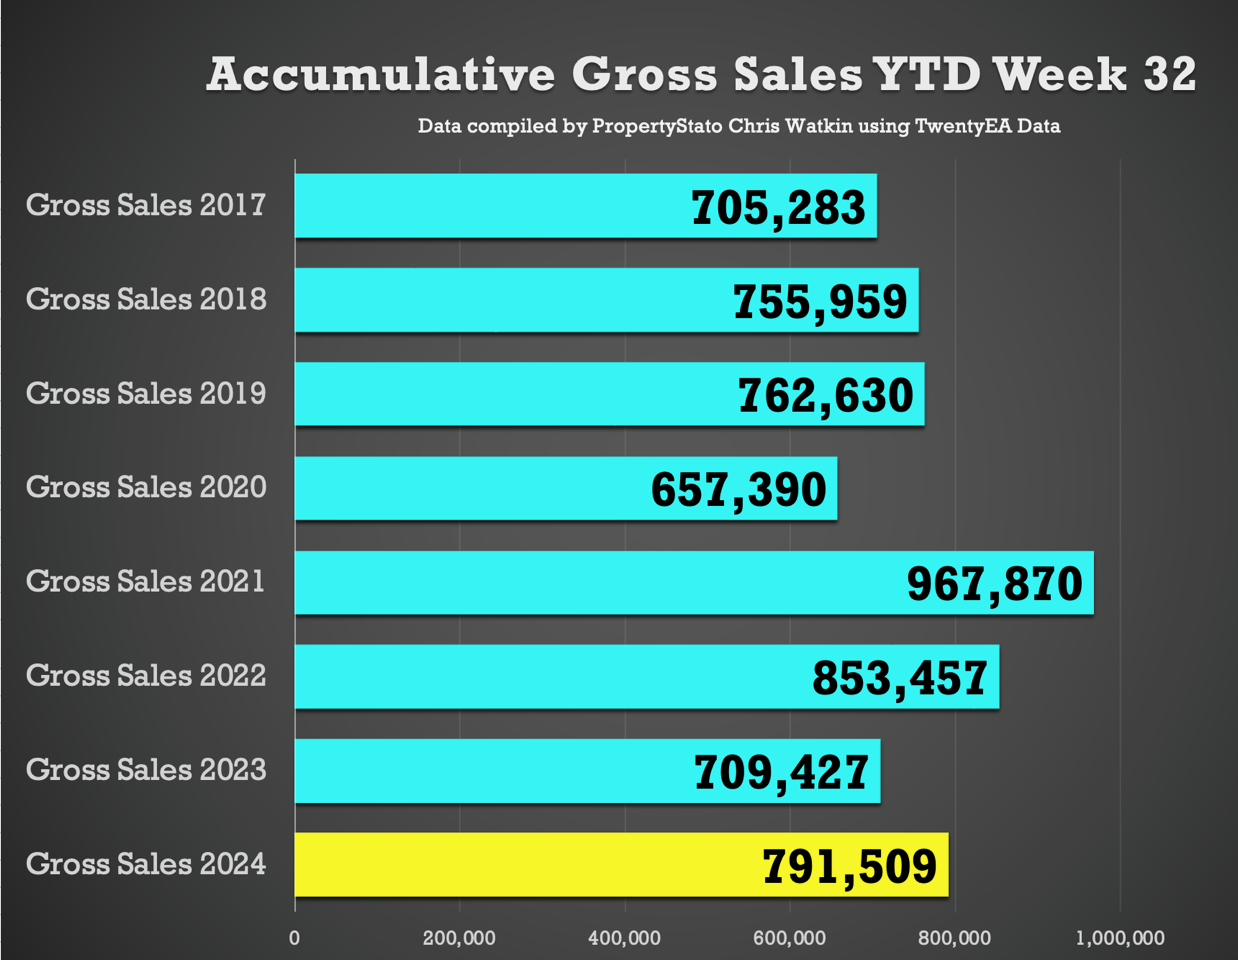
+ Accumulative gross sales YTD: The total YTD stands at 791,509, exceeding the average YTD Gross sales figure of 741,291 from 2017/18/19 and 709,427 in the same week 32 in 2023.
+ Average asking price of sold STC properties: Still staying in the £350/370k’s range (like has been for 2 years) at £358,364.
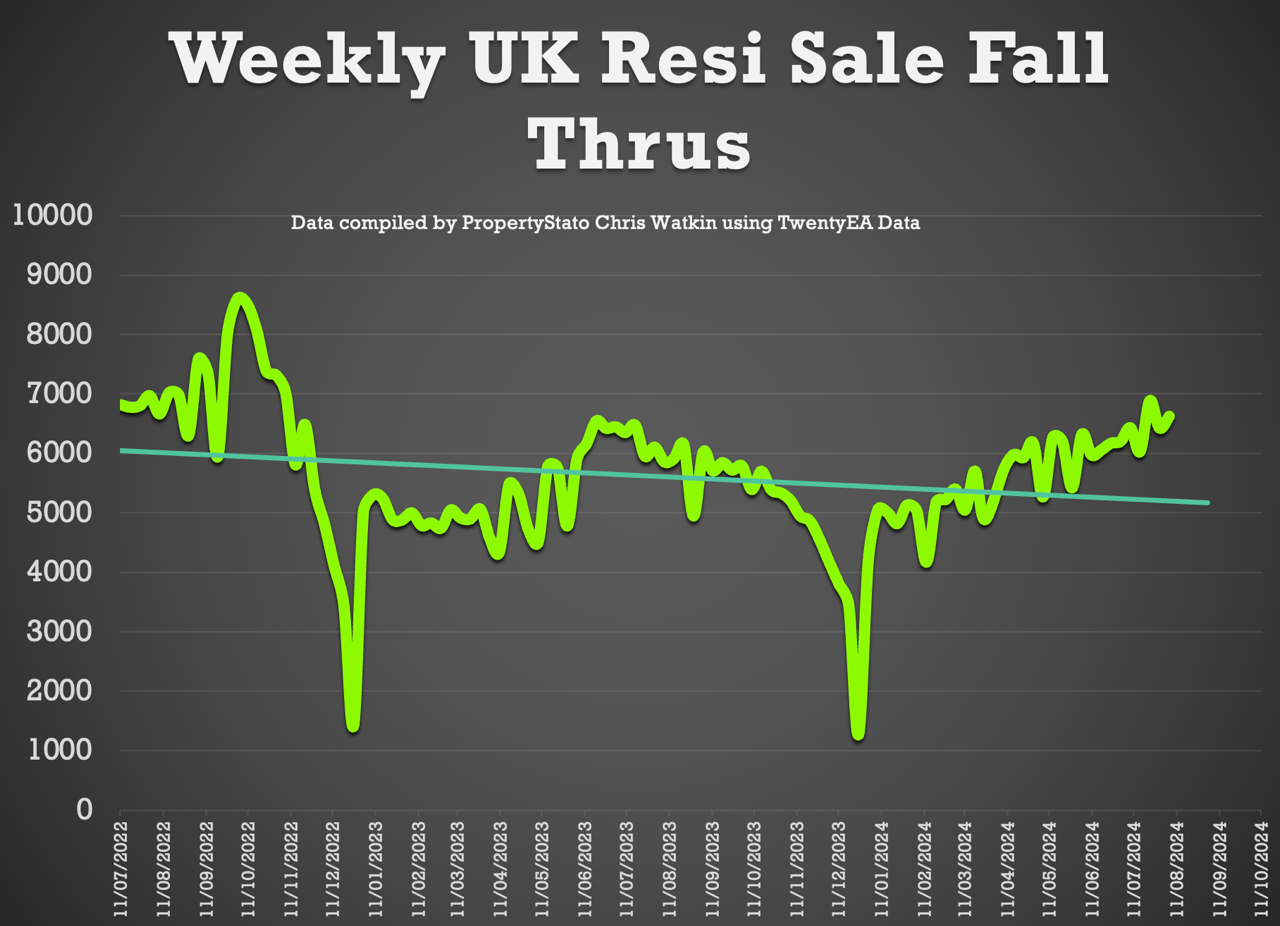
+ Sale fall throughs: This week at 6,623 – a slight increase from last week. Last three months’ weekly average 6,230 and 2024 YTD weekly average is 5,615.
+ Sale fall through % Rate: 26.62% for week 32. (Comparison – 24.1% for the last three months, while the long term eight-year average is 24.2% & it was 40%+ in Q4 2022 in the Truss budget!).
+ Net sales (gross sales this week less fall throughs this week) – 18,253.
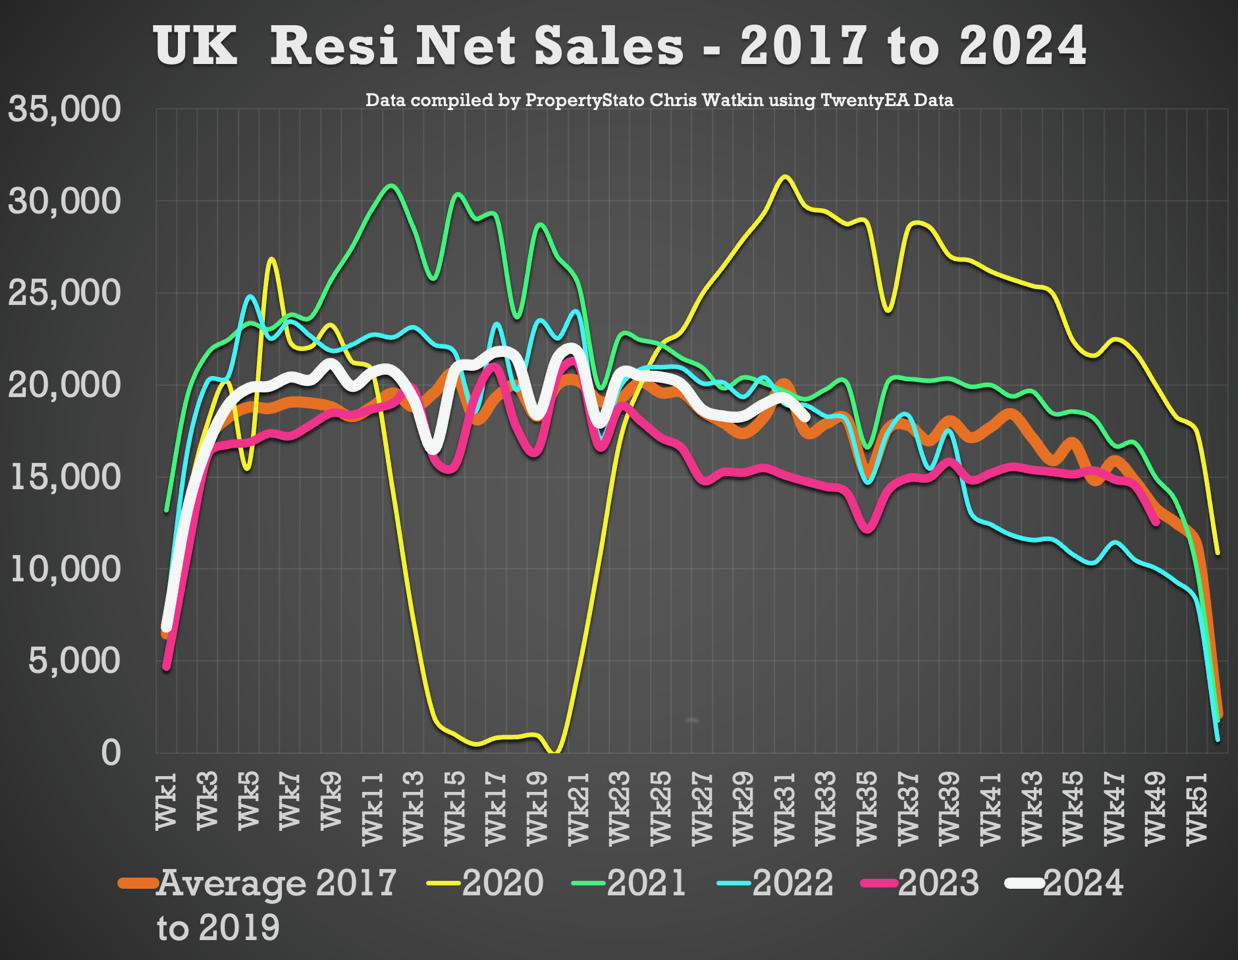
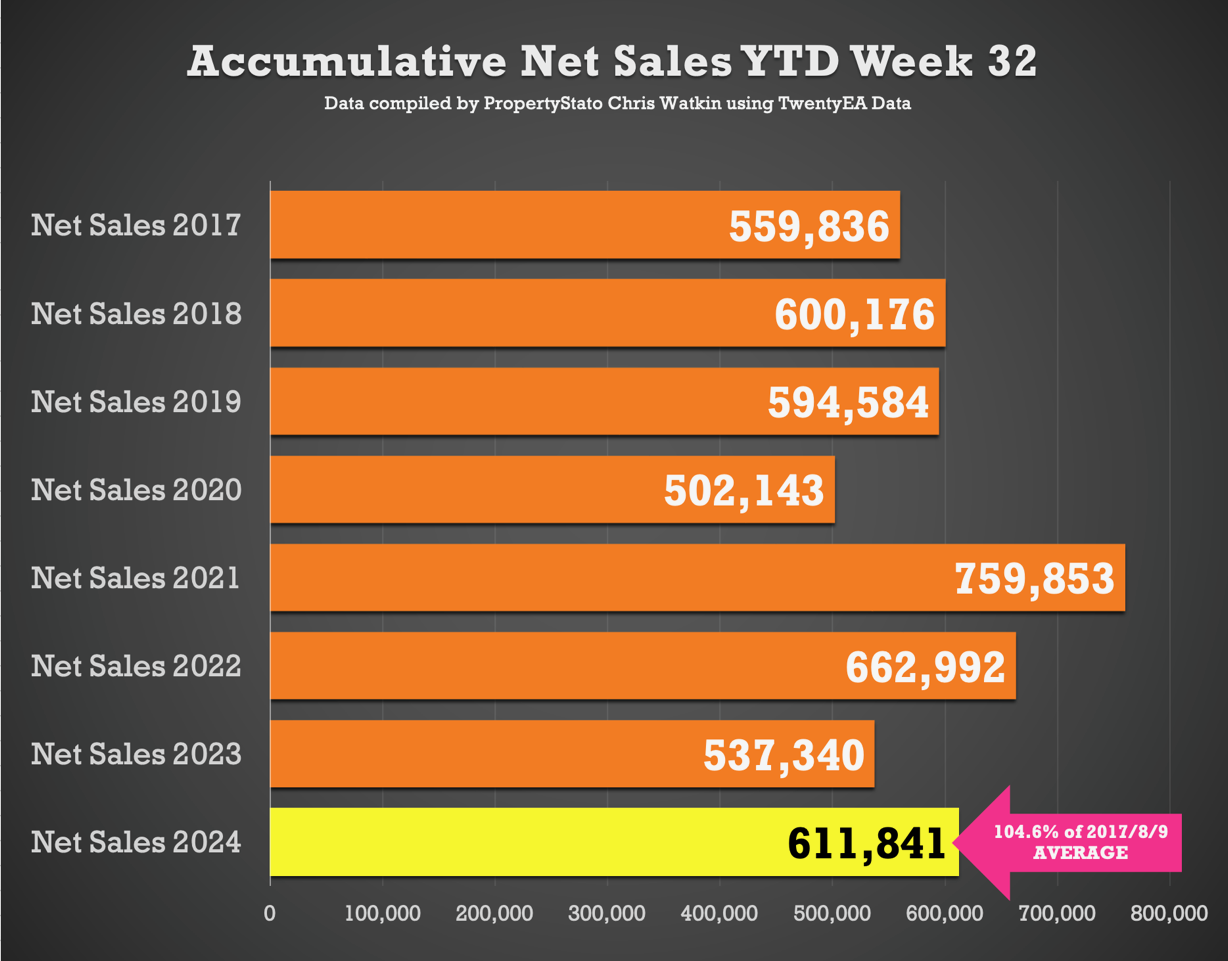
+ Accumulative net sales YTD: The total stands at 611,841, 4.6% higher than the 17/18/19 YTD net sales average (584,865) and 13.9% higher than the YTD figure for 2023 for net sales (537,340).
+ Resi sales stock levels (on the market and for sale) – end of July 2024 for UK – 715,828 – 12.3% higher than end of July 2023. Split down by Region…
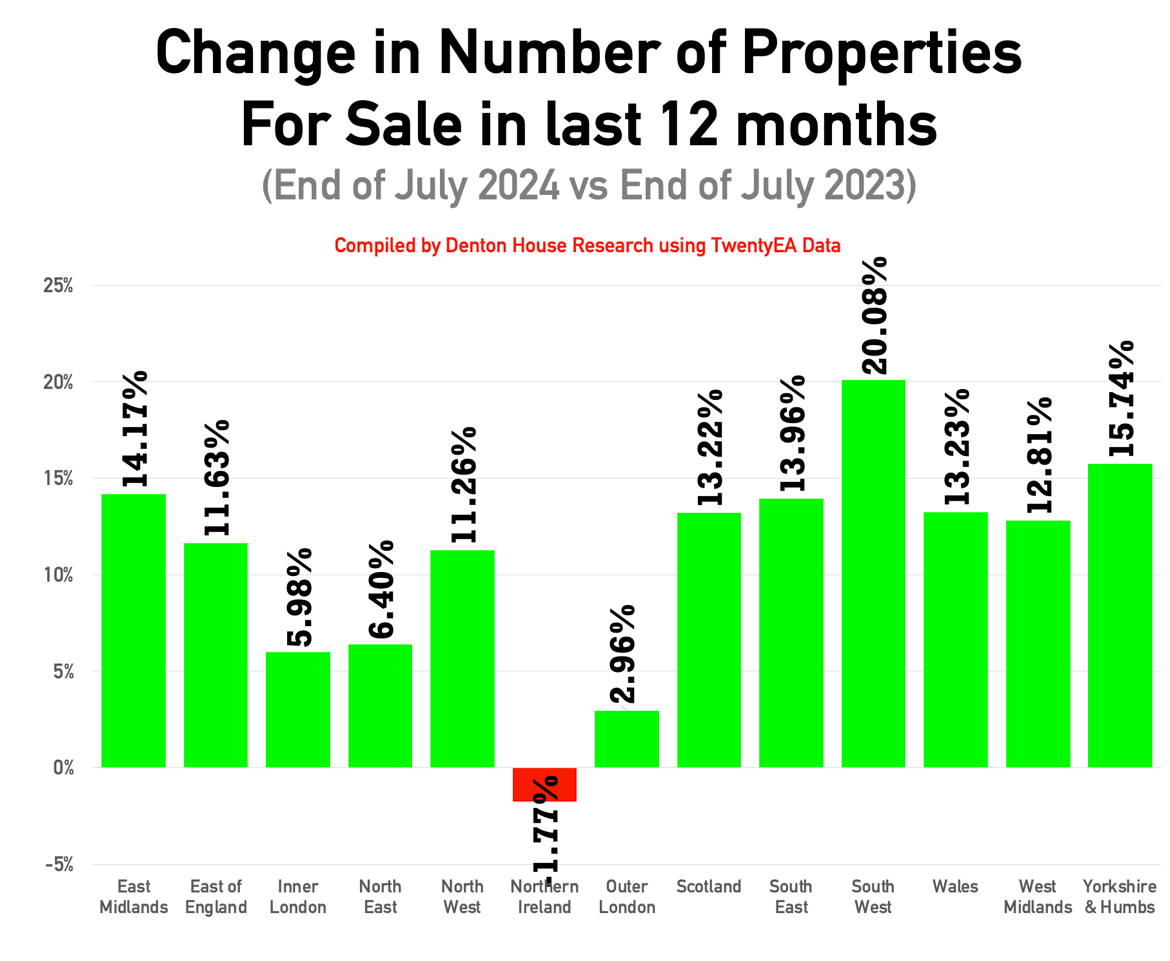
South West: 20.08%
Yorkshire & Humber: 15.74%
East Midlands: 14.17%
South East: 13.96%
Scotland: 13.22%
Wales: 13.23%
West Midlands: 12.81%
East of England: 11.63%
North West: 11.26%
Outer London: 2.96%
North East: 6.40%
Inner London: 5.98%
Northern Ireland: -1.77%
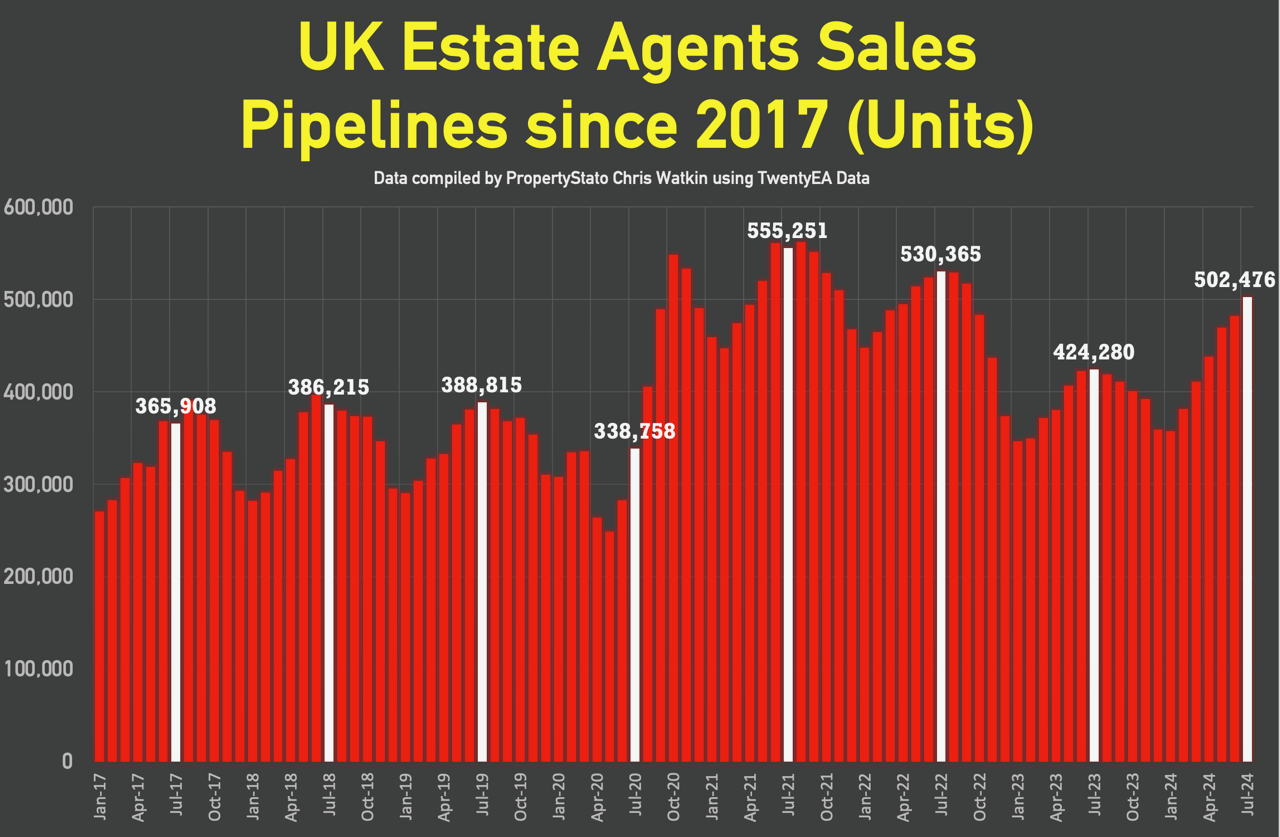
+ Resi sales pipelines (units) – the number of properties in estate agents sales park lines at the end of July 2024 at 502,476, 18.43% higher than the same time frame in July 2023. Interestingly, the time it takes to get a property through to exchange is six days shorter compared to 12 months ago.
Local focus this week was Haywards Heath.
Bonus Stat –
Residential Sale Fall Thru Rates in last 12 months
upto 200k – 22.9%
200k to 300k – 23.3%
300k to 400k – 23.8%
400k to 500k – 24.4%
500k to 600k – 24.9%
600k to 750k – 25.0%
750k to 1m – 24.2%
1m to 2m – 22.6%
2m + – 21.9%
Based on 240,008 Resi sale fall thrus in the last 12 months
You must be logged in to like or dislike this comments.
Click to login
Don't have an account? Click here to register