

In this week’s YouTube ‘UK Property Market Stats Show’ for week ending Sunday, 4th August 2024, Chris Watkin and Iain McKenzie discuss the what is happening in the UK property market for Week 31 of 2024.
The main headlines:
+ UK house prices on homes sold (STC) in July continue to remain strong at £348/sq.ft – still 6% higher than Jan 2024.
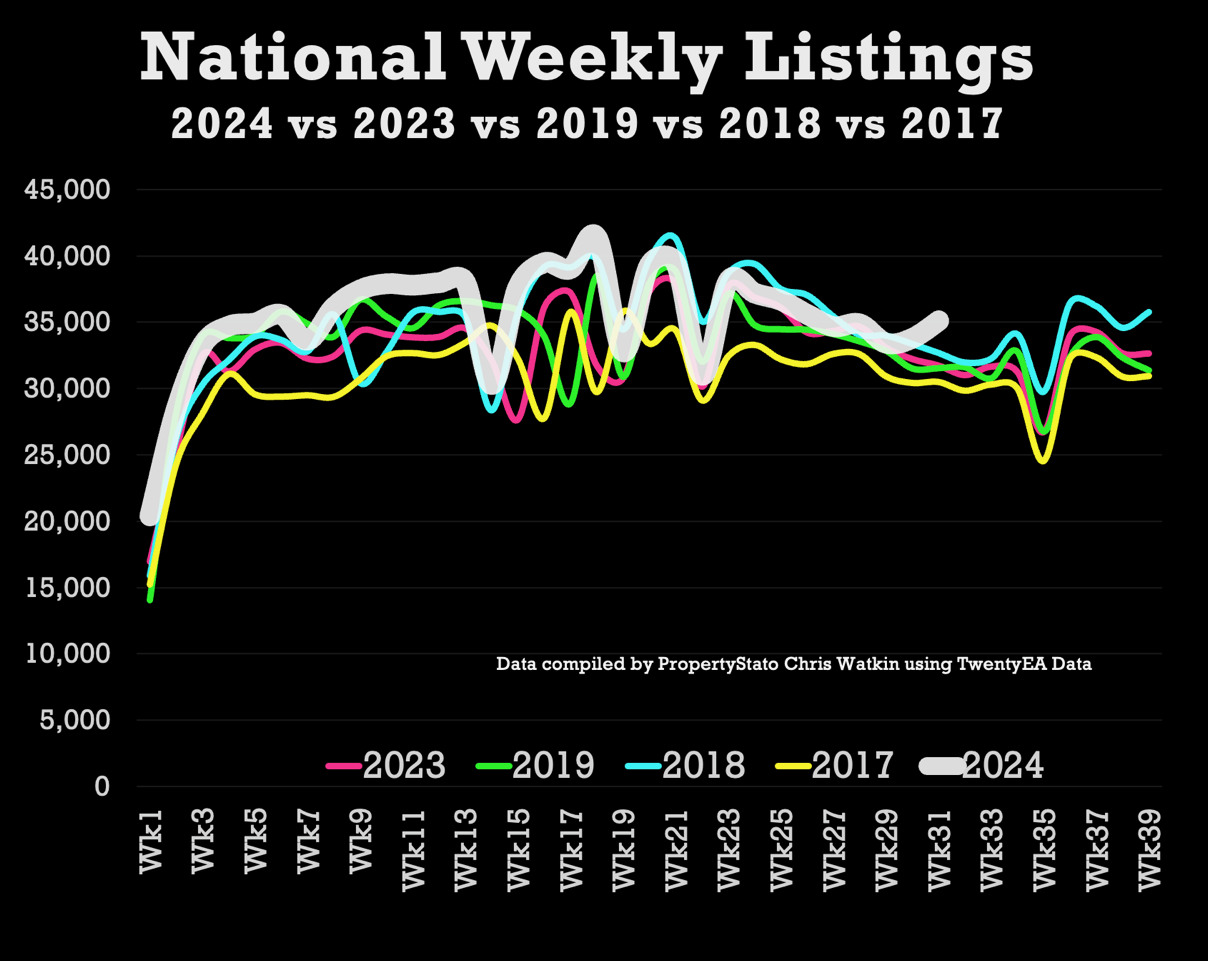
+ Listings – 35.1k UK listings this week. 7% higher YTD than 2017/18/19 YTD average & 7.5% higher than 2023 YTD.
+ Total gross sales – 25.7k – 21.3% higher than the same week in 2023. Also, 6.7% higher than 2017/18/19 YTD levels & 11.3% higher than 2023 YTD levels.
+ Net sales – 19.3k this week, 27.8% higher than the same week in 2023 & 13.6% higher YTD in 2024 compared to YTD 2023.
+ % of homes exchanging vs homes unsold – In July 2024, 52.47% of homes that left UK estate agents books exchanged contracts; the remaining 47.53% were withdrawn off the market, unsold. In essence, you’ve a flip of the coin chance of actually selling, homeowners moving and the estate agent getting paid.
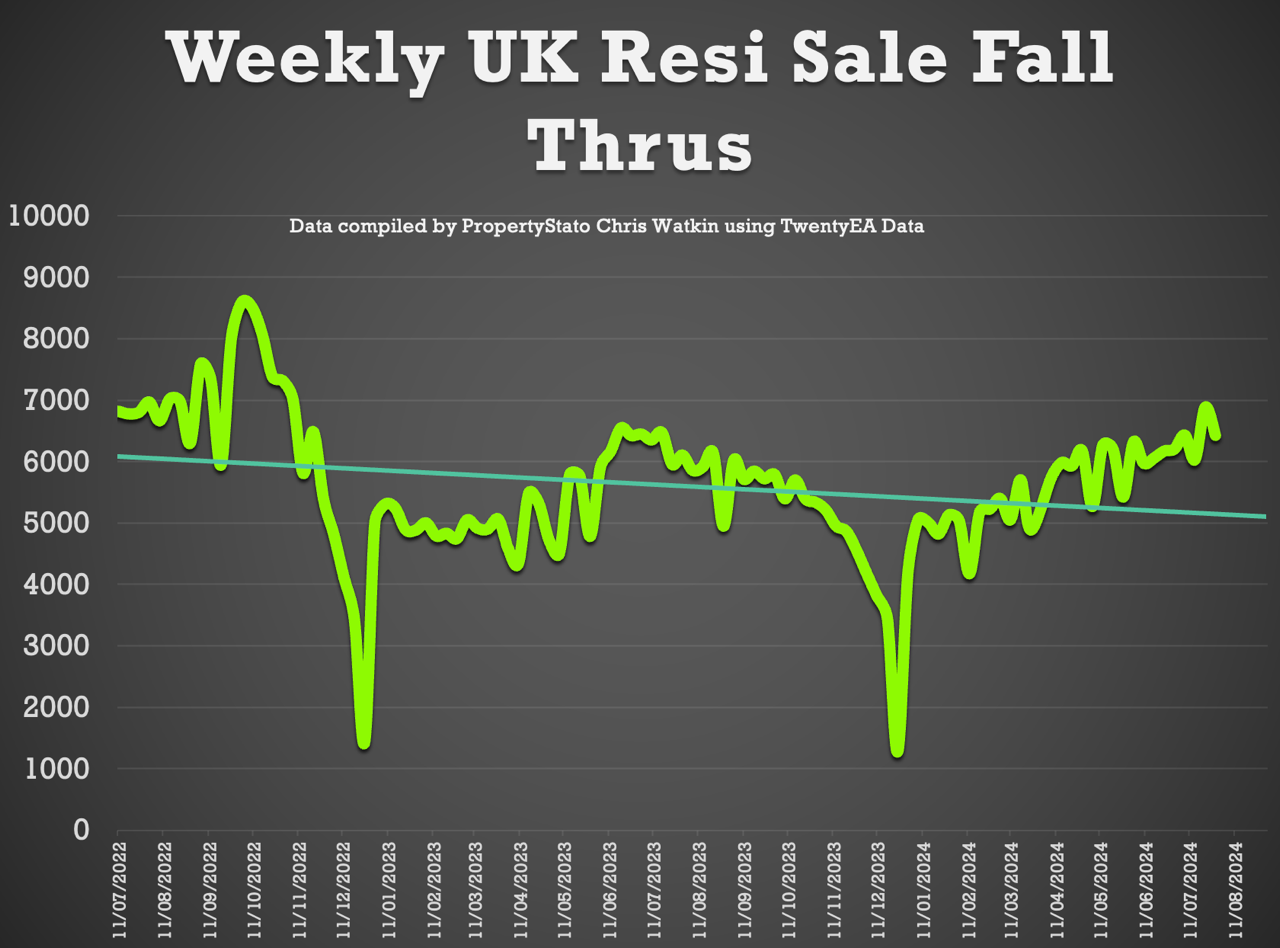
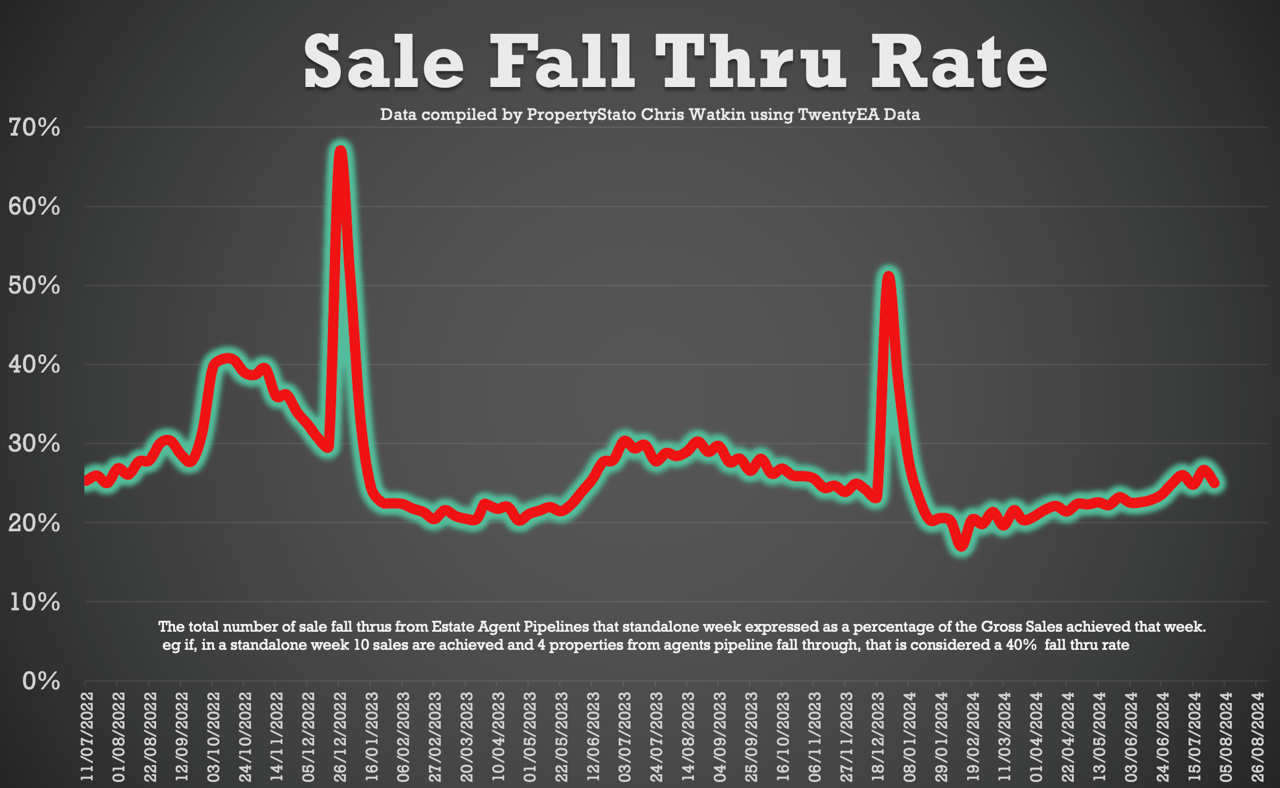
+ Sale fall-throughs – sale fall throughs (as a % of gross sales agreed) dipped to 25% this week (from 26.7% last week) – yet, everything always in context, the seven-year long term average is 24.2% and it was 40%+ in the Truss Budget.
Chris’s In-Depth Analysis (Week 31) :
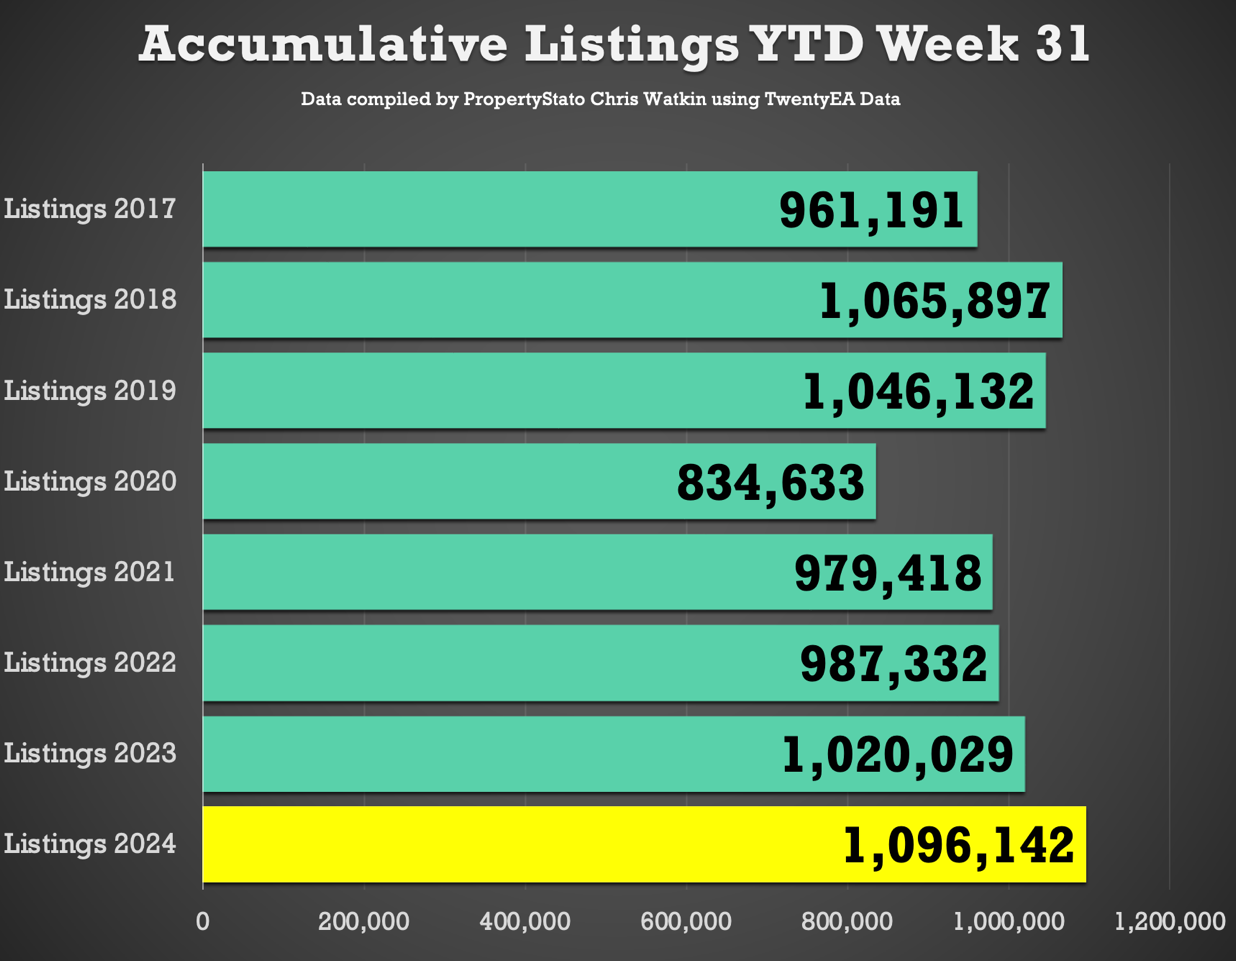
+ New Properties to Market: The UK saw 35,115 new listings, which is around 10% to 12% higher than expected (see the listing graphs). This year’s YTD listings stand at 1,096,142, 9.7% higher than the historical eight-year YTD average of 1,024,407, 7% higher than YTD 2017/18/19 and 7.5% higher YTD 2023. Just FYI – weekly 2024 average: 35,359.
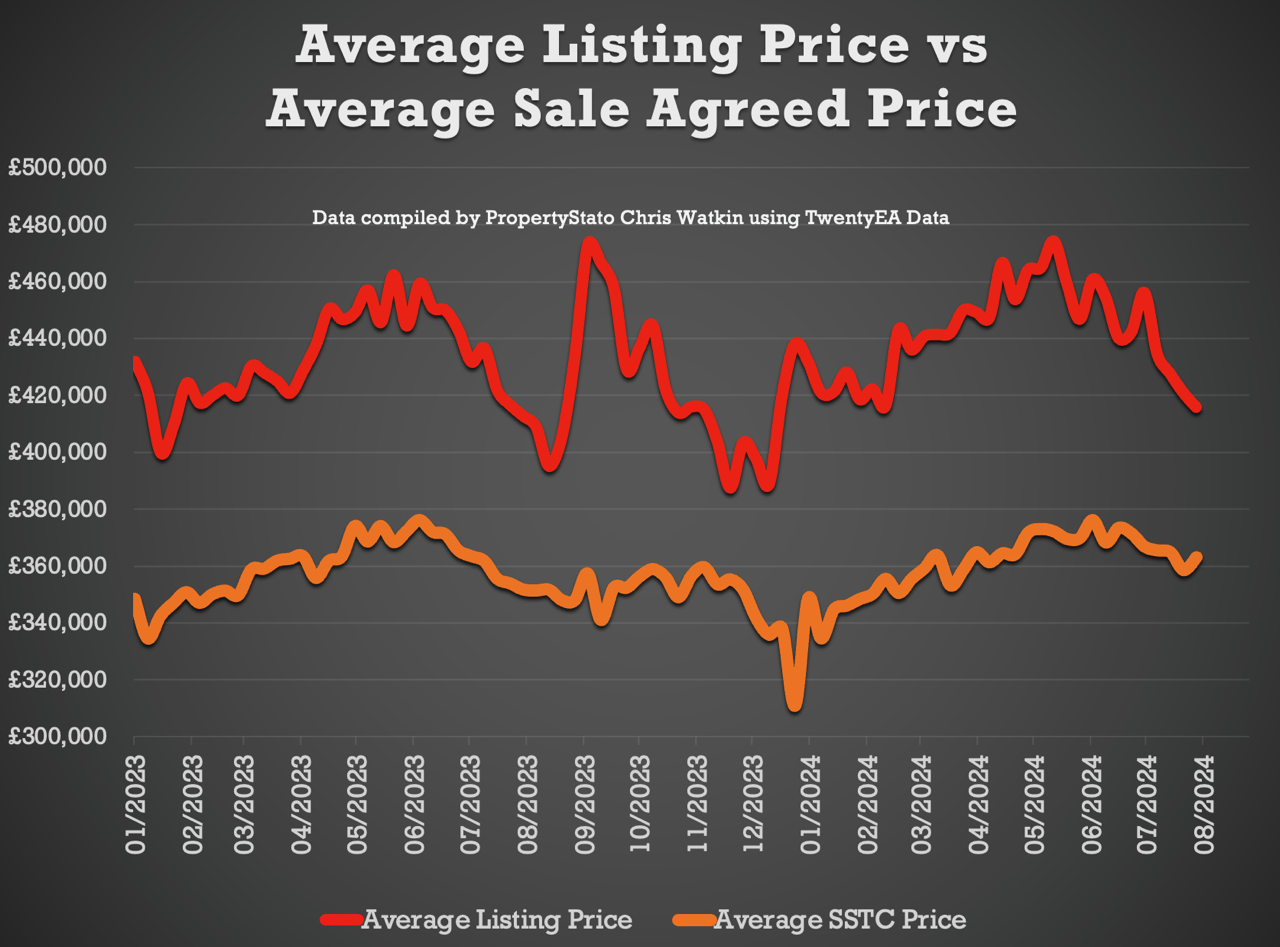
+ Average Listing Price: £415,698 (2024 weekly average – £441,388).
+ Average Asking Price of this week’s Listings vs Average Asking Price of the Properties that Sale Agreed this week: 14.5%. Good to see it’s not been the 20%’s for a few weeks. The long-term eight-year average is between 16% and 17%. (Weekly 2024 average 22.3%).
+ Price Reductions: This week, 22,172 properties saw price reductions, higher compared to the eight-year Week 31 average of 17,747. Yet there are higher stock levels. Stock end of month June 2024 (latest data) levels are at 700,524. This means one in 7.45 properties each month are being reduced. Is that enough?
+ Average Asking Price for Reduced Properties: £389,210 (2024 weekly average – £399,240).
+ Gross Sales: 25,699 properties were sold STC last week, similar to last week and 2024 weekly average: 24,730 Gross Sales. Looking at the graph – is it a mini Starmer surge in sales?
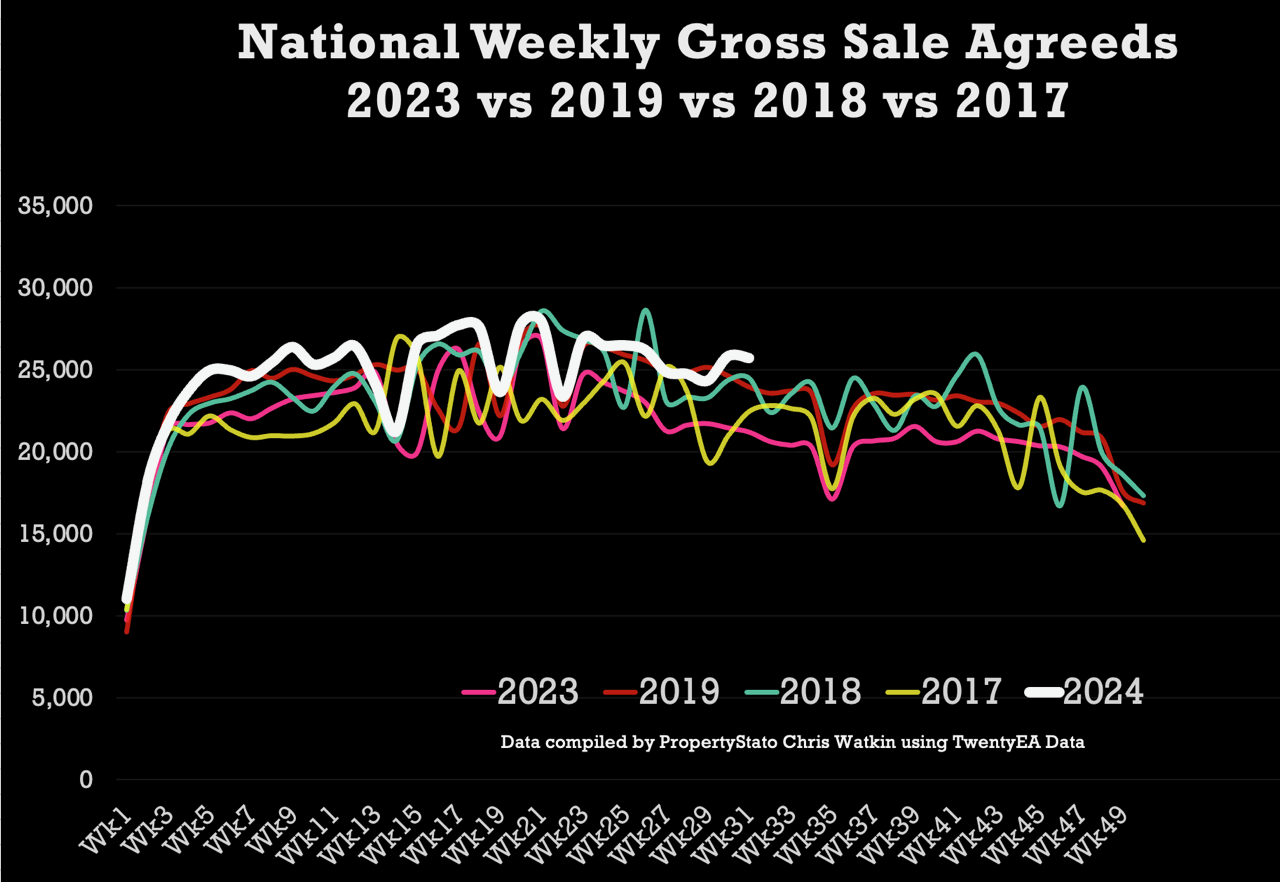
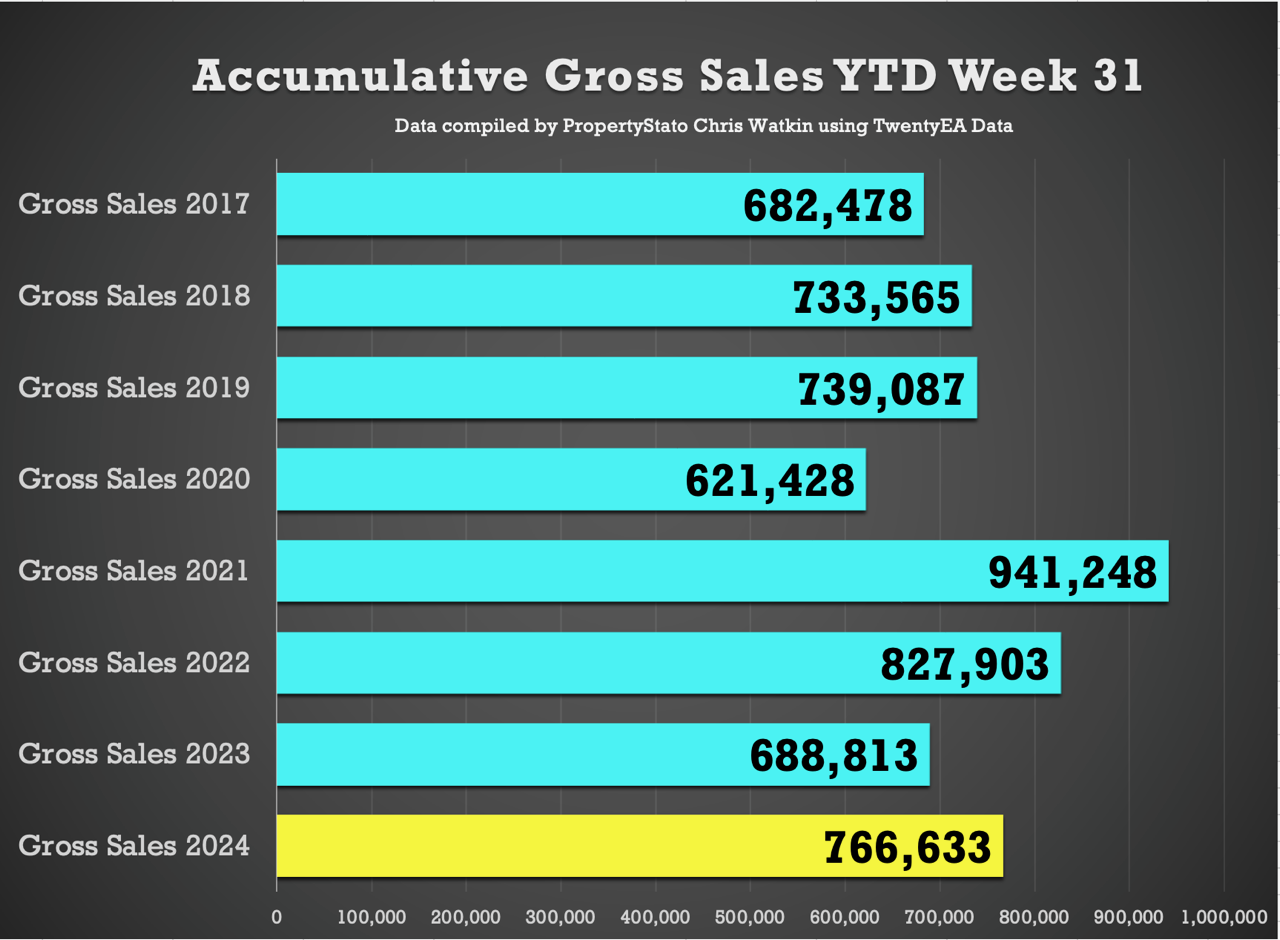
+ Accumulative Gross Sales YTD: the total YTD stands at 766,633, exceeding the average YTD Gross Sales figure of 718,377 from 2017/18/19 and 688,813 in the same week 31 in 2023.
+ Average Asking Price of Sold STC Properties: Still staying in the £350/370k’s range (like has been for 2 years) at £363,013.
+ Sale Fall Throughs: Fall thrus this week at 6,425 – a decent 6.7% drop from last. Last three months weekly average 6,126 and 2024 YTD weekly average is 5,582.
+ Sale Fall Through % Rate: 25.0% for week 31. (Comparison – 23.8% for the last three months, whilst the long term eight years average is 24.2% and it was 40%+ in Q4 2022 – the Truss budget!).
+ Net Sales (Gross Sales this week less fall throughs this week) – 19,274.
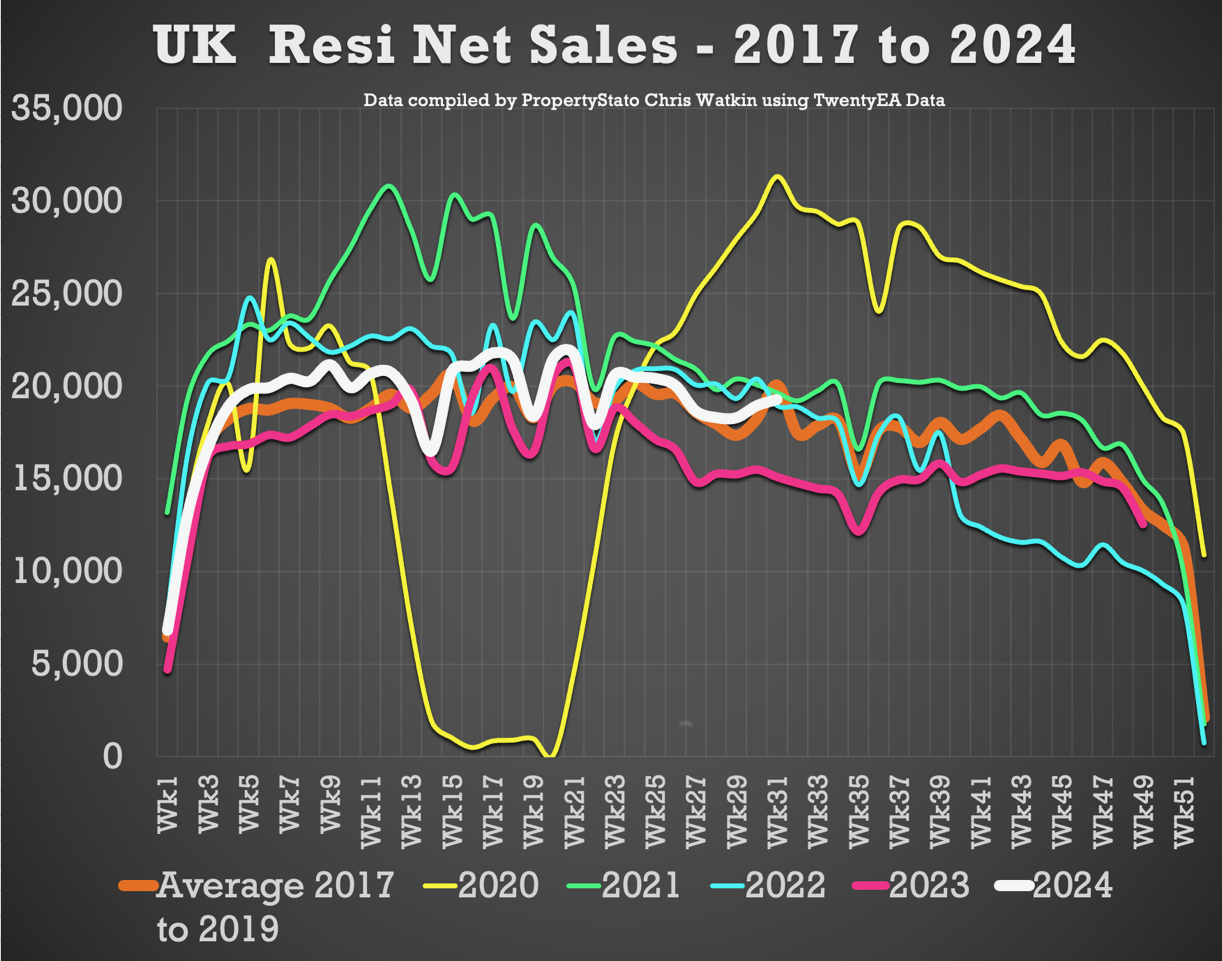
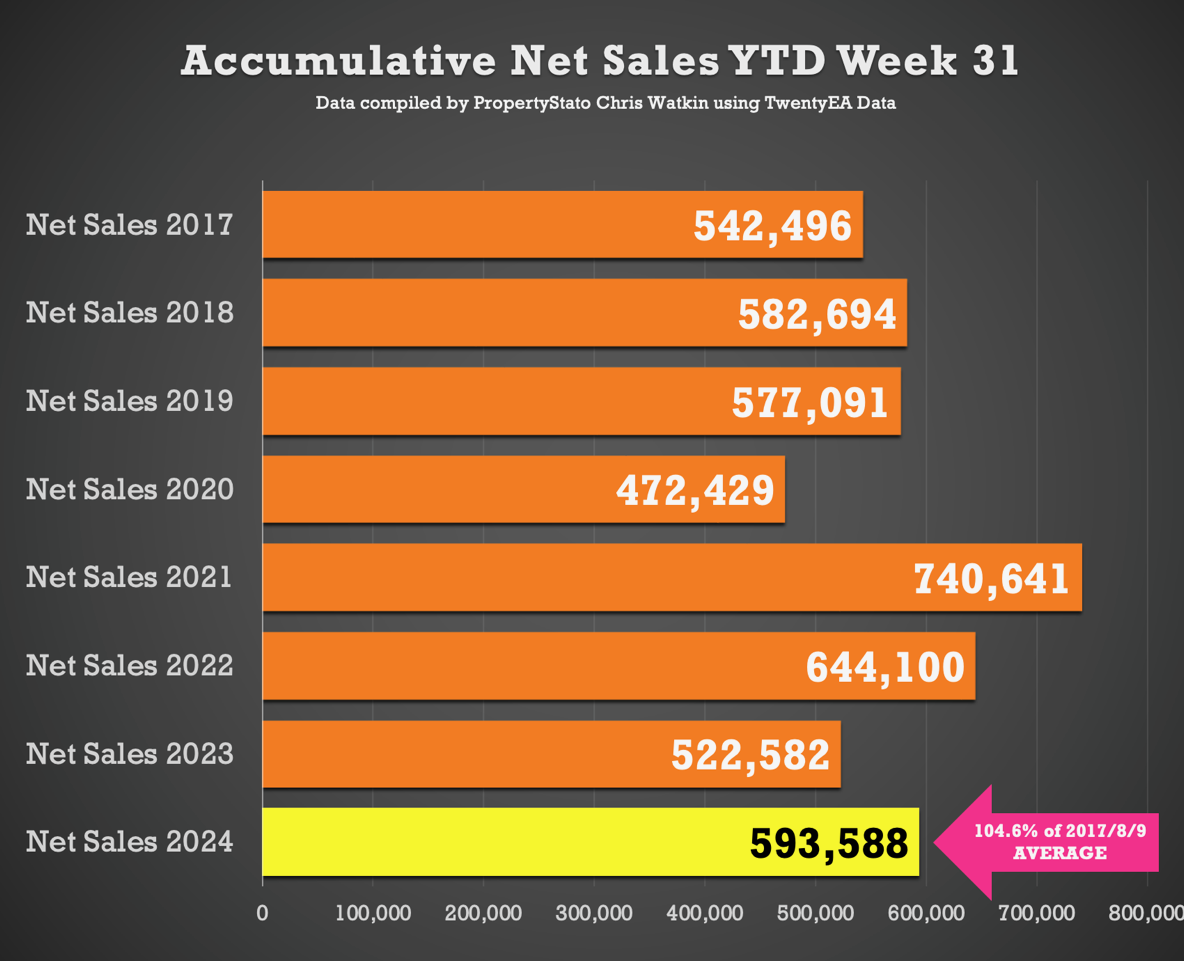
+ Accumulative Net Sales YTD: The total stands at 593,588, 4.6% higher the 17/18/19 YTD Net sales average (567,427) and 13.6% higher than the YTD figure for 2023 for Net Sales (522,582).
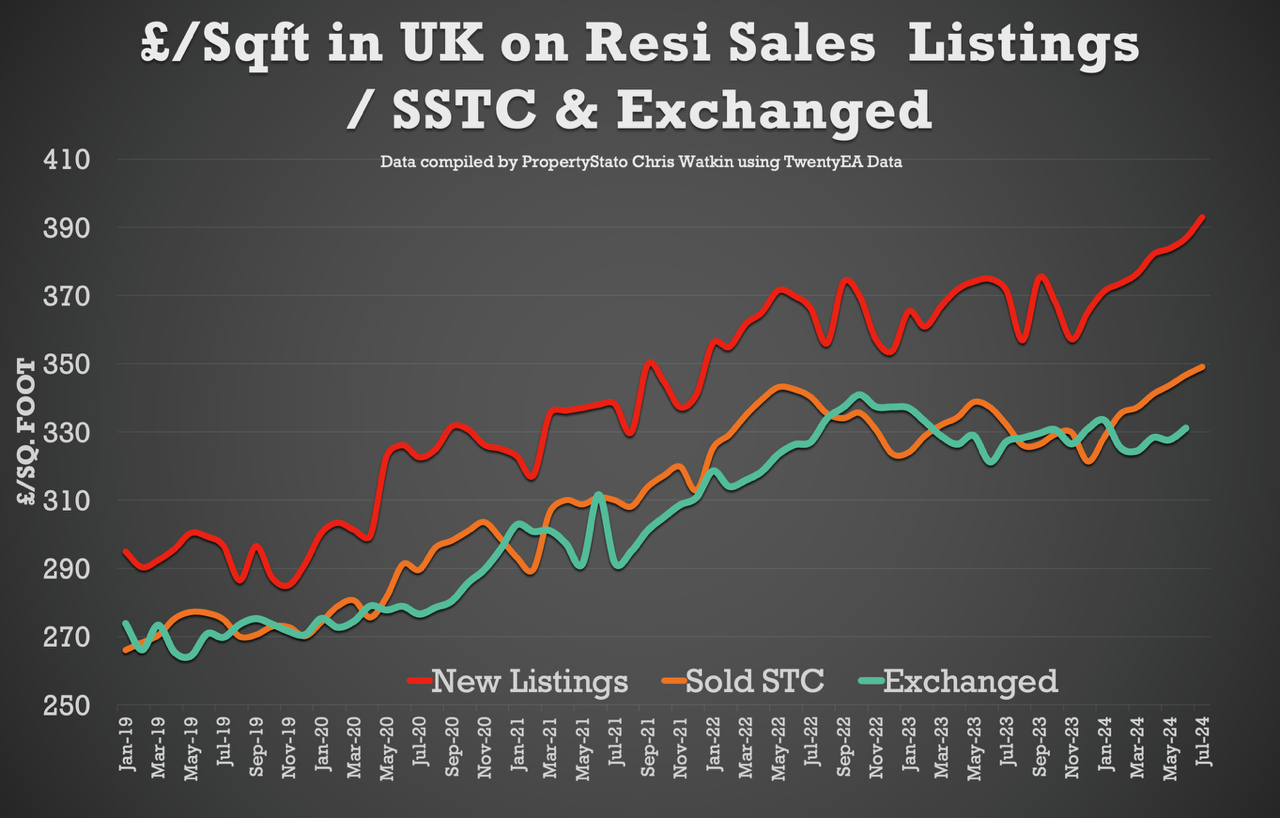
+ House Prices on the House Sales Agreed (SSTC) in July was £348/sq.ft. For comparison, June was £347/sq.ft, May 24 in £343/sq.ft, April 24 – £341/sq.ft, March 24 – £337/sq.ft, Feb 24 -£335/sq.ft & Jan 24 to £328/sq.ft). As discussed in the Show, the £/sq.ft at sale agreed predicts the Land Registry index five to six months in advance with a 92% correlation.
This week’s local focus is on Maidenhead.
Why is there a trend line on sales falling through? That’s the stats equivalent of Whaley dancing round his kitchen in a mankini and a pixie hat, lip syncing to ‘it’s raining men’- random and very unexpected
You must be logged in to like or dislike this comments.
Click to login
Don't have an account? Click here to register
DUH
lack of confidence
lack of urgency
buyers market
who is whaley anyway
You must be logged in to like or dislike this comments.
Click to login
Don't have an account? Click here to register
Why don’t you think there should be a trend line Robert?
You must be logged in to like or dislike this comments.
Click to login
Don't have an account? Click here to register
I’m not here to tell you the answer to that Chris. you stuck it on there either to lift a bland graph or you had a reason.
Given the obviousness of sales falling through, the logic behind that particular statistic, its just a very curious thing to do.
Just as I wonder why Simon is dancing in a mankini and a pixie hat I’m curious why you stuck a trendline that particular graph. Its down to you to educate the class who don’t understand your lesson. You’re the teacher I’m the thick kid
You must be logged in to like or dislike this comments.
Click to login
Don't have an account? Click here to register
You certainly are NOT thick Robert, and I am no teacher either.You ask why I put the trend line? I put the linear trendline in to show if fall thru rate is increasing or decreasing (because of its eractic nature) Dont you think adds anything to the party?
You must be logged in to like or dislike this comments.
Click to login
Don't have an account? Click here to register
Unlike other tend lines, which are valid to identify long term trends, sales falling through is as erratic as Simon on a Saturday. As a consequence of a general fall in transactions the volume of sales falling through will follow the tend but then be influenced by events that defy a trend.
You must be logged in to like or dislike this comments.
Click to login
Don't have an account? Click here to register